handbook of inventory methods and standard protocols...
TRANSCRIPT

Handbook of Inventory Methods and Standard Protocols for Surveying Bats in Alberta Developed by: Alberta Fish and Wildlife Division Edmonton, Alberta Prepared by: Maarten Vonhof Echo Biological Consulting Inc. 1610 2A Street N.W. Calgary, Alberta T2M 2X4

Handbook of Inventory Methods and Standard Protocols
ii
Preface
The Order Chiroptera, bats in more common terms, are an integral component of all major ecosystems in Alberta. For many years they were maligned as dark, winged creatures of the night spreading fear and pestilence. We now recognize them as ravenous consumers of night-flying insects and a critical part of the intricate web of life. In Alberta, they are found from the prairies in the south to the boreal forests in the north, from Saskatchewan to British Columbia, and all parts in between. High mountain tops devoid of flying insects are about the only place where these aerial acrobats do not occur. As the only natural nocturnal predator of insects, they fill the void left in space while the swallows, flycatchers, and phoebes sleep the night away.
Despite their critical role as predators of insects and recyclers of nutrients, information specific to appropriate management and conservation of bats is often lacking. The Handbook of Inventory Methods and Standard Protocols for Surveying Bats in Alberta was developed by Alberta Fish and Wildlife Division, Alberta Sustainable Resource Development (formerly Natural Resources Service, Alberta Environment) in order to solicit consistent information from field programs. It is based on protocols developed by the British Columbia Resources Inventory Committee (http://www.for.gov.bc.ca/ric/pubs/tebiodiv/bats/index.htm).
The document has three components:
• Handbook of Inventory Methods: provides background information and review of current methods used to assess bat population size and activity (including strengths and weaknesses of the methods).
• Standard Protocols for Surveying Bats in Alberta: provides specific guidelines for conducting bat inventory programs in Alberta.
• Standard Data Sheets: provides various data forms for reporting complete and consistent records of field activities.
Inventory methods are presented at three levels of intensity: presence/not detected, relative abundance, and absolute abundance. All elements of design and implementation of bat inventory programs are covered in a step-wise hierarchy.
The goal of this document is to encourage consistency among field programs of bat inventory throughout Alberta. Data should be entered into the Fish and Wildlife Management Information System (FWMIS). The information will then be available for making land use decisions that may affect the conservation of bats throughout the province. Anyone planning to handle bats must obtain a permit from the Alberta Fish and Wildlife Division (http://www.srd.gov.ab.ca/fw/guidres/respermapp.html).
THIS DOCUMENT IS NOT DESIGNED TO PROVIDE GUIDANCE FOR PEOPLE LACKING BAT EXPERIENCE; EXPERIENCE WITH BAT SURVEYS IS REQUIRED PRIOR TO CONDUCTING FIELD WORK.
For further information, please contact the Fish and Wildlife Division, 2nd floor, 9915 108 Street, Edmonton, T5K 2G8 (780--427-5185) or www.gov.ab.ca/srd/fw/bats/index.html.

Handbook of Inventory Methods and Standard Protocols
iii
Acknowledgments
Funding for the development of this manual was provided by Alberta Environment, Natural Resource Service and the Alberta Sports, Recreation, Parks and Wildlife Foundation, with logistical support from the Alberta Conservation Association. The British Columbia Resources Inventory Committee kindly provided permission to use and modify their manuals for use in Alberta. The contributions of bat specialists R. M. R. Barclay, M. R. Brigham, P. Garcia, S. Grindal, S. L. Holroyd, and D. Thomas to the original document, and editing and comments by members of the Alberta Bat Action Team are gratefully acknowledged.
Cover illustration by Brian Huffman

Handbook of Inventory Methods and Standard Protocols
iv
Table of Contents
Preface....................................................................................................................................... ii
Acknowledgments.................................................................................................................... iii
1. Handbook of Inventory Methods ...........................................................................................1
1.1. Introduction.....................................................................................................................1
1.2. Standard Survey Design Hierarchy.................................................................................3
1.2.1. Project ......................................................................................................................3
1.2.2. Survey ......................................................................................................................3
1.2.3. Study Area ...............................................................................................................3
1.2.4. Study Site .................................................................................................................4
1.2.5. Stratification.............................................................................................................4
1.2.6. Design Components .................................................................................................4
1.2.6.1. Stations as Design Components ........................................................................5
1.2.6.2. Transects as Design Components......................................................................5
1.2.6.3. Habitat Features as Design Components...........................................................5
1.2.7. Observations ............................................................................................................6
1.3. General Considerations for Surveys ...............................................................................8
1.3.1. Specific Considerations for Surveys ......................................................................10
1.3.1.1. Time of Year ...................................................................................................10
1.3.1.2. Time of Day ....................................................................................................10
1.3.1.3. Environmental Conditions ..............................................................................10
1.3.1.4. Habitat Description .........................................................................................11
1.3.1.5. Standard Data Sheets ......................................................................................11
1.4. Presence/Not detected & Relative Abundance .............................................................11
1.4.1. Capture...................................................................................................................12

Handbook of Inventory Methods and Standard Protocols
v
1.4.1.1. Mistnetting Equipment....................................................................................12
1.4.1.2. General Considerations when Using Mistnets ................................................12
1.4.1.3. Harp Trapping Equipment ..............................................................................13
1.4.1.4. General Considerations when Using Harp Traps............................................14
1.4.1.5. Mistnet and Harp Trap Placement...................................................................14
1.4.1.6. Morphometric Measurements, Sex, Age, & Reproductive Assessment .........19
1.4.2. Detection ................................................................................................................21
1.4.2.1. Ultrasonic Detection Equipment .....................................................................23
1.4.2.2. Species Recognition Using Bat Detectors.......................................................26
1.4.2.3. Reference Recordings .....................................................................................29
1.5. Absolute Abundance.....................................................................................................29
1.5.1. Roost counts...........................................................................................................29
1.5.1.1. Radio Telemetry..............................................................................................30
2. Standard Protocols ...............................................................................................................32
2.1. Protocol: Presence/Not detected & Relative Abundance..............................................32
2.1.1. Office procedures...................................................................................................32
2.1.2. Sampling design.....................................................................................................32
2.1.3. Review of Study Design Hierarchy .......................................................................32
2.1.3.1. Capture............................................................................................................32
2.1.3.2. Ultrasonic Detection .......................................................................................33
2.1.4. Sampling effort ......................................................................................................34
2.1.5. Personnel................................................................................................................34
2.1.6. Equipment ..............................................................................................................34
2.1.6.1. General ............................................................................................................34
2.1.6.2. Capture............................................................................................................35
2.1.6.3. Manual Ultrasonic Detection ..........................................................................35

Handbook of Inventory Methods and Standard Protocols
vi
2.1.6.4. Remote Ultrasonic Detection ..........................................................................35
2.1.6.5. Recording Reference Calls..............................................................................35
2.1.7. Preliminary fieldwork ............................................................................................35
2.1.8. Field Procedures.....................................................................................................36
2.1.8.1. Capture............................................................................................................36
2.1.8.2. Ultrasonic Detection .......................................................................................37
2.1.8.3. Recording Reference Calls..............................................................................38
2.1.9. Data analysis ..........................................................................................................39
2.2. Protocol: Absolute Abundance .....................................................................................39
2.2.1. Office procedures...................................................................................................39
2.2.2. Sampling design.....................................................................................................39
2.2.3. Sampling effort ......................................................................................................40
2.2.4. Personnel................................................................................................................40
2.2.5. Equipment ..............................................................................................................40
2.2.5.1. Roost Count ....................................................................................................40
2.2.5.2. Radio-telemetry...............................................................................................40
2.2.6. Preliminary fieldwork ............................................................................................41
2.2.7. Field procedures.....................................................................................................41
2.2.8. Data analysis ..........................................................................................................42
Glossary ...................................................................................................................................43
Literature Cited ........................................................................................................................46
Appendix 1 (Alberta Bat Key). ................................................................................................51
Appendix 2 (Alberta Bat Characteristics) ................................................................................52
Appendix 3 (Suppliers of Equipment) .....................................................................................53
Appendix 4 (Tissue sampling protocol for genetic study of bats)…………………………….61
Appendix 5 (Bats and Wind Turbines. Pre-siting and pre-construction survey protocols.)……. [provided as separate document]

Handbook of Inventory Methods and Standard Protocols
vii
List of Figures
Figure 1. Example inventory survey design hierarchy. .............................................................7
Figure 2. Mistnet components and dimensions........................................................................13
Figure 3. Harp trap design and detail. (design from Tuttle 1974, drawn by Tom Swearingen). ............................................................................................................................14
Figure 4. Example of mistnet placement. Note that the mistnet is placed in the vegetation such that a potential flight corridor is covered by the net (from Kunz and Kurta 1988). ........16
Figure 5. Example of multiple mistnet configurations and alternative pole uses (from Kunz and Kurta 1988)..............................................................................................................17
Figure 6. Examples of harp trap placement. (from Kunz and Kurta 1988)..............................18
Figure 7. External topography of a vespertilionid bat and standard measurements (from van Zyll de Jong 1985). ...........................................................................................................20
Figure 8. Finger joint of (a) juvenile (tapered, and epiphyseal plates should be visible with the aid of a flashlight illuminating the wing) and (b) adult (knobby and opaque) (from Nagorsen and Brigham 1993). .......................................................................................21
Figure 9. Examples of sonograms (frequency vs. time) of search-phase echolocation calls for the nine species of bats in Alberta......................................................................................22
Figure 10. A graphic portrayal of the timing of echolocation calls during the search, approach, and terminal (feeding buzz) phases just prior to contact with a prey item (modified from van Zyll de Jong 1985). ..................................................................................22

Handbook of Inventory Methods and Standard Protocols
viii
List of Tables
Table 1. Species of bat found in Alberta and relevant natural history (information from van Zyll de Jong 1985, Nagorsen and Brigham 1993). ................................................2
Table 2. Recommended combinations of techniques to assess presence/not detected, relative abundance, and absolute abundance of bats.....................................................8
Table 3. Types of inventory surveys, the data sheets needed, and the level of intensity of the survey....................................................................................................................11

Standard Bat Survey Protocols 1
1. Handbook of Inventory Methods
1.1. Introduction
Alberta is home to nine of the 20 species of bats found in Canada, all of which belong to the family Vespertilionidae (van Zyll de Jong 1985; refer to Table 1). The province’s bat fauna includes the largest bat in Canada, the hoary bat (Lasiurus cinereus) and one of the smallest bats, the western small-footed bat (Myotis ciliolabrum). As the only major night-time predators of insects, including both agricultural and forest pest species, bats fill an important niche. Furthermore, bat populations number in the millions, if not tens of millions, outnumbering most other types of mammals, with the exception of rodents. Bats are found in all of the province’s diverse range of landforms and habitat types, from the prairies to the mountains to the boreal forest, and across this range of ecosystems, exhibit a wide range of habitat associations, behaviours, as well as roosting and foraging strategies. Several species reach the northern extent of their range within Alberta, and their peripheral distribution may have important implications for their biology and conservation. Thus, the nine bat species in Alberta are an important component of the province’s biodiversity, and worthy of both further study and conservation efforts. Data on the biology, natural history, and distribution, including range maps, of the nine species of bats found in Alberta can be found in van Zyll de Jong (1985), Nagorsen and Brigham (1993), and Smith (1993), and updated range maps are on the website. Table 1 summarizes relevant background biology for each of these species.
Bats have been the subject of relatively few studies because of their nocturnal nature and their ability to fly, and consequently our knowledge of them lags behind that of other more conspicuous mammals. As a result, for many bat species, little is known about such basic aspects of biology as the timing and nature of reproduction, the requirements and mechanisms for overwintering, and the use and selection of critical habitats. We don’t know where most species hibernate and what sort of habitat requirements they have during this time. Our knowledge of summer roosts is similarly limited, and roost-sites used by the majority of species have not been identified. Only in recent years have we begun to learn of some species’ reliance on, and interaction with, forest habitats (e.g., Barclay and Brigham 1996), in spite of the fact that all but one of the species in Alberta depend on forested ecosystems to some extent for their roosting and foraging needs. Anthropogenic disturbance in the form of oil and gas, forestry, and agricultural development currently affects habitats used by bats across the province, and studies on their distribution, relative abundance, and foraging and roosting habitat requirements are urgently needed.
Bats often aggregate in colonies, are usually non-territorial, and are highly mobile (due to their ability to fly), and therefore their distribution tends to be very patchy in space. Many techniques and sampling protocols used to assess habitat use or abundance for other animals are therefore inappropriate for bats. The purpose of this manual is to provide a standardized sampling protocol for assessing community composition and relative abundance of the nine species of bats found in Alberta, and to inform the reader about the mechanics and limitations of the techniques commonly used in the study of bats. For people planning to conduct bat surveys, experience with handling bats is required before initiating field work because of the difficulties associated with surveying techniques and bat species identification. The goal is to ensure that all studies on bats in Alberta collect the same types of information in standard formats, and that the scope, objectives, components, timing, geographic locations, participants, and funding sources for each study are clearly identified. In turn, this will promote centralized tracking of bat studies in the province to identify information gaps, facilitate monitoring of bat distributions and population trends using a centralized database, promote information-sharing between projects, and enable between-project and between-year comparisons. The results will provide a firmer foundation for future decisions concerning the conservation and management of bat populations throughout the province.

Handbook of Inventory Methods 2
Table 1. Species of bat found in Alberta and relevant natural history (status information from Alberta Sustainable Resource Development 2000; van Zyll de Jong 1985, Nagorsen and Brigham 1993.)
Species Provincial Status Listing
Over-winter
Strategy
Summer Roost Type
Summer Roosting Strategy
Big Brown Bat (Eptesicus fuscus)
Secure Hibernates Buildings, Tree Cavities, Rock Crevices
Colonial
Eastern Red Bat (Lasiurus borealis)
Accidental/
Vagrant
Migrates Foliage Solitary
Hoary Bat (Lasiurus cinereus)
Secure Migrates Foliage Solitary
Silver-haired Bat (Lasionycteris noctivagans)
Secure Migrates
Tree Cavities Colonial
Western Small-footed Myotis (Myotis ciliolabrum)
Sensitive Hibernates Rock Crevices Solitary or Colonial
Western Long-eared Myotis (Myotis evotis)
Unknown Hibernates Buildings, Tree Cavities, Rock Crevices
Solitary or Colonial
Little Brown Myotis (Myotis lucifugus)
Secure Hibernates Buildings, Tree Cavities, Rock Crevices
Colonial
Northern Long-eared Myotis (Myotis septentrionalis)
May be at risk Hibernates Tree Cavities Colonial
Long-legged Myotis (Myotis volans)
Undetermined Hibernates Tree Cavities, Rock Crevices
Colonial

Handbook of Inventory Methods 3
1.2. Standard Survey Design Hierarchy
To ensure that all studies of bats in Alberta collect the same types of information in the same formats, it is necessary to have a standard yet flexible framework into which these studies can fit. The survey design hierarchy laid out in the following sections is fundamental to all studies, from simple, single-year studies at one location to broad, multi-year projects with multiple components or multiple locations. Knowledge of this hierarchy will greatly aid project leaders in understanding how the data sheets included with this manual are to be used, and how data will be entered into the data collection system. Figure 1 clarifies certain terminology used within this manual (also found in the glossary), and illustrates the appropriate conceptual framework for detection and capture surveys for bats.
1.2.1. Project
The first level of the hierarchy is the project. A Project possesses a boundary which is generally delineated by a proponent based on some environmental concern. As a result, Project boundaries are frequently more politically than ecologically relevant, acting as the area to which the results of an inventory are applied or extrapolated. A Project is simply a way of grouping together surveys which belong together because they may be repeated censuses of the same population, share a common geography for focal taxon, or share common objectives. Each Project may occur over a period of years, and may be composed of a number of surveys, each with different focal taxa, objectives, start and end dates, systems of stratification and/or Study Areas. For example, a Project may consist of surveys of the same general area over multiple years, a single area in one year only, or may encompass surveys for bats in distinct geographic locations by separate field crews within the same season. Information about a project, such as a project team, funding source, and start/end date must be recorded on one Project Description Form. Only one of these forms is required for each Project.
1.2.2. Survey
A Survey is the application of one census method to a group of species for a meaningful period of time. The survey duration is the amount of time it takes to complete the census for a relevant period of time, such as one season or one year (e.g., one day is generally too short and two years is generally too long). If appropriate, a Survey may encompass numerous capture (trap) sessions and may span numerous Study Areas. As mentioned in Section 1.2.1 above, several Surveys may constitute a single project if the Surveys are in a common area in different years or have the same overall objectives. For example, Bats of Elk Island National Park 1998 and Bats of Elk Island National Park 1999 are Surveys within an overall Project to determine bat species presence and abundance in Elk Island National Park. Similarly, separate Surveys in 1999 of prairie and mountainous regions may form a Project examining bat abundance and diversity in southern Alberta. Information about a Survey, such as survey type, objectives, crew members, Study Areas, duration of sample sessions, and stratification scheme must be recorded on a Survey Description Form. Only one of these forms is required for each Survey.
1.2.3. Study Area
Study Areas are defined units within the project boundary where sampling actually takes place. Generally, Study Areas should be representative of Project Areas if conclusions are to be extrapolated. Thus, surveys which utilize stratification of Study Areas to place sample units should ensure that Habitats within Study Areas are representative of those within the Project Area (Stratification is discussed further

Handbook of Inventory Methods 4
under Section 1.2.5). Not every Project will utilize smaller Study Areas within a Project boundary, and consequently, certain Projects will have only one Study Area that follows the Project boundary. For example, Bats of Elk Island N. P. will contain only one study area: the park itself. However, a Survey of the Bats of Central Alberta may contain numerous Study Areas, including Elk Island N. P., the Cooking Lake – Blackfoot Recreation Area, Miquelon Lakes P.P., Sir Winston Churchill P.P., and Lesser Slave Lake P.P. Study Areas may also be shared between surveys within the same project (e.g., if Surveys of the same Study Areas are conducted in different years). The name and UTM at the centre of each Study Area is recorded on the Survey Description form (see above).
1.2.4. Study Site
Study Areas may be broken down into one or more Study Sites which can be visited on a particular night. For example, within the Elk Island N. P. Study Area, several Study Sites may be visited on particular nights over the course of the Survey, including Tawayik Lake, Moss Lake, Beaver Pond, and Astotin Lake south shore. Each Study Site will consist of one or more Design Components (see section 1.2.6), including Capture Stations (mistnets or harp traps), Detector Stations or Transects, and/or Habitat Features, such as Roosts. At a given Study Site on a given night, one or many of the different Design Components will be utilized.
1.2.5. Stratification
Each Study Area may be divided into distinct Habitats if appropriate. Habitats will generally include natural habitat boundaries within the Study Area, and provide a framework to focus effort and minimize variability. Habitats may include existing Ecosite classifications for Alberta (e.g., Archibald et al. 1996, Beckingham and Archibald 1996, Beckingham et al. 1996), as well as other habitat types where bats are likely to occur. By dividing each Study Area into meaningful Habitats, researchers will maximize information by collecting relevant data on the specific habitat types utilized by bats within each Study Area. Lists of relevant Habitats in addition to Ecosite classifications are included in the coding instructions for each data sheet, but different Projects may utilize Habitats not listed if appropriate. All Habitats used within a Survey, including Habitats specific to a particular Project or Survey, are recorded on the Survey Description Form. One or more Study Sites and Design Components (see below) may be placed within a particular Habitat, and, conversely, Study Sites and possibly Design Components may contain more than one Habitat.
1.2.6. Design Components
Design Components are units that are used as the basis for sampling, and may include geometric units, such as points or transects, as well as ecological units, such as caves or colonies. When first introduced to the concept, most people are quick to associate a Design Component with what is traditionally referred to as a statistical sampling unit. However, it is more correct to think of a sampling unit as a special class of Design Component, as the concept of the Design Components also includes the various nested pieces of geometry that are used in designing a survey, but are not necessarily relevant to statistical calculations. For example, an ultrasonic detector survey may utilize fixed detector stations, as well as transects that encompass some or all of the point stations. Both of these are Design Components. The location and type of Design Components used for a survey are recorded on forms that accompany this manual. The locations of Design Components are important as they provide valuable information about where surveyors actually searched, and in many cases, the location of focal species is recorded only by reference to a Design Component.

Handbook of Inventory Methods 5
Below are descriptions of the main Design Components utilized in this manual and the accompanying data sheets:
1.2.6.1. Stations as Design Components
Sampling using stations (also referred to as points) involves the collection of data at one point in space. Stations may be randomly located, or placed systematically at points separated by standardized distances. Generally speaking, stations must be spaced so that no individual is counted twice. Inter-station distance is generally dependent upon a species home range requirements, with smaller distances used for smaller animals and larger distances for larger animals.
Station counts are often preferred to continuous transects in more fine-grained habitats if the identification of the habitat characteristics is an associated objective. This is because habitat data can be more easily collected at a point or station than along a continuous transect, and transects are more likely to cross habitat boundaries than single points. The two most common types of station referred to in this manual are the Capture Station (mistnet or harp trap) and Detector Station.
1.2.6.2. Transects as Design Components
A transect is a linear sample unit, which may or may not have width. Transects can follow predetermined straight lines, roads, contours or drainages, or be randomly placed within Habitats. Species may be sampled continuously along the transect or at fixed points along it. For bat surveys, transects will only be useful for bat detection, as mistnets or harp traps can only be placed in fixed locations.
An encounter transect is a survey area in the form of a long continuous line along which observed species are counted continuously or at fixed points, regardless of the distance from the line. These transects are usually used to provide species community composition and general distribution information. Encounter transects are generally used only for presence/not detected surveys because the lack of a measure of area surveyed makes it impossible to estimate population size. However, accurate mapping of the transect location will allow duplication of the survey and may enable calculation of relative abundance such as the number of animals observed per hour or per distance, which is commonly done with ultrasonic detectors.
Surveyors travelling on a fixed-width transect (sometimes also referred to as strip transects) count all species within a fixed distance from the centre line. Transect width is based on the type of habitat, behaviour of the animal(s) and type of transportation being used. Density is estimated as the number of individuals observed on the strip divided by the product of the strip width and transect length. A major problem with the fixed-width transect method is the assumption that all animals within the sample unit are actually counted. Fixed-width transects and associated density estimation are not feasible for bat detection surveys, as bats are generally not visually observed while using ultrasonic detectors, and detection probability may be influenced by habitat type, vegetation structure, and detector type.
1.2.6.3. Habitat Features as Design Components
Area-based methods, such as quadrats, are generally not used in the study of bats, as there is no way of knowing whether all of the bats in an area were captured or detected. Similarly, there is no way of determining whether all roost-sites have been located in studies using radio-telemetry or visual searching within defined geographic boundaries. However, some feature of habitat may be the most logical unit for the basis of sampling in certain cases. In such cases, surveyors are chiefly interested in surveying a known habitat feature, such as a summer roost or hibernaculum, in an effort to determine occupation or to count or estimate the number of individuals using such a feature. Habitat types or large landscape

Handbook of Inventory Methods 6
features are not generally used as Design Components, as these are more appropriate as Study Areas or Habitats.
1.2.7. Observations
An observation is an encounter with the focal taxon or its sign. An observation is made when a surveyor makes a visit to a Design Component on a specific date at a specific time. Each observation should be uniquely labelled, and contain reference to the Project, Survey, Study Area, Study Site, or Design Component, depending on the specific objectives being addressed and the level of information required. Observations are recorded on the standard data sheets which accompany this manual, and may include information on species, sex, age class, activity, and/or measurements, depending on whether the animal is in-hand or roaming free.

Handbook of Inventory Methods 7
at HABITATS at Old Barn Study Site in Cactus Cliffs
DESIGN COMPONENTS Capt. & Detector Stations
OBSERVATIONS
SURVEY
PROJECTMay include multiple Surveysof different species groups overmultiple years. Boundary isgenerally delineated by theproject proponent.
The application of one censusmethod to one taxa groupduring one season. Mustcontain one or more Study Areaswhich are visited at least once.
1.
2.
SHEETS REQUIRED
1. Project Description Sheet (one per project)
3. Observation Sheets a) Bat Detection. Data Sheet b) Bat Capture: Mist-Netting and Harp Trapping. Data Sheet
SHEETS REQUIRED
Green Valley Wildlife Inventory
Project Boundary
2000 Green Valley BatDetection and Capture Survey
Included on Observation Sheets
Habitats are natural habitatunits within a Study Area.Study Sites may contain oneor more Habitats. One or manydifferent Design Components may be
given night.
situated in a given Habitat.
Encounters with the targetedtaxa at each Capture orDetection Station.
Capture and Detection Stationsare placed non-randomly inareas where bats are expectedor in narrow natural corridorswithin each Habitat.
6. SHEETS REQUIRED
STUDY AREAS
Defined geographic units with-in a Project Area wheresurveying takes place. Study Areasmay contain one or more Study Siteswhere sampling takes place on a
3. SHEETS REQUIRED
Listed on Survey Description Sheet
SHEETS REQUIRED
SHEETS REQUIRED
2. Survey Description Sheet (one per Survey)
Listed on Survey Description Sheet
4.
5.
StudyAreas
Tupper Trench
Bighorn Butte
Cactus Cliff
Pine Forest
OldBarn
CaptureStations
Detector Station
M1
M2
H1
BD1
LANO (4) MYLU (6)
MYSE (3) MYEV (1)
EPFU (2)
MYOT Spp. (13) LACI (2)
Rocky Cliffs
Cave Entrance
Trail Through Trees
Natural Narrowing
Fescue
Mist-Net
HarpTrap
Figure 1. Example inventory survey design hierarchy.

Handbook of Inventory Methods 8
1.3. General Considerations for Surveys
Due to their unique biological and ecological features, bats present a challenge to those attempting to survey them. Bats are volant, highly mobile, often colonial, and only active at night. They use different areas at different times of the day or year and tend to be clumped in suitable roost or foraging sites rather than being uniformly or predictably distributed (Thomas and West 1989). Furthermore, they often avoid being trapped repeatedly (Kunz and Kurta 1988). For some species, males and females use different habitats (Barclay 1991). Therefore, the choice of methods used to sample bats at the three survey intensities (presence/not detected, relative abundance, and absolute abundance) will depend upon both the species of bat being examined and the type of question(s) being asked, or data required.
Interspecific differences in flight morphology and echolocation behaviour lead to differences in foraging behaviour and habitats, which in turn affect our ability to capture bats in mistnets or detect them with ultrasonic bat detectors. Therefore, no one technique can adequately sample all bat species present in Alberta, and it is recommended that several techniques be used in combination to obtain presence/not detected and relative abundance data (Table 2). The same general techniques are used to assess both these levels of intensity, and therefore data on species presence and their relative levels of activity can be collected at the same time. Relative abundance of a bat species can be compared between areas or over time, but reliable comparisons between species are not possible, because species differ in their degree of catchability or detectability. No technique currently exists to measure the absolute abundance of bats, except in extremely localized areas such as single roosts (Thomas and LaVal 1988). It is therefore impossible to obtain accurate absolute counts of bats at either the population or habitat level, and even estimates of relative abundance are hard to obtain.
In Alberta, mistnets, harp traps, and ultrasonic bat detectors should be employed to determine presence/not detected and relative abundance of bats, as these methods tend to complement one another. The species that tend to be under-estimated or missed by one method are often sampled by the other method. For example, the presence of certain species may be difficult to determine given their low vulnerability to trapping, indistinct morphology, low intensity echolocation, and/or limited species identification ability based on the current resolution of ultrasonic detectors. With two to three workers, it is quite easy to employ all three methods simultaneously in a study area. However, the emphasis on specific survey methods employed may vary for different survey intensities (Table 2), different objectives, and/or the target species under examination.
Table 2. Recommended combinations of techniques to assess presence/not detected, relative abundance, and absolute abundance of bats.
Survey Intensity Recommended Combination of Techniques
Presence/Not Detected Capture Techniques (Mistnetting; harp trapping) used simultaneously with Ultrasonic Detection.
Relative Abundance Capture Techniques (Mistnetting; harp trapping) used simultaneously with Ultrasonic Detection.
Absolute Abundance Roost counts (emergence or surface area); possibly in conjunction with telemetry (to locate roost).

Handbook of Inventory Methods 9
A number of factors will influence the design and effectiveness of programs designed to sample bats at any intensity level, including:
• In most studies, investigators are limited in the number of sites that can be visited over the 3-4 months of the year that bats are active in Alberta;
• Effectively, only a small number of closely situated Capture or Detection Stations can be attended to by a team of two to three people in one night;
• It may be necessary to repeat sampling several times, and yet not all nights will be suitable for sampling due to the constraints of weather;
• Bat activity tends to vary with ambient air temperature, humidity, lunar phase, and insect availability, all of which change throughout the season;
• The catchability and detectability of bat species differs, complicating the comparison of data among different species and areas.
These various factors require that adequate sample sizes, and repeated sampling of the same study areas (ideally under the same conditions), are necessary to produce an accurate inventory. Therefore, the sampling effort that can be achieved for bats within a project will be more sensitive to variables such as the size of the Project area, the number of Study Areas within it, and the number of nights spent per Study Area than it may be for other animals. The inherent variability requires that biologists planning to survey bats be especially vigilant in their attempts to control these factors whenever possible.
Absolute abundance of bats cannot be determined in most cases, and thus it is difficult to estimate the number of Study Areas or Study Sites that should be established within a Project area, or the length of time that should be spent sampling each one. Therefore, statements regarding adequate sample sizes are difficult to make. Instead, attempts should be made to maximize sampling effort, taking into consideration the goal of the study or survey. For presence/not detected studies, it is recommended that each study area be visited more than once. Limitations of current sampling methods, and the spatial and temporal heterogeneity exhibited by bats, may give an inaccurate representation of species present at a site during any given night. Furthermore, the failure to find evidence for the presence of a species should be viewed with caution as it may reflect the rarity of a species or a sampling artifact, rather than the true absence of that species. The confidence in such results will increase with repeated sampling at the same location. To account for seasonal variation in distribution or abundance, for studies involving larger-scale geographic areas, it is recommended that at least two circuits of the project area be made during the sampling season (i.e. sample at each station, then return and sample all stations again, later in the season). Another potential sampling problem is that some techniques (those using ultrasonic detection) can not allow for precise discrimination among species, only between ‘species groups’ that contain several species which share similar characteristics (Fenton et al. 1983, Thomas and West 1989, Barclay 1999, Obrist et al. 2002).
With these limitations in mind, questions that can presently be addressed by the various sampling methods include:
• What species (or species groups) exist in a given Study Area?
• Which habitat types are being used by bats in a given Study Area?
• Are there relatively more of a given species or species group using one Study Area or Habitat than another?

Handbook of Inventory Methods 10
• Does the relative abundance of a species using a Study Area differ over time?
1.3.1. Specific Considerations for Surveys
In the following sections, a number of specific factors will be discussed that will influence the timing and design of all surveys, regardless of the intensity or specific methods involved.
1.3.1.1. Time of Year
• Sampling should be conducted between the beginning of May and the end of August, depending on latitude and altitude. A more condensed sampling period will occur farther north or at higher elevations. Surveys of exposed diurnal roosts should extend into September.
• The time of year or stage of the reproductive cycle will influence sampling in several ways (Thomas and West 1989):
• During lactation (typically several weeks in June-July), females must make at least one return trip to the maternity roost to nurse their young, before returning to foraging areas to feed (to meet their increased energy demands). This may give the impression of higher levels of bat activity than during other stages of the reproductive cycle, even though there may be no actual change in the number of bats present;
• A real increase in the number of bats present and correspondingly, in the levels of bat activity, will occur when young of the year "fledge" (typically in July or early August) and are recruited into the population. In addition, because males and females have different energetic requirements during the breeding season, they may forage and use different habitats (Barclay 1991). This may result in a bias in relative abundance estimates or a failure to identify critical habitats for a species;
• Bat species normally present in an area during the summer may be absent in early May or late August because they have not yet moved in to the area, or have already moved on to other areas. Similarly, bats present in an area during May and August may not normally reside in that area during the rest of the summer. Hibernating bat species may move 10s or 100s of kilometers to and from hibernacula, and migratory species make much longer movements. Surveys conducted at these times may not provide accurate representations of presence or relative abundance data, and Study Areas or Study Sites visited at these times should also be visited again in the middle of the summer.
1.3.1.2. Time of Day
• Bats are inactive during daylight hours, except in very rare circumstances (e.g., following disturbance or during eclipses) and will only be found in roost sites. For most species, several distinct periods of high activity can be recognized during the night (Thomas and West 1989). The first of these is during roost emergence, when the bats first leave the roost to forage. This usually occurs shortly after dusk, but species roosting in caves or rock crevices tend to emerge later. In general, activity by most species tends to decrease over the course of a night, but a peak in the middle of the night may or may not be observed, and a final increase just prior to dawn as bats return to roost sites usually occurs.
1.3.1.3. Environmental Conditions
• Environmental conditions will also influence bat activity. The presence of precipitation, strong winds or temperatures below 10o C all tend to cause a decrease in levels of bat activity. Therefore, no sampling should be done on nights with heavy precipitation or when the ambient temperature at sunset is below approximately 10o C, as bat activity will be low and sampling unproductive. However,

Handbook of Inventory Methods 11
in areas farther north or at higher elevations where temperatures at sunset are normally lower, bat activity at temperatures below 10° C has been documented regularly (Wilkinson et al. 1995, Vonhof and Wilkinson 1999). Therefore, in these areas, a lower temperature threshold at sunset (e.g., 5 o C) can be used.
• Typically sampling is unsuccessful before snow is gone and local lakes are ice free. • Increased levels of moonlight may tend to decrease capture success. • Moderate to high winds may also influence capture success - blowing mistnets are less likely to
capture bats.
1.3.1.4. Habitat Description
A minimum amount of habitat data must be collected for each survey type. The type and amount of data collected will depend on the scale of the survey, the nature of the focal species, and the objectives of the inventory. A Habitat Description Data Sheet is included with this manual so that standard data may be collected on all habitats sampled. In addition, accompanying data forms provide guidance as to standard description of roosts, whether located in cliffs, caves or mines, buildings, or trees.
1.3.1.5. Standard Data Sheets
To properly standardize data collection and management in the province of Alberta, the standard data sheets accompanying this protocol should be filled out. The following table lists the data sheets required for each survey type and intensity:
Table 3. Types of inventory surveys, the data sheets needed, and the level of intensity of the survey.
Survey Method Forms Required
Any Survey Type
• Project Description Form • Survey Description Form
Mistnetting / Harp Trapping
• Bat Capture Data Sheet: Mistnetting / Harp Trapping • Habitat Description Data Sheet
Bat Detection • Bat Detection Data Sheet • Habitat Description Data Sheet
Roost Count • Roost Count Data Sheet • Roost Description Data Sheet
1.4. Presence/Not detected & Relative Abundance
Surveys to determine the presence/not detected status or relative abundance of bats may require the combination of several methods. For surveys at these intensities, it is recommended that capture (mistnets, harp traps) and ultrasonic detection (bat detectors) methods should be employed simultaneously. The following sections outline the factors and constraints associated with these methods that will influence study design and success, and standardized protocols for surveys using these methods.

Handbook of Inventory Methods 12
1.4.1. Capture
Capturing bats is the primary means of establishing species presence and distribution in a Project area, and is the mainstay of all bat studies. Having bats in hand allows positive species identification (see Appendix 1 for identification key), age and sex determination, the collection of mass and other mensural data, and an assessment of reproductive condition (Anthony 1988, Racey 1988). In addition, capturing bats is the necessary precursor to a variety of other techniques, including radio-telemetry and collecting samples for genetic analyses (see Appendix 4, C. Lausen). However, not all bat species are easily captured, because of their behaviour, morphology, and/or flight patterns, and therefore most capture techniques are biased towards the more easily captured species (see below). Furthermore, all capture techniques involve a significant disturbance to the animals during handling, and every effort must be made to minimize this disturbance.
The two most common methods of capture involve the use of mistnets or harp traps, although several other methods (e.g., hand nets, funnel traps) may be used (see Kunz and Kurta 1988). Many of these other techniques require sampling at or in roost sites, and are not recommended for general surveys because they tend to be disruptive to the bats and are roost-specific. Conservation of bats and critical habitats, as well as minimization of disturbance, must be considered for all potential sampling protocols.
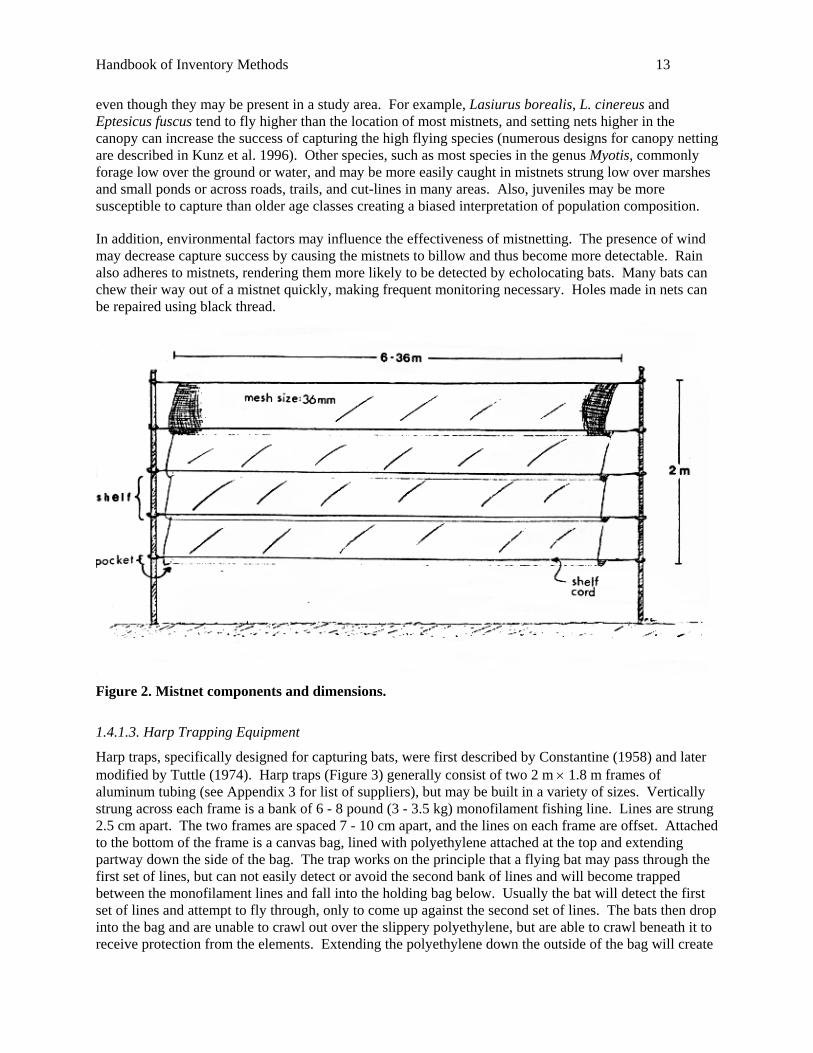
1.4.1.1. Mistnetting Equipment
Mistnets used for capturing bats are usually black, 6 to 36 m in length, 2 - 3 m high, have four shelves, a mesh size of 36 mm and are constructed from 50 or 70 denier/2 ply nylon (Figure 2; Kunz and Kurta 1988; see Appendix 3 for list of suppliers). Unfortunately, because of recent restrictions by the Japanese manufacturers and a Japanese government trade ban on monofilament mistnets, the most effective nets for capturing bats, are no longer available. Nets ≤12 m in length tend to be easier to handle, especially for one person. Poles made of 10 foot lengths of aluminum tubing are often used to support the nets, but a variety of materials may be used. Thin-walled electrical conduit is inexpensive and readily available, and makes excellent mistnet poles, providing the tubing is at least 0.5 inch in diameter. This tubing is typically sold in 10 foot lengths, but can be cut to provide different heights of nets when used in combination with connectors. Connectors (e.g., 20 - 30 cm long solid aluminum shafts that fit the inside diameters of poles) can be made to join lengths of pole to make sections of up to 20 feet. To keep mistnets in place, and/or adjust tension, guy lines can be attached to the poles and anchored to vegetation, rocks, or tent pegs. If weight of equipment is not a concern, poles can also be held up by hammering or pushing a 3 foot long rebar (3/8 inch concrete reinforcements available at any building supply store) into the ground and placing the conduit onto the rebar. Such a placement makes the net stable should one pole have to be lowered, especially when high nets are being used.
1.4.1.2. General Considerations when Using Mistnets
Mistnetting is the most common method used to capture bats (Kunz and Kurta 1988). Catching bats in mistnets depends on careful selection of productive netting sites (i.e. areas of high bat activity), which can be determined by direct observation of bats or by using ultrasonic detectors (see below).
Mistnets are relatively inexpensive, highly portable and easy to use and set up (costs range from approximately $50 for a 2.6m net to $160 for an 18m net). However, they have certain biases associated with them, in terms of which species can be caught, and they require constant monitoring to ensure that bats do not chew their way out, become badly entangled, or cause injury to themselves. Success decreases if a net is set up at the same location on consecutive nights (Kunz and Brock 1975). In addition, certain species are adept at avoiding mistnets or fly at heights that make their capture difficult,
Handbook of Inventory Methods 13
even though they may be present in a study area. For example, Lasiurus borealis, L. cinereus and Eptesicus fuscus tend to fly higher than the location of most mistnets, and setting nets higher in the canopy can increase the success of capturing the high flying species (numerous designs for canopy netting are described in Kunz et al. 1996). Other species, such as most species in the genus Myotis, commonly forage low over the ground or water, and may be more easily caught in mistnets strung low over marshes and small ponds or across roads, trails, and cut-lines in many areas. Also, juveniles may be more susceptible to capture than older age classes creating a biased interpretation of population composition.
In addition, environmental factors may influence the effectiveness of mistnetting. The presence of wind may decrease capture success by causing the mistnets to billow and thus become more detectable. Rain also adheres to mistnets, rendering them more likely to be detected by echolocating bats. Many bats can chew their way out of a mistnet quickly, making frequent monitoring necessary. Holes made in nets can be repaired using black thread.
Figure 2. Mistnet components and dimensions.
1.4.1.3. Harp Trapping Equipment
Harp traps, specifically designed for capturing bats, were first described by Constantine (1958) and later modified by Tuttle (1974). Harp traps (Figure 3) generally consist of two 2 m × 1.8 m frames of aluminum tubing (see Appendix 3 for list of suppliers), but may be built in a variety of sizes. Vertically strung across each frame is a bank of 6 - 8 pound (3 - 3.5 kg) monofilament fishing line. Lines are strung 2.5 cm apart. The two frames are spaced 7 - 10 cm apart, and the lines on each frame are offset. Attached to the bottom of the frame is a canvas bag, lined with polyethylene attached at the top and extending partway down the side of the bag. The trap works on the principle that a flying bat may pass through the first set of lines, but can not easily detect or avoid the second bank of lines and will become trapped between the monofilament lines and fall into the holding bag below. Usually the bat will detect the first set of lines and attempt to fly through, only to come up against the second set of lines. The bats then drop into the bag and are unable to crawl out over the slippery polyethylene, but are able to crawl beneath it to receive protection from the elements. Extending the polyethylene down the outside of the bag will create

Handbook of Inventory Methods 14
a protective barrier from rain. The degree of tension on the lines may have to be increased if bats are able to fly straight through without becoming trapped, or decreased if they simply ‘bounce off’.
1.4.1.4. General Considerations when Using Harp Traps
Unlike mistnets, harp traps may be set up and left unattended. Similar considerations as those for setting mistnets are used for the placement of harp traps (see below). Harp traps may be hoisted off the ground by ropes or positioned outside at entrances to buildings, caves, or mines. As for mistnets, trapping success tends to decrease with each successive night in the same location (Kunz and Anthony 1977).
The major advantages of using harp traps to sample bats are that they are less labour intensive, do not require constant supervision (thus several can be set up per night) and can be used to catch species that tend to avoid mistnets. Disadvantages include the small area sampled by the trap (typically only about 2 m2 as opposed to several times that for each mistnet used), limited portability, which may limit its use to areas accessible by roads, and greater cost (approximately $500 CAN). However, lighter-weight, portable models are available (e.g., Tidemann and Woodside 1978).
Figure 3. Harp trap design and detail (design from Tuttle 1974, drawn by Tom Swearingen).
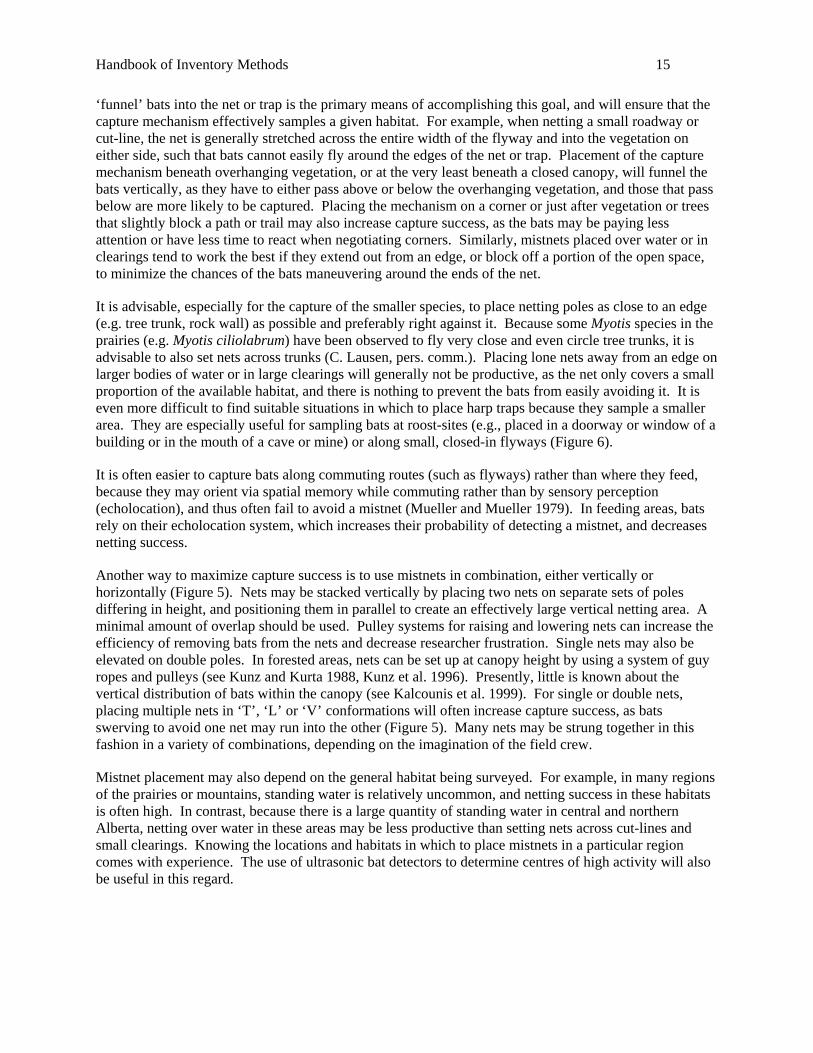
1.4.1.5. Mistnet and Harp Trap Placement
As mentioned previously, the placement of capture mechanisms will have a large influence on capture success. In Canada, common foraging sites and commuting flyways for bats include trails, cut-lines, and small roadways, small forest clearings, along the edges of larger clearings and river valley walls, beneath bridges, and over standing water or small streams. The various bat species use different habitats, and may use different features within those habitats. Therefore, to adequately determine species presence or relative abundance, it is important to place capture mechanisms in a variety of locations within each Study Site and Study Area.
Bats are least likely to detect a net or trap, and are therefore most easily captured, when the capture mechanism is placed perpendicular to their flight-path. When using mistnets and harp traps, the major rule of thumb is to try to block off an area that bats may fly through (Figs. 4-6). Using vegetation to
Handbook of Inventory Methods 15
‘funnel’ bats into the net or trap is the primary means of accomplishing this goal, and will ensure that the capture mechanism effectively samples a given habitat. For example, when netting a small roadway or cut-line, the net is generally stretched across the entire width of the flyway and into the vegetation on either side, such that bats cannot easily fly around the edges of the net or trap. Placement of the capture mechanism beneath overhanging vegetation, or at the very least beneath a closed canopy, will funnel the bats vertically, as they have to either pass above or below the overhanging vegetation, and those that pass below are more likely to be captured. Placing the mechanism on a corner or just after vegetation or trees that slightly block a path or trail may also increase capture success, as the bats may be paying less attention or have less time to react when negotiating corners. Similarly, mistnets placed over water or in clearings tend to work the best if they extend out from an edge, or block off a portion of the open space, to minimize the chances of the bats maneuvering around the ends of the net.
It is advisable, especially for the capture of the smaller species, to place netting poles as close to an edge (e.g. tree trunk, rock wall) as possible and preferably right against it. Because some Myotis species in the prairies (e.g. Myotis ciliolabrum) have been observed to fly very close and even circle tree trunks, it is advisable to also set nets across trunks (C. Lausen, pers. comm.). Placing lone nets away from an edge on larger bodies of water or in large clearings will generally not be productive, as the net only covers a small proportion of the available habitat, and there is nothing to prevent the bats from easily avoiding it. It is even more difficult to find suitable situations in which to place harp traps because they sample a smaller area. They are especially useful for sampling bats at roost-sites (e.g., placed in a doorway or window of a building or in the mouth of a cave or mine) or along small, closed-in flyways (Figure 6).
It is often easier to capture bats along commuting routes (such as flyways) rather than where they feed, because they may orient via spatial memory while commuting rather than by sensory perception (echolocation), and thus often fail to avoid a mistnet (Mueller and Mueller 1979). In feeding areas, bats rely on their echolocation system, which increases their probability of detecting a mistnet, and decreases netting success.
Another way to maximize capture success is to use mistnets in combination, either vertically or horizontally (Figure 5). Nets may be stacked vertically by placing two nets on separate sets of poles differing in height, and positioning them in parallel to create an effectively large vertical netting area. A minimal amount of overlap should be used. Pulley systems for raising and lowering nets can increase the efficiency of removing bats from the nets and decrease researcher frustration. Single nets may also be elevated on double poles. In forested areas, nets can be set up at canopy height by using a system of guy ropes and pulleys (see Kunz and Kurta 1988, Kunz et al. 1996). Presently, little is known about the vertical distribution of bats within the canopy (see Kalcounis et al. 1999). For single or double nets, placing multiple nets in ‘T’, ‘L’ or ‘V’ conformations will often increase capture success, as bats swerving to avoid one net may run into the other (Figure 5). Many nets may be strung together in this fashion in a variety of combinations, depending on the imagination of the field crew.
Mistnet placement may also depend on the general habitat being surveyed. For example, in many regions of the prairies or mountains, standing water is relatively uncommon, and netting success in these habitats is often high. In contrast, because there is a large quantity of standing water in central and northern Alberta, netting over water in these areas may be less productive than setting nets across cut-lines and small clearings. Knowing the locations and habitats in which to place mistnets in a particular region comes with experience. The use of ultrasonic bat detectors to determine centres of high activity will also be useful in this regard.

Handbook of Inventory Methods 16
Figure 4. Example of mistnet placements (from Kunz and Kurta 1988). Note that the mistnets are placed such that a potential flight corridor is covered by the net. (A) Attic of building. (B) Cave entrance. (C) Over a pond. (D) Over a stream. (E) Edge of lake. (F) Forest trail. To maximize capture of Myotis spp. poles should be as close as possible to the edges, or even centers, of tree trunks, and trees may wish to be included within V formations (C. Lausen, pers. comm.).

Handbook of Inventory Methods 17
Figure 5. Example of multiple mistnet configurations and alternative pole uses (from Kunz and Kurta 1988). (A) Use of large rocks and crevices in rock ledges to anchor net poles. (B) Use of ropes as poles. (C) V-net configuration, poles anchored in soft substrate or with large rocks. (D) T-net configuration with a high and low net. Although not obvious in the drawing, the high and low nets should overlap as little as possible. (E) Foliage roost partially surrounded by a net. (F) Building partially surrounded by nets.

Handbook of Inventory Methods 18
Figure 6. Examples of harp trap placement. a) suspended in a canyon, (b) on a forest trail, (c) in shallow pond for support of mistnets, (d) two traps in L-configuration in front of closed door opposite crevice, (e) suspended beneath ridge pole inside barn, (f) in front of open barn door, (g) at the entrance to a cave, and (h) suspended outside building near roof line (From Kunz and Kurta 1988). When possible, deadfall should be used to fill gaps around the traps to funnel bats.

Handbook of Inventory Methods 19
1.4.1.6. Morphometric Measurements, Sex, Age, & Reproductive Assessment
• Once a bat is removed from a mistnet or harp trap, it should be placed individually in a cloth holding bag (about 20 × 30 cm) with a drawstring closure. Often additional wrapping of the string around the top of the bag may be necessary to prevent small bats from climbing out. Remember to tie off the drawstring! Individuals should be held for an hour prior to measuring mass to ensure that the contents of the digestive tract have been processed. Females in late stages of pregnancy, or lactating females, should not be held for longer than one hour to minimize stress, and allow lactating females to return to their roosts and dependent young.
• Most species can be identified using a key to external features (see Appendices 1 and 2; van Zyll de Jong 1985, Nagorsen and Brigham 1993). However, biologists are cautioned to be conservative when classifying bats as to taxonomy. Several problems exist for identifying certain species in the field, and accompanying data forms allow biologists to identify each bat observation to the taxonomic level at which they are certain. In Alberta, the two long-eared Myotis spp. (M. evotis, and M. septentrionalis) may be confused, as membrane colour and ear length are variable. Similarly, northern long-eared bats (M. septentrionalis) and little brown bats (M. lucifugus) may also be confused, as ear length ranges overlap and membrane colours are similar. Careful attention to additional features, such as tragus length and shape, ear and hind foot length (see Figure 7), and careful measurements, will usually solve most species identification problems. The use of highly variable or subjective characters, such as fur colour, to identify bats should be avoided unless extremely obvious (e.g., red bat). The accompanying Bat Capture Data Sheet includes space where a biologist should enter morphometric data or other observations that provide evidence for a particular species (especially when it is difficult to distinguish from others). References to voucher specimens or photographs may also be useful, as well as recording echolocation calls (these may be included as project deliverables). Taking voucher specimens is the best means to ensure accurate species identification, but should only be done when it is crucial to a study and species identification is difficult. Similarly, the Bat Detection Data Sheet includes space to enter computer filenames for digital records or labels for cassette tapes that include high quality reference calls or evidence of rare and endangered bats.
• Body mass of the bat can be measured with a portable Pesola spring scale or digital electronic balance and should be recorded to the nearest 0.1 g if possible (small Pesola scales have a maximum precision of 0.25 g). Bats can be weighed in the cotton holding bags, and the weight of the bag subtracted.
• Forearm length (Figure 7) indicates overall size and is the standard morphometric character measured. The forearm length is measured from the base of the thumb to the end of the ulna, using calipers to the nearest 0.1 mm. It is often advisable to take three measurements of the forearm and record either the average or the most consistent measurement.
• Individuals can be readily sexed, based on the obvious presence of male external genitalia (Racey 1988). Reproductive condition in males can be assessed by testes size early in the season (until about mid-September). The testes become enlarged in individuals during sperm production. Later in the breeding season, the testes decrease in size and sperm is stored, making it difficult to tell whether a male is reproductive. For females, gentle palpation of the abdomen is used to determine whether the female is carrying a fetus, although early pregnancy cannot be differentiated from a full stomach. Lactating females can be recognized by enlarged nipples surrounded by bare skin, which when gently massaged or pinched will express milk. Post-lactating females also have bare patches around the nipple, but milk can not be expressed (Racey 1988),
• Juveniles (young of the year) can be distinguished from adults by the presence of cartilaginous epiphyseal plates in the finger bones (Anthony 1988). These make the finger joints of juveniles appear tapered and less knobby than in adults (Figure 8). Check for unfused epiphyseal plates by viewing the joint with a source of light (e.g., headlamp) behind it; a young juvenile joint will have a

Handbook of Inventory Methods 20
light cartilaginous area between the ends of the bones. Degree of tooth wear is sometimes used as a relative indicator of age (Anthony 1988), but this is not always reliable as degree of tooth wear may also depend on the hardness of insects in the diet.
• Although not recommended for general inventory projects, bats may be individually marked for future identification in certain circumstances, depending on the objectives of the study (see Barclay and Bell 1988). Split-ring plastic or aluminum bands may be placed around the forearm, but care must be taken to remove any sharp edges or corners before doing so (and multiple aluminum bands should not be placed on the same forearm). Alternatively, small Passive Injectable Transponders (PIT tags; e.g., Fagerstone and Johns 1987) may be inserted beneath the skin on the larger-bodied bat species. PIT tags contain small transponders that transmit a unique code when an electric field from a specialized reader is passed over or near the tag.
Figure 7. External topography of a vespertilionid bat and standard measurements . 1) plagiopatagium; 2) chiropatagium; 3) propatagium; 4) uropatagium; 5) calcar; 6) keel of calcar; 7) upper arm; 8) forearm; 9) thumb; 10) metacarpals; 11)phalanges; 12) tibia; 13) foot. TL = total length; T = length of tail; FA = length of forearm; E = length of ear; tr = tragus; HF = length of the foot (from van Zyll de Jong 1985).

Handbook of Inventory Methods 21
Figure 8. Finger joint of (a) juvenile (tapered, and epiphyseal plates should be visible with the aid of a flashlight illuminating the wing), and (b) adult (knobby and opaque) (from Nagorsen and Brigham 1993).
1.4.2. Ultrasonic Detection
Bats in Alberta typically rely on vocalizations for communication (Fenton 1985) and orientation when commuting or foraging (Griffin 1958, Altringham 1996). Bats emit ultrasonic signals in order to echolocate. By emitting a series of discrete calls and listening for returning echoes, bats are able to locate objects, including prey items (Griffin 1958). Echolocation signals have frequency, duration, and intensity components associated with them (Simmons et al. 1979). All bats in Canada produce FM, or frequency-modulated, echolocation calls, where the echolocation calls change in frequency over time (Figure 9). The signal may be narrowband, where the frequencies sweep over a small range, or broadband, with a large change in frequency over time. Most echolocation calls produced while the bats are searching have a characteristic frequency of maximum intensity, where the majority of energy is placed, usually coinciding with the relatively long “tail” of the FM call. Putting the majority of energy in a small frequency range while searching for prey increases the effective range of the calls. The signal may also include additional harmonics in addition to the fundamental (lowest frequency) harmonic.
The repetition rate at which calls are given varies with the activity of the bat and provides a means for discriminating between different behaviours in the field (Thomas and West 1989). Commuting bats or bats searching for prey emit approximately 5-10 calls per second (Figure 10). This rate increases to 100 or more calls per second when a potential prey item has been detected and the bat closes in to attack. This characteristic ‘feeding buzz’ (Griffin 1958) indicates that a bat is foraging in an area. Thus, it is possible to determine what habitats are important as foraging areas, by detecting the presence of feeding buzzes.

Handbook of Inventory Methods 22
Figure 9. Examples of sonograms (frequency vs. time) of search-phase echolocation calls for the nine species of bats in Alberta. 1. Lasiurus cinereus, 2. Myotis volans, 3. Eptesicus fuscus, 4. L. borealis, 5. Lasionycteris noctivagans, 6. M. evotis, 7. M. septentrionalis, 8. M. lucifugus, 9. M. ciliolabrum. Modified from van Zyll de Jong (1985) with data from Barclay (1986) and Obrist (1995). Note that considerable intraspecific variation in echolocation calls exists.
Figure 10. A graphic portrayal of the timing of echolocation calls during the search, approach, and terminal (feeding buzz) phases just prior to contact with a prey item (modified from van Zyll de Jong 1985).
Ultrasonic detection involves sampling bats by acoustic means. It is possible to eavesdrop on the vocalizations used during echolocation to detect the presence of bats, assess whether a bat is foraging or commuting, and potentially identify the species emitting the call (see Figure 9; but see below). Sounds ≥ 20 kHz are termed ultrasonic (beyond the range of human hearing), and the calls of all bat species in Alberta are restricted to the ultrasonic range. Therefore, we require specialized equipment in the form of ultrasonic bat detectors to monitor them.
Unlike netting and trapping, no handling is involved during ultrasonic detection, and therefore disturbance is minimized. However, positive species identification is not usually possible, nor is assessment of age, sex, or reproductive condition. Instead, ultrasonic detectors are used to determine relative levels of bat activity in different habitats. Therefore the question being asked and the type of information required will generally dictate whether this sampling method is useful.
When using detectors to eavesdrop on bats, two pieces of information should be recorded (on a per unit time basis): (1) the number of bat passes and (2) the number of feeding buzzes. A bat pass is defined as a sequence of two or more echolocation calls registered as a bat flies within range of an observer or the detecting equipment (Fenton 1970, Thomas and West 1989).

Handbook of Inventory Methods 23
The number of bat passes detected does not allow for an estimate of the number of bats present in a study area because it is not possible to discriminate between several bat passes made by a single bat flying repeatedly through the study area versus several bats each making a single pass. Therefore, bat passes do not allow a direct estimate of population densities. However, the technique does allow a relative measure of bat activity in an area and allows for comparisons between areas or over time to be made.
It is important to note that different species of bats produce echolocation calls at different intensities, which influences the distance they can be detected at and therefore the levels of measured bat activity. For example, some species, such as M. evotis, use low-intensity calls or high frequency calls which attenuate rapidly (Faure et al. 1990) and are only detectable at a distance of a few metres. These species will thus be under-represented in sampling compared to other species. In contrast M. lucifugus is detectable at a range of over 10 m with a QMC Mini bat detector (Downes 1982), and L. cinereus is detectable up to 30 - 40 m away. Furthermore, sound transmission of lower frequency sounds, such as those used by L. cinereus and E. fuscus, is influenced by habitat structure (Patriquin et al. 2003). These differences in detection distances among species and habitat types make reliable comparisons of relative abundance difficult at best (Thomas and West 1989, Patriquin et al. 2003).
1.4.2.1. Ultrasonic Detection Equipment
To detect the nine species of bats found in Alberta, a commercially available ultrasonic bat detector is required (see Parsons et al. 2000 and Obrist 2002 for a review of bat detection equipment; see Appendix 3 for list of suppliers). Bat detectors consist of components for the reception of the signal and transformation of the signal to lower frequencies. Receivers detect the ultrasound and include microphones and amplifiers, while transformation systems generally incorporate one of three kinds of circuitry to modify the signal: heterodyne, countdown (also known as frequency division), and time-expansion. Detectors come in a wide variety of forms, but they can be distinguished on the basis of microphone type (receiver) and the type of circuitry used to transform the incoming signal. Many detectors contain more than one type of transformation circuitry, and therefore have multiple functions.
The two types of microphones commonly used on ultrasonic detectors are piezoelectric transducers and condenser microphones. Piezoelectric transducers are widely used in cheap brands of ultrasonic detectors, mainly because of their ruggedness in field conditions. However, their frequency response covers a limited range of frequencies, and they are generally only sensitive around their resonant frequency (often 25 or 40 kHz). The variable response may lead to biases in basic survey work such as activity monitoring. Capacitance, or condenser, microphones are the type most commonly used on more expensive ultrasonic detectors today, and come as either a miniature electret or solid dielectric configurations. Both types of condenser microphones are sensitive over a broad range of frequencies, but solid dielectric microphones are larger, more expensive, and more sensitive across a broader range of frequencies (Parsons and Obrist 2002). One drawback of condenser microphones is that their sensitivity may be influenced by ambient humidity levels (Fenton 1988). Typically the sensitivity of the microphone may be adjusted by the user (gain setting), and the output amplified by a volume control on the bat detector.
The other feature that differs between ultrasonic detectors is the circuitry they use to transform the incoming sound. The first class of circuitry is called heterodyne, and allows the detector to be tunable to particular frequencies. When ultrasound in a 3-5 kHz band around a user-selected frequency is detected by the circuitry, it produces a signal much lower in frequency than the original signal, making it audible to the operator. The benefit of this type of circuitry is that it allows the user to scan particular frequencies or a range of frequencies one at a time, and because of the narrow frequency window being scanned, good signal-to-noise ratios can be obtained. However, neither the duration nor the absolute frequency of the

Handbook of Inventory Methods 24
original signal is present in the heterodyned signal, and thus it is not suitable for further spectral analysis. The sensitivity of the heterodyne system means that these detectors are useful for measuring general bat activity where species identification is not required. However, species-specific activity is difficult to measure with these systems, as different bat species produce calls with different source intensities, and bats calling at frequencies outside of the tuned window will be missed, although it is possible to sample for several bat species that employ calls with different frequency components by changing the tuning of the detector. It is crucial to calibrate heterodyne ultrasonic detectors to a pure tone before using them in the field (Thomas and West 1984) to ensure that frequency settings are correct. Commonly used ultrasonic detectors of this type are the Mini, Mini-2, and Mini-3 detectors (UltraSound Advice, formerly QMC), the D100, D200, and D220 detectors (Pettersson Electronik AB), the BatBox III (Stag Electronics), the Mk.2 detector (Magenta Electronics), and the SBR 1200 and 2000 series (Skye Instruments). In addition, the U30 and S200 (UltraSound Advice), and a number of other Pettersson detectors (models D230, D240, D240x, D940, D980), have heterodyning capability in addition to other circuitry.
The second type of circuitry is called countdown or frequency division. The incoming signal is passed through a zero-crossing system that isolates the dominant or loudest harmonic, and creates a square wave of the same frequency. Only input signals above a predetermined threshold are converted, to minimize the amount of noise in the output signal. The square wave is then filtered so that only every xth wave passes through, where x is set by the user and represents the degree of frequency division. For example, a call sweeping from 100 kHz to 40 kHz becomes audible as a sweep from 10 kHz to 4 kHz with a 10× frequency division. This broadband system has the considerable advantage of permitting the entire range of frequencies to be monitored simultaneously. Therefore, sampling effort can be increased, because it is unnecessary to constantly tune to different frequencies to detect different species or species groups. Also, information regarding the time and frequency characteristics of the dominant frequency are retained. If the amplitude of the input signal is also retained, the divided output can be visualized in real-time with the appropriate equipment. This technique provides information about the calls that one would not achieve through acoustical means alone, including characteristics such as maximum frequency, minimum frequency, average frequency, duration, and time between calls. However, countdown systems also have several disadvantages (see Parsons and Obrist 2002, Fenton et al. 2001), including 1) only the dominant harmonic is tracked by the zero-crossing system, and therefore no other harmonic information is contained in the output; 2) these systems may jump between harmonics if frequencies overlap between harmonics over the course of a signal; 3) the degree of division dictates the frequency range that can be heard or recorded following transformation, and high frequency calls may be missed; 4) the use of an input amplitude threshold can decrease the overall sensitivity of the detector, reducing detection efficiency; 5) the frequency division method is unable to deal with very short, high frequency signals; and 6) in many systems the original amplitude information is not represented in the output signal. Commercially available countdown detectors are available: S200 and U30 (UltraSound Advice), D230, D940, and D980 (Pettersson), and the Anabat II system (Titley Electronics).
The third means of transforming ultrasound involves the time expansion of a signal to lower frequency, based on the inverse relationship between time and frequency. If the duration of a signal is increased, the frequencies contained in the signal will also decrease. Before digital circuitry, older ultrasonic detectors, such as the UltraSound Advice S200, were used to capture unmodified signals, which were then recorded onto a high-speed tape recorder (76 cm/s; Racal Store 4D or other). These calls could then be played back at a slower speed to time-expand them, and hence reduce the frequency. Modern ultrasonic detectors may be coupled with digital time-expansion circuitry, either as a separate unit (UltraSound Advice Portable UltraSound Processor [PUSP]), or as part of the detector (Pettersson D240, D240x, D980). The entire incoming signal, including all harmonics (if audible), are captured, depending on the intensity of the call and the sensitivity of the microphone used. Time-expanded signals can then be

Handbook of Inventory Methods 25
recorded onto analog or digital tapes, or monitored using computer software. The higher information content of these time-expansion systems relative to zero-crossing period analysis in countdown systems may be much more useful for species identification (see below), but comes at a high cost, as high-speed tape recorders and detectors with time-expansion systems are often very expensive (> $5,000 - $20,000). One downside of modern time-expansion systems is that only a few seconds of ultrasound (currently 2.2 s for UltraSound Advice and up to 3 s for Pettersson models) can be recorded before the system becomes unavailable for monitoring to time-expand the signal (if 10× expansion is used, then for 2 s of ultrasound, 20 s is required to expand it). If continuous monitoring is necessary, these systems will not be appropriate. Detectors used with a high-speed tape recorder can monitor calls continuously, as the time-expansion is performed after recording has been completed, but these systems are bulky and extremely heavy, and are no longer commercially available.
A fourth type of circuitry has recently become available for direct recording in real-time onto a computer, and likely represents the future of ultrasound capture and analysis. A broadband microphone, typically attached to a bat detector, which simply acts as an amplifier, is connected to a digital sound card with a high sampling rate. In combination with the appropriate software, it is then possible to monitor complete echolocation calls in real-time in the field. A large hard drive and/or a CD burner is required to store the large files associated with digital sampling of sound. Any of the higher end bat detectors may be used to capture ultrasound, and software for real-time monitoring, and in some cases the digital sound cards, are available from Pettersson, Sonobat, and AviSoft.
If all of the information contained in a signal must be conserved for reference or analysis, it must be recorded to a storage device. The output of heterodyne, countdown, and time-expansion systems may be recorded to analog compact cassette recorders, digital DAT, compact flash memory cards, CD, or DVD recorders, or directly onto a computer using specialized software. Two main problems may occur during the recording process. The first problem that may occur during recording is termed clipping. If the intensity of the recorded signal is beyond the upper limit of the dynamic range of any part of the recording system (detector, tape, A/D converter, etc.), the upper and lower extremes of the amplitude of the signal will be truncated to the limits of the dynamic range. Clipping creates spectral components that were not present in the original signal, such as additional harmonics, and may not always be obvious, particularly with analog recordings, where steep amplitude changes (edges) may be smoothed. Clipping is not a problem with zero-crossing analysis, as it does not incorporate amplitude information, but may be a problem when analyzing intact signals. The second problem, called aliasing, occurs when signals are being digitized. Sounds are digitized using an analog-to-digital converter, which samples the amplitude of an input signal at a particular sampling rate, typically thousands or tens of thousands of times per second. The digital representation of a signal therefore consists of a sequence of numeric values representing the amplitude of the original waveform at discrete, evenly spaced points in time. During this process, if the sampling rate is not high enough, frequencies in the input signal above half the sampling frequency (termed the Nyquist frequency) simply mirror the lower frequency range and are meaningless. The higher the sampling rate, the higher the upper frequency that can be safely analyzed. In general, if one has a choice it is preferable to record directly to a computer, as there is a significant loss in the quality of sound recorded to tape recorders (White and Gehrt 2001).
Once captured, two main methods are used to visualize and analyze intact ultrasound signals. A zero-crossing period meter counts the time between two crossings of an input signal through the zero volt line and displays its inverse (1/period = frequency) as a DC voltage (Simmons et al. 1979). When fed into an oscilloscope or computer software, the frequency structure of the signal over time will be displayed. As with all zero-crossing analysis systems, only the strongest harmonic is displayed, and the presence of strong harmonic components or noise can degrade the resolution of frequency measurements, but the advantage is that real-time monitoring is possible. Titley Electronics Analook software, Pettersson’s BatSound software series, AviSoft-SASLab software series, and Sonobat software provide real-time

Handbook of Inventory Methods 26
monitoring of sonograms (frequency vs. time displays), as well as analysis of those sonograms, based on inputs from countdown or time-expansion bat detectors.
Fast-Fourier Transform (FFT) analysis is the other means to visualize and analyze the information present in echolocation calls. FFT is a mathematical algorithm that transforms amplitude-time information (as captured during digital sampling) to the frequency-time domain, creating a series of values representing the amplitudes of a sequence of discrete frequency components. These values may then be converted into a sonogram or power spectrum (intensity versus frequency) using further algorithms. Pettersson has three software packages available that perform FFT analysis: BatSound, BatSound Pro, and SoundAlyze, as does the AviSoft-SASLab software series. Both sets of software allow for real-time recording and analysis of unaltered ultrasound, and a variety of analysis features to allow in-depth examination of echolocation calls (period meter, sonogram, power spectrum, and time-amplitude). In addition, Canary 1.2, commonly used for bird song analysis, is also useful for digitizing and analyzing echolocation calls that have been time-expanded and reduced in frequency below 20 kHz (Charif et al. 1995). This software package allows for the analysis of sonogram, power spectrum, and time-amplitude displays of calls.
Both heterodyne and countdown can be used remotely as well as manually, allowing automatic monitoring of bat calls, thus freeing the worker for other tasks. By coupling a heterodyne detector with a micro-cassette recorder and a talking clock it is possible to leave the detector unattended in the field (O’Donnell and Sedgeley 1994), and thus sample a number of Detector Stations on any given night. The amount of data that can be collected is limited by the length of tape, from which the data must later be transcribed. It is also possible to sample at different heights in the canopy by using a microphone with a long lead suspended at different heights (Thomas and West 1989). The major disadvantage of tunable detectors is that they must be set at one and only one frequency and therefore not all bat species will be sampled, unless several detectors are set at different frequencies and left at each Detector Station. Some countdown detectors (e.g., Anabat or Petterssen systems) can also be operated remotely as well. For countdown detectors other than Anabat II, a talking clock or other timing device must be used for a time cue if the tape is not run continuously, as well as a timer to turn the machine(s) on. The Anabat II detector system is particularly easy to use and can be used with one of two different remote recording systems. A delay switch,timer, and night activation switch can be used to record bat calls to tape. The delay switch automatically turns on a tape recorder whenever a call is detected, accompanied by a time cue and calibration tone (40 kHz). The timer can be used to turn the detector system on or off for set durations of time at certain periods of the night, on the system can be set on night activation so that it will only turn on when light levels are low. Alternatively, an Anabat Compact Flash Storage ZCAIM (CF ZCAIM) unit can be used to store bat call data directly onto a compact flash memory card, to be downloaded to a computer and interpreted later. The CF ZCAIM system can generally be left unattended for long periods of time, because it is not limited by tape length. Each memory card holds a large amount of data (e.g. 64 MB), which could represent several nights of monitoring, and sound quality is not lost by recording to tape. The CF ZCAIM gives a time stamp for every sound file, and its internal clock can be programmed (using a computer) to turn the unit on or off at specified dates and times. All species may be detected with a single countdown detector because they monitor all frequencies simultaneously. Sampling effort can be greatly increased by using several automated detectors. However, time must still be spent analyzing the recorded signals, although this can be done subsequent to the field work. Direct-recording and time-expansion systems generally require some degree of monitoring by the user, and at this point in time are not as useful for remote sampling, although direct recording systems will likely overcome this problem shortly.
Handbook of Inventory Methods 27
1.4.2.2. Species Recognition Using Bat Detectors
It was discovered early on that different species of bats use echolocation calls of differing frequencies (Griffin 1958). Because of this variation, and the fact that search phase echolocation calls are generally similar within a species in a given area, researchers began to try to use the differences in echolocation calls to distinguish between bat species (Fenton and Bell 1981). The first widely used ultrasonic detectors were mainly tunable heterodyne or narrowband detectors. Calls of overlapping frequency but with different frequencies of maximum intensity, bandwidth, and duration result in different-sounding outputs from tunable ultrasonic detectors set at particular frequencies. Based on these different outputs, it may be possible to distinguish between different species or species groups (Fenton et al. 1983).
The visual sonogram display obtained when using a zero-crossing period meter provides even more information about the echolocation calls, such as minimum and maximum frequencies, call shape, and call duration of the dominant harmonic, which then may be used for species identification (see Fenton and Bell 1981). The development of user-friendly computer software and remote monitoring capabilities with period meter and direct-recording systems has led to an explosion of studies where ultrasonic detectors have been used to identify species in the field.
However, there are a number of problems with the identification of bat species using current ultrasonic detector technology (Barclay 1999, Obrist et al. 2002; but see O’Farrell et al. 1999b). First, unlike bird song, which contains an important species-specific component, echolocation calls are highly functionally constrained by the laws of physics, and natural selection has favoured calls best suited for prey-detection and orientation, not designs that identify the species of the caller to other organisms (Barclay 1999).
Second, there is considerable intraspecific variation in echolocation call structure associated with differences in geographic localities (e.g., Thomas et al. 1987), sex (e.g., Jones et al. 1992), age (e.g., Jones et al. 1992, Jones and Ransome 1993, Masters et al. 1995), individuals (e.g., Brigham et al. 1989, Masters et al. 1995, Obrist 1995), families (Jones and Ransome 1993, Masters et al. 1995), and colonies (e.g., Pearl and Fenton 1996), which may mask interspecific variation. Furthermore, bats may modify the bandwidth, duration, dominant frequencies, and harmonic content of their calls in different habitats (e.g., Rydell 1990, Kalko and Schnitzler 1993, Obrist 1995), in the presence of conspecifics (e.g., Jones et al. 1994, Obrist 1995), and during different phases of an attack on an insect (e.g., Barclay 1986). While it is true that consistent differences in echolocation call structures may exist between species, at least in their search phase calls in open habitats, it is impossible to know which of the above factors may be influencing the calls being used by the bats being detected at a given time. The high degree of potential intraspecific variation likely masks interspecific variation in many situations.
Third, because of increased atmospheric attenuation of high frequencies (Griffin 1971), recorded features of calls depend heavily on factors such as the distance between the bat and the microphone and the direction the bat’s head is facing relative to the microphone. The further a bat is from the microphone or the greater the angle between the head and the microphone, the greater the potential for missing the higher frequency portions of the calls. Furthermore, different bat species produce calls at different intensities, which will influence the distance at which they may be detected, and therefore the amount of information in the calls that is captured by the ultrasonic detector.
Despite these limitations, species identification of bats using ultrasonic detectors has flourished and its use is widespread. Two approaches to species identification using ultrasonic detectors have emerged: qualitative and quantitative. Qualitative identification involves a trained observer making a determination of species identity based on the features of a bat’s calls, typically after viewing a sonogram or simply listening to the output of a heterodyne or countdown detector. This approach was in fact the first approach used in the identification of bat species (see Fenton and Bell 1981), and has benefited in recent

Handbook of Inventory Methods 28
years from the systematic collection of echolocation calls from across species ranges and the publication of “call libraries” as a basis for comparison with “unknown” calls (for example see http://sevilleta.unm.edu/~wgannon/batcall for a library of Anabat recordings). A major problem with qualitative species identification with the period meter systems or heterodyne ultrasonic detectors is that it can only be accomplished by highly trained observers, and contains a large subjective component. This means that the technique is not repeatable by observers with less experience, and often not repeatable by the same observer (Betts 1998, Weller et al. 1998). Even among those with extensive experience, different observers may differ in their interpretation of sounds produced by a heterodyne detector or qualitative differences between sonograms as displayed after zero-crossing analysis. For example, even highly trained observers using Anabat systems make mistakes, with published error rates of up to 37.5% (e.g., O’Farrell et al. 1999a). Similarly, Betts (1998) found that experienced observers could not reliably distinguish between Anabat recordings of big brown (Eptesicus fuscus) and silver-haired (Lasionycteris noctivagans) bats in blind tests, in spite of the fact that their echolocation calls differ significantly relative to species within the genus Myotis, for example. The lack of accuracy and repeatability in the discrimination of species with relatively different echolocation calls does not instill confidence in qualitative species assignments using these systems.
A more rigorous approach is quantitative species identification, where echolocation calls are transformed using period meter or FFT analysis, and various characteristics of the calls described manually or automatically using sound-analysis software. Statistical methods such as Discriminant Function Analysis (DFA) or neural networks are then used to distinguish species or species groups on the basis of the quantitative characters of the echolocation calls (for examples see Vaughan et al. 1997, Parsons and Jones 2000, Parsons 2001, Russo and Jones 2002, Obrist et al. 2000), and can be used to provide measures of classification success. In each case, a large sample of “known” echolocation calls from individuals identified to species on the basis of external morphology are required to provide the necessary background to identify unknown calls (as is also done for qualitative species identification, see above). This approach is free from the problems of observer bias and lack of repeatability associated with qualitative species identification, but still has a number of potential problems. For instance, recording calls from known individuals is typically accomplished by light-tagging the bats and releasing them in an open area (so that the bats can be followed and more easily recorded; see section 1.4.2.3), but then any comparisons must be made with echolocation calls also recorded in open areas. The sample of known calls must encompass all possible species in a given area, which can be quite difficult to accomplish for hard to catch species such as hoary bats, and must be large enough to account for geographic, seasonal, age, sex, and individual variation within each species. Classification using DFA and neural networks is based on probabilities of assignment, and hence subject to the setting in the analysis. Furthermore, there is typically considerable overlap in echolocation call characteristics between species, and perfect classification success has yet to be achieved (see Vaughan et al. 1997, Obrist et al. 2000). We have no way of knowing which unknown calls have been misclassified, raising the issue of how to determine the best way to incorporate classification error into our biological conclusions and management decisions.
Given all of the constraints on and intraspecific variation in echolocation calls, the variation in recording conditions, differences between detectors (see Waters and Walsh 1994), differences between transformation systems (e.g., zero-crossing analysis versus time expansion), and the lack of objectivity, repeatability, and classification success, the identification of bat species based on their echolocation calls using tunable or countdown detectors is problematic. Until these issues have been dealt with, the conservative approach is to only use ultrasonic detectors for what they are designed for, to record bat activity, and to only identify meaningful species groups. In areas where there are more species of bats producing a wider variety of echolocation call types, such as the tropics, the Anabat or other period meter systems may be more useful for discriminating species. However, the echolocation calls produced by bats in most Canadian provinces are too similar to be distinguished using systems of this type. Bat detector systems that provide all of the information on incoming signals (e.g., direct recording or time-

Handbook of Inventory Methods 29
expansion systems) may be more useful in distinguishing between species, but even so, perfect classification success has yet to be achieved (see Vaughan et al. 1997, Obrist et al. 2000). Furthermore, the high cost of these systems will likely prevent their widespread use for some time.
1.4.2.3. Reference Recordings
As is discussed above, if the goal is to identify bat species using qualitative or quantitative methods, then it is important to make reference recordings of individuals of known species, for later comparison with unknown individuals. To make ultrasonic reference recordings for particular bat species, it is necessary to first capture and visually mark bats. A small chemi-luminescent light tag, such as a miniature light stick (2.9 mm × 24 mm), can be glued to the fur on the back or belly of a bat, depending on the position of the observer and typical height the bat will fly (Barclay and Bell 1988, Hovorka et al. 1996). This light tag will act as a short-term visual mark to keep track of the bat as it is being recorded. Light tags are also a useful means for determining foraging ranges, habitat use, the vertical distribution of activity and for making behavioural observations (see Barclay and Bell 1988 for details). Once the light tag is affixed, the bat can be released, and reference calls recorded. Alternatively, a high-powered (1 million candle power) spotlight can be shone onto the bat to follow it as it flies. Portable spotlights with rechargeable internal batteries can be purchased at most hardware stores. Typically bats are released and recorded in open areas, to facilitate observation of the bat (the average observation time of a light-tagged bat, or one being followed with a spotlight is < 10 seconds as they are difficult to follow), and to standardize the recording scenario. To account for intraspecific variation, as many individuals as possible of each species should be recorded in a variety of locations. Calls of unknown individuals may be compared to reference recordings to aid in species or species group identification in a qualitative or quantitative fashion, keeping in mind the constraints discussed above.
1.5. Absolute Abundance
As discussed previously, absolute abundance measures are not appropriate for bats in most situations. However, estimates may be obtained for specific Design Components (Habitat Features) such as summer day roosts or hibernacula. Counts are made visually, either by watching the emergence of bats from the roost at dusk, or estimated by counting directly from inside the roost.
1.5.1. Roost counts
Bats spend over half of each day in their roost, and thus suitable roost sites are of paramount importance to bats (Kunz 1982). Roost sites may be night roosts (sites used temporarily between feeding bouts during the evening), day roosts (sites used during the day), or hibernacula (sites where hibernation occurs during the winter). Many species have very specific requirements for roosts in terms of shelter, temperature, humidity, and environmental stability (Kunz 1982), which are key factors in maintaining energy budgets and for the efficient use of torpor. This is especially true for hibernacula. Because of their narrow requirements, suitable roost-sites may be limiting and may set an upper limit on population sizes for many bat species. In contrast, solitary species that roost in foliage, such as L. borealis and L. cinereus, do not seem to be as dependent on the characteristics of the roost-site to provide them with protection from the elements, and may rely more on their thickly furred bodies and tail membranes, as well as behavioural thermoregulation. Roost requirements may also differ between the sexes. For example, during the summer females usually aggregate in groups called maternity colonies to give birth and raise their young, whereas males are often solitary and tend to roost away from females (Kunz 1982).

Handbook of Inventory Methods 30
During the summer bats roost in a variety of structures, including buildings, caves, rock crevices, beneath loose bark or in hollows in trees (see also Table 1). Bats roosting in buildings and caves during the summer tend to be faithful to a particular roost, often returning to the same roost year after year (Lewis 1995). In contrast, a common feature of tree-roosting bats is that they commonly move between a number of roost sites at frequencies of 1-6 days (e.g., Lewis 1995; see references in Barclay and Brigham 1996). Roost-sites used over longer periods of time (e.g., buildings and caves) are often more conspicuous than roosts used for only one or several days, such as tree roosts, because of the greater number of bats they can harbour, and the buildup of odour and guano.
Locating roosts is largely a matter of identifying potential roost sites and then observing them (visually and with detectors) around dusk to see if bats emerge. During the day, buildings, rock crevices, and caves can be searched visually for the presence of bats or bat faeces. Tree roosts are most often located using radio-telemetry, and this technique can also be used to locate roosts in other types of structures.
Visual counts of the number of bats exiting the roost provide a useful and accurate census of the total number of bats using a roost site, provided that all roost exits are monitored and any bats that re-enter the roost are accounted for (Thomas and LaVal 1988). Electronic counting devices such as photo-electric beam splitters also have been used to census bat roosts (e.g., Voute et al. 1974). For roosts that can be entered, visual estimates of the roosting population may be obtained directly, or by estimating the surface area occupied by clusters of bats and mean packing density within clusters and then extrapolating for the whole roost-site.
It may still be necessary to trap bats at the roost to obtain a positive species identification and ensure that only one species is using the roost. One obvious drawback to this method is that it can only be applied at known roost sites and usually only one roost exit per night per observer can be monitored. Thus, extrapolation beyond the specific roost is usually not possible.
During the winter, the bat species found in Alberta may use a variety of sites for hibernation, including caves, mines, and buildings (van Zyll de Jong 1985). Thus far, only four caves have been identified as bat hibernacula in Alberta. Identification and protection of these sites is important, as suitable sites are not abundant, and single hibernacula may contain thousands or even millions of individuals of multiple species (Tuttle and Taylor 1998). At present very few hibernacula are known in Alberta (M. Pybus pers. comm.) and in neighbouring British Columbia (Nagorsen and Brigham 1993, Nagorsen et al. 1993). Wildlife regulations forbid disturbance of bat hibernacula between September 1 and April 30 in Alberta. During this period hibernacula should be entered only under direct supervision of Fish and Wildlife Division (FWD) staff.
1.5.1.1. Radio Telemetry
Radio-telemetry is a useful technique for locating and identifying roost sites. However, this technique may be inappropriate for smaller species (e.g., M. ciliolabrum) because of their mass relative to that of a radio tag (see below). Adult females that are in early pregnancy, non-parous, lactating, or post-lactating, and adult males, can be tagged. Adult females during late pregnancy and juveniles should not be tagged.
For flying animals, the recommended maximum mass that should be attached is 5% of the total body mass. Note that for bats, the calculation of body mass does not include a stomach full of insects. Additional mass may have significant effects on an animal’s behaviour (Aldridge and Brigham 1988). If this ‘5% rule’ is followed then based on average masses, only 7 of the 9 species of bat in Alberta are suitable for radio-telemetry using a 0.35 g transmitter (see masses of bats in Appendix 2). However, there is some controversy as to the effects of putting a transmitter on smaller bats. Although there is no doubt
Handbook of Inventory Methods 31
that additional mass may result in changes in behaviour, especially when foraging, it can be argued that carrying around a transmitter is not that much different from carrying around a fetus (which typically weighs more than the smallest transmitters). However, it is unclear what effects changing the center of gravity may have on a bat’s flying ability, especially on males that are unaccustomed to such weight gains (see also Kalcounis and Brigham 1995 for effects of weight on bats). Radio-tagged bats often roost in the same location as other bats of the same species not carrying radio-tags, and thus it is unlikely that the added weight of the transmitter influences roosting behaviour (Vonhof and Gwilliam 1999). When species are of management concern and at risk of losing suitable roosting habitat, the potential cost to the bat in terms of flight performance may be outweighed by the value of the information gained about its roosting habitat, and the radio-tagging of smaller species may be warranted. Regardless, the 5% rule should be followed, and radio tags should never exceed 10% of the body mass of any bat.
The smallest transmitters currently available weigh about 0.35 g, have a battery life of 8 to 10 days and a maximum detection distance of 1 to 3 km which varies depending on topography. Larger radio-transmitters (0.7 g) may last 3 to 4 weeks, with greater detection distances. Transmitters usually remain attached for 1 to 14 days. However, some species are more adept at removing (via chewing or grooming) the transmitter and/or antenna, thereby reducing its effective life. Radio-transmitters come in a variety of frequencies, output power, and battery duration, which may be user-specified when ordering depending on the radio receivers being used. Smaller transmitters require soldering of leads to activate them. Transmitters should be affixed with nontoxic surgical adhesive (e.g. SkinBond®, available at most medical supply stores). Radio receivers and antennae are used to locate the position of the radio-transmitter during the day. There are a variety of types of receivers (see Appendix 3), but generally speaking, the number of features, reliability, and detection range increase with increasing cost. Contact local FWD offices prior to ordering transmitters to avoid overlap of frequencies with other research projects in the Study Area or vicinity.

Standard Bat Survey Protocols 32
2. Standard Protocols
2.1. Protocol: Presence/Not detected & Relative Abundance
2.1.1. Office procedures
• Review this manual and accompanying data sheets, including BSOD (Biodiversity Species Observation Database) loadforms (capture and acoustic data should be included in BSOD loadforms and submitted to FWD upon project completion).
• Obtain appropriate research permits from FWD staff. • Ensure that the Project Description Form and Survey Description Form are filled out. • Obtain suitable maps of the project area. • Based on the maps and other knowledge of the project area (previous reports, local resource
specialists) identify Study Areas and Study Sites at which sampling will take place. It may also be useful to identify specific Habitats within or across Study Sites that are of most interest. Properly identified objectives will hasten this process.
• Consult the FWD website for current bat range maps in Alberta (also refer to van Zyll de Jong (1985) and Smith (1993) for species distribution information) in order to compile a checklist of potential bats to be encountered in the Project area. Discuss the bat community with local resource specialists and amateur naturalists to further refine the expected list.
2.1.2. Sampling design
• Presence/not detected: Non-random. • Relative abundance: Stratified random sampling. Stratify project area (e.g., different habitat types,
stand age classes, etc.), and establish Study Areas, Study Sites, and Design Components that allow you to sample randomly within each Habitat. Use the same type of detectors and capture devices throughout study.
2.1.3. Review of Survey Design Hierarchy
2.1.3.1. Capture:
For each Study Area in a Survey, identify Study Sites will be identified that can be visited on suitable nights. In general, only one Study Site can be visited by a crew of 2-3 people on a given night for the purpose of capturing bats. Study Sites may encompass single or multiple Habitats, which should be listed on the Survey Description Form. Single or multiple Capture Stations may be placed within a given Habitat at a given Study Site, all of which should be described using Habitat Description Data Sheets. The Capture Stations will be situated at locations where bats are likely to be captured (see section 1.4.1.5). Capture Mechanisms (mistnets or harp traps) will be placed at Capture Stations within the Study Site. Capture Stations may consist of single or multiple Capture Mechanisms.
For example, at the Tawayik Lake Study Site in the Elk Island N.P. Study Area, three Capture Stations were established. Capture Stations 1 and 2 consisted of single 6m mistnets strung across trails at ground height in the BM-d1.4 – low-bush cranberry Aw Habitat. Capture Station 3 consisted of two 12 m mistnets in an ‘L’ conformation over open water in the BM-l1.1cattail marsh Habitat. Thus, four Capture

Standard Bat Survey Protocols 33
Mechanisms were placed at three Capture Stations in two different Habitats. On another night at the Moss Lake Study Site, four Capture Stations were established. Capture Station 1 consisted of single 6 m mistnet strung across a trail at ground height in the BM-d1.4 – low-bush cranberry Aw Habitat. Capture Station 2 consisted of a single 6 m mistnet elevated on double poles across a trail, and Capture Station 3 consisted of two 9 m mistnets strung together on a double set of poles (forming a single 6 × 9 m capture mechanism) across a small clearing in the same Habitat. Capture Station 4 consisted of a single harp trap placed on a small overgrown trail in the same Habitat. Thus, at this Study Site, 5 Capture Mechanisms were placed at 4 Capture Stations in a single Habitat. Descriptions of Capture Stations and Capture Mechanisms, the timing and conditions at the start and end of sampling, and all of the characteristics of captured bats should be recorded on the Bat Capture Data Sheet.
2.1.3.2. Ultrasonic Detection
As for bat captures, for each Study Area in a Survey, Study Sites will be identified that can be visited on suitable nights. In general, only one Study Site can be visited by a crew of 2-3 people on a given night. However, if ultrasonic detectors are being used remotely, it is possible to visit more than one Study Site on a given night. Each Study Site may encompass a single or multiple Habitats, which should be listed on the Survey Description Form. Design Components (Detector Stations or Detector Transects) may be set up in each Habitat. Detector Stations are single points in space sampled for bat activity. One or several ultrasonic detectors may be used at a Detector Station, depending on the type of ultrasonic detector. As discussed above, point sampling with ultrasonic detectors may be heavily biased by individual bats repeatedly flying over the detector. Detectors may be hand-held or left remotely at the Station. The other type of Design Component is a Detector Transect, where transects of standard length within individual Habitats are walked by an observer carrying a single or multiple ultrasonic detectors. Transects have the advantage of minimizing the chances of repeatedly detecting the same individual flying back and forth over the detector, but require a much greater number of observers if multiple Habitats are being compared, as they must be sampled simultaneously. Both Stations and Transects should be randomly placed within Habitats, and not approach or cross boundaries between Habitats. If broadband (countdown or time-expansion) detectors are used, only one detector is required at each Station or Transect, as all frequencies are monitored simultaneously. Broadband detectors will be used in conjunction with a computer, tape recorder, or compact flash memeory card to monitor bat activity. If a tunable (heterodyne) detector is being used, the observer can scan through three frequencies (20, 30, and 40 kHz) at 5 min. intervals, or if multiple detectors are available, they can be tuned to each of the different frequencies for set durations.
If the goal is to compare bat activity between Habitats, then detectors (single countdown or multiple tunable set at different frequencies) must be used in all target Habitats at the same time and for the same duration. For remote monitoring systems the latter can be achieved by using a standard tape length. However, for hand-held detectors, if voice-activated microcassette recorders are used, or if a delay switch is used to automatically turn on the tape recorder when bats are detected, the observer must ensure that the sampling duration remains constant between Design Components. The same brand and model of ultrasonic detector should be used throughout each study, as detector type may influence detection efficiency (Thomas and West 1984, Waters and Walsh 1994).
In general, because bat activity is influenced by a variety of factors, including temperature, wind, precipitation, lunar phase, season, and insect availability, meaningful comparisons between different Habitats or Study Sites cannot be made if sampling takes place on different nights, unless sample sizes are very large. Sampling multiple Habitats at the same time can be easily achieved using remote ultrasonic detectors. If detectors must be hand held, or if Transects are the Design Component used, then multiple observers must be available to man the detectors in each habitat. If mist-netting, two-person field crews cannot adequately sample with ultrasonic detectors, other than using them to identify centres of high

Standard Bat Survey Protocols 34
activity for placing Capture Mechanisms, as they must stay with and regularly check the mistnets. Therefore, using ultrasonic detectors in conjunction with Capture Mechanisms will not be useful for between Habitat comparisons, unless at least one observer is dedicated to managing the ultrasonic detectors. Comparing bat activity at a Study Site and the number of bat captures is a good way to determine if Capture Mechanisms are being used efficiently.
All Design Components (Stations or Transects) sampled at a given Study Site should be described using Habitat Description Data Sheets. Descriptions of Detector Stations or Transects, the timing and environmental conditions at the start and end of sampling, and the number of bat passes and feeding buzzes heard in each frequency category or for each taxon code should be recorded on the Bat Detection Data Sheet.
2.1.4. Sampling effort
• Effectively, only one Study Site per night can be sampled (mistnetting and manual ultrasonic detection) by a team of two to three people. Two person teams are adequate if remote detector systems are available and set in place in advance. Manning mistnets generally requires at least two people, and those people can not listen to ultrasonic detectors at the same time as taking bats out of mistnets. To avoid biasing ultrasonic detector data (i.e., only detecting when no bats are caught in mistnets), at least three people or more will be required if mistnetting and manual ultrasonic detectors are to be used simultaneously.
• When using remote detector systems, the number of Detection Stations sampled is limited only by the number of ultrasonic detectors available.
• Each Study Site should be sampled more than once, and effort should be made to maximize replication. The confidence in the results will increase with repeated sampling of the same Study Site at different times of the year.
• For larger scale geographic areas, it is recommended that at least two circuits of the Project area be made during the sampling season to account for seasonal variation in distribution or abundance.
2.1.5. Personnel
• All crew members should have up-to-date vaccinations against rabies. • The crew leader must be a biologist with experience in mistnetting, identifying local bat species, and
other field procedures. • At least one crew member should be familiar with the use of ultrasonic detectors. • At least two crew members are needed for mistnetting, unless you are using rebar to stabilize nets in
which case one person may be able to work alone. • If recording reference calls using the light stick method, a minimum of one person is needed to follow
the bat with a detector. When collecting reference calls using a spotlight, two people are required: one to shine the light on the bat as it flies, and the other to follow with the bat detector.
2.1.6. Equipment
2.1.6.1. General
• ‘Hands-free’ headlamp (e.g., Petzel) with spare batteries and bulb, for each field crew member. • Thermometer.

Standard Bat Survey Protocols 35
• Field note books. • Data sheets and hard surface to write on (e.g., clipboard). • Compass. • Global Positioning System (GPS) unit.
2.1.6.2. Capture
• Harp traps and/or Mistnets with poles, guy lines and tent pegs (optional) • Spotlight (optional). • Rebar and hammer (optional). • Close-fitting leather (e.g. soft deer skin for flexibility) or cotton gloves. • Small scissors (to cut net strings if necessary). • Cloth holding bags (for holding captured bats). • Pesola spring scale (>50 g capacity) or digital scale. • Dial calipers (to measure forearm). • Small ruler (to measure ear, foot, etc.) • Identification key (Appendix 1; see also van Zyll de Jong 1985; Nagorsen and Brigham 1993). • Camera with macro-lens and flash (to record voucher photos).
2.1.6.3. Manual Ultrasonic Detection
• Bat detectors with new or fully charged rechargeable batteries. • Spare batteries. • For countdown or time-expansion detectors, a tape recorder or laptop computer to record the calls.
2.1.6.4. Remote Ultrasonic Detection
• Bat detectors with new or fully charged rechargeable batteries. • Spare batteries for all equipment • If weight is not a concern all remote detection equipment can be run off external 12V batteries, which
require changed less often than internal batteries. Solar panels can be used to keep 12V batteries charged if long term monitoring is desired without maintenance.
• Analog or digital recorder(s) for use with detectors(s) • Talking clocks, timers, or delay switches (if appropriate) • The equipment should be protected by waterproof containers with a hole cut for the microphone. • Stands raising the detectors at least 1 m off the ground are recommended in forest habitats.
2.1.6.5. Recording Reference Calls
• Miniature light tags with Surgical adhesive (e.g., Skinbond®), or powerful spotlight • Microcassette recorder(s) for voice notes • Bat detector (countdown or time-expansion) and recording equipment (analog or digital recorder or
computer)

Standard Bat Survey Protocols 36
2.1.7. Preliminary fieldwork
• Landowners should be contacted for permission to sample on private land well in advance.
• During the day, all personnel should visit the Study Site in order to determine access, locate suitable areas for Capture Stations or Detector Stations and/or Transects, set up equipment, and make sure detectors are working.
• Generate a habitat description for each Habitat at the Study Site (Habitat Description Data Sheet).
2.1.8. Field Procedures
2.1.8.1. Capture
• At least two crew members are needed for mistnetting and harp trapping. • Up to six mistnets and several harp traps can be set up and managed by the two workers at a
particular Study Site. A Capture Station may consist of more than one mistnet or harp trap. • Environmental conditions (e.g., air temperature, cloud cover, wind, precipitation) at the start and end
of sampling should be recorded (see Bat Capture Data Sheet). • Capture Mechanism placement:
• Place mistnets or harp traps near roosts, near openings to caves, mines or buildings, over streams, ponds, and small bodies of calm water, perpendicular to flyways such as trails, cut-lines, and tertiary roads, and in small clearings or along the edge of large clearings or river valleys. Note that netting directly in front of day roost openings should be avoided because of potential disturbance to maternity colonies.
• An ultrasonic detector can be used to verify bat activity and thus ensure nets are set up at productive sites.
• Capture Mechanisms should be positioned to take advantage of topographic and vegetative features that could be used to ‘funnel’ bats into the nets (see Figs. 4 - 6).
• When setting mistnets across streams or trails, capture success is increased if the net is positioned beneath overhanging branches or canopy, which tend to channel bats into the net (Figure 4, see Section 1.4.1.5). Often the spaces around nets can be closed by using loose, dead branches or rope, which tends to encourage bats to fly through the area occupied by the net. Setting mistnets on or just before bends or corners may also increase success.
• Mistnets should be set at several different heights to increase the chances of catching all species, and canopy nets (see Figure 3) should be used whenever possible. Netting success may also be increased by placing multiple mistnets in ‘T’, ‘L’, or ‘V’ conformations.
• If netting on successive nights in the same area, the location of the mistnets should be changed each night to increase capture rate.
• Mistnets should not be opened before dusk, to prevent catching birds. Occasionally owls and goatsuckers may be caught. Owls should be removed from the net by getting a firm hold of the feet (to protect the crew member); the beak is usually not a concern.
• Record the time each mistnet was opened and closed on the Bat Capture Data Sheet. Use the midpoint start and end times to calculate the total time sampled, net hours (one net hour is equal to one 12 × 3 m mistnet open for one hour), etc.
• Mistnets should be in place from the time they are opened at evening twilight to at least two hours afterwards, depending on levels of bat activity. Capture success will typically decline as the night progresses, but will increase again as morning twilight approaches if temperatures remain warm.

Standard Bat Survey Protocols 37
Species diversity of captures will often change throughout the night as certain species feed longer than others (B. Chruszcz, pers. comm..).
• Harp traps do not require constant attention. However, they should be checked hourly when pregnant or lactating females are likely to be caught.
• Each mistnet should be checked at least every 10-15 minutes. Bats should be removed from a net from the same side as they entered, as determined by the position of the pocket relative to the shelf cord that separates each shelf (Figure 2; Kunz and Kurta 1988). Bats removed quickly from the net typically become less tangled and do less damage to the net. It may help to wear a close-fitting leather or a cotton glove on the left hand (for right-handed individuals). This gives a bat something to chew on other than your hand. There is no agreed upon method for removing a bat from a mistnet. Freeing the tail or a wing first seems to work well. Carrying a pair of small scissors (e.g., in a Swiss Army knife or multi-tool) to cut net strings for hopelessly entangled bats or birds is advisable.
• When a bat is captured, it should be removed immediately and placed in a cotton draw-stringed holding bag.
• Placing captured bats in cloth bags and hanging these near or on the harp trap or mistnet will often attract other bats to the area.
• Lactating females or those in late stages of pregnancy should not be held for extended periods of time, but should be released after processing at their site of capture.
• Bats should not be weighed until at least an hour after capture to allow food to clear the digestive tract. Holding bats for greater than one hour is not recommended and unnecessary if the nets are not extremely busy.
• The species, sex, age, reproductive condition, mass, and forearm length of each bat should be recorded (see Section 1.4.1.6) as indicated on the Bat Capture Data Sheet. Note that for certain species which are difficult to identify using the key in Appendix 1, other morphometric measurements should be taken. These measurements may include length of the tragus, ear, hind foot, tibia, or third and fifth metacarpals.
• Bats are released by letting them fly off the hand or placing them on a tree trunk to fly off on their own accord. If bats have become torpid, they will need to be re-warmed in the hand before release. DO NOT throw the bat into the air, and take great care to watch the bat fly off of your hand to make sure that it has not landed on the ground and is in distress.
2.1.8.2. Ultrasonic Detection
• During the day, battery levels of the detector components (e.g., detectors, voice activated tape recorders, talking clocks, etc.) should be checked.
• If possible, ultrasonic detectors should be calibrated using a pure tone to determine their accuracy at detecting the target frequency before the commencement of field work (Thomas and West 1984). In addition, detection distance should be assessed by playing constant intensity sounds at varying distances from each ultrasonic detector. This is especially important when using different detectors at the same time, for example to compare habitats, to rule out differences between detectors as a source of variation.
• One crew member should be designated for set up and monitoring of the bat detection equipment and data collection.
• For remote ultrasonic detection, detector systems (e.g., heterodyne detectors with talking clocks and voice activated tape recorder, countdown systems with delay switches or timers, and analog or digital recorders) are set up in the Habitats of choice. The location of the Detection Stations may be similar to those chosen for capturing bats.

Standard Bat Survey Protocols 38
• If different Habitats are being compared, the start time, duration of sampling period, and detector model should be the same for all Habitats, and all target Habitats should be sampled for bat activity simultaneously.
• Any Detector Stations or Transects, the type and model of the ultrasonic detector, whether it is hand-held or remote, and the timing and environmental conditions at the start and end of the sampling period for each Study Site should be recorded on the Bat Detection Data Sheet.
Heterodyne Detectors
• For manual detection with tunable narrow band detectors, the crew member should monitor at frequencies of 20 kHz, 30 kHz, and 40 kHz, allowing for discrimination of three species groups (hoary bats, big brown/silver-haired, and Myotis spp., respectively). Using multiple detectors set at the three different frequencies is preferable, in which case the detectors can be left at a particular frequency for the duration of the sampling period. If only one detector is available for a given Detector Station or Transect, each frequency should be monitored for 5 min intervals. In either case, the duration of the sampling period at each frequency and the number of bat passes and feeding buzzes heard should be recorded on the Bat Detection Data Sheet.
• For remote detection with heterodyne systems, detectors set at 20, 30, and 40 kHz and associated tape recorders should be set up at each detector station in target Habitats. Talking clocks may be used if voice-activated microcassette recorders are used. If only two tunable detectors are available for each Station, they should be set at 25 kHz and 40 kHz (allowing for discrimination of large-bodied bats and Myotis spp. bats, respectively; further discrimination of hoary bats from big brown/silver-haired bats requires an experienced observer, but may be based on call repetition rate). Each detector should have its own talking clock and recorder. If voice activated tape recorders are used, they should be calibrated so they are set off by the talking clock and bat recorder but not by background noise (e.g., wind, rain, insects, frogs). Detectors may be collected in the morning. The tape should be labelled and tested. If habitats are being compared (i.e., relative abundance), it is imperative to have equipment set up in all target Habitats at the same time and for the same duration. To ensure the detector set-ups are synchronized, detectors should be set up at least one-half hour before sunset and the exact time each is put in place noted.
• The time spent at each frequency, and the number of bat passes and feeding buzzes detected at each frequency should be recorded on the Bat Detection Data Sheet.
Countdown or Time-expansion Systems
• For manual detection with broad band detectors, continuous monitoring may be accomplished by recording directly to an analog or digital recorder, or a computer. Calls may then be analyzed after sampling is completed. With the Anabat system, the zero-crossing analysis module (ZCAIM) and delay switch can be used with a portable computer. Similarly, Pettersson software allows for real-time monitoring of activity using a computer. Alternatively, calls may be recorded on tape first, and then digitized and analyzed using computer software.
• For remote monitoring, detector systems (detectors, tape recorders or CF-ZCAIM, and appropriate timing devices) should be set up at least one-half hour before sunset and the exact time each is put in place noted. Detector systems may be collected in the morning. The tape should be labeled and tested. If habitats are being compared (i.e., relative abundance), it is imperative to sample all target Habitats simultaneously for the same duration. Tapes are analyzed to determine the number of bat passes, minutes of bat activity by species, and compared with reference calls to identify species or species groups.

Standard Bat Survey Protocols 39
• After appropriate analysis, the total time monitored, and the number of bat passes and feeding buzzes detected should be recorded on the Bat Detection Data Sheet, broken down by species groups as listed in the coding instructions.
2.1.8.3. Recording Reference Calls
• After bats are captured (see above), light tags are activated by breaking the inner capsule in miniature light sticks.
• A small amount of Skinbond® surgical adhesive is applied to the activated light tags, then attached to the back (for low flying bats, e.g., M. lucifugus) or abdomen (for higher flying species, e.g., E. fuscus) of the bat.
• Once the tag is affixed, or the spotlight is charged and ready, the bat should be released in an area of low bat activity and the echolocation calls recorded as the bat departs. Forest clearings make good release sites as the bat will tend to circle several times before flying out of range. It should be noted that the reference recordings obtained are dependent on the habitat type, as bats change their call structure in different habitats.
• For behavioural observations, numerous observers (as many as possible) should be stationed at points in the study area where the light tagged bats may be observed. Voice records of bat observations can be collected on tape recorders.
2.1.9. Data analysis
• For each study area, the number of species captured or detected should be tabulated. • For each species, sex, and reproductive class (if known) the following should be calculated:
• Number of bats caught per net-night or per hour (a net-night is equivalent to one 6 m length of net set up for one night).
• Number of bats caught per night or hour of harp trapping. • Number of bat passes/unit time. • Number of feeding buzzes/unit time.
2.2. Protocol: Absolute Abundance
2.2.1. Office procedures
• Review this manual and the accompanying data sheets. • Obtain appropriate research permits from FWD staff. • Ensure that the Project Description Form and Survey Description Form are filled out. • Obtain suitable maps of the project area. Based on the maps and other information (previous reports,
local resource specialists) identify potential roost sites. Properly identified objectives will hasten this process.
• Consult Table 1 for summer roost preferences for species of bat likely to be encountered in the project area. Discuss the bat community with local resource specialists and amateur naturalists to further define potential roost sites.
• Identify meaningful species groups that cannot be identified on the basis of their morphology or echolocation call characteristics and fill out the Taxonomic Code Form.
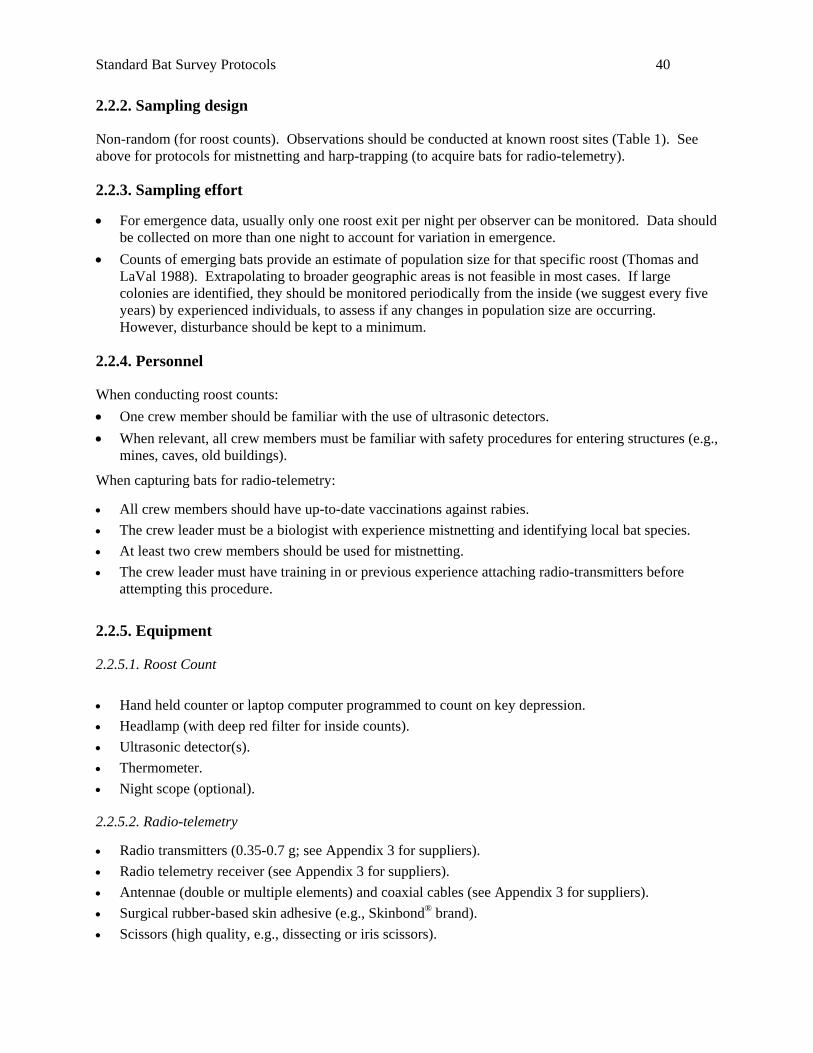
Standard Bat Survey Protocols 40
2.2.2. Sampling design
Non-random (for roost counts). Observations should be conducted at known roost sites (Table 1). See above for protocols for mistnetting and harp-trapping (to acquire bats for radio-telemetry).
2.2.3. Sampling effort
• For emergence data, usually only one roost exit per night per observer can be monitored. Data should be collected on more than one night to account for variation in emergence.
• Counts of emerging bats provide an estimate of population size for that specific roost (Thomas and LaVal 1988). Extrapolating to broader geographic areas is not feasible in most cases. If large colonies are identified, they should be monitored periodically from the inside (we suggest every five years) by experienced individuals, to assess if any changes in population size are occurring. However, disturbance should be kept to a minimum.
2.2.4. Personnel
When conducting roost counts: • One crew member should be familiar with the use of ultrasonic detectors. • When relevant, all crew members must be familiar with safety procedures for entering structures (e.g.,
mines, caves, old buildings).
When capturing bats for radio-telemetry:
• All crew members should have up-to-date vaccinations against rabies. • The crew leader must be a biologist with experience mistnetting and identifying local bat species. • At least two crew members should be used for mistnetting. • The crew leader must have training in or previous experience attaching radio-transmitters before
attempting this procedure.
2.2.5. Equipment
2.2.5.1. Roost Count
• Hand held counter or laptop computer programmed to count on key depression. • Headlamp (with deep red filter for inside counts). • Ultrasonic detector(s). • Thermometer. • Night scope (optional).
2.2.5.2. Radio-telemetry
• Radio transmitters (0.35-0.7 g; see Appendix 3 for suppliers). • Radio telemetry receiver (see Appendix 3 for suppliers). • Antennae (double or multiple elements) and coaxial cables (see Appendix 3 for suppliers). • Surgical rubber-based skin adhesive (e.g., Skinbond® brand). • Scissors (high quality, e.g., dissecting or iris scissors).

Standard Bat Survey Protocols 41
• Portable soldering iron (e.g., butane pen type). • Solder.
2.2.6. Preliminary fieldwork
• Landowners should be contacted in advance for permission to sample on private land. • During the day, all personnel should visit the Study Area or Site in order to determine access, and
when applicable, locate suitable areas for Capture Stations, set up equipment, and make sure detectors are working.
• Generate a habitat description of the Study Site or Roost location (Habitat Description Data Sheet).
2.2.7. Field procedures
2.2.7.1. Roost Counts
• Caution! Roost sites should only be entered with extreme care, preparation, and for a worthwhile purpose, as this causes disturbance to roosting bats and may lead to abandonment of roosts. Entering roosts may also cause structural damage to the roost (e.g., dead trees, abandoned mines).
• Identify potential roost sites such as suitable wildlife trees, cliffs, buildings, caves, and mines (Table 1). Roost-sites may be identified using radio-telemetry (see protocol below).
• Once a roost is located, determine whether an emergence count (bats are observed emerging at dusk) or an inside count is most appropriate.
• For emergence counts, station an observer at a good viewpoint one half hour before dusk. Ensure that all exits from the roost are identified and monitored and any bats that re-enter the roost are accounted for. For large or rapid emergence events, the exact time of emergence of each individual will be difficult to record. At least the time of first emergence should be recorded.
• If possible, emergence data should be collected on more than one night. • If necessary, capture bats inside the roost or as they emerge to obtain positive species identification.
However, this will disturb bats and they may not return to the roost that night.
• For inside roost counts, use direct counting method when bats are easily visible, or use surface area and packing density to estimate numbers in larger roosts (see Thomas and LaVal 1988).
• Use red lights (e.g. red filter over flashlight) to inspect bats, limiting the time that bats are disturbed.
2.2.7.2. Radio Telemetry
• Once a bat is captured (see Section 1.4.1), weigh it and evaluate whether to radio-tag based on 5% rule, sex, and current reproductive state.
• Activate the radio-transmitter (this may require removing a magnet, or soldering a wire connection) and verify that it is working with a receiver. Check and record the frequency.
• Hold the bat on a soft surface (e.g., bat bag), and carefully clip an area of hair between the shoulder blades approximately the size of the radio-transmitter. Be sure not to clip the skin of the bat. If the bat is cut, do not attach a radio-transmitter. This bat must either be immediately released if the cut is very small, or maintained in captivity for a short period to assess infection. See details in Wilson (1988) on maintaining captive bats for short periods.

Standard Bat Survey Protocols 42
• Once the hair is shortened, apply a small amount of surgical adhesive (e.g., Skinbond®) to the clipped area, and to the surface of the transmitter that will be in contact with the bat. Allow the glue to become tacky (i.e., when it begins to bubble; approximately 2-3 minutes).
• Place the transmitter on the bat, and hold in place for approximately 3 to 5 minutes. The transmitter should be placed between the shoulder blades, with the antennae oriented towards the posterior of the bat. Do not place the transmitter so high up on the back that the bat cannot properly move its head.
• Once radio-tagged, the bat should be released as appropriate (within 1 hour if a lactating female), • Radio-tracking can be conducted on foot, by vehicle (mounting the antenna on a pole or making
frequent stops), or by plane or helicopter. • Track the radio-tagged bat to the roost during the next day. Note that the first roost selected by the
bat after being released may be biased due to stress resulting from capture and handling. In this case, the data from the first roost may not be valid, and should generally not be used. However, if the bat is not roosting alone (i.e., with bats that were not stressed by the radio-tagging procedure), then it may be used.
• Observe and count the emergence of bats from the roost that evening. For tree-roosting bats, which switch roosts regularly, waiting to watch the emergence on a different night may result in missed opportunities to determine colony size.
2.2.8. Data analysis
• Number and density of each species, sex, and age class (if known and applicable) for roost sites. • Number of bats emerging, and the time of emergence • Emergence location at the roost (e.g., tree cavity, under building roof, multiple exits from an attic)

Handbook of Inventory Methods and Standard Protocols - Glossary 43
Glossary ABUNDANCE: An estimate of the number of individuals in a population. Absolute abundance is expressed as number present per area (density), but this can not be reliably assessed for bats in most cases. Relative abundance is expressed as number caught or detected per unit time (frequency). Relative abundance can be compared between localities or over time, but reliable comparisons of relative abundance can not be made between different species of bat.
BAT DETECTOR: Any device used to render the ultrasonic calls of a bat audible to the unaided human ear.
BAT-PASS: A sequence of two or more echolocation calls registered as a bat flies within range of an ultrasonic detector. Used to measure relative bat activity.
BIODIVERSITY: The variety of life forms, the ecological roles they perform, and the genetic diversity they contain.
COUNTDOWN DETECTOR: An ultrasonic detector that divides the frequency of an incoming ultrasonic signal by a user-defined factor, thus bringing the signal into the human range of hearing.
DENIER: The number of grams in 9000 metres of fibre. A unit for measuring how fine mistnets are. The lower the number, the finer the net.
ECHOLOCATION: The use of acoustic signals by animals to locate objects or prey in their environment. Often in the ultrasonic range. The most sophisticated form of echolocation is used by bats.
EPIPHYSEAL PLATES: Cartilaginous areas where growth takes place in bones. Their shape in finger joints can be used to differentiate juvenile from adult bats (see Figure 8).
FEEDING BUZZ: The characteristic high repetition-rate of echolocation calls given by a bat as it closes in and attacks a potential prey item.
FLY-WAY: Any corridor used by bats for foraging or commuting between roost and foraging areas. Fly-ways make excellent sites for capturing bats in mistnets and harp traps. Often delimited by physical structures, such as vegetation or buildings.
FREQUENCY: A measure of the number of cycles in the propagation of a (sound) wave. Measured in Hertz or kiloHertz.
HARP TRAP: A specialized trap designed exclusively for capturing bats.
HIBERNACULUM: Any overwintering site used by hibernating bats. Bats in hibernacula are particularly vulnerable to human disturbance.
KILOHERTZ (kHz): A unit to measure frequency. One hertz is equal to one cycle per second.
LACTATION: The period of milk production by female mammals nursing young.
NET-NIGHT: A measure of mistnetting effort. One net-night is equivalent to setting up one 6 m length of net for one evening.

Handbook of Inventory Methods and Standard Protocols - Glossary 44
OVERWINTERING STRATEGY: The behaviour exhibited by species or individuals at times outside the breeding season. This can include either migration or hibernation.
PRESENCE/NOT DETECTED: A survey intensity that verifies that a species is present in an area, or states that it was not detected (thus not likely to be in the area, but still a possibility).
PROJECT AREA: An area, usually politically or economically determined, for which an inventory project is initiated. A project boundary may be shared by multiple types of resource and/or species inventory. Sampling generally takes place within smaller study areas within this project area.
RANDOM SAMPLE: A sample that has been selected by a random process, generally by reference to a table of random numbers.
ROOST: Any site used by bats for rest, sleep, torpor, food digestion, shelter etc. A distinction can be made between DAY and NIGHT roosts. Day roosts tend to be used on a more permanent basis, whereas night roosts are sites used temporarily at night between foraging bouts.
ROOSTING STRATEGY: The behaviour exhibited by roosting bats. Bats may either be solitary or colonial.
SONOGRAM: A visual display of the time (x-axis) and frequency (y-axis) components of a sound.
STRATIFICATION: The separation of a sample population into non-overlapping groups based on a habitat or population characteristic that can be divided into multiple levels. Groups are homogeneous within, but distinct from, other Habitats.
STUDY AREA: A discrete area within a project boundary in which sampling actually takes place. Study areas should be delineated to logically group samples together, generally based on habitat or population stratification and/or logistical concerns.
STUDY SITE: A discrete location within a Study Area where a series of Design Components (Capture Stations, Detector Stations or Transects, or Roosts) are situated during a single visit. Study Sites are locations where observations are made on a single night.
SURVEY: The application of one method to one taxonomic group for one season.
SYSTEMATIC SAMPLE: Samples are selected at a predetermined interval or frequency (e.g., every 10 m along a transect). Contrasted with random sample (q.v.).
TIME-EXPANSION SYSTEM: Circuitry that allows echolocation calls to be slowed down by a fixed factor, and thereby reduced in frequency by that same factor. Often coupled with a tape recorder or computer software to allow for recording of entire calls, including all harmonics.
TORPOR: An energy saving behaviour during which a bat lowers its metabolic rate and body temperature and enters an inactive state.
TUNABLE NARROWBAND DETECTOR: An ultrasonic detector with heterodyne circuitry that uses an internally generated pure tone to render ultrasonic signals at the tuned frequency audible. Can only measure a narrow (3-5 kHz) frequency band at any one time.
ULTRASONIC: Any sound above 20 kHz, which is generally inaudible to human hearing.

Handbook of Inventory Methods and Standard Protocols - Glossary 45
VERSPERTILIONIDAE: The taxonomic family to which all bats found in Canada belong. The so-called 'mouse-eared' or 'plain-nosed' bats.
VOLANT: Possessing the ability to fly.

Handbook of Inventory Methods and Standard Protocols - Literature Cited 46
Literature Cited Alberta Sustainable Resource Development. 2000. The general status of wild species. Alberta
Environment, Publication No. 1/023.
Aldridge, H. D. J. N., and R. M. Brigham. 1988. Load carrying and maneuverability in an insectivorous bat: a test of the 5% rule of radio-telemetry. Journal of Mammalogy 69:379-382.
Altringham, J. D. 1996. Bats: Biology and Behaviour. Oxford University Press, Oxford. 262 pp.
Anthony, E. L. P. 1988. Age determination in bats. Pp. 47-57 IN T. H. Kunz (ed.). Ecological and Behavioral Methods for the Study of Bats. Smithsonian Institution Press, Washington, DC. 533 pp.
Archibald, J. H., G. Klappstein, and I. G. W. Corns. 1996. Field Guide to Ecosites of Southwestern Alberta. University of British Columbia Press, Vancouver.
Barclay, R. M. R. 1986. The echolocation calls of hoary (Lasiurus cinereus) and silver-haired (Lasionycteris noctivagans) bats as adaptations for long- versus short-range foraging strategies and the consequences for prey selection. Canadian Journal of Zoology 64:2700-2705.
Barclay, R. M. R. 1991. Population structure of temperate zone insectivorous bats in relation to foraging behaviour and energy demand. Journal of Animal Ecology 60:165-178.
Barclay, R. M. R. 1999. Bats are not birds – a cautionary note on using echolocation calls to identify bats: a comment. Journal of Mammalogy 80:290-296.
Barclay, R. M. R. and G. P. Bell. 1988. Marking and observational techniques. Pp. 59-76 IN T. H. Kunz (ed.). Ecological and Behavioral Methods for the Study of Bats. Smithsonian Institution Press, Washington, DC. 533 pp.
Barclay, R. M. R., and R. M. Brigham (eds.). 1996. Bats and Forest Symposium. Proceedings of First International Bat-Forest Interactions Symposium. Held at Victoria, B.C., 19-21 October 1995. Research Branch B.C. Ministry of Forests, Victoria, B.C. Working Paper 23/1996. 292 pp.
Beckingham, J. D., and J. H. Archibald. 1996. Field Guide to Ecosites of Northern Alberta. University of British Columbia Press, Vancouver.
Beckingham, J. D., I. G. W. Corns, and J. H. Archibald. 1996. Field Guide to Ecosites of West-central Alberta. University of British Columbia Press, Vancouver.
Betts, B. J. 1998. Effects of interindividual variation in echolocation calls on identification of big brown and silver-haired bats. Journal of Wildlife Management 62:1003-1010.
Brigham, R. M., J. E. Cebek, and M. B. C. Hickey. 1989. Intraspecific variation in the echolocation calls of two species of insectivorous bats. Journal of Mammalogy 70:426-428.
Charif, R. A., S. Mitchell, and C. W. Clark. 1995. Canary 1.2 Users’ Manual. Cornell Laboratory of Ornithology. Ithaca, New York. 171 pp.
Constantine, D. G. 1958. An automatic bat-collecting device. Journal of Wildlife Management 22:17-22.
Downes, C. M. 1982. A comparison of the sensitivities of three bat detectors. Journal of Mammalogy 63:343-345.
Fagerstone, K.A., and B.E. Johns. 1987. Transponders as permanent identification markers for domestic ferrets, black-footed ferrets, and other wildlife. Journal of Wildlife Management 51:294-297.

Handbook of Inventory Methods and Standard Protocols - Literature Cited 47
Faure, P. A., J. H. Fullard, and R. M. R. Barclay. 1990. The response of tympanate moths to the echolocation calls of a substrate gleaning bat, Myotis evotis. Journal of Comparative Physiology A 166:843-849.
Fenton, M. B. 1970. A technique for monitoring bat activity with results obtained from different environments in southern Ontario. Canadian Journal of Zoology 48:847-851.
Fenton, M. B. 1985. Communication in the Chiroptera. Indiana University Press, Bloomington. 161 pp.
Fenton, M. B. 1988. Detecting, recording and analyzing vocalizations of bats. Pp. 91-104 IN T. H. Kunz (ed.). Ecological and Behavioral Methods for the Study of Bats. Smithsonian Institution Press, Washington, DC. 533 pp.
Fenton, M. B., and G. P. Bell. 1981. Recognition of species of insectivorous bats by their echolocation calls. Journal of Mammalogy 62:233-243.
Fenton, M. B., S. Bouchard, M. J. Vonhof, and J. Zigouris. 2001. Time expansion and zero-crossing period meter systems present significantly different views of the echolocation calls of bats. Journal of Mammalogy 82:721-727.
Fenton, M. B., H. G. Merriam, and G. L. Holroyd. 1983. Bats of Kootenay, Glacier and Mount Revelstoke National Parks in Canada: identification by echolocation calls, distribution and biology. Canadian Journal of Zoology 61:2503-2508.
Griffin, D. R. 1958. Listening in the dark. Yale University Press, New Haven. 413 pp.
Griffin, D. R. 1971. The importance of atmospheric attenuation for the echolocation of bats (Chiroptera). Animal Behaviour 19:55-61.
Hamilton, W.J., Jr., and J. O. Whitaker, Jr. 1979. Mammals of the Eastern United States. Cornell University Press, Ithaca. 346 pp.
Hovorka, M.D., Marks, C.S., and E. Muller. 1996. An improved chemiluminescent tag for bats. Wildlife Society Bulletin 24:709-712.
Jackson, H.H.T. 1961. Mammals of Wisconsin. University of Wisconsin Press, Madison. 504 pp.
Jones, G., T. Gordon, and J. Nightingale. 1992. Sex and age differences in the echolocation calls of the lesser horseshoe bat, Rhinolophus hipposideros. Mammalia 56:189-193.
Jones, G., and R. D. Ransome. 1993. Echolocation calls of bats are influenced by maternal effects and change over a lifetime. Proceedings of the Royal Society of London B 252:125-128.
Jones, G., K. Sripathi, D. A. Waters, and G. Marimuthu. 1994. Individual variation in the echolocation calls of three sympatric Indian hipposiderid bats, and an experimental attempt to jam bat echolocation. Folia Zoologica 43:347-362.
Kalcounis, M. C. and R. M. Brigham. 1995. Intraspecific variation in wing loading affects on habitat use by little brown bats (Myotis lucifugus). Canadian Journal of Zoology 73:89-95.
Kalcounis, M. C., K. A. Hobson, R. M. Brigham, and K. R. Hecker. 1999. Bat activity in the boreal forest: importance of stand type and vertical strata. Journal of Mammalogy 80:673-682.
Kalko, K. V., and H. U. Schnitzler. 1993. Plasticity in echolocation signals of European pipistrelle bats in search flight: implications for habitat use and prey detection. Behavioral Ecology and Sociobiology 33:415-428.
Kunz, T. H. 1982. Roosting ecology. Pp. 1-55 IN T. H. Kunz (ed.). Ecology of Bats. Plenum Press, New York.

Handbook of Inventory Methods and Standard Protocols - Literature Cited 48
Kunz, T. H., and E. L. P Anthony. 1977. On the efficiency of the Tuttle bat trap. Journal of Mammalogy 58:309-315.
Kunz, T. H., and C. E. Brock. 1975. A comparison of mistnets and ultrasonic detectors for monitoring flight activity of bats. Journal of Mammalogy 56:907-911.
Kunz, T. H., and A. Kurta. 1988. Capture methods and holding devices. Pp. 1-28 IN T. H. Kunz (ed.). Ecological and Behavioral Methods for the Study of Bats. Smithsonian Institution Press, Washington, DC. 533 pp.
Kunz, T. H., D. W. Thomas, G. C. Richards, C. R. Tidemann, E. D. Pierson, and P. A. Racey. 1996. Observational techniques for bats. Pp. 105-114 IN D. E. Wilson, F. R. Cole, J. D. Nichols, R. Rudran, and M. S. Foster (eds.). Measuring and Monitoring Biological Diversity: Standard Methods for Mammals. Smithsonian Institution Press, Washington, DC. 409pp.
Lewis, S. E. 1995. Roost fidelity of bats: a review. Journal of Mammalogy 76:481-496.
Masters, W. M., K. A. S. Raver, and K. A. Kazial. 1995. Sonar signals of big brown bats, Eptesicus fuscus, contain information about individual identity, age, and family affiliation. Animal Behaviour 50:1243-1260.
Mueller, H. C., and N. S. Mueller. 1979. Sensory basis for spatial memory in bats. Journal of Mammalogy 60:198-201.
Nagorsen, D. W., and R. M. Brigham. 1993. The Mammals of British Columbia. 1. Bats. Royal British Columbia Museum, Victoria, B.C., Canada. UBC Press. 166 pp.
Nagorsen, D. W., A. A. Bryant, D. Kerridge, G. Roberts, A. Roberts, and M. J. Sarell. 1993. Winter bat records for British Columbia. Northwestern Naturalist 74:61-66.
Obrist, M.K. 1995. Flexible bat echolocation: the influence of individual, habitat and conspecifics on sonar signal design. Behavioral Ecology and Sociobiology 36:207-219.
Obrist, M.K., R. Boesch, P. Fluckiger, and U. Dieckmann. 2002. Who’s calling? Acoustic bat species identification revised. Pp. IN J. Thomas, C. Moss, and M. Vater (eds.). Echolocation in Bats and Dolphins. University of Chicago Press, Chicago.
O’Donnell, C.F.J., and J. Sedgeley. 1994. An automatic monitoring system for recording bat activity. Department of Conservation Technical Series No. 5, Department of conservation, Wellington, New Zealand. 16 pp.
O’Farrell, M. J., B. W. Miller, and W. L. Gannon. 1999a. Qualitative identification of free-flying bats using the Anabat detector. Journal of Mammalogy 80:11-23.
O’Farrell, M. J., C. Corben, W. L. Gannon, and B. W. Miller. 1999b. Confronting the Dogma: a reply. Journal of Mammalogy 80:297-302.
Parsons, S. 2001. Identification of New Zealand bat (Chalinolobus tuberculatus and Mystacina tuberculata) in flight from analysis of echolocation calls by artificial neural networks. Journal of Zoology, London 253:447-456.
Parsons, S., A. M. Boonman, and M. K. Obrist. 2000. Advantages and disadvantages of techniques for transforming and analyzing Chiropteran echolocation calls. Journal of Mammalogy 81:927-938.
Parsons, S., and G. Jones. 2000. Acoustic identification of twelve species of echolocating bat by discriminant function analysis and artificial neural networks. Journal of Experimental Biology 203:2641-2656.

Handbook of Inventory Methods and Standard Protocols - Literature Cited 49
Parsons, S., and M. K. Obrist. 2002. Recent methodological advances in the recording and analysis of chiropteran biosonar signals in the field. Pp. IN J. Thomas, C. Moss, and M. Vater (eds.). Echolocation in Bats and Dolphins. University of Chicago Press, Chicago.
Patriquin, K. J., L. K. Hogberg, B. J. Chruszcz, and R. M. R. Barclay. 2003. The influence of habitat structure on the ability to detect ultrasound using bat detectors. Wildlife Society Bulletin 31:475-481.
Pearl, D. L., and M. B. Fenton. 1996. Can echolocation calls provide information about group identity in the little brown bat (Myotis lucifugus). Canadian Journal of Zoology 74:2184-2192.
Racey, P. A. 1988. Reproductive assessment in bats. Pp. 31-43 IN T. H. Kunz (ed.). Ecological and Behavioral Methods for the Study of Bats. Smithsonian Institution Press, Washington, DC. 533 pp.
Russo, D., and G. Jones. 2002. Identification of twenty-two bat species (Mammalia: Chiroptera) from Italy by analysis of time-expanded recordings of echolocation calls. Journal of Zoology, London 258:91-103.
Rydell, J. 1990. Behavioural variation in echolocation pulses of the northern bat, Eptesicus nilssoni. Ethology 85:103-113.
Simmons, J. A., M. B. Fenton, W. R. Ferguson, M. Jutting, and J. Palin. 1979. Apparatus for research on animal ultrasignals. Life Sciences Miscellaneous Publications of the Royal Ontario Museum 1-31.
Smith, H. C. 1993. Alberta mammals: an atlas and guide. Provincial Museum of Alberta, Edmonton. 239 pp.
Swift, S. M. 1980. Activity patterns of Pipistrelle bats (Pipistrellus pipistrellus) in north east Scotland. Journal of Zoology, London 190:285-295.
Thomas, D. W., M. Dorais, and J. M. Bergeron. 1990. Winter energy budgets and cost of arousals for hibernating little brown bats, Myotis lucifugus. Journal of Mammalogy 71:474-475.
Thomas, D. W., G. P. Bell, and M. B. Fenton. 1987. Variation in echolocation call frequencies recorded from North American vespertilionid bats: a cautionary note. Journal of Mammalogy 68:842-847.
Thomas, D. W., and R. K. LaVal. 1988. Survey and census methods. Pp. 77-89 IN T. H. Kunz (ed.). Ecological and Behavioral Methods for the Study of Bats. Smithsonian Institution Press, Washington, DC. 533 pp.
Thomas, D. W., and S. D. West. 1984. On the use of ultrasonic detectors for bat species identification and the calibration of QMC Mini Bat Detectors. Canadian Journal of Zoology 62:2677-2679.
Thomas, D. W., and S. D. West. 1989. Sampling methods for bats. IN A. B. Carey, and L. F. Ruggiero (tech. eds.). Wildlife-Habitat Relationships: Sampling Procedures for Pacific Northwest Vertebrates. U.S. Department of Agriculture, Forest Service, Portland, OR. General Technical Report PNW-GTR-243.
Tidemann, C. R., and D. P. Woodside. 1978. A collapsible bat-trap and a comparison of results obtained with the trap and with mistnets. Australian Wildlife Research 5:355-362.
Tuttle, M. D. 1974. An improved trap for bats. Journal of Mammalogy 55:475-477.
Tuttle, M. D., and D. A. R. Taylor. 1998. Bats and Mines. Bat Conservation International, Inc., Resource Publication No. 3. Austin, Texas.

Handbook of Inventory Methods and Standard Protocols - Literature Cited 50
Vaughan, N., G. Jones, and S. Harris. 1997. Identification of British bat species by multivariate analysis of echolocation call parameters. Bioacoustics 7:189-207.
Vonhof, M.J., and J.C. Gwilliam. 1999. A summary of bat research in the Pend d’Oreille Valley in southern British Columbia. Report prepared for the Columbia Basin Fish and Wildlife Compensation Program, Nelson, B.C.
Vonhof, M.J., and L.C. Wilkinson. 1999. Roosting habitat requirements of northern long-eared bats (Myotis septentrionalis) in the boreal forests of northeastern British Columbia: Year 2. Report prepared for the B.C. Ministry of Environment, Lands and Parks, Fort St. John, B.C.
Voute, A. M., J. W. Sluiter, and M. P. Grimm. 1974. The influence of the natural light-dark cycle on the activity rhythm of pond bats (Myotis dasycneme Boie 1825) during summer. Oecologia 17:221-243.
Waters, D. A. and A. L. Walsh. 1994. The influence of bat detector brand on the quantitative estimation of bat activity. Bioacoustics 5:205-221.
Weller, T. J., V. M. Seidman, and C. J. Zabel. 1998. Assessment of foraging activity using Anabat II: a cautionary note. Bat Research News 39:61-65.
Wilkinson, G. S., and J. W. Bradbury. 1988. Radiotelemetry: techniques and analysis. Pp. 105-120 IN T. H. Kunz (ed.). Ecological and Behavioral Methods for the Study of Bats. Smithsonian Institution Press, Washington, DC. 533 pp.
Wilkinson, L. C., P. F. J. Garcia, and R. M. R. Barclay. 1995. Bat survey of the Liard River watershed in northern British Columbia. Report prepared for the B.C. Ministry of Environment, Lands and Parks, Victoria, B.C. 39 pp.
Wilson, D. E. 1988. Maintaining bats for captive studies. Pp. 247-263 IN T. H. Kunz (ed.). Ecological and Behavioral Methods for the Study of Bats. Smithsonian Institution Press, Washington, DC. 533 pp.
van Zyll de Jong, C. G. 1985. Handbook of Canadian Mammals. 2. Bats. Publication of the National Museum of Natural Sciences, National Museum of Canada. 212 pp.
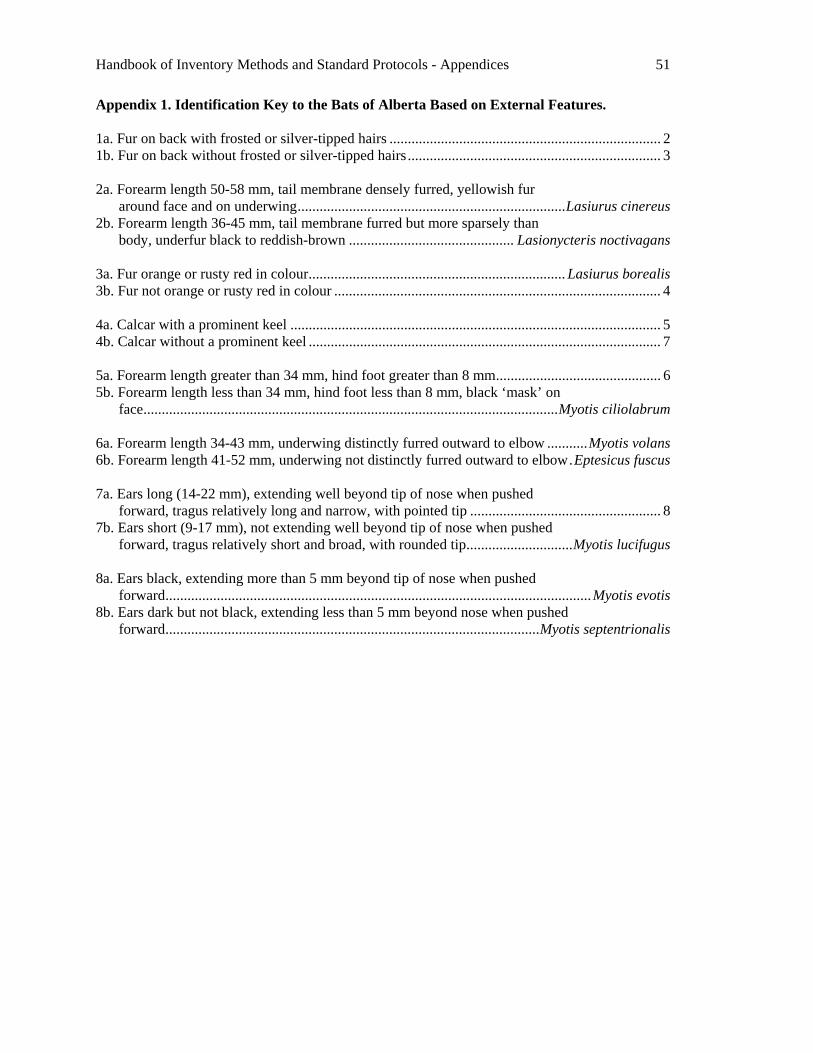
Handbook of Inventory Methods and Standard Protocols - Appendices 51
Appendix 1. Identification Key to the Bats of Alberta Based on External Features. 1a. Fur on back with frosted or silver-tipped hairs .......................................................................... 2 1b. Fur on back without frosted or silver-tipped hairs..................................................................... 3 2a. Forearm length 50-58 mm, tail membrane densely furred, yellowish fur
around face and on underwing.........................................................................Lasiurus cinereus 2b. Forearm length 36-45 mm, tail membrane furred but more sparsely than
body, underfur black to reddish-brown ............................................. Lasionycteris noctivagans 3a. Fur orange or rusty red in colour...................................................................... Lasiurus borealis 3b. Fur not orange or rusty red in colour ......................................................................................... 4 4a. Calcar with a prominent keel ..................................................................................................... 5 4b. Calcar without a prominent keel ................................................................................................ 7 5a. Forearm length greater than 34 mm, hind foot greater than 8 mm............................................. 6 5b. Forearm length less than 34 mm, hind foot less than 8 mm, black ‘mask’ on
face.................................................................................................................Myotis ciliolabrum 6a. Forearm length 34-43 mm, underwing distinctly furred outward to elbow ...........Myotis volans 6b. Forearm length 41-52 mm, underwing not distinctly furred outward to elbow.Eptesicus fuscus 7a. Ears long (14-22 mm), extending well beyond tip of nose when pushed
forward, tragus relatively long and narrow, with pointed tip .................................................... 8 7b. Ears short (9-17 mm), not extending well beyond tip of nose when pushed
forward, tragus relatively short and broad, with rounded tip.............................Myotis lucifugus 8a. Ears black, extending more than 5 mm beyond tip of nose when pushed
forward....................................................................................................................Myotis evotis 8b. Ears dark but not black, extending less than 5 mm beyond nose when pushed
forward......................................................................................................Myotis septentrionalis

Handbook of Inventory Methods and Standard Protocols - Appendices 52
Appendix 2. Mensural characteristics [mean(range)] for species of bat found in Alberta (information from van Zyll de Jong 1985; ranges supplemented from Nagorsen and Brigham 1993 where appropriate. All tragus lengths from Nagorsen and Brigham 1993. Data on red bats supplemented from Jackson 1961 and Hamilton and Whitaker 1979).
Species Mass (g) Forearm (mm)
Hind Foot (mm)
Ear Length (mm)
Tragus Length (mm)
Big Brown Bat (Eptesicus fuscus)
17.9 (8.8-23.6)
47.4 (41-52)
11.7 (9-15)
16.1 (11-21)
8 (5-11)
Eastern Red Bat (Lasiurus borealis)
12.5 (10.0-17.4)
39.7 (36-42)
8.1 (7-10)
11.4 (10-12)
7 (6-8)
Hoary Bat (L. cinereus)
27.6 (20.1-37.9)
56.0 (50.3-58)
10.8 (9-15)
14.0 (13-16)
9 (9-10)
Silver-haired Bat (Lasionycteris noctivagans)
11.0 (5.8-16.7)
41.9 (36-45)
9.0 (6-12)
15.8 (9-16)
7 (4-8)
Western Small-footed Myotis (Myotis ciliolabrum)
4.9 (2.8-7.1)
32.2 (28.8-33.4)
6.5 (6-8)
13.8 (13-15)
7 (4-9)
Western Long-eared Myotis (M. evotis)
6.7 (4.2-10.7)
38.6 (36.0-42.0)
8.6 (7-11)
19.8 (17-22)
10 (8-12)
Little Brown Myotis (M. lucifugus)
7.9 (5.5-11.0)
37.0 (33.0-40.3)
10.0 (6-13)
13.8 (9-17)
7 (4-10)
Northern Long-eared Myotis (M. septentrionalis)
7.4 (4.3-10.8)
36.4 (34.0-40.0)
9.4 (7-11)
16.4 (14-19)
10 (8-12)
Long-legged Myotis (M. volans)
7.5 (5.5-10.0)
39.0 (34.0-43.0)
9.3 (7-11)
13.3 (8-16)
6 (5-7)

Handbook of Inventory Methods and Standard Protocols - Appendices 53
Appendix 3. Selected Suppliers of Equipment Used for Bat Studies.
Equipment Type Commercial Suppliers
Capture Mechanisms:
Mistnets:
Avinet Inc. P.O. Box 1103 Dryden, New York 13053-1103 USA 888-284-6387 http://www.avinet.com/
Manomet, Inc. P.O. Box 1770 Manomet, MA 02345 USA 508-224-6521 e-mail:[email protected] URL: http://www.afonet.org/ (American Society of Field Ornithologists)
Harp Traps: Bat Conservation and Management 905 Thornton Drive Mechanicsburg, PA 17055 USA 717-795-7527 Email: [email protected] URL: http://www.batmanagement.com (also carry bat houses, mine gates, etc.)
Alana Ecology The Old Primary School Church Street Bishop’s Castle Shropshire SY9 5AE United Kingdom 44 (0)1588 630173 e-mail: [email protected] URL: http://www.alana-eco.net
John & Lorraine Alderson Austbat P/L 32 Longs Rd Lower Plenty, Vic, 3084 Australia 613 9435 7004
Marking Devices:
Bands:
A.C. Hughes 1 High Street Hampton Hill Middlesex TW12 1NA England

Handbook of Inventory Methods and Standard Protocols - Appendices 54
Equipment Type Commercial Suppliers
0181-979-1366 e-mail: [email protected]
Lambournes Limited Shallowford Court off High Street Henley-in-Arden Solihull West Midlands B95 5BY England 01564 794971
National Band and Tag Co. 721 York Street P.O. Box 72430 Newport, KY 41072-0430 USA 606-261-2035 e-mail: [email protected] URL: http://www.nationalband.com/
Passive Injectable Transponders: Avid Pettrac Oak Hall Sheffield Park Uckfield, East Sussex TN22 3QY3179 United Kingdom e-mail: [email protected] URL: http://www.avidplc.com/pettrac/products/
Biomark 134 N. Cloverdale Road Boise, ID 83713 USA 208-378-4900 e-mail: [email protected] URL: http://www.biomark.com/dcs.html
Biosonics 3670 Stone Way North Seattle, WA 98103 USA 206-634-0123 e-mail: [email protected] URL: http://www.biosonics.com
Mini-Mitter Co., Inc. P.O. Box 3385 Sunriver, OR 97707 USA 503-593-8639 e-mail: [email protected] URL:http://fairway.ecn.purdue.edu/~ieeeembs/companies/minimitter.html

Handbook of Inventory Methods and Standard Protocols - Appendices 55
Equipment Type Commercial Suppliers
Digital Balances: Precision Weighing Balances URL: http://www.balances.com/
Pesola Spring Scale and Dial Calipers: Forestry Suppliers, Inc. P.O. Box 8397 Jackson, MS 39284-8397 USA 601-354-3565 URL: http://www.forestry-suppliers.com/
Bat Detectors:
Tunable (Heterodyne), Narrow Band:
Bat Conservation International P.O. Box 162603 Austin, TX 78716 USA URL: http://www.batcon.org/
Magenta Electronics Ltd. 135 Hunter Street Burton-on-Trent DE14 2ST United Kingdom 44(0) 1283 565435 e-mail: [email protected] URL: http://www.magenta2000.co.uk/ (Mk.2 Bat Detector (Kit 861))
Pettersson Electronik AB Tallbacksvagan 51 S-756 45 Uppsala Sweden Tel: 46 1830 3880 e-mail: [email protected] URL: http://www.bahnhof.se/~pettersson (D100, D200, D220, D230, D240, D240x, D940, D980 bat detectors)

Handbook of Inventory Methods and Standard Protocols - Appendices 56
Equipment Type Commercial Suppliers
Skye Instruments Ltd. Unit 32 Ddole Industrial Estate Llandrindod Wells Powys LD1 6DF United Kingdom e-mail: [email protected] URL: http://www.skyeimstruments.com/ (SBR1200 and 2000 series bat detectors)
Stag Electronics 15 Sir Georges Place Steyning West Sussex BN44 3LS United Kingdom 44 1903 816298 e-mail: [email protected] URL: http://www.batbox.com/ (BatBox III bat detector)
UltraSound Advice (formerly QMC) 23 Aberdeen Road London N5 2UG UK 44(0)171 359 1718 e-mail: [email protected] URL: http://www.ultrasoundadvice.co.uk/ (Mini-3 bat detector)
Countdown: Pettersson Electronik AB Address as above. (D230, D940, D980 bat detectors)
Titley Electronics P.O. Box 19 Ballina, N.S.W. 2478 Australia 61 2 66866617 e-mail: [email protected] URL: http://www.titley.com.au/ (Anabat II bat detector, delay switch, CF ZCAIM)
Ultra Sound Advice Address as above. (U30 bat detector; QMC S200 bat detector is no longer available)

Handbook of Inventory Methods and Standard Protocols - Appendices 57
Equipment Type Commercial Suppliers
Time-expansion: Pettersson Electronik AB Address as above. ( D240, D240x, D980 bat detectors)
Ultra Sound Advice Address as above. ( U30 or S200 bat detectors + Portable UltraSound Processor [PUSP])
Tape Recorder (Racal Store 4D - 76 cm/s): No longer available
Sound Analysis Software: Analook Titley Electronics address as above
BatSound, BatSound Pro, and Soundalyze Pettersson Electronik AB address as above
Canary 1.2.x Cornell Bioacoustics Research Program Cornell Lab of Ornithology 159 Sapsucker Woods Road Ithaca, NY 14850 USA 607-254-2408 URL:http://www.birds.cornell.edu/BRP/CanaryInfo.html
Telemetry Equipment: See URL for list of suppliers: http://nhsbig.inhs.uiuc.edu/www/equipment_suppliers.html
Radio-transmitters: AVM Instrument Co. 2368 Research Drive Livermore, California 94550 USA 925-449-2286 URL: http://www.avminstrument.com/
Holohil Systems Ltd. 112 John Cavanagh Road Carp, ON K0A 1L0 613-839-0676 e-mail: [email protected] URL: http://www.holohil.com/
Titley Electronics P.O. Box 19 Ballina, N.S.W. 2478 Australia 61 2 66866617

Handbook of Inventory Methods and Standard Protocols - Appendices 58
Equipment Type Commercial Suppliers
e-mail: [email protected] URL: http://www.titley.com.au/
Wildlife Materials Inc. Route 1, Box 427A Carbondale, IL 62901 USA 618-549-6330 e-mail: [email protected] URL: http://www.wildlifematerials.com
Receivers: AVM Instrument CO. Address as above.
Custom Electronics 2009 Silver Court West Urbana, IL 61801 USA 217-344-3460 e-mail: [email protected]
Lotek Engineering Inc. 115 Pony Drive Newmarket, ON L3Y 7B5 905-836-6680 e-mail: [email protected] URL: http://www.lotek.com
Merlin Systems, Inc. 445 W Ustick Rd Meridian, ID 83462 USA 208-884-3308 e-mail: [email protected]
Telonics, Inc. 932 Impala Avenue Mesa, AZ 85204-6699 602-892-4444 e-mail: [email protected] URL: http://www.telonics.com
Titley Electronics Address as above
Wildlife Materials Inc. Address as above.
Antennae: AVM Instrument Co., Custom Electronics, Lotek Engineering Inc., Wildlife Materials Inc., Addresses as above.

Handbook of Inventory Methods and Standard Protocols - Appendices 59
Equipment Type Commercial Suppliers
Surgical Adhesive: Available in medical supply stores
Cyalume Light Sticks: American Cyanamid Corp. Organic Chemicals Division Bound Brook, New Jersey 08805 USA
Forestry Suppliers, Inc. P.O. Box 8397 Jackson, MS 39284-8397 USA 601-354-3565 URL: http://www.forestry-suppliers.com/
GPS Units: Trimble URL: http://www.trimble.com
Garmin URL: http://www.garmin.com
Others Adventure GPS URL: http://www.gps4fun.com/
TeleType GPS URL: http://www.teletype.com
Miscellaneous Equipment:
Remote Observation Equipment (video cameras, tree peepers, etc.):
Christensen Designs 349 Scenic Place Manteca, CA 95337 209-239-8090 e-mail: [email protected] URL: http://www.PeeperPeople.com
General Outdoor and Field Equipment (including flagging tape, notebooks, rope, spotlights, tree-climbing equipment, etc.):
Cabela’s 812 – 13th Avenue Sidney, NE 69160-9555 USA 800-237-4444
Canadian Forestry Equipment Ltd. 17854 – 106A Avenue Edmonton, AB T5S 1V3 780-484-6687, 800-661-7959
Forestry Suppliers, Inc. P.O. Box 8397 Jackson, MS 39284-8397 USA 601-354-3565 URL: http://www.forestry-suppliers.com/
Neville Crosby Inc.

Handbook of Inventory Methods and Standard Protocols - Appendices 60
Equipment Type Commercial Suppliers
445 Terminal Avenue Vancouver, B.C. V6A 2L7 604-662-7272, 800-663-6733 e-mail: [email protected] URL: http://www.nevcros.com/
Tree Climbing Equipment: WestSpur Inc. 2111 Lincoln Street Bellingham, WA 98225 USA 800-845-1213
Night Vision Equipment: Moonlight Products Catalog URL: http://members.aol.com/nightvis/pages/catalog.html
Sunset, Sunrise, Civil Twilight Times, etc.: URL: http://aa.usno.navy.mil/AA/data/
Dissecting Equipment (scissors, forceps, etc.): Fine Science Tools Inc. 202 – 277 Mountain Highway North Vancouver, B.C. V7J 3P2 800-665-5355 e-mail: [email protected] URL: http://www.finescience.com
General Equipment (vials, racks, etc.): Sarstedt 5655 Bois – Franc. St Laurent Quebec, H4S 1B2 514-328-6614, 800-363-4966
Fisher Scientific Ltd. 112 Colonnade Road Nepean, Ontario K2E 7l6 613-226-8874 URL: www: http://www.fishersci.ca

Handbook of Inventory Methods and Standard Protocols - Appendices 61
Appendix 4. Tissue sampling protocol for genetic study of bats.
CORI L. LAUSEN,
University of Calgary, Department of Biological Sciences, T2N 1N4
As genetic identification of species and individuals becomes more commonplace, it will be valuable to collect a small tissue sample from each captured bat. This is recommended in situations where there is difficulty in determining species based on morphological characters, and the captured individual is potentially a species of concern. It is also recommended that in addition to genetic samples, measurements and photographs accompany the biopsy sample. The tissue-sampling method described here has been licensed by the Countryside Commission for Wales, the British Home Office, English Nature and Scottish Natural Heritage, under the provisions of the U.K. Wildlife and Countryside Act, 1981 (Wilmer and Barratt 1996). Basic equipment needed to biopsy-punch Chiroptera includes the following: cutting surface (light-coloured soft plastic cutting board is recommended), disposable biopsy punch, ethanol (70-90% concentration) and other preservative if desired, forceps, lighter, storage vials, and permanent ink marker. Disposable biopsy punches can be purchased through most laboratory supplies companies (e.g. Western Drug Distribution Centre, Edmonton, AB). They are available in several different diameters, but 2 or 3 mm diameters are recommended for the size of bats in Alberta. Each punch will remain sharp enough to sample at least 10 bats, but with soft plastic cutting boards, punches have been known to work for nearly ten times this number of individuals. Ethanol is used for three purposes: cleansing of the cutting board, cleansing of equipment, and has also been shown to be an effective method of preservation (e.g., Murphy et al. 2002). In the former use, the easiest method of applying alcohol to the cutting board is to use alcohol wipes available at pharmacies. Likewise, cleaning of the forceps and biopsy punch between bats is necessary to avoid contamination and to reduce the risk of spreading infection between bats. Forceps and punch should be wiped off with ethanol, or ideally, flamed using a lighter then dipped into ethanol. Be sure equipment cools before using again. The wing punch(es) should be stored in a vial containing preservative. The preservative may be either 90-95% ethanol or DMSO/salt solution, or a full tube of solid dessicant beads (see below for comparisons). Vials (1.5 mL) with caps containing ‘o-rings’ are recommended to avoid evaporation and leakage if liquid preservative is used. These vials are available from most laboratory supplies companies (e.g. Sarstedt, Montreal, QB) and do not need to be sterile. The vial should be clearly labeled to indicate species, sex, age, reproductive condition, date, band (if applicable) or identification number, capture location, and collector’s name. If ethanol is used for tissue preservation, it is also highly recommended that a small piece of paper (waterproof is best) labeled with pencil be

Handbook of Inventory Methods and Standard Protocols - Appendices 62
inserted into the vial. This is a back-up sample identification system should ethanol leakage dissolve the outside label. The biopsy sample can be taken from the plagiopatagium of the wing or the tail membrane. The biopsy sample is taken by spreading the wing (or tail membrane) of the bat over the cutting board until it is taut. Inspect the membrane carefully prior to punching to avoid cutting blood vessels. There is a triangle-shaped area delineated by blood vessels next to the tibia, and I recommend making the hole in this triangle as it ensures blood vessels are not cut and keeps the hole away from the middle part of the wing. Position the punch, press down on it, and then turn slightly. The small piece of membrane tissue may remain inside the punch. In such a case, simply place the cutting end of the punch into the vial of ethanol and flick the handle slightly to dislodge the tissue. If the piece of tissue alternatively remains on the board after cutting (the dark piece of tissue will be evident on a light-coloured cutting board), pick it off the board with forceps and place into the vial. One or both wings may be punched. If several genetic processes, such as microsatellite genotyping and mitochondrial sequencing, are to be carried out with the tissue, it is recommended that one punch be taken from each wing to ensure an adequate amount of DNA. Holes left in the tail or wing membrane of bats have been shown to heal quickly (Wilmer and Barratt 1996; C. Lausen, University of Calgary, pers. obs.; M. Vonhof, University of Tennessee, pers. comm.); healing times seem to vary with age, season, and from individual to individual (C. Lausen, pers. obs.). There are several choices of preservation material, with ethanol or dessicant beads being the simplest and most benign. However, a solution of DMSO (dimethyl sulphoxide solution) and salt is an alternative. The DMSO/salt preservation solution is made by mixing DMSO with a saturated salt solution (5-6 M NaCl) in a 1:4 ratio. Caution should be taken to avoid contact of this solution with skin, and the solution should be kept out of direct sunlight (S. Rossiter, Queen Mary & Westfield College,London, England, pers. comm.). The life of the disposable biopsy punches decreases dramatically if dipped into this solution. There do not appear to be any advantages to using DMSO/salt over ethanol, although long-term storage beyond a few years has not been thoroughly tested with either. After collecting the tissue, vials containing either liquid can remain at room temperature for several months, but refrigeration is recommended for long-term storage (S. Rossiter, pers. comm.). Dessicant beads (‘silica gel’) can be purchased through laboratory supply companies (e.g., Fisher Scientific, ON) and preserve by drying the tissue, thereby not requiring refrigeration (A. Russell, University of Tennessee, pers. comm.). Advantages of using dessication over the other two methods are twofold: 1. no spillage problems, and 2. allows for stable isotope analysis of samples (M. Vonhof, pers. comm.). Drawbacks associated with these beads are: 1. placement of the tissue pieces into the vial can be more difficult as there is no liquid to dislodge the tissue from inside the punch, and 2. the pieces of tissue can be more difficult to locate in the vial. The former problem can be solved if the biopsy punch is hollow; by blowing lightly into the handle-end of the biopsy punch while holding the punch just above the cutting board, the piece of tissue should dislodge and land on the cutting board. It can then can be transferred by forceps into the vial and placed against a dessicant bead.

Handbook of Inventory Methods and Standard Protocols - Appendices 63
Tissue samples may be stored at the Alberta Provincial Museum (contact D. Gummer, [email protected], Curator of Mammalogy, Alberta Provincial Museum).
EQUIPMENT:
Vials: Sarstedt 5655 Bois – Franc. St Laurent Quebec, H4S 1B2 514-328-6614, 800-363-4966, 888-727-7833 (o-ring vials product #72-694-007)
Fisher Scientific Ltd. 112 Colonnade Road Nepean, Ontario K2E 7l6 613-226-8874 URL: www: http://www.fishersci.ca
Biopsy punches: Western Drug Distribution Centre 111445-163rd St. Edmonton, AB T5M 3Y3 780-413-2163, 877-746-9332 Fax: (780) 413-2530 or 1-800-329-9332 Product code: 2 mm biopsy punch SAG-33-31
LITERATURE CITED
Murphy, M.A., L.P. Waits, K.C. Kendall, S.K. Wasser, J.A. Higbee and R. Bogden. 2001. An evaluation of long-term preservation methods for brown bear (Ursus arctos) faecal DNA samples. Conservation Genetics 3: 425-440.
Wilmer, J.W. and E. Barratt. 1996. A non-lethal method of tissue sampling for genetic studies of Chiropterans. Bat Research News 37: 1-3.