half-yearly report 2008annual report and accounts 2008 · this is in line with the company’s...
TRANSCRIPT

Annual report and accounts 2008Half-yearly report 2008

About 3i Infrastructure plc 3i Infrastructure plc (“3i Infrastructure” or “the Company”) is a Jersey-incorporated, closed-ended investmentcompany that invests in infrastructure businesses and assets and is regulated by the Jersey Financial ServicesCommission.3i Infrastructure listed on the London Stock Exchange in March 2007, raising £703 million in its initial public offering(“IPO”) and a further £115 million in a subsequent placing and open offer in July 2008 from a diverse range ofinternational institutions and retail investors. The Company is a constituent of the FTSE 250 index. In July 2008, theCompany changed its name to 3i Infrastructure plc (formerly 3i Infrastructure Limited).3i Investments plc (“3i Investments”), a wholly-owned subsidiary of 3i Group plc (“3i Group”), acts as InvestmentAdviser to the Company. The Company has a non-executive board and no employees.
Board of DirectorsPeter Sedgwick Non-executive Chairman Philip Austin Non-executive Director and Senior Independent Director Martin Dryden Non-executive Director and Chairman of the Audit CommitteePeter Wagner Non-executive Director Paul Waller Non-executive DirectorSteven Wilderspin Non-executive Director
The half-yearly report for 3i Infrastructure plc for the six months to 30 September 2008 has been drawn up and presented in accordance with and in reliance uponapplicable English and Jersey law and the liabilities of the Company in connection with that report shall be subject to the limitations and restrictions provided by suchlaw. The half-yearly results for the six months to 30 September 2008 are unaudited.
This report may contain certain statements about the future outlook for 3i Infrastructure plc. Although we believe our expectations are based on reasonableassumptions, any statements about the future outlook may be influenced by factors that could cause actual outcomes and results to be materially different.
Annual and half-yearly reports onlineTo receive shareholder communications electronically in future,including your annual and half-yearly reports and notices ofmeetings, please go to www.3i-infrastructure.com/e-commsfor details of how to register.
Financial highlightsConsolidated
Investment basis(1) IFRS basis(2)
30 September 30 September2008 2007 2008 2007
Total return(2) £50.3m £33.6m £50.4m £29.6mTotal return on average shareholders’ equity(3) 6.1% 4.8% 6.1% 4.2%Diluted net asset value per share 111.3p 103.1p 111.1p 102.6pInterim dividend per share 2.1p 2.0p 2.1p 2.0pDiluted net asset value per share after deducting interim dividend 109.2p 101.1p 109.0p 100.6pNew investment and commitments £105.2m £512.8m £105.2m £634.8mPercentage of raised proceeds invested and committed since inception(4) 84% 74% n/a n/aTotal portfolio value £576.4m £426.4m £846.0m £671.1m(1) The Investment basis accounts for majority investments and subsidiaries formed specifically for investment purposes in the same way as minority investments and does not consolidate these entities as is
required under International Financial Reporting Standards (“IFRS”).
(2) For the consolidated IFRS basis, the total return in this measure is the profit attributable to equity holders of the parent and does not include minority interests. The gross consolidated total return for the period was £57.2 million (September 2007: £40.5 million).
(3) Time-weighted average shareholders’ equity is defined as the weighted average of (i) opening shareholders’ funds, less the final prior-year dividend paid and (ii) proceeds raised through the placing andopen offer, less costs associated with the fundraising.
(4) The September 2007 comparative is stated on a percentage of net IPO proceeds only.

3i Infrastructure plc Half-yearly report 2008 01
Chairman’s statement
“3i Infrastructure has continued to achieve its returnobjectives in spite of the volatile market backdrop.With limited refinancing requirements in the underlyingportfolio, no Company-level leverage and ampleliquidity, 3i Infrastructure is well placed to takeadvantage of market opportunities.”3i Infrastructure made good progress towards achievingits return objective during the first half of the financialyear. The Company achieved a total return, on aConsolidated IFRS basis, of £50.4 million, representing a 6.1% return on average shareholders’ funds.On an investment basis, which the Board uses as theprimary basis to monitor performance, the Companydelivered a total return of £50.3 million, or 6.1% onaverage shareholders’ funds.On the basis of this performance, the Directors areproposing an interim dividend of 2.1 pence per share.This is in line with the Company’s dividend policy andrepresents an increase of 5% when compared with the2007 interim dividend.The return was achieved against an increasingly volatilemarket backdrop and reflects the quality of theCompany’s portfolio of assets. The portfolio generatedsignificant income from dividends and interest, as well as good realised and unrealised gains, as outlined in more detail in the Investment Adviser’s review.The Company invested £102.9 million over the period,bringing the total amount invested since inception to £545.0 million, or 68% of the aggregate net proceedsraised at IPO and through the subsequent placing andopen offer. Including undrawn commitments, theCompany has invested and committed £674.3 million, or84% of the aggregate proceeds, since inception.Investment activity was slower in this first half comparedto the same period last year, as the Investment Adviser, asdirected by the Board, has further increased its qualitythreshold in more challenging markets.
Difficulties in the credit markets have become moresevere over the period. However, due to prudentfinancing structures and the strong relationships of the Investment Adviser with a number of key lendingbanks, the Company has not experienced difficulties in financing within its existing portfolio and newinvestment.Refinancing risk in the portfolio remains low, with only a small proportion of the portfolio debt due to be refinanced in the short to medium term. In addition,infrastructure assets remain relatively attractive to debtproviders, due to their defensive characteristics. In light of the above, the Board remains confident that theCompany is well placed to continue to deliver its returnobjectives, even in current markets.The Board and the Investment Adviser have continued toadopt a highly selective approach to investment and totake advantage of the opportunities deriving from currentmarket conditions. The Company has been able to takeadvantage of the dislocation in the credit markets toinvest in debt instruments at a significant discount to facevalue. These investments are already generating veryattractive yields and are contributing to the Company’scapacity to deliver its dividend objectives.The market outlook for infrastructure investment remainspositive, with significant opportunities to deploy capitalselectively. Budgetary constraints are further reducing the ability of governments, in both the developed anddeveloping world, to finance infrastructure projects solelywith public funds, thereby increasing opportunities forprivate capital involvement. Difficulties in the financing of transactions, moreover, may reduce the competitivepressure for available assets, which will be of advantageto long-term investors such as 3i Infrastructure.The Company is in a strong financial position, havingraised, with the support of many of its shareholders,£115 million in new equity in July of this year. This newfunding, combined with the £225 million revolving creditfacility put in place in March 2008, which remainsundrawn, puts 3i Infrastructure in a strong position totake advantage of this market opportunity.Peter SedgwickChairman2 November 2008

02 3i Infrastructure plc Half-yearly report 2008
Company objectives
Returns3i Infrastructure’s overall objective is to provide its shareholders with a total return of 12% per annum on the annualised aggregateshareholders’ net funds raised, to be achieved over the long term.Within this overall objective, the Company will also target an annual distribution yield, on full investment of the aggregate netfunds raised, of approximately 5% of adjusted opening net assetvalue, to be achieved through a combination of regular dividends and capital returns.
Portfolio3i Infrastructure aims to invest the net proceeds from IPO and furtherfunds raised within two years of those proceeds being raised.The Company intends to make equity, or equivalent, investments in infrastructure businesses and, for most investments, the Company will seek to obtain board representation.Infrastructure businesses and assets are defined as asset-intensivebusinesses, providing essential services over the long term, often on a regulated basis, or with a significant component of revenues and costs that are subject to long-term contracts.
3i Infrastructure plc Half-yearly report 2008 03
Investment Adviser’s review
“In the current market we have been cautiousinvestors, maintaining a very high quality threshold and aiming to minimise portfolio risk. Focused portfolio management is critical to the delivery of 3i Infrastructure’s return objectives and this hasbeen a priority for us in this financial period.”Michael QueenManaging Partner, Infrastructure, 3i GroupAbout the Investment Adviser3i Investments, a wholly-owned subsidiary of 3i Group,acts as Investment Adviser to the Company through itsinfrastructure investment team (the “investment advisoryteam”). The investment advisory team provides advice tothe Company on the origination and completion of newinvestments, on the realisation of investments and onfunding requirements, as well as on the management ofthe investment portfolio.The investment advisory team operates as a separatebusiness line within 3i Group and at 30 September 2008was staffed by 25 dedicated infrastructure investmentprofessionals of whom 13 are based in London, three inFrankfurt, six in Mumbai and Delhi and three in New York.All have significant experience in investing in, or advising on, infrastructure or private equity assets. The investment advisory team can also draw on 3i Group’s network of more than 250 investmentprofessionals, based in 14 countries, to originateinfrastructure investments.3i Group was among the subscribers to 3i Infrastructure’sinitial public offering and subsequent placing and currentlyowns 43% of the equity in the Company.
MarketEquity and credit markets have become increasinglyvolatile over the last six months. The international bankingsystem has suffered a collapse in confidence, triggered bythe accumulation of underperforming assets on and offbank balance sheets, which has resulted in a near freezingup of interbank lending and in a significant decline in theavailability of credit, for both corporate and retailborrowers.
Within this market context, the outlook for infrastructureinvestment remains relatively positive. Despite theeconomic slowdown, in the medium term, the InvestmentAdviser believes spending on infrastructure will continueto be significant, fuelled by demographic trends indeveloping economies and by the necessity to upgradeageing infrastructure and to respond to the challenge ofclimate change in the developed world. The opportunity for private investors in infrastructuregoing forward will derive from: (i) downward pressure onpricing and; (ii) the inability of resource-constrainedgovernments, which have had to borrow heavily toimplement financing plans for the banking industry, to spend public resources on infrastructure.This opportunity will, however, be constrained by thecredit markets. Infrastructure financing is reliant on theavailability of bank credit. While the infrastructure assetclass has shown greater resilience than others to thecredit contraction, it is unclear when banks will increaselending in the current climate. 3i Infrastructure is in the strong position of havingliquidity to fund investment. As at 30 September 2008,the Company had cash balances of £328.7 million and a£225 million credit facility in place, which remainsundrawn.

04 3i Infrastructure plc Half-yearly report 2008
Investment Adviser’s review continued
Investment activityPerformance indicator
Objective: to invest the net proceeds from IPO and further equityfunds raised within two years of those proceeds being raised.
Measurement: cash invested and committed (before costreturned through divestments) as a percentage of aggregate netproceeds raised.
Status: aggregate proceeds 68% invested and 84% invested or committed since inception. Net equity proceeds (including cost returned through divestment proceeds) available for new investment and funding existing commitments totalled£305.4 million.
Summary of investment activity3i Infrastructure has invested £545.0 million sinceinception, of which £102.9 million was invested in the six months to 30 September 2008 (September 2007: £412.7 million). The amount invested is lower compared to the amount invested in the equivalent period in theprior year, which included the acquisition of the initial seedportfolio for £234.4 million. The slowdown in investment activity is driven by thecautious investment approach adopted during the period,which, in light of volatile market conditions throughoutthe period, has focused on high-quality assets whichlower total portfolio risk, while allowing the Company todeliver its return objective. Including undrawn commitments, and before takingaccount of any cost returned through disposals, theCompany has invested or committed £674.3 million sinceinception, representing 84% of the aggregate netproceeds raised at IPO and through the subsequentplacing and open offer, completed in July 2008. Includingthe cost returned from divestment proceeds, the net
equity proceeds available for new investment and forfunding the existing commitments, at 30 September2008, were £305.4 million. The total cash balance at 30September 2008 was £328.7 million (September 2007:£296.7 million).
New investmentInvestment activity in the first half of the financial yearof £102.9 million relates mainly to the investment of£86.7 million into a portfolio of junior debt instruments.The persisting dislocation in the credit markets hasprovided the Company with an opportunity to invest in a portfolio of junior debt issued by infrastructurebusinesses with strong credit credentials, at prices belowpar value.The portfolio has been carefully selected on the basis of a detailed assessment by the Investment Adviser of theunderlying assets, their business model and creditworthiness. This portfolio consists of investments infacilities issued by Viridian, a company based in NorthernIreland, focusing on the generation, transmission anddistribution of electricity (£28.9 million), Thames Water,the UK’s largest water utility company (£14.5 million),NGW/Arqiva, a UK wireless broadcast business (£32.4 million) and Télédiffusion de France, the leadingFrench broadcast network operator (£10.9 million). Each of these assets has been purchased at pricing levelswhich provide a yield to maturity above the Company’sreturn objectives. The acquisition of these assets,moreover, has strengthened the yield of the portfolio. Further investments The Company invested a further £12.4 million inInfrastructure Investors (“I2“). Alpha Schools also drewdown a further £4.7 million from existing commitmentsmade by the Company, and as this project continues toprogress well and in line with budget, it is expected that
Table 1 – Summary of investment activityfor the six months to 30 September 2008 (£m)Portfolio asset New Further Total New(investment basis) Sector investment investment investment commitments
Equity investments
I2 Social Infrastructure – PFI Fund – 12.4 12.4 –
Alpha Schools Social Infrastructure – PFI school – 4.7 4.7 –
Alma Mater Fund Social Infrastructure – PFI university – 1.9 1.9 –
3i India Infrastructure Fund Power and Transport Fund(1) – (2.8) (2.8) –
Debt investments
Viridian Utilities – Power 28.9 – 28.9 –
Thames Water Utilities – Water 14.5 – 14.5 –
NGW/Arqiva Utilities – Communications 32.4 – 32.4 –
Télédiffusion de France Utilities – Communications 10.9 – 10.9 2.3
Total 86.7 16.2 102.9 2.3(1) The Fund held two investments at 30 September 2008, in the power and infrastructure construction sectors. Due to the current weighting of the underlying assets the Fund has been classified as a
Utilities investment in chart 1.

3i Infrastructure plc Half-yearly report 2008 05
the remaining commitments of £2.7 million will be drawndown during the current financial year.A further investment of £1.9 million was made into theAlma Mater Fund before it was sold in July 2008. Finally, an amount of £2.8 million was returned by the 3i India Infrastructure Fund. This amount will remainavailable for draw down by the 3i India InfrastructureFund for new investments.PortfolioPortfolio value and returnThe value of the Company’s investment portfolio at 30 September 2008 was £576.4 million (September 2007: £426.4 million). The portfolio isperforming in line with expectations and the investmentreturn – represented by dividends and interest yield, as well as realised and unrealised capital profits from the portfolio and cash balances – was £56.8 million, or 6.8% of average opening shareholders’ equity(September 2007: £40.3 million, 5.8%). The breakdown of 3i Infrastructure’s portfolio by sector,maturity and geography is shown in charts 1, 2 and 3.As set out in chart 4, the key changes to the value of the portfolio in the period are accounted for by newinvestment of £102.9 million, asset disposals of £42.0 million, principally the disposal of the Alma MaterFund for £41.9 million and, finally, the unrealised uplift inthe value of the portfolio. The unrealised value uplift hasbeen driven principally by the increase in the value of twoassets, namely the 3i India Infrastructure Fund and I2. The investment valuations are calculated by theInvestment Adviser and reviewed and approved by the Board of Directors. Valuations continue to be basedon International Private Equity and Venture Capitalvaluation guidelines. The valuation policy is set out in full on page 28.
At 30 September 2008, the implied weighted averagediscount rate decreased to 12.0% from 12.4% at 31 March 2008, due to the increased weighting of the value of I2 (which has a discount rate lower thanthe average) and the reduction in the overall 3i IndiaInfrastructure Fund discount rate, driven by the progressof the initial construction phase at Adani Power. Thediscount rate applied to T2C has been raised to reflect theincreased risk arising from an anticipated project delay(the T2C asset review is set out on page 13).Portfolio managementPortfolio management has been a priority throughout the period, as highlighted in the asset reviews, shown on pages 11 to 15. This has included a review of therefinancing requirements within the portfolio to ensure a manageable programme in the short to medium term.
53%
17%
30%
� Social infrastructure � Transportation � Utilities
Chart 1 – Asset portfolio by sectoras at 30 September 2008
* Includes investment in Oystercatcher, with operations in the Netherlands, Malta and Singapore.
20%
71%
9%
� UK � Continental Europe* � Asia
Chart 3 – Asset portfolio by geographyas at 30 September 2008
58%30%
12%
� Early stage � Operational growth � Mature
Chart 2 – Asset portfolio by maturityas at 30 September 2008
Opening portfolio
value
New/further
investments
489.7
Assetreturns*
Incomereceived
Closingportfolio
valueDivestments
*Includes unrealised exchange gains of £2.2 million.
Chart 4 – Reconciliation of movement in portfolio value for the period to 30 September 2008 (£m)
(42.0)
50.4
(24.6)
576.4102.9

ReturnsPerformance indicator
Objective: to provide shareholders with a total return of 12% perannum on aggregate annualised net equity raised, to be achievedover the long term.
Measurement: total return for the period expressed as apercentage of average shareholders’ funds*.
Status: 6.1% total return for the six months to September 2008.*Average shareholders’ funds is the time-weighted average of (i) opening shareholders’ funds lessprior-year final paid dividend and (ii) net new funds raised in the financial year.
The commentary below analyses the key drivers of theCompany’s returns according to the investment basis ofpreparation.3i Infrastructure achieved a total return in the first half of £50.3 million, 6.1% of time-weighted averageshareholders’ funds, which adjusts opening shareholders’equity for the new equity raised in July 2008 (September2007: £33.6 million, 4.8%). This measure most closelyequates, on an annualised basis, to the long-termobjective for returns and incorporates new equity raised. The diluted net asset value per share at 30 September2008 (before deducting the proposed interim dividend)was 111.3 pence per share (September 2007: 103.1pence).
06 3i Infrastructure plc Half-yearly report 2008
Investment Adviser’s review continued
Basis of preparationIn the following section, the Investment Adviser has presentedthe Company’s net asset value and key financial statements toshow the return on a pro forma investment basis, in addition tothe consolidated financial statements as shown on pages 16to 24, as required under International Financial ReportingStandards (IFRS). This pro forma investment basis presentationprovides a more meaningful representation of the Company’snet asset value, shows the Company’s cash utilisation forinvestment and differentiates between non-recourseborrowings held within asset specific acquisition companies and borrowings which may be made at the Company level. The investment basis accounts for majority investments andsubsidiaries formed specifically for investment purposes in thesame way as minority investments, by determining a fair valuefor the investment, and therefore does not consolidate theseentities line-by-line as is required under IFRS.
Several adjustments have been made in order to show returnson an investment basis, the main adjustments being:
3i Infrastructure holds 55.7% of 3i Osprey LP, the vehiclethrough which 3i Group also holds its investment in AWG. 3i Infrastructure is required under IFRS to consolidate the resultsand balance sheet of this LP into its accounts on a line-by-linebasis. The remaining 44.3% of this entity is held by 3i Group and a third party. In the investment basis presentation, 3i Infrastructure has recognised only its share of the income and balance sheet of 3i Osprey LP.
3i Infrastructure holds two wholly-owned subsidiaries,Oystercatcher Luxco 1 S.àr.l. and Luxco 2 S.àr.l., to fund theminority investment into three subsidiaries of Oiltanking GmbH.External borrowings were made by Oystercatcher Luxco 2 to partly fund the investments. These borrowings are non-recourse to 3i Infrastructure. Under IFRS, the results and balance sheets of the Oystercatcher Luxco 1 and Luxco 2 subsidiaries are required to be consolidated into 3i Infrastructure’s financial statements on a line-by-line basis. In the investment basis presentation the Oystercatcher Luxco 2subsidiary is not consolidated but is accounted for as a portfolioasset held for investment purposes and is fair valuedaccordingly.
The Company invests in 3i India Infrastructure Holdings Limitedthrough 3i India Infrastructure A LP, a limited partnership inwhich the Company is the sole investor. This partnership has notbeen consolidated in the investment basis and is treated as aninvestment and is fair valued accordingly.

3i Infrastructure plc Half-yearly report 2008 07
Table 2 – Summary total return on an investment basis (£m)For the period from For the period from Consolidated basis
Six months to 16 January 2007 to 16 January 2007 to six months to30 September 2008 30 September 2007 31 March 2008 30 September 2008
Realised profit over value on the disposal of investments 4.1 – – 4.1
Unrealised profits on the revaluation of investments 19.5 11.3 48.5 14.8
Foreign exchange gains/(losses) on investments 2.2 2.4 18.1 (0.1)
Capital return 25.8 13.7 66.6 18.8
Portfolio income
Dividends 18.3 10.6 17.3 33.1
Income from loans and receivables 6.3 3.7 10.5 8.0
Fees payable (1.3) (0.7) (3.4) (1.3)
Interest receivable 7.7 13.0 21.7 7.7
Investment return 56.8 40.3 112.7 66.3
Advisory, performance and management fees payable (4.6) (3.8) (17.5) (5.3)
Operating expenses (0.9) (3.2) (3.9) (0.9)
Finance costs (0.5) – – (5.2)
Other costs (0.3) – (1.4) (0.5)
Profit for the period 50.5 33.3 89.9 54.4
Exchange difference on translation of foreign operations (0.2) 0.3 0.6 2.8
Profit attributable to minority interests for the period – – – (6.8)
Total recognised income and expense “Total return” 50.3 33.6 90.5 50.4
The investment return was £56.8 million (September2007: £40.3 million), of which £49.1 million wasgenerated from the portfolio assets and £7.7 million wasinterest on financial assets. This return includes realisedcapital profits on the sale of assets of £4.1 million(September 2007: £nil), unrealised value movements onthe revaluation of the portfolio (including foreignexchange movements) of £21.7 million (September2007: £13.7 million) and income on the portfolio, whichwas strong during the period at £24.6 million (September2007: £14.3 million). The interest income from financialassets of £7.7 million (September 2007: £13.0 million)was lower compared to the same period last year, due to the reduced average cash holdings over the period.A feature of this period’s returns was that strong levels ofcash were generated from the portfolio through bothdividends and interest received and profitable divestment.Capital return Realised capital profits of £4.1 million (September 2007:£nil) were principally generated from the divestment of the interest in the Alma Mater Fund in July 2008.This sale generated a realised profit over the openingbook value at 31 March 2008 of £4.0 million and a profitover cost of £15.0 million.
The unrealised value uplift of £19.5 million (September2007: £11.3 million) is driven mainly by the revaluationof the 3i India Infrastructure Fund and I2. The uplift in thevalue of the 3i India Infrastructure Fund was driven bythe strong performance of Adani Power, which madesignificant progress in the initial construction phase of its power plant in the port of Mundra and is developinglong-term generation capacity elsewhere in India. In the case of I2, in addition to the further investment of£12.4 million, the value uplift takes into account incomedistributions retained in the fund and also recognisesfurther portfolio efficiencies identified as part of thestructural review of the assets. These uplifts are partlyoffset by a decrease in the value in the quoted elementsof the portfolio, a reduction in the DCF valuation of AWGfollowing the significant dividends received in the periodand the change in discount rate applied to T2C, as a result of an expected delay to the completion of theconstruction phase of this project. A more detaileddescription of the developments of each portfolio asset is provided in the portfolio reviews on pages 11 to 15.Portfolio incomePortfolio income, earned through dividends and interestincome on loans to portfolio companies, was £24.6million (September 2007: £14.3 million) mainly due tostrong dividend flows from AWG and Oystercatcher andinterest received on the junior debt portfolio.

08 3i Infrastructure plc Half-yearly report 2008
Investment Adviser’s review continued
Advisory fee, performance fees and operating costsDuring the first six months of the financial year, theCompany incurred advisory fees totalling £4.6 million(September 2007: £3.8 million). The advisory fee,payable to 3i plc, is calculated as 1.5% of GrossInvestment Value, which is based on the opening portfoliovalue and the cost of new investment made during theperiod. No performance fee has been accrued or chargedin the period. A more detailed explanation of how theadvisory and performance fees are calculated is shown in note 8 on page 23. Operating expenses, comprising Board fees, serviceprovider costs and other professional fees, totalled £0.9 million for the six months to 30 September 2008. Finance costs and other costs include the arrangementand commitment fees for the revolving credit facility andthe fair value movement on the foreign exchange hedgingprogramme, which has been put in place to part hedgethe euro exposure from the portfolio.Professional fees and issue costs relating to the placingand open offer of £3.2 million have been charged directlyagainst reserves.
Balance sheetAt 30 September 2008, the assets of the Companycomprised the investment portfolio, valued at £576.4 million (September 2007: £426.4 million), cash and cash equivalents of £328.7 million (September2007: £296.7 million) and other current assets, primarilyrelating to accrued income from portfolio investmentsand prepayments. There were no external borrowings ona recourse basis to the Company. At 30 September2008, and at the time of reporting, the £225 millionrevolving multicurrency credit facility had not been drawn. New equity raised of £114.6 million, net of the issuecosts of £3.2 million, is held to the credit of the statedcapital account.
Table 3 – Summary balance sheet on an investment basis (£m)Consolidated basis
As at As at As at as at30 September 2008 30 September 2007 31 March 2008 30 September 2008
Assets
Non-current assets
Investment portfolio 576.4 426.4 489.7 846.0
Current assets
Other current assets and derivative financial instruments 10.3 11.7 41.4 13.2
Cash and cash equivalents 328.7 296.7 253.7 333.3
Total current assets 339.0 308.4 295.1 346.5
Total assets 915.4 734.8 784.8 1,192.5
Borrowings – – – (149.8)
Total non-current liabilities – – – (149.8)
Current liabilities
Trade and other payables and derivative financial instruments (5.2) (8.1) (15.2) (10.2)
Total current liabilities (5.2) (8.1) (15.2) (10.2)
Total liabilities (5.2) (8.1) (15.2) (160.0)
Net assets 910.2 726.7 769.6 1,032.5
Equity
Stated capital account 111.4 693.1 – 111.4
Retained reserves 798.3 33.3 769.0 777.3
Translation reserve 0.5 0.3 0.6 20.3
Total shareholders’ equity 910.2 726.7 769.6 909.0
Minority interests – – – 123.5
Total equity 910.2 726.7 769.6 1,032.5

3i Infrastructure plc Half-yearly report 2008 09
Net asset valuePerformance indicator
Objective: to target an annual distribution yield of 5% on adjustedopening net asset value following full investment.
Measurement: dividend paid or declared relating to the financialyear, as a percentage of average shareholders’ funds*.
Status: interim dividend of 2.1 pence per share equates to a 2.1%distribution on average shareholders’ funds.*Average shareholders’ funds is the time-weighted average of (i) opening shareholders’ funds lessprior-year final paid dividend and (ii) net new funds raised in the financial year.
The net asset value at 30 September 2008 was £910.2 million (September 2007: £726.7 million),which, as shown in chart 5, reduces to £893.2 million(September 2007: £712.6 million) after the deduction of the proposed interim dividend, which will be paid inDecember 2008.Diluted net asset value per share, adjusting for the 70.6 million warrants which were issued at IPO in March 2007, was 111.3 pence per share (September2007: 103.1 pence). This reduces to 109.2 pence pershare (September 2007: 101.1 pence) after thededuction of the proposed interim dividend of 2.1 penceper share.
Risks and uncertaintiesThe principal risks and uncertainties faced by theCompany are set out in the Risks and Uncertaintiessection of the Company’s Annual Report for the period to31 March 2008. The principal external and strategicinvestment risks faced by the Company relate to theperformance of underlying investment assets and marketand transaction risks relating to the Company’s ability torefinance its investments and to obtain debt financing fornew investment, as well as to the time taken to deploythe Company’s capital. The Company is highly dependenton 3i Investments and its Infrastructure investmentadvisory team. This half-yearly report also refers tospecific risks and uncertainties and these should beviewed in conjunction with those principal risks.
Chart 5 – Reconciliation of movements in net asset value for the six months to 30 September 2008 (£m)
(3.2)748.5
50.3
(17.0)
893.2
Opening NAV (post-2008
final dividend)
Proposed interim
dividend
Closing NAV(post-interim
dividend)
Totalreturn
Fund raising costs
Funds raised
114.6

10 3i Infrastructure plc Half-yearly report 2008
Portfolio
Portfolio summaryDirectors’ Directors’ Assetvaluation valuation Income total return
Date March September in the in theEquity first Cost 2008 2008 period period Valuation
interest invested £m £m £m £m £m basisAnglian Water 9.0% Mar 2007 140.0 159.6 152.1 16.5 9.0 DCFI2 31.2% Mar 2007 118.5 125.1 150.5 – 13.0 DCFOystercatcher(1) 45.0% Aug 2007 84.5 98.3 97.5 3.9 3.1 DCFOctagon 26.3% Mar 2007 13.2 13.6 13.4 0.5 0.3 DCFNovera 8.6% Feb 2008 11.2 11.2 9.2 – (2.0) Quoted
equityAlpha Schools 50.0% Mar 2007 5.0 0.3 7.6 0.1 2.7 DCFT2C 16.7% Aug 2007 6.5 7.9 5.8 (0.2) (2.3) DCF3i India 20.9%(2) Sept 2007 33.6 37.7 53.9 0.3 19.3 LP share Infrastructure Fund of fundJunior debt portfolio n/a Apr 2008 86.7 – 86.4 3.5 3.3 Quoted
debt(1) 3i Infrastructure has a 45% interest in three of Oiltanking GmbH’s subsidiaries through Oystercatcher Luxco 2 S.àr.l.(2) 20.9% of final closing commitments.

3i Infrastructure plc Half-yearly report 2008 11
DescriptionAnglian Water Group Limited is the parentcompany of the water and waste waterbusiness Anglian Water. Anglian Water is thefourth largest water supply and waste watercompany in England and Wales measured byregulatory capital value and is regulated byOfwat. The investment is held through a limitedpartnership that is separately managed by 3i Investments and in which 3i Group also hasan interest. The AWG group also includesMorrison Facilities Services, a support servicesbusiness focused on local authority and socialhousing sectors, and a property developmentbusiness.
StrategyAnglian Water aims to deliver a reliable supply ofclean, safe drinking water and effective wastewater services at an affordable price, whilemeeting the challenges of growth and climatechange.
Developments in the period The sale of Morrison Utility Services wascompleted in May 2008, generating a highdividend return to shareholders in the period.AWG’s Draft Business Plan, setting out itsinvestment plans for 2010 to 2015, wassubmitted to Ofwat. This is now subject toconsultation, leading to Ofwat’s FinalDetermination in November 2009. Thecompany also issued a €500 million eight-yearbond in June 2008, providing sufficient fundingto meet the business’ needs for the remainderof the current regulatory period. The companyhas also complied with the Walker Code and itsreport and accounts are available on its website,www.awg.com.
Portfolio detailEquity interest 9.0%Date invested March 2007Cost £140.0mDirectors’ valuation £152.1mIncome in the period £16.5mAsset total return in the period £9.0mValuation basis DCF
Anglian Water Group Limited
DescriptionI2 makes and manages PFI investments, mainlyacquired in the secondary market, in the UK and continental Europe. It is among the largestequity funds in this market and its 84 assets andprojects include the Lewisham DLR extension,HM Treasury and HMRC offices, and King’sCollege Hospital. These PFI projects benefitfrom long-term concession agreements withthe public sector, with revenues largelygenerated by availability payments.
StrategyI2 aims to develop a diversified portfolio of PFIassets, generating stable returns for investorsthrough identifying portfolio synergies,optimising operational efficiencies anddeveloping appropriate financial structures.
Developments in the period3i Infrastructure made further investments into I2 during the period, for a total cost of£12.4 million. Of this, £9.1 million was investedin existing projects, while £3.3 million wasinvested in a stake in North Durham UniversityHospital.
During the first half of the year, incomedistributions due to shareholders have beenretained in the fund while a structural review of the fund is conducted. Portfolio detail
Equity interest 31.2%Date invested March 2007Cost £118.5mDirectors’ valuation £150.5mIncome in the period –Asset total return in the period £13.0mValuation basis DCF
Infrastructure Investors (“I2”)

12 3i Infrastructure plc Half-yearly report 2008
Portfolio continued
DescriptionOystercatcher has a 45% interest in threesubsidiaries of Oiltanking, based in theNetherlands, Malta and Singapore. These threebusinesses provide oil, petroleum and other oil-related and chemicals storage facilities andrelated services to a broad range of clients,including private and state oil companies,refiners, petrochemical companies and traders.Oiltanking is one of the world’s leadingindependent storage partners for oils, chemicals and gases. Oiltanking owns andoperates 62 terminals in 20 countries with atotal storage capacity of more than 13 millioncubic metres.
StrategyExperienced local management teams,supported by Oiltanking’s central managementexpertise and 3i Infrastructure’s Boardrepresentatives, seek to maximise throughputby delivering high levels of customer service andto maintain strong safety and environmentalstandards.
Developments in the periodIn Amsterdam, two new jetties were taken intooperation in July 2008, increasing the terminal’svessel handling capacity and reducing waitingtimes for customers. In Singapore, constructionof the expansion project is underway andscheduled to complete at the end of the secondquarter of 2009.
Portfolio detailEquity interest 45.0%Date invested August 2007Cost £84.5mDirectors’ valuation £97.5mIncome in the period £3.9mAsset total return in the period £3.1m*Valuation basis DCF*Asset total return includes £0.8 million of unrealised exchange loss.
Oystercatcher
DescriptionOctagon is a concession company under a 35-year PFI contract to build, operate and maintainthe Norfolk and Norwich University Hospital.Construction of the hospital was completed inAugust 2001. Octagon sub-contracts theprovision of services to Serco. Octagon receivesRPI-linked payments from the NHS Trust tocover services and buildings maintenance, which are subject to performance deductionsfor service failures and unavailability.
StrategyOctagon’s management team, with closeshareholder involvement, focuses on ensuringthe delivery of first-class service levels to the hospital and maintaining an excellentrelationship with the NHS Trust and RegionalHealth Authority.
Developments in the periodOctagon maintained its record of having noservice failures and no unavailability deductionssince commencement of operations. Norfolkand Norwich University Hospital became aFoundation Trust in May 2008. New GeneralManager and Finance Director appointmentswere made to succeed the retiring incumbentsin 2008.
Portfolio detailEquity interest 26.3%Date invested March 2007Cost £13.2mDirectors’ valuation £13.4mIncome in the period £0.5mAsset total return in the period £0.3mValuation basis DCF
Octagon

3i Infrastructure plc Half-yearly report 2008 13
DescriptionNovera is a listed renewable energy companywhich generates electricity from wind, hydro,waste and landfill gas from 57 sites across theUK, with a total capacity of 118MW.
StrategyNovera operates in landfill gas and winddevelopment, with the potential to develop newoperations in energy from waste. The companyis developing a portfolio of wind farms and has a target of 250MW in operation by 2011.Novera’s strategy is to continue to grow scale to compete effectively in the rapidly expandingrenewable energy market and to build on itsestablished platform in its UK home market.Novera is also examining possibilities to use itsexpertise in selected overseas markets.
Developments in the period3i Infrastructure acquired a 10% equity interestin Novera in February 2008. Following an equity placing by Novera in July, in which 3i Infrastructure did not participate, theCompany’s equity interest in Novera has nowreduced to 8.6%.
Portfolio detailEquity interest 8.6%Date invested February 2008Cost £11.2mDirectors’ valuation £9.2mIncome in the period –Asset total return in the period £(2.0)mValuation basis Quoted equity
Novera
DescriptionAlpha Schools is a concession company under a 30-year PFI contract to build, operate andmaintain 11 new schools on ten sites in theHighland region of Scotland. Construction isunderway under a subcontract with MorrisonConstruction. Alpha Schools subcontracts theprovision of services to Morrison FacilitiesServices. Alpha Schools receives RPI-linkedpayments from the Highland Council to coverservices and buildings maintenance, which aresubject to performance deductions for servicefailures and unavailability.
StrategyAlpha Schools’ management team is focused on the timely completion of construction andhandover of the schools for student occupation,ensuring delivery of first-class service levels to the schools and maintaining an excellentrelationship with the Highland Council.
Developments in the periodA further five schools have been completed andhanded over in the period. The eleventh andfinal school, Millburn Academy, was handedover on 6 October. Certain works will continueat various sites through to the end of October2009.
Portfolio detailEquity interest 50.0%Date invested March 2007Cost £5.0m*Directors’ valuation £7.6mIncome in the period £0.1mAsset total return in the period £2.7mValuation basis DCF*The Company has committed to invest a further £2.7 million inloan notes.
Alpha Schools
DescriptionT2C is a special-purpose company establishedto build, operate and maintain a waste-to-energy plant on an industrial park nearFrankfurt, Germany. The plant will generate heatand power from refuse-derived fuels.Construction is underway with the generalcontractor, Ebara (a Japanese environmentaltechnology developer and provider), usingexisting technology. T2C subcontractsoperation and maintenance of the plant toInfraserv GmbH & Co. Höchst KG (“ISH”), which manages the industrial park where T2C is located. T2C has contracted long-termrevenues under a 15-year fixed-price “take or pay” contract with ISH, with anupwards-only price review after ten years.
StrategyT2C’s management team is focused on the timely completion of construction andcommencement of operations, while managinguncertainties in waste supply and ash disposalthrough securing contracts with a range ofsuppliers and off-takers.
Developments in the periodThe construction contractor is forecasting adelay in reaching completion, due to productiondelays with major subcontractors. 3iInfrastructure, through its Investment Adviser, is working closely with T2C’s management andwith the construction contractor to seek tominimise and mitigate the effects of the delay.
Portfolio detailEquity interest 16.7%Date invested August 2007Cost £6.5mDirectors’ valuation £5.8mIncome in the period £(0.2)mAsset total return in the period £(2.3)m*Valuation basis DCF*Asset total return includes £0.1 million of unrealised exchange loss.
Thermal Conversion Compound (“T2C”)

14 3i Infrastructure plc Half-yearly report 2008
Portfolio continued
DescriptionThe 3i India Infrastructure Fund was establishedby 3i Group to make infrastructure investmentsin India focusing on ports, airports, roads andpower. The final close of the Fund wasannounced by 3i Group on 16 April 2008 atUS$1.2 billion.
3i Infrastructure made a commitment ofUS$250 million to the Fund. The Boardrecommended this investment to theCompany’s shareholders as it believed thiswould give the Company exposure to a largerand more diversified portfolio in India than theCompany could achieve through directinvestment, due to the scale of the Fund.
Since raising the Fund, and in this period, the 3i investment advisory team in India has beenfurther strengthened. 3i Infrastructure benefitsdirectly from this enhanced team through itsinvestment in the Fund.
Unlike 3i Group and third-party investors, theCompany will pay no advisory, management orperformance fees in connection with itsparticipation in the Fund, other than thosewhich it is contracted to pay pursuant to theterms of the investment advisory agreement.
The Fund had completed two investments, at 30 September, in Adani Power Private Limited(US$227 million) and Soma Enterprise Limited(US$101 million).
StrategyThe Fund was established to apply thesuccessful investment strategy of 3i Group’sglobal infrastructure business to the attractiveand rapidly growing Indian infrastructuremarket. The Fund’s strategy is to build adiversified portfolio of equity (or equivalent)investments in entities owning infrastructureassets whose primary commercial operationsare in India, with a primary focus on foursectors: ports, airports, roads and power. The Fund expects to make its investments over two to four years, and most individualinvestments will be in the range of US$25 million to US$150 million, althoughsome selected investments will be larger.
Developments in the periodThe Fund has continued to explore newinvestment opportunities and to work alongsidethe management teams of the existinginvestments.
Since the Fund invested, Adani Power has madesignificant advances in the initial phase of theconstruction of the power plant, which isestimated to become operational by June 2009. Adani Power has also beendeveloping a pipeline of new projects, which willsignificantly increase the long-term generationcapacity to 9,900MW from the original2,640MW.
Adani Power has been granted a licence to applyfor an IPO from the Securities and ExchangeBoard of India, and continues to monitor localmarket conditions closely, to select the bestwindow of opportunity.
Soma Enterprise Limited has also madesignificant progress since investment, witharound 30 projects across a number ofsegments currently being executed. Since theFund invested, Soma Enterprise has postedstrong revenue and profit growth.
Portfolio detailEquity interest(1) 20.9%Date invested September 2007Cost £33.6mDirectors’ valuation £53.9mIncome in the period £0.3mAsset total return in the period(2) £19.3mValuation basis LP share of fund(1) 20.9% of final closing commitments.(2) Asset total return includes £3.1 million of unrealised
exchange gains.
3i India Infrastructure Fund

3i Infrastructure plc Half-yearly report 2008 15
Junior debt portfolio
Viridian
Electricinvest Holding Company Limited £500 million Junior Facility
Viridian operates both regulated andunregulated businesses within the Irish energymarket. The regulated business manages42,000km of power transmission anddistribution infrastructure, supplying nearly800,000 homes and businesses withinNorthern Ireland. The unregulated businessfocuses on power generation within theRepublic of Ireland. A third division of Viridianoffers power-related services to the powerindustry.
Viridian was acquired by Arcapita through apublic-to-private transaction in December 2006.
NGW/Arqiva
Macquarie UK Broadcast Enterprise Limited£475 million Junior Facility
National Grid Wireless (“NGW”) is the formerwireless broadcast business of National Grid plc. The business comprises a nationalcommunications infrastructure network thatprovides broadcast transmission services forBBC television and radio, hosts wireless sites formajor mobile network operators and owns andoperates two Freeview digital TV multiplexes.NGW has around 5,500 active sites used formobile communications and around 570 towersused for radio and television transmissionbroadcasts.
NGW was acquired by a Macquarie-ledconsortium in April 2007. Following theoutcome of a regulatory review by the UK’sCompetition Commission in March 2008, theconsortium has proceeded with its plans tomerge NGW with Arqiva, a wireless businessheld within a fund managed by Macquarie.
Portfolio detail
Date invested April 2008 – September 2008
Cost £86.7mDirectors’ valuation £86.4mIncome in the period £3.5mAsset total return £3.3mValuation basis Quoted debt
Description
Thames Water
Kemble Water Structure Limited £835 millionTerm Loan Facility
Thames Water is the UK’s largest water andwaste water services company, with over 13 million customers across London and theSouth East of England.
Thames Water was acquired by a consortiumfrom RWE in 2006.
Télédiffusion de France (“TDF”)
Tyrol Acquisition 2 SAS €470 million Second Lien Facility
Originally state-owned, TDF is the leadingprovider of broadcast transmissioninfrastructure and services and telecomsinfrastructure in France. Following a number ofacquisitions, it is currently the leading providerof mast infrastructure in Germany, Finland andHungary. All of TDF’s businesses enjoy largeshares of the markets in which they operate.
TDF was part privatised in 2002, when FranceTélécom sold a majority stake to a number ofinvestors. In 2006 there was a further changeof ownership, which resulted in TDF beingacquired by a consortium comprising TPG, AXA, Charterhouse, CDC and management/employees (2%). The transaction valued thecompany at €5.0 billion.
StrategyTo build a portfolio of junior debt investments in infrastructure businesses.
The underlying businesses are in coreinfrastructure sectors (eg water, electricitydistribution and generation and communicationnetworks) and are leading players in theirrespective markets.
The pricing of the junior debt, at values belowpar, delivers attractive equity-like returns andstrong levels of cash yield.
Developments in the periodDuring the six months to September 2008 theCompany has continued to build this portfolio,making opportunistic purchases when availablepricing has met the return objectives of this portfolio.

Period from Period from16 January 16 January
Six months to 2007 to 2007 to30 September 30 September 31 March
2008 2007 2008(unaudited) (unaudited) (audited)
Notes £m £m £m
Realised profits over value on the disposal of investments 4.1 – –Unrealised profits on the revaluation of investments 14.8 18.8 68.6Foreign exchange (losses)/gains on investments (0.1) 2.4 1.2
18.8 21.2 69.8Portfolio income
Dividends 33.1 15.3 30.7Income from loans and receivables 8.0 5.4 13.8Fees payable (1.3) (4.5) (7.5)
Interest receivable 7.7 13.0 21.8Investment return 1 66.3 50.4 128.6Advisory, performance and management fees payable 2 (5.3) (3.8) (19.0)Operating expenses (0.9) (3.2) (3.9)Finance costs (6.6) (1.1) (6.6)Unrealised gain/(losses) on the fair value of derivative financial instruments 1.4 (2.1) (4.8)Other expenses (0.5) – (1.8)Profit before tax 54.4 40.2 92.5Income taxes 3 – – –Profit after tax and profit for the period 54.4 40.2 92.5Attributable to:
Equity holders of the parent 47.6 29.3 71.8Minority interests 6.8 10.9 20.7
Earnings per shareBasic earnings per share attributable to equity holders of the parent (pence) 5 6.3 4.2 10.2Diluted earnings per share attributable to equity holders of the parent (pence) 5 6.2 4.2 10.2
16 3i Infrastructure plc Half-yearly report 2008
Consolidated income statementfor the six months to 30 September 2008

Period from Period from16 January 16 January
Six months to 2007 to 2007 to30 September 30 September 31 March
2008 2007 2008(unaudited) (unaudited) (audited)
£m £m £m
Profit for the period 54.4 40.2 92.5Exchange differences on translation of foreign operations 2.8 0.3 17.5Total recognised income and expense 57.2 40.5 110.0
Total recognised income and expense attributable to the parent 50.4 29.6 89.3Total recognised income and expense attributable to minority interests 6.8 10.9 20.7
Consolidated reconciliation of movements in equityfor the six months to 30 September 2008
Period from Period from16 January 16 January
Six months to 2007 to 2007 to30 September 30 September 31 March
2008 2007 2008(unaudited) (unaudited) (audited)
Notes £m £m £m
Opening total equity attributable to equity holders of the parent 768.3 – –Total recognised income and expense attributable to the parent 50.4 29.6 89.3Issue of ordinary shares net of issue costs 111.4 693.1 693.1Ordinary dividends (21.1) – (14.1)Total equity attributable to equity holders of the parent 4 909.0 722.7 768.3Profit attributable to minority interests 6.8 10.9 20.7Minority interests 116.7 111.3 107.0Total equity attributable to minority interests 4 123.5 122.2 127.7Closing total equity 4 1,032.5 844.9 896.0
Consolidated statement of recognised income and expensefor the six months to 30 September 2008
3i Infrastructure plc Half-yearly report 2008 17

Consolidated balance sheetas at 30 September 2008
18 3i Infrastructure plc Half-yearly report 2008
30 September 30 September 31 March2008 2007 2008
(unaudited) (unaudited) (audited)Notes £m £m £m
AssetsNon-current assetsInvestments
Quoted equity investments 9.2 – 11.2Unquoted investments 629.1 472.4 548.8Loans and receivables 207.7 198.7 205.1
Investment portfolio 1 846.0 671.1 765.1Total non-current assets 846.0 671.1 765.1Current assetsOther current assets 13.0 16.4 42.4Derivative financial instruments 0.2 – 0.3Cash and cash equivalents 333.3 300.3 259.6Total current assets 346.5 316.7 302.3Total assets 1,192.5 987.8 1,067.4LiabilitiesNon-current liabilitiesLoans and borrowings (149.8) (132.7) (151.0)Total non-current liabilities (149.8) (132.7) (151.0)Current liabilitiesTrade and other payables (6.8) (8.1) (15.3)Derivative financial instruments (3.4) (2.1) (5.1)Total current liabilities (10.2) (10.2) (20.4)Total liabilities (160.0) (142.9) (171.4)Net assets 1,032.5 844.9 896.0EquityStated capital account 111.4 693.1 –Retained reserves 777.3 29.3 750.8Translation reserve 20.3 0.3 17.5Total equity attributable to equity holders of the parent 909.0 722.7 768.3Minority interests 123.5 122.2 127.7Total equity 1,032.5 844.9 896.0
Directors
2 November 2008

Consolidated cash flow statementfor the six months to 30 September 2008
3i Infrastructure plc Half-yearly report 2008 19
Period from Period from16 January 16 January
Six months to 2007 to 2007 to30 September 30 September 31 March
2008 2007 2008(unaudited) (unaudited) (audited)
£m £m £m
Cash flow from operating activitiesPurchase of investments (82.0) (534.7) (571.2)Proceeds from investments 43.1 – 19.0Income received from loans and receivables 5.0 1.2 10.1Dividends received 33.1 15.3 30.7Fees paid on investment activities (2.9) (0.1) (4.8)Operating expenses paid (0.6) (3.0) (3.6)Interest received 6.8 12.8 21.2Advisory, performance and management fees paid (13.7) (2.4) (8.5)Net cash flow from operations (11.2) (510.9) (507.1)Cash flow from financing activitiesProceeds from issue of share capital 114.6 702.9 702.9Fees paid on issue of share capital (2.8) (9.8) (9.8)Interest paid (5.3) (1.1) (6.2)Proceeds from long-term borrowings – 128.1 128.1Fees paid on financing activities (0.5) (3.0) (5.9)Dividend paid (21.1) – (14.1)Net cash flow from financing activities 84.9 817.1 795.0
Change in cash and cash equivalents 73.7 306.2 287.9Cash and cash equivalents at the beginning of the period 259.6 – –Cash in transit – (6.5) (31.9)Effect of exchange rate fluctuations – 0.6 3.6Cash and cash equivalents at the end of the period 333.3 300.3 259.6

1 Segmental analysisContinental
UK Europe Asia Totalfor the six months to 30 September 2008 (unaudited) £m £m £m £m
Investment returnRealised profit over value on the disposal of investments 4.1 – – 4.1Unrealised profits/(losses) on the revaluation of investments 0.7 (1.9) 16.0 14.8Foreign exchange losses on investments – (0.1) – (0.1)Portfolio income 32.2 7.3 0.3 39.8Interest receivable 7.7 – – 7.7
44.7 5.3 16.3 66.3Balance sheetValue of investment portfolio as at 30 September 2008 529.4 262.8 53.8 846.0
ContinentalUK Europe Asia Total
for the period from 16 January 2007 to 30 September 2007 (unaudited) £m £m £m £m
Investment returnUnrealised profits/(losses) on the revaluation of investments 21.9 (3.1) – 18.8Foreign exchange gains/(losses) on investments – 2.6 (0.2) 2.4Portfolio income 12.4 3.8 – 16.2Interest receivable 13.0 – – 13.0
47.3 3.3 (0.2) 50.4Balance sheetValue of investment portfolio as at 30 September 2007 398.7 216.2 56.2 671.1
ContinentalUK Europe Asia Total
for the period from 16 January 2007 to 31 March 2008 (audited) £m £m £m £m
Investment returnUnrealised profits/(losses) on the revaluation of investments 64.2 4.7 (0.3) 68.6Foreign exchange gains on investments – 1.2 – 1.2Portfolio income 24.6 11.2 1.2 37.0Interest receivable 21.8 – – 21.8
110.6 17.1 0.9 128.6Balance sheetValue of investment portfolio as at 31 March 2008 472.6 254.8 37.7 765.1
2 Advisory, performance and management fees payablePeriod from Period from16 January 16 January
Six months to 2007 to 2007 to30 September 30 September 31 March
2008 2007 2008(unaudited) (unaudited) (audited)
£m £m £m
Advisory fee (4.6) (3.8) (8.0)Performance fee – – (9.2)Management fees (0.7) – (1.8)
(5.3) (3.8) (19.0)
Note 8 provides further details on the calculation of the advisory fee and the performance fee.
Notes to the accounts
20 3i Infrastructure plc Half-yearly report 2008

3 Income taxesThe Company currently has exempt company status in Jersey and is exempt from Jersey income tax on non-Jersey source income. Exemptcompany status will cease on the introduction of a general zero rate of corporate tax which is being introduced from 1 January 2009.Subsidiaries of 3i Infrastructure have provided for taxation at the appropriate rates in the countries in which they operate. As the Company andits subsidiaries’ (“the Group”) investment returns are primarily non-Jersey source and included in the Company, the total tax provided for theGroup is minimal.
4 EquityStated Totalcapital Retained Translation shareholders’ Minority Total
account* reserves reserve equity interest equityfor the six months to 30 September 2008 (unaudited) £m £m £m £m £m £m
Opening balance – 750.8 17.5 768.3 127.7 896.0Total recognised income and expense – 47.6 2.8 50.4 6.8 57.2Issue of ordinary shares 114.6 – – 114.6 – 114.6Cost of share issue (3.2) – – (3.2) – (3.2)Minority interest – – – – (11.0) (11.0)Dividend paid to Company shareholders (3.0p per ordinary share) – (21.1) – (21.1) – (21.1)Closing balance 111.4 777.3 20.3 909.0 123.5 1,032.5
Stated Totalcapital Retained Translation shareholders’ Minority Total
account reserves reserve equity interest equityfor the period from 16 January 2007 to 30 September 2007 (unaudited) £m £m £m £m £m £m
Opening balance – – – – – –Total recognised income and expense – 29.3 0.3 29.6 10.9 40.5Issue of ordinary shares 702.9 – – 702.9 – 702.9Cost of share issue (9.8) – – (9.8) – (9.8)Minority interest – – – – 111.3 111.3Closing balance 693.1 29.3 0.3 722.7 122.2 844.9
Stated Totalcapital Retained Translation shareholders’ Minority Total
account* reserves reserve equity interest equityfor the period from 16 January 2007 to 31 March 2008 (audited) £m £m £m £m £m £m
Opening balance – – – – – –Total recognised income and expense – 71.8 17.5 89.3 20.7 110.0Issue of ordinary shares 702.9 – – 702.9 – 702.9Costs of share issue (9.8) – – (9.8) – (9.8)Transfer* (693.1) 693.1 – – – –Dividend paid to Company shareholders (2.0p per ordinary share) – (14.1) – (14.1) – (14.1)Minority Interest – – – – 107.0 107.0Closing balance – 750.8 17.5 768.3 127.7 896.0* The stated capital account was reduced by Court order on 20 December 2007 with an amount of £693.1 million transferred to a new, distributable reserve which has been combined
with retained reserves in these accounts. Following this transfer, at 31 March 2008 the amount remaining to the credit of the Company’s stated capital account was £2. Through theplacing and open offer in July 2008, 108,132,277 new shares were issued. The proceeds of this share issue have been credited to the stated capital account, which is distributable toshareholders.
3i Infrastructure plc Half-yearly report 2008 21

5 Share informationThe Company is authorised to issue an unlimited number of ordinary shares with no par value.
As at 30 September 2008 As at 30 September 2007 As at 31 March 2008(unaudited) (unaudited) (audited)
Number £m Number £m Number £m
Issued and fully paidOpening balance 702,859,804 702.9 – – – –Issued on incorporation – – 2 – 2 –Issued on IPO – – 700,000,000 700.0 700,000,000 700.0Issued as part of over-allotment arrangement – – 2,859,802 2.9 2,859,802 2.9Issued as part of placing and open offer 108,132,277 114.6 – – – –
Closing balance 810,992,081 817.5 702,859,804 702.9 702,859,804 702.9
Under the initial public offering in March 2007, ordinary shares were issued for £1.00, resulting in £702.9 million proceeds being received.For every ten shares issued as part of the IPO, one warrant was issued resulting in 70 million being issued. A further 640,980 warrants wereissued as part of the over-allotment arrangement. Each warrant entitles the holder to subscribe for one ordinary share at £1.00 at any timefrom 13 September 2007 to 13 March 2012. At 30 September 2008, there were 70,640,980 warrants in issue, with no conversions in theperiod.
On 9 July 2008 a further 108.1 million ordinary shares were issued as part of the placing and open offer for a price of £1.06, resulting in£114.6 million proceeds being received. No warrants were attached to these shares.
The earnings and net assets per share attributable to the equity holders of the parent are based on the following data:Period from Period from16 January 16 January
Six months to 2007 to 2007 to30 September 30 September 31 March
2008 2007 2008(unaudited) (unaudited) (audited)
Earnings per share (pence)Basic 6.3 4.2 10.2Diluted 6.2 4.2 10.2Earnings (£ million)Profit for the period attributable to equity holders of the parent 47.6 29.3 71.8
Number of shares (million)Weighted average number of shares in issue 756.9 702.9 702.9Effect of dilutive potential ordinary shares – warrants 9.7 1.1 2.4Diluted shares 766.6 704.0 705.3
As at As at As at30 September 30 September 31 March
2008 2007 2008(unaudited) (unaudited) (audited)
Net assets per share (pence)Basic 112.1 102.8 109.3Diluted 111.1 102.6 108.5Net assets (£ million)Net assets attributable to equity holders of the parent 909.0 722.7 768.3
Notes to the accounts continued
22 3i Infrastructure plc Half-yearly report 2008
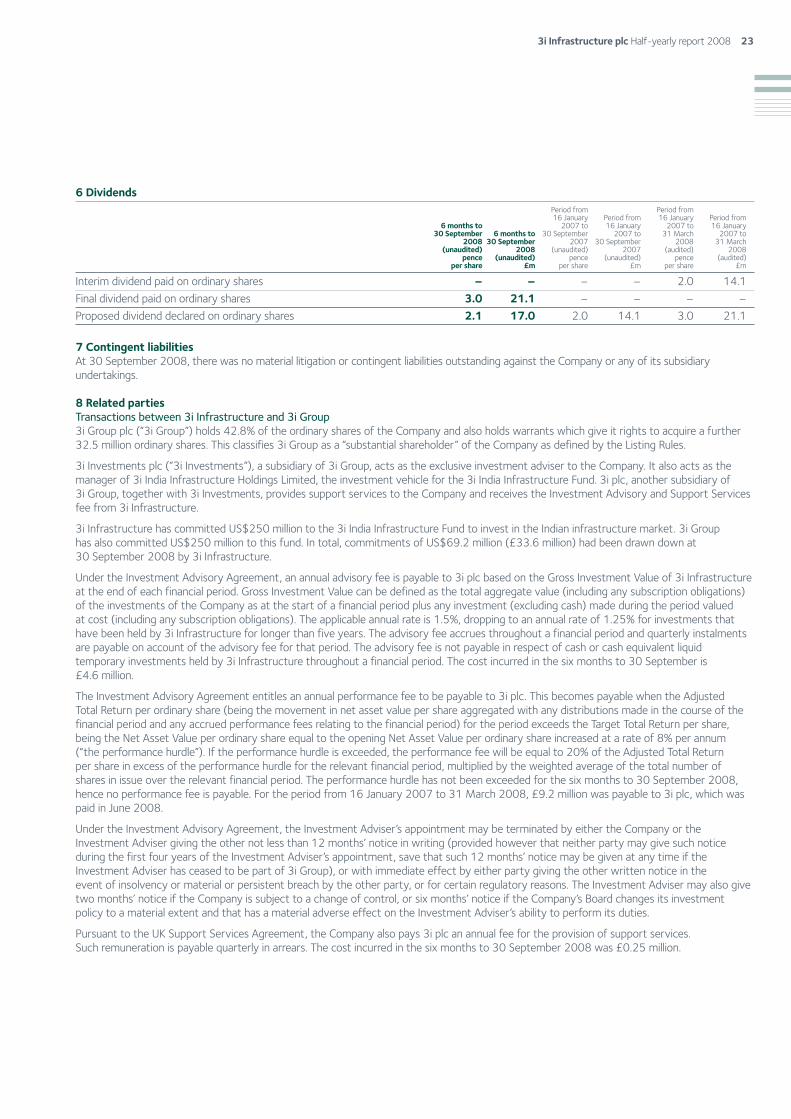
6 DividendsPeriod from Period from16 January Period from 16 January Period from
6 months to 2007 to 16 January 2007 to 16 January30 September 6 months to 30 September 2007 to 31 March 2007 to
2008 30 September 2007 30 September 2008 31 March(unaudited) 2008 (unaudited) 2007 (audited) 2008
pence (unaudited) pence (unaudited) pence (audited)per share £m per share £m per share £m
Interim dividend paid on ordinary shares – – – – 2.0 14.1Final dividend paid on ordinary shares 3.0 21.1 – – – –Proposed dividend declared on ordinary shares 2.1 17.0 2.0 14.1 3.0 21.1
7 Contingent liabilitiesAt 30 September 2008, there was no material litigation or contingent liabilities outstanding against the Company or any of its subsidiaryundertakings.
8 Related partiesTransactions between 3i Infrastructure and 3i Group3i Group plc (“3i Group”) holds 42.8% of the ordinary shares of the Company and also holds warrants which give it rights to acquire a further32.5 million ordinary shares. This classifies 3i Group as a “substantial shareholder” of the Company as defined by the Listing Rules.
3i Investments plc (“3i Investments”), a subsidiary of 3i Group, acts as the exclusive investment adviser to the Company. It also acts as themanager of 3i India Infrastructure Holdings Limited, the investment vehicle for the 3i India Infrastructure Fund. 3i plc, another subsidiary of 3i Group, together with 3i Investments, provides support services to the Company and receives the Investment Advisory and Support Servicesfee from 3i Infrastructure.
3i Infrastructure has committed US$250 million to the 3i India Infrastructure Fund to invest in the Indian infrastructure market. 3i Group has also committed US$250 million to this fund. In total, commitments of US$69.2 million (£33.6 million) had been drawn down at 30 September 2008 by 3i Infrastructure.
Under the Investment Advisory Agreement, an annual advisory fee is payable to 3i plc based on the Gross Investment Value of 3i Infrastructureat the end of each financial period. Gross Investment Value can be defined as the total aggregate value (including any subscription obligations)of the investments of the Company as at the start of a financial period plus any investment (excluding cash) made during the period valued at cost (including any subscription obligations). The applicable annual rate is 1.5%, dropping to an annual rate of 1.25% for investments thathave been held by 3i Infrastructure for longer than five years. The advisory fee accrues throughout a financial period and quarterly instalmentsare payable on account of the advisory fee for that period. The advisory fee is not payable in respect of cash or cash equivalent liquidtemporary investments held by 3i Infrastructure throughout a financial period. The cost incurred in the six months to 30 September is £4.6 million.
The Investment Advisory Agreement entitles an annual performance fee to be payable to 3i plc. This becomes payable when the Adjusted Total Return per ordinary share (being the movement in net asset value per share aggregated with any distributions made in the course of thefinancial period and any accrued performance fees relating to the financial period) for the period exceeds the Target Total Return per share,being the Net Asset Value per ordinary share equal to the opening Net Asset Value per ordinary share increased at a rate of 8% per annum (“the performance hurdle”). If the performance hurdle is exceeded, the performance fee will be equal to 20% of the Adjusted Total Return per share in excess of the performance hurdle for the relevant financial period, multiplied by the weighted average of the total number ofshares in issue over the relevant financial period. The performance hurdle has not been exceeded for the six months to 30 September 2008, hence no performance fee is payable. For the period from 16 January 2007 to 31 March 2008, £9.2 million was payable to 3i plc, which was paid in June 2008.
Under the Investment Advisory Agreement, the Investment Adviser’s appointment may be terminated by either the Company or theInvestment Adviser giving the other not less than 12 months’ notice in writing (provided however that neither party may give such noticeduring the first four years of the Investment Adviser’s appointment, save that such 12 months’ notice may be given at any time if theInvestment Adviser has ceased to be part of 3i Group), or with immediate effect by either party giving the other written notice in the event of insolvency or material or persistent breach by the other party, or for certain regulatory reasons. The Investment Adviser may also givetwo months’ notice if the Company is subject to a change of control, or six months’ notice if the Company’s Board changes its investmentpolicy to a material extent and that has a material adverse effect on the Investment Adviser’s ability to perform its duties.
Pursuant to the UK Support Services Agreement, the Company also pays 3i plc an annual fee for the provision of support services. Such remuneration is payable quarterly in arrears. The cost incurred in the six months to 30 September 2008 was £0.25 million.
3i Infrastructure plc Half-yearly report 2008 23
Basis of preparation
These financial statements are the unaudited condensed half-yearly consolidated financial statements (the “Half-yearly Financial Statements”)of 3i Infrastructure plc, a company incorporated and registered in Jersey, and its subsidiaries (together referred to as the “Group”) for the six-month period ended 30 September 2008. The Half-yearly Financial Statements have been prepared in accordance with InternationalAccounting Standard 34 Interim Financial Reporting (“IAS 34”) and should be read in conjunction with the consolidated financial statements for the period to 31 March 2008 (“Report and accounts 2008”), as they provide an update of previously reported information.
The Half-yearly Financial Statements were authorised for issue by the Directors on 2 November 2008.
The Half-yearly Financial Statements have been prepared in accordance with the accounting policies set out in the Report and accounts 2008as the new and revised International Financial Reporting Standards (“IFRS”) and interpretations effective in the period have had no impact onthe accounting policies of the Group. The presentation of the Half-yearly Financial Statements is consistent with the Report and accounts2008. Where necessary, comparative information has been reclassified or expanded from the previously reported Half-yearly FinancialStatements to take into account any presentational changes made in the Report and accounts 2008. The Half-yearly Financial Statements do not constitute statutory accounts. The statutory accounts for the period to 31 March 2008, prepared under IFRS, have been filed with the Jersey Financial Services Commission Companies Registry on which the auditors issued a report, which was unqualified.
The preparation of the Half-yearly Financial Statements requires management to make judgments, estimates and assumptions that affect theapplication of policies and reported amounts of assets and liabilities, income and expenses. The estimates and associated assumptions are basedon historical experience and other factors that are believed to be reasonable under the circumstances, the results of which form the basis ofmaking the judgments about carrying values of assets and liabilities that are not readily apparent from other sources. Actual results may differfrom these estimates.
The estimates and underlying assumptions are reviewed on an ongoing basis. Revisions to accounting estimates are recognised in the period inwhich the estimate is revised if the revision affects only that period, or in the period of the revision and future periods if the revision affectsboth current and future periods. The accounting policies have been updated during the six months to 30 September 2008 to reflect theintroduction of hedge accounting for net investment hedges. All other accounting policies used in the preparation of the Half-yearly FinancialStatements are consistent with those stated in the Annual Report and Accounts to 31 March 2008. Net investment derivatives will beaccounted for as follows:
For those derivatives designated as hedges and for which hedge accounting is desired, the hedging relationship is documented at its inception.This documentation identifies the hedging instrument, the hedged item or transaction, the nature of the risk being hedged and howeffectiveness will be measured throughout its duration. Such hedges are expected at inception to be highly effective.
For the purpose of hedge accounting, all hedges held by the Group are classified as net investment hedges and hedge the exposure of theGroup to foreign currency risk due to movements in the re-translation of subsidiary undertakings that have a functional currency that isdifferent to the presentational currency of the Group.
For net investment hedges, the effective portion of the gain or loss on the hedging instrument is recognised directly in equity, while theineffective portion is recognised in the income statement. Amounts taken to equity are transferred to the income statement upon therealisation of the Group’s investment in the subsidiary undertaking.
If the hedging instrument expires or is sold, terminated or exercised without replacement or rollover, or if its designation as a hedge is revoked,amounts previously recognised in equity remain in equity until the forecast transaction occurs and are transferred to the income statement asabove.
Any gains or losses arising from changes in the fair value of derivatives that do not qualify for hedge accounting are taken to the incomestatement.
The most significant techniques for the valuation of the investment portfolio are described in “portfolio valuation methodology” on page 28.
Statement of Directors’ responsibilitiesThe Directors confirm to the best of their knowledge that:
a) the condensed set of financial statements have been prepared in accordance with IAS 34 as adopted by the European Union; and
b) the half-yearly report includes a fair review of the information required by the FSA’s Disclosure and Transparency Rules (4.2.7 R and 4.2.8 R).
The Directors of 3i Infrastructure plc and their functions are listed on the inside front cover.
By order of the Board
Peter Sedgwick
Chairman
2 November 2008
Accounting policies
24 3i Infrastructure plc Half-yearly report 2008

We have been engaged by the Company to review the consolidated condensed set of financial statements in the Half-yearly FinancialStatements for the six months to 30 September 2008 which comprise the consolidated income statement, consolidated statement ofrecognised income and expense, consolidated reconciliation of movements in equity, consolidated balance sheet, consolidated cash flowstatement, notes 1 to 8 to the accounts and the accounting policy section. We have read the other information contained in the half-yearlyfinancial report and considered whether it contains any apparent misstatements or material inconsistencies with the information in thecondensed set of financial statements.
This report is made solely to the Company in accordance with guidance contained in International Standard on Review Engagements (UK andIreland) 2410 “Review of Interim Financial Information Performed by the Independent Auditor of the Entity” issued by the Auditing PracticesBoard. To the fullest extent permitted by law, we do not accept or assume responsibility to anyone other than the Company, for our work, forthis report, or for the conclusions we have formed.
Directors’ responsibilitiesThe half-yearly report is the responsibility of, and has been approved by, the Directors. The Directors are responsible for preparing the half-yearly report in accordance with the Disclosure and Transparency Rules of the United Kingdom’s Financial Services Authority.
As disclosed within the Basis of preparation, the annual financial statements of the Company are prepared in accordance with IFRSs. The condensed set of financial statements included in this half-yearly report has been prepared in accordance with International AccountingStandard 34, “Interim Financial Reporting”.
Our responsibilityOur responsibility is to express to the Company a conclusion on the condensed set of financial statements in the half-yearly report based onour review.
Scope of reviewWe conducted our review in accordance with International Standard on Review Engagements (UK and Ireland) 2410, “Review of InterimFinancial Information Performed by the Independent Auditor of the Entity” issued by the Auditing Practices Board for use in the UnitedKingdom. A review of interim financial information consists of making enquiries, primarily of persons responsible for financial and accountingmatters, and applying analytical and other review procedures. A review is substantially less in scope than an audit conducted in accordance withInternational Standards on Auditing (UK and Ireland) and consequently does not enable us to obtain assurance that we would become aware ofall significant matters that might be identified in an audit. Accordingly, we do not express an audit opinion.
ConclusionBased on our review, nothing has come to our attention that causes us to believe that the condensed set of financial statements in the Half-yearly report and accounts for the six months to 30 September 2008 is not prepared, in all material respects, in accordance with InternationalAccounting Standard 34 and the Disclosure and Transparency Rules of the United Kingdom’s Financial Services Authority.
Ernst & Young LLPJersey
2 November 2008
Independent review reportto the members of 3i Infrastructure plc
3i Infrastructure plc Half-yearly report 2008 25

The table below provides information on the investment portfolio, presented on the investment basis as at 30 September 2008.Directors’
Cost valuationInvestment and description Sector Geography £m £m
Anglian Water Group Limited Utilities UKWater supply and waste water services
140.0 152.1Infrastructure Investors LP (I2) Social Infrastructure UKSecondary PFI Fund
118.5(1) 150.5Oystercatcher Luxco 2 S.àr.l. Transportation Continental Europe(2)
Oil, petroleum products and chemicals storage84.5 97.5
3i India Infrastructure Holdings Limited Utilities(3) AsiaPower and Transport Fund
33.6 53.9Octagon Healthcare Limited Social Infrastructure UKNorfolk and Norwich University Hospital
13.2 13.4Novera Energy plc Utilities UKRenewable energy generation
11.2 9.2Thermal Conversion Compound Industriepark Höchst GmbH Utilities Continental EuropeWaste-to-energy power plant
6.5 5.8Alpha Schools (Highland) Holdings Limited Social Infrastructure UKPFI schools in Scotland
5.0 7.6Junior Debt Portfolio Utilities UK and
Continental EuropeInvestment in Thames Water, Viridian, TDF, NGW
86.7 86.4499.2 576.4
(1) Investment of £137.5m net of £19.0m proceeds returned in the period to 31 March 2008.(2) Operations in the Netherlands, Malta and Singapore.(3) The Company held two investments as at 30 September 2008 in the Power and Infrastructure construction sectors. Due to the current weighting of the underlying assets, the
Fund has been classified as a utility investment in the table above.
Investments
26 3i Infrastructure plc Half-yearly report 2008

The Company aims to build a diversified portfolio of equity investments in entities owning infrastructure businesses and assets. The Companyseeks investment opportunities globally, but with a focus on Europe, North America and Asia.
The Company’s equity investments will often comprise share capital and related shareholder loans (or other financial instruments that are notshares but that, in combination with shares, are similar in substance). The Company may also invest in junior or mezzanine debt in infrastructurebusinesses or assets.
Most of the Company’s investments are in unquoted companies. However, the Company may also invest in entities owning infrastructurebusinesses and assets whose shares or other instruments are listed on any stock exchange, irrespective of whether they cease to be listed after completion of the investment, if the Directors judge that such an investment is consistent with the Company’s investment objectives. The Company will, in any case, invest no more than 15% of its total gross assets in other investment companies or investment trusts which are listed on the Official List.
The Company may also consider investing in other fund structures (in the event that it considers, on receipt of advice from the InvestmentAdviser, that is the most appropriate and effective means of investing), which may be advised or managed either by the Investment Adviser or a third party. If the Company invests in another fund advised or managed by 3i Group, the relevant proportion of any advisory ormanagement fees payable by the investee fund to 3i plc will be deducted from the annual advisory fee payable under the Investment AdvisoryAgreement and the relevant proportion of any performance fee will be deducted from the annual performance fee, if payable, under theInvestment Advisory Agreement. For the avoidance of doubt, there will be no similar set-off arrangement where any such fund is advised ormanaged by a third party.
For most investments, the Company seeks to obtain representation on the board of directors of the investee company (or equivalent governingbody) and in cases where it acquires a majority equity interest in a business, that interest may also be a controlling interest.
No investment made by the Company will represent more than 20% of the Company’s gross assets, including cash holdings, at the time of themaking of the investment. It is expected that most individual investments will exceed £50 million. In some cases, the total amount required for an individual transaction may exceed the maximum amount that the Company is permitted to commit to a single investment. In suchcircumstances, the Company may consider entering into co-investment arrangements with 3i Group (or other investors who may also besignificant shareholders), pursuant to which 3i Group and its subsidiaries (or such other investors) may co-invest on the same financial andeconomic terms as the Company. The suitability of any such co-investment arrangements will be assessed on a transaction-by-transactionbasis and would be subject to both Board and, where applicable, 3i Group and its subsidiaries approval. Depending on the size of the relevantinvestment and the identity of the relevant co-investor, such a co-investment arrangement may be subject to the related party transactionprovisions contained in the Listing Rules and may therefore require shareholder consent.
The Company’s Articles require its outstanding borrowings, including any financial guarantees to support subsequent obligations, to be limitedto 50% of the gross assets of the Group (valuing investments on the basis included in the Group’s accounts).
In accordance with Listing Rules requirements, the Company will only make a material change to its investment policy with the approval of shareholders.
Investment policy
3i Infrastructure plc Half-yearly report 2008 27

A description of the methodology used to value the portfolio of 3i Infrastructure and its subsidiaries (“the Group”) is set out below in order toprovide more detailed information than is included within the accounting policies and the Investment Adviser’s report for the valuation of theportfolio. The methodology complies in all material aspects with the “International Private Equity and Venture Capital valuation guidelines”which are endorsed by the British Private Equity and Venture Capital Association and the European Private Equity and Venture CapitalAssociation.
Basis of valuationInvestments are reported at the Directors’ estimate of fair value at the reporting date. Fair value represents the amount for which an assetcould be exchanged between knowledgeable, willing parties in an arm’s length transaction.
GeneralIn estimating fair value, the Directors seek to use a methodology that is appropriate in light of the nature, facts and circumstances of theinvestment and its materiality in the context of the overall portfolio. The methodology that is the most appropriate may consequently includeadjustments based on informed and experience-based judgments, and will also consider the nature of the industry and market practice.Methodologies are applied consistently from period to period except where a change would result in a better estimation of fair value. Given the uncertainties inherent in estimating fair value, a degree of caution is applied in exercising judgments and making necessary estimates.
Quoted investmentsQuoted equity investments are valued at closing bid price at the reporting date. In accordance with International Financial Reporting Standards,no discount is applied for liquidity of the stock or any dealing restrictions.
Quoted debt investments will be valued using quoted prices provided by third-party broker information where reliable or will be held at costless fair value adjustments.
Unquoted investmentsUnquoted investments are valued using one of the following methodologies:
– Discounted Cash Flow (“DCF”)
– Limited Partnership share of fund net assets
– Sales basis: expected sales proceeds
– Cost less any fair value adjustments required
DCFDCF is the primary basis for valuation. In using the DCF basis, fair value is estimated by deriving the present value of the investment usingreasonable assumptions and estimation of expected future cash flows and the terminal value and date, and the appropriate risk-adjusteddiscount rate that quantifies the risk inherent to the investment. The discount rate will be estimated for each investment derived from themarket risk-free rate, a risk-adjusted premium and information specific to the investment or market sector.
LP share of fund net assetsWhere the Group has made investments into other infrastructure funds, the value of the investment will be derived from the Group’s share ofnet assets of the fund based on the most recent reliable financial information available from the fund. Where the underlying investments withina fund are valued on a DCF basis, the discount rate applied may be adjusted by the Company to reflect its assessment of the most appropriatediscount rate for the nature of assets held in the fund.
Sales basisThe expected sales proceeds methodology will be used in cases where offers have been received as part of an investment sales process. This may either support the value derived from another methodology or may be used as the valuation. A marketability discount is applied to the expected sale proceeds to derive the valuation where appropriate.
Cost less fair value adjustmentAny investment in a company that has failed or, in the view of the Board, is expected to fail within the next 12 months, has the equity sharesvalued at nil and the fixed income shares and loan instruments valued at the lower of cost and net recoverable amount.
28 3i Infrastructure plc Half-yearly report 2008
Portfolio valuation methodology

Designed and produced by Radley Yeldar www.ry.com
Information for shareholders
3i Infrastructure plc Half-yearly report 2008 29
Financial calendarEx-dividend date for interim dividend 12 November 2008Record date for interim dividend 14 November 2008Interim dividend expected to be paid 12 December 2008
RegistrarsFor shareholder services, including changes of address, the registrar details are as follows:
Capita Registrars (Jersey) Limited12 Castle Street, St. HelierJersey JE2 3RTChannel Islands
e-mail: [email protected]: +44 (0) 1534 632310 or theShareholder helpline: +44 (0) 871 664 0300
WebsiteFor full up-to-date investor relations information including the latest share price, recent reports, results presentations and financial news, please visit our investor relations website www.3i-infrastructure.com.
If you would prefer to receive shareholder communications electronically in future, including your annual and half-yearlyreports and notices of meetings, please go to www.3i-infrastructure.com/e-comms for details of how to register.
3i Infrastructure plcRegistered office: 22 Grenville Street, St. HelierJersey JE4 8PXChannel Islands
Tel: +44(0)1534 609000Fax: +44(0)1534 609333
Registered in Jersey No. 95682
Frequently used Registrars’ forms may be found on our website atwww.3i-infrastructure.com/e-comms

3i Infrastructure plc 22 Grenville Street, St. Helier, Jersey, Channel Islands JE4 8PXTelephone +44 (0)1534 609000Fax +44 (0)1534 609333Website www.3i-infrastructure.comM63608