half year results presentation - garda property · 2019-10-02 · garda capital group half year...
TRANSCRIPT

GARDA CAPITAL GROUP(ASX CODE: GCM)
HALF YEAR RESULTS PRESENTATION
20 FEBRUARY 2019

GARDA CAPITAL GROUP HALF YEAR RESULTS PRESENTATION FEBRUARY 2019 | 2
OVERVIEW• GARDA Capital Group operates and invests in real estate.
• GARDA Capital Group (ASX: GCM) is a stapled security comprising GARDA Capital Limited and GARDA Capital Trust.
• GARDACapitalLimitedisfundmanagerforGARDADiversifiedPropertyFund(ASX:GDF)andGCMisalsoasubstantialownerwitha13.8%investmentinGDF.
• GARDAconsiderstheperformanceandvalueofeachofthesetwoactivitiesseparately:
Performance
∂Operatingactivities–feerevenuegeneratedfromtheGroup’svariousactivities.
∂Investingactivities–returnsoncapitaldeployed,e.g.distributions,interest,valuechanges.
Value
∂Operating–underlyingprofitaftertaxatamultiple.
∂ Investing – Group net assets.
• StatutoryreportingpresentstheGroup’sresultsasawholeandrecognisesvaluechanges(marktomarketchanges)throughrevenue.
GARDA CAPITAL GROUP HALF YEAR RESULTS PRESENTATION FEBRUARY 2019 | 3
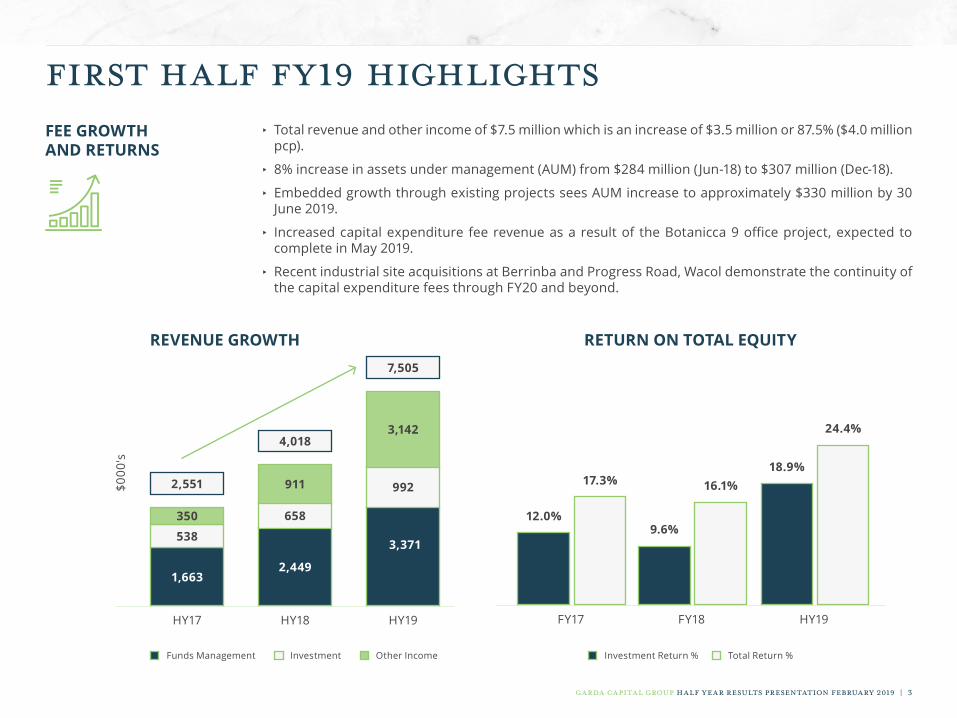
FIRST HALF FY19 HIGHLIGHTSFEE GROWTH AND RETURNS
∂Totalrevenueandotherincomeof$7.5millionwhichisanincreaseof$3.5millionor87.5%($4.0millionpcp).
∂8%increaseinassetsundermanagement(AUM)from$284million( Jun-18)to$307million(Dec-18).
∂EmbeddedgrowththroughexistingprojectsseesAUMincreasetoapproximately$330millionby30June2019.
∂Increasedcapitalexpenditure fee revenueasa resultof theBotanicca9officeproject,expected tocompleteinMay2019.
∂RecentindustrialsiteacquisitionsatBerrinbaandProgressRoad,WacoldemonstratethecontinuityofthecapitalexpenditurefeesthroughFY20andbeyond.
$000
's
HY18
REVENUE GROWTH RETURN ON TOTAL EQUITY
FundsManagement Investment Investment Return % Total Return %OtherIncome
658
4,018
HY17
538
2,551
350
911
HY19
992
7,505
3,142
1,6632,449
3,371
HY19FY18FY17
18.9%
9.6%12.0%
24.4%
16.1%17.3%

GARDA CAPITAL GROUP HALF YEAR RESULTS PRESENTATION FEBRUARY 2019 | 4
FIRST HALF FY19 HIGHLIGHTSEARNINGS AND RETURNS
∂GroupNPATof$4.8million(operating and investing activities),representinga142%increaseonpriorperiod(HY18$2.0million).
∂92%increaseinunderlyingoperating activityearningsaftertaxof$1.1million(HY18$0.6million).
∂HY19underlyinginvestment activityearningsaftertax,(adoptingthe31December2018ASXclosingprice) was $3.7 million or 18.9% returnforthehalf-year,on30June2018netassetsof$19.8million.
∂AtotalreturnonequityforHY19of$4.8 million or 24.4%1wasachievedon30June2018netassetsof$19.8million.
1.Totalreturnonsecurityholdersequityismeasured,asthesumoftheunderlyingoperatingactivitiesearningsaftertaxandtheunderlyinginvestingactivitiesearningsaftertax,overtheGroup’sequityatthebeginningofthefinancialperiod.
$000
's
HY17
35
HY18
570
HY19
1,096
UNDERLYING OPERATING ACTIVITY EARNINGS AFTER TAX
DPS OperatingEPS StatutoryEPS
cent
s pe
r se
curi
ty
1.9
4.7
8.2
3.4
7.0
19.9
EARNINGS AND RETURNS PER SECURITY
HY18 HY19

GARDA CAPITAL GROUP HALF YEAR RESULTS PRESENTATION FEBRUARY 2019 | 5
FIRST HALF FY19 HIGHLIGHTSBALANCE SHEET ∂InvestmentinGDFvaluedat$28.9millionatDecember2018ASXclosingpriceof$1.32persecurity.
∂GCMincreaseditsinvestmentinGDFby$4.0millionviaparticipationintheGDFOctober2018placementat$1.25,takingitsstaketo13.8%ofissuedunits.
∂ContinuedinvestmentindebtpositionswiththeadvancementoftwonewloansbytheGrouptothirdpartiestotalling$2.1million.
$million
GCM NET ASSETS
$million
GCM TOTAL ASSETS
FY16
1.2
FY17
18.2
FY18
19.8
HY19
23.8
FY16
16.8
FY17
21.1
FY18
33.1
HY19
37.5

GARDA CAPITAL GROUP HALF YEAR RESULTS PRESENTATION FEBRUARY 2019 | 6
FIRST HALF FY19 HIGHLIGHTSDISTRIBUTIONS ∂Totalsecurityholderpaymentsforthehalf-yearof3.375centspersecurityforH1FY19,an80%increase
onH1FY18,madeupof:
∂Fullyfrankeddividendof1.125centspersecurity;and
∂100%taxadvantagedtrustdistributionsof2.25centspersecurity.
∂The Group will continue to distribute on a quarterly basis the distributions it receives from GDF,expectedtototal2.5centsforH2FY19.
∂TheGroupwillalsoconsiderafullyeardividendpayment.

GARDA CAPITAL GROUP HALF YEAR RESULTS PRESENTATION FEBRUARY 2019 | 7
EARNINGS GROWTH AND RETURNS• 92%increaseinunderlyingoperatingactivity
earnings after tax of $1.1million (HY18 $0.6million).
• 142%increaseinGroupNPATto$4.8million(HY18$2.0million).
• Total securityholder payments of 3.375centsperunitforHY19representingan80%increaseonHY18distributions,madeupof:
∂Fullyfrankeddividendof1.125centsand
∂2.25 cents distributions (100% taxadvantaged).
Operating ActivitiesActual
HY19$000's
HY18$000's
Underlyingoperatingactivityearningsbeforetax 1,510 783
Incometaxexpense (414) (213)
Underlying operating activity earnings after tax 1,096 570
InvestmentNetdistributionsandinterestrevenue 638 600
Fairvaluemovement 3,122 911
Incometaxexpense (21) (50)
Underlying investment activity earnings after tax 3,739 1,461
Underlying operating profit after tax 4,835 2,031
Statutory Profit ReconciliationUnderlying operating profit after tax 4,835 2,031
Non-cashexpenses (59) (57)
Statutory profit after tax 4,776 1,974

GARDA CAPITAL GROUP HALF YEAR RESULTS PRESENTATION FEBRUARY 2019 | 8
STATUTORY REVENUE AND PROFIT• 87%increaseintotalrevenue,includingthemark-to-
marketoftheGroup’sholdinginGDF.
• 40%increaseinrevenuecomprisedof:
∂ 38% increase in funds management revenue, which included an increase in both recurring andtransactionalrevenuestreams;and
∂51%increaseininvestmentrevenue,asaresultofanincreaseintheGroup’sinvestmentinGDF.
• ContinuedfairvaluegainsonGDFinvestment.
Summarised Statement of Profit and Loss HY19$000's
HY18$000's
Revenue 4,363 3,107
OtherIncome 3,142 911
Total Revenue 7,505 4,018
Segment Revenue
FundsManagement 3,371 2,449
Investment 992 658
Total Revenue 4,363 3,107
OperatingExpenses (1,802) (1,608)
Operating EBIT 2,561 1,499
InterestExpense (432) (116)
Operating Profit Before Tax 2,129 1,383
IncomeTaxExpense (436) (263)
Operating Profit After Tax 1,693 1,120
SpecificNonCashandMTMIncome 3,142 911
SpecificNonCashandMTMExpenses (59) (57)
Net Movement 3,083 854
Statutory Profit After Tax 4,776 1,974

GARDA CAPITAL GROUP HALF YEAR RESULTS PRESENTATION FEBRUARY 2019 | 9
BALANCE SHEET• TheGroup’smajor balance sheet item is its
unitholdinginGDF.
• This investment (financial assets) is carriedatthe31December2018ASXclosingpriceof$1.32perunit,comparedto$1.165perunitat30June2018.
• Cash decreased from $8.5 million to $3.5million due to deployment into debt andequity investments.
• Netassetsfortheyearincreased$4.0millionor20%,from$19.8millionto$23.8million.
• Borrowingsconsistofa$10.0millionloantopartially fund the GDF investment, and thecapitaladequacy loanof$1.97millionwhichissubjecttoanASICdeedofsubordination.
Summarised Statement of Financial PositionHalf Year31 Dec 18
$000's
Full Year30 June 18
$000'sAssetsCashandCashEquivalents 3,459 8,547TradeandOtherReceivables 3,538 1,133FinancialAssets 28,908 21,786InvestmentProperties 1,250 1,250DeferredTaxAsset - -IntangibleAsset 307 326OtherAssets 76 84Total Assets 37,538 33,126LiabilitiesTradeandOtherPayables 1,152 1,153Borrowings 11,970 11,970CurrentTaxLiability 507 102DeferredTaxLiability 88 57OtherLiabilities 31 42Total Liabilities 13,748 13,324Net Assets 23,790 19,802

GARDA CAPITAL GROUP HALF YEAR RESULTS PRESENTATION FEBRUARY 2019 | 10
OPERATING ACTIVITIES
• TheGroup’soperatingactivitiesgeneraterevenuefromfundsmanagement.
• GARDAistheresponsibleentityandfundmanager(andholdsa13.8%investment)ofGARDADiversifiedPropertyFund(ASX: GDF).
• Fundmanagementrevenuesareprimarilyderivedfromfeesbasedonassetsundermanagement(AUM).
• RevenuefortheyearisdrivenfromtheaverageAUM,soakeymetricisthestartingAUMinFY19comparedtotheaverageAUMforFY18.
• Additionally fundmanagementrevenues includecapitalexpenditure fees,propertyand facilitiesmanagementandother realestateagencyfunctionssuchasleasing.
• TheGroup’sdebtactivityrevenuesconsistofprocurementandtrailorestablishmentandlinefees.TheGroupispivotingfromtraditionalbrokeragetoaco-investmentdebtfundsmanagementmodelandhascompleteditsfirstsyndicatedadvancewithhouseandthirdpartycapitalduringthe1HFY19.

GARDA CAPITAL GROUP HALF YEAR RESULTS PRESENTATION FEBRUARY 2019 | 11
GROWTH IN ASSETS UNDER MANAGEMENT (AUM)
• GARDAcontinuestogrowAUMyearonyearfortheGARDADiversifiedPropertyFund.
• GARDAhasembeddedAUMgrowthfrom:
∂Botanicca9project–7,150m²officebuildingdueforcompletioninMay2019(AUMof$330million)
∂Berrinbaproject–approximate5,500m²industrialbuildingtocommenceinH1FY20(AUMof$337million)
∂ProgressRoad,Wacolproject-approximate17,000m²industrialcomplextocommenceconstructioninH1FY20 (AUMto$367million)
GROWTH IN AUM
$ m
illio
ns
FY16
154
FY15
141
FY17
188.1
FY18
284
HY19 Actual
307
FY19 Forecast
*AUMgrowthbasedontheforecast completion values of Botanicca9,BerrinbaandWacol.
343*
FY20 Forecast
367*400
0
200
300
100
350
150
250
50

GARDA CAPITAL GROUP HALF YEAR RESULTS PRESENTATION FEBRUARY 2019 | 12
GROWTH IN AVERAGE AUM• AverageAUMinanyyearmoreaccuratelyreflectsthebasisuponwhichfundsmanagementrevenuehasbeenderivedforthatyear.
• AUMreportedatyearendprovidesthestartingbasisforfundsmanagementrevenueforthefutureperiod.
• GARDAhasdemonstratedsustainedgrowthinAUMwithFY19commencingAUMof$284millionbeinganapproximately30%increaseonaverageAUMofFY18.
GROWTH IN AVERAGE AUM
$ m
illio
ns
FY16
144
FY17
184
FY18
219
FY19 Forecast
*FY19andFY20forecastaverageAUM
308*
FY20 Forecast
356*400
0
200
300
100
350
150
250
50

GARDA CAPITAL GROUP HALF YEAR RESULTS PRESENTATION FEBRUARY 2019 | 13
CAPITAL EXPENDITURE FEE REVENUE • AkeycontributortofeerevenueistheGDFcapitalexpenditurefee.
• GARDAreceivescapitalexpenditurefeesof5%ofcapitalworksbyGDF.
• GDFhastwoprimarycapitalexpenditureactivities:
∂capitalreinvestmentintoexistingassets(ongoing/recurringfocus);and
∂newbuildingworks-suchasthecurrentBotanicca9commercialofficeprojectcurrentlyunderconstruction.
• GDFhasannouncedtwoindustrialsiteacquisitionswhereitintendstobuildmodernindustrialfacilitiestoretainaslongterminvestments:
I.Berrinba,QLD–expectedtocommenceconstructionofa$6.3millionfacilityinthelaterpartofH2FY19.
II.Wacol,QLD–expectedtosettleinMay2019withconstructionofa$25millionfacilitycommencinginH1FY20.
Expe
nditu
re$00
0's
-
20,000
10,000
30,000
5,000
25,000
15,000
40,000
35,000
GDF CAPITAL EXPENDITUREReinvestmentProjects
FY17 FY18 HY19ACTUAL FY19FORECAST FY20FORECAST
Botanicca9
Berrinba
ProgressRd,Wacol

GARDA CAPITAL GROUP HALF YEAR RESULTS PRESENTATION FEBRUARY 2019 | 14
FUTURE POTENTIAL PROJECTS
• AssetcreationisakeydifferentiationandcompetitiveadvantageforbothGCMandGDF.
• ThisstrategycreatesvalueforbothinvestorsofGCMandGDF.
• Todate,thisvaluehasbeencreatedthroughtheacquisitionofsiteswhereGARDAhasproceededtoconstructassetstoholdasinvestmentsoverthelongterm.
• GDFhasanumberofexistingassetsthatalsoprovidefuture(notimmediate)developmentopportunity.
• ThislatentvaluewithinexistingGDFassetspotentiallyprovidesbenefitstoGDFinvestorsthroughassetcreationandtoGCMinvestorsthroughco-investmentandcapitalexpenditurefees.
• Suchassetsinclude:
1.436ElgarRoad,BoxHillwhichhasbothcommercialandresidentialpotential;and
2.26-30GraftonStreet,CairnswhichisablockoflandattachedtoGDF’sexisting15levelofficebuilding(9-19LakeStreet).Thisprovidesanopportunityforeitheraresidentialormorelikelyfuturecommercialdevelopment.

GARDA CAPITAL GROUP HALF YEAR RESULTS PRESENTATION FEBRUARY 2019 | 15
BOX HILL METRO ACTIVITY CENTRE • GDFcurrentlyownsa31yearold,threelevelofficebuildingwithatotalNLAof6,587m²locatedat436ElgarRoad,BoxHill.
• Thebuildingis100%occupiedandhasa3.9yearWALE.
• Thebuildingsitsona2,650m²cornersite.
• BoxHillislocatedapproximately15kilometreseastoftheMelbourneCBD.
• Theareahadtraditionallybeencharacterisedbyamixoflow-densityresidentialandcommercialuses,however,theareaiscurrentlyundergoingsignificanttransformation.
• Thereissignificantamenityincloseproximitytothesite,includingBoxHillCentral(shoppingcentre),BoxHilltrainstationandBoxHillgardens.
• Thesitehastwopotentialfuture‘higherandbetteruse’includingbothcommercialandresidential.
Commercial–possiblya16storeyofficebuildingofapproximately17,000m²ofnetlettablearea.
Residential–possiblya19storeyresidentialtowerofapproximately31,000m²ofGFA,yielding229oneandtwobedroomapartments.

GARDA CAPITAL GROUP HALF YEAR RESULTS PRESENTATION FEBRUARY 2019 | 16
INVESTMENT ACTIVITIES
GARDAinvestsinrealestateviabothequityanddebtpositions.
EQUITY• GARDA’sprimaryequityinvestmentisits21.9millionunitsinGDF,representing13.8%ofGDF.
• TheGroupdeployedafurther$4.0millionintoGDFaspartofthe$25millionplacementannouncedinOctober2018.
• TheDirectorsmeasureperformancehavingregardtothedistributionsreceived,andthefairvaluemovement(increaseordecreaseinassetvalues)ofitsinvestmentinGDF,overeachfinancialperiod.
DEBT• GARDAinvestsinpropertythroughdebtpositions.
• TheGroupmadefurtherinvestmentsindebtpositionswiththeadvancementoftwonewloanstotalling$2.1million.
• Debtinvestmentgeneratesbothfees(accountedforintheoperatingrevenuesoftheGroup)andinterest(accountedforintheinvestingrevenuesoftheGroup).Bothoftheseareassessedwhenconsideringadebtinvestment.

GARDA CAPITAL GROUP HALF YEAR RESULTS PRESENTATION FEBRUARY 2019 | 17
CO-INVESTMENT IN GDF
• GCM’sinvestmentinGDFtotals$28.9millionat31December2018ASXclosingpriceof$1.32perunit.
• GDFcurrentpriceof$1.36istradingneartoNTAof$1.31perunit.
• GCMhasenjoyedGDF’sstrongyearonyeardistributionreturnsandcontinuedNTAperunituplifts.
• ValuationsarecompletedannuallyinJune.
• H1FY19changetoNTAisasaresultofalitigationwinandseparatelyequityraisingcostsassocitedwithGDF’s$25mOctoberplacement.
1.PortfoliorevaluationsduetobecompletedbyJune2019.
GDF NTA PER UNIT
FY17
$1.21
FY16
$1.13
FY18
$1.29
HY19
$1.31
$-
$0.050
$0.150
$0.100
$0.200
GDF DISTRIBUTIONS AND NTA UPLIFT PER UNIT
DistributionsperunitNTA Increase
FY16
$0.11
$0.090
$0.200
FY17
$0.08
$0.094
$0.174
$0.08
$0.090
FY18
$0.170
$0.021
$0.045
HY19
$0.065

GARDA CAPITAL GROUP HALF YEAR RESULTS PRESENTATION FEBRUARY 2019 | 18
MEASURING PERFROMANCE OF INVESTMENT ACTIVITY
• PerformanceoftheGroup’sinvestmentactivitiesismeasuredbyreferencetotheunderlying earnings of investment activity after tax beingtheadditionofnetinterestanddistributionsreceived,andfairvaluemovement,overnetassetsatthebeginningoftheperiod.
• FairvaluemovementrelatesprimarilytoGARDA’s21.9millionunitsinGDF.
• Investmentactivitygeneratednetinterestanddistributionsof$0.62millionaftertaxforthehalfyear.
• Fairvalueupliftof$3.1millionwasrecognisedat31December2018basedontheGDFASXclosingpriceof$1.32.
• HY19underlyinginvestment activityearningsaftertax,(adoptingthe31December2018ASXclosingprice)was $3.7 million or 18.9% returnforthehalf-year,on30June2018netassetsof$19.8million.
GROUP RETURN ON EQUITY• Totalreturnonsecurityholdersequityismeasured,asthesumoftheunderlyingoperating activityearningsaftertaxandthe
underlying investing activity earningsaftertax,overtheGroup’sequityatthebeginningofthefinancialperiod.
• AtotalreturnforHY19of $4.8 million or 24.4%wasachievedon30June2018netassetsof$19.8million.

GARDA CAPITAL GROUP HALF YEAR RESULTS PRESENTATION FEBRUARY 2019 | 19
OUTLOOK
• GCMstartedFY19with$284millionofAUM,comparedtotheFY18averageAUMof$219million.
• AUMtoincreaseto$337millionuponcompletionofBotanicca9projectinMay2019andthesettlementofProgressRoad,WacolindustrialsiteinMay2019.
• GDFcontinuestoseeknetAUMgrowthofapproximately$100millionperannum.
• FY19andFY20capitalexpenditurefeerevenuemateriallybenefitsfromestimatedrespectivespendsofapproximately$43millionand$27million.
• GCMwillcontinuetofocusontheprocurementofthirdpartycapitaltoparticipateindebtopportunitieswiththeGroupasfundmanagerandco-investingitsallocatedcapital.
• Distributions tosecurityholderswill continue toreflectapass throughof incomereceivedby theGroup from its investment inGDF(throughGARDACapitalTrust–investmenttrust).
• AfinalFY19corporatedividendwillbeconsideredatfinancialyearend.

GARDA CAPITAL GROUP HALF YEAR RESULTS PRESENTATION FEBRUARY 2019 | 20
GARDA DIVERSIFIED PROPERTY FUND
GARDA CAPITAL GROUP HALF YEAR RESULTS PRESENTATION FEBRUARY 2019 | 21
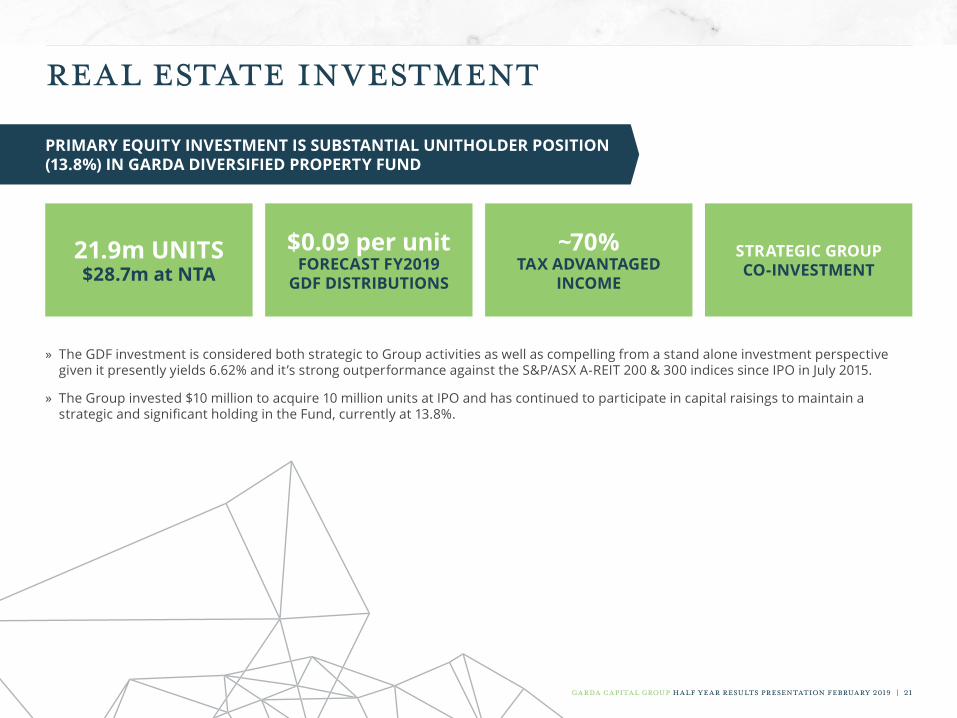
REAL ESTATE INVESTMENT
»TheGDFinvestmentisconsideredbothstrategictoGroupactivitiesaswellascompellingfromastandaloneinvestmentperspectivegivenitpresentlyyields6.62%andit’sstrongoutperformanceagainsttheS&P/ASXA-REIT200&300indicessinceIPOinJuly2015.
»TheGroupinvested$10milliontoacquire10millionunitsatIPOandhascontinuedtoparticipateincapitalraisingstomaintainastrategicandsignificantholdingintheFund,currentlyat13.8%.
PRIMARY EQUITY INVESTMENT IS SUBSTANTIAL UNITHOLDER POSITION (13.8%) IN GARDA DIVERSIFIED PROPERTY FUND
21.9m UNITS $28.7m at NTA
~70% TAX ADVANTAGED
INCOME
$0.09 per unit FORECAST FY2019
GDF DISTRIBUTIONS
STRATEGIC GROUP CO-INVESTMENT

GARDA CAPITAL GROUP HALF YEAR RESULTS PRESENTATION FEBRUARY 2019 | 22
GDF AT A GLANCE
1.Basedonthe‘uponcompletion’valueofBotannica9andlandvalueforBerrinbaacquisition2.WALEandoccupancyasat1January2019.3.LVRcalculatedastotaldrawndebtfacilitiesdividedbytotalpropertyassetsasat18February2019.4.WeightedaveragecapitalisationrateincludestheuponcompletionvalueandcaprateforBotanicca9.
5.7 YEARSWALE2
$0.09/unitFY2019DistributionFORECAST
99%OCCUPANCY2
$1.31NTAPerUnit
3.3%WEIGHTEDAVERAGE
RENTREVIEWS
3.32% LVR3
6.78%WEIGHTEDAVERAGE
CAPRATE4
ALIGNED MANAGERGARDA Capital
holds13.82%ofGDFunits
$330 MILLION1 $210 MILLION

GARDA CAPITAL GROUP HALF YEAR RESULTS PRESENTATION FEBRUARY 2019 | 23
PORTFOLIO VALUE (BY SECTOR)
PORTFOLIO VALUE (BY LOCATION)
COMMERCIAL 68% INDUSTRIAL 32%
44% 15% 9% 4%28%
7-19LakeStreet,Cairns($51.0m)
69-79DieselDrive,Mackay($30.2m)
747LyttonRoad,Murarrie($14.3m)142BenjaminPlace,Lytton($9.7m)41BivouacPlace,Wacol($35.25m)70-82MainBeachRoad,Pinkenba($19.0m)67NoosaStreet,Heathwood($9.8m)1-9HuntressSt,Berrinba($3.0m)
572SwanStreet,Richmond($52.5m)436ElgarRoad,BoxHill($29.0m)588SwanStreet,Richmond($62.5m)
154VarsityParade,VarsityLakes($14.0m)

GARDA CAPITAL GROUP HALF YEAR RESULTS PRESENTATION FEBRUARY 2019 | 24
REAL ESTATE DEBT INVESTMENT

GARDA CAPITAL GROUP HALF YEAR RESULTS PRESENTATION FEBRUARY 2019 | 25
REAL ESTATE DEBT INVESTMENT
BRISBANE LAND SUB-DIVISION AND DEVELOPMENT • Debtwasstructuredtoassistwiththeacquisitionandconstruction
of a 32 lot residential sub-division to the south of Brisbanewith acompletionvalueof$7.17million
• Aninitial$1.36millionfacility(fullydrawn)wasprovidedbyGARDAinAugust2018toassistwithsettlementofthesite.
• In November 2018, an additional $4.275 million was provided byGARDA and also assigned to an external investor ($3.6 million) toassistwithconstruction.
• Currentlyallfacilitiesaredrawnto$3.3million.
• GARDAearnsboth interest income (investment)aswellasmarginsandstructuringfees(non-investment).
• Total forecast investment and non investment returns on GARDA deployedcapitalover13monthstotalsapproximately20%.
Lender Size Max.LVR Interest – Nature Interest Line Structuring
GARDA $1.7million N/A Capitalising 12% 3.00% 3.00%
External $3.6million 79% Capitalising 15% n/a 3.00%

GARDA CAPITAL GROUP HALF YEAR RESULTS PRESENTATION FEBRUARY 2019 | 26
DISCLAIMERTheinformationprovidedinandaccompanyingthispresentation(Presentation)hasbeenpreparedonbehalfofGARDACapitalLimited(ACN095039366)(GARDA),andGARDAFundsManagementLimited(ACN140857405)(AFSL398764)(GFML),initscapacityasresponsiblemanageroftheGARDACapitalTrust, aregisteredmanagedinvestmentschemewithARSN150164720(theFund),togethertheGARDA Capital Group or GCM.TheinformationandstatementsinthisPresentationwerepreparedoraremadeonlyasofthedateofthisPresentation,unlessotherwisestated.
ThisPresentationcontainsgeneralandsummaryinformationaboutthecurrentactivitiesoftheGARDACapitalGroup.Itdoesnotpurporttobecomplete, orcontainalltheinformationwhichwouldberelevanttoexistingorprospectiveinvestorsofGCM.NomemberoftheGARDACapitalGrouporanyoftheirrelatedentitiesandtheirrespectivedirectors,employees,officersandadvisersgiveanywarrantiesinrelationtothestatementsandinformationcontained inorreferredtointhisPresentation.
ThisPresentationhasbeencompiledfromsourceswhichtheGARDACapitalGroupbelievestobereliable.However,itisnotaudited,anditisnotaprospectus,productdisclosurestatementorotherdisclosuredocumentasdefinedintheCorporationsAct2001(DisclosureDocument),andhasnotbeenlodgedwiththeAustralianSecuritiesandInvestmentsCommission.Itisnot,nordoesitpurporttobe,completeorincludealltheinformationthataDisclosureDocumentmaycontain.Historical,financialandother‘continuousdisclosure’informationrequiredbylawcanbefoundattheGARDACapitalGroup’swebsitewww.gardacapitalgroup.com.auandintheauditedfinancialstatements(alsoonthewebsite).Allreferencestodollarsor$inthisdocumentaretoAustraliancurrency.
NothingcontainedinthePresentationconstitutesinvestment,legal,taxorotheradvice.Itisnotanofferofsecurities,orarecommendationtobuyorsellsecuritiesinGCM.Ithasbeenpreparedforgeneralinformationonly,andwithouttakingintoaccounttheinvestmentobjectives,financialsituationorneedsofindividuals.AnyexistingorprospectiveinvestorshouldnotrelyonthisPresentation,butconsidertheappropriatenessoftheinformationinaDisclosureDocument,havingregardtotheirownobjectives,financialsituationandneedsandseekappropriateindependentadvice,includingfinancial,legalandtaxationadviceappropriatetotheirjurisdiction.NeitherGARDAnorGFMLislicensedtoprovidefinancialproductadviceinrespectofanysecurities,includingthestapledsecuritiescomprisingGCM.TheGARDACapitalGroupdoesnotguaranteeanyparticularrateofreturnorperformanceofGCMoranysecurities,nordotheyguaranteetherepaymentofcapitaloranyparticulartaxtreatment.
ThisPresentationcontainscertain“forwardlookingstatements”(Forecasts)withrespecttothefinancialcondition,resultsofoperationsandbusinessrelating totheGARDACapitalGroup.TheseForecastsmayinvolvesubjectivejudgments.Thewords“forecast”,“estimate”,“likely”,“anticipate”,“believe”,“expect”,“project”,“opinion”,“predict”,“outlook”,“guidance”,“intend”,“should”,“could”,“may”,“strategy”,“target”,“plan”andothersimilarexpressionsareintended toidentifyforward-lookingstatements.
TheForecastsarebytheirverynaturesubjecttosignificantandunknownrisks,uncertainties,vagariesandcontingencies,many(ifnotall)ofwhichareoutsidethecontrolofmembersoftheGARDACapitalGroup. VariousriskfactorsmaycausetheactualresultsorperformanceofGCMtobemateriallydifferentfromanyfutureresultsorperformanceexpressedorimpliedbysuchForecasts.TherecanbenoassurancethatanyForecastsareattainableorwillberealised. Norepresentation,warrantyorguarantee,whetherexpressorimplied,ismadeorgivenbyanymemberoftheGARDACapitalGroupthatanyForecastwill orislikelytobeachieved.Exceptasrequiredbylaw,theGARDACapitalGroupisnotliabletoreleaseupdatestotheForecaststoreflectanychanges.
Tothemaximumextentpermittedbylaw,anyandallliabilityinrespectofthePresentationandForecastisexpresslyexcluded,including,withoutlimitation,anyliabilityarisingfromfaultornegligence,foranydirect,indirectorconsequentiallossordamagearisingwhatsoeverfromtheuseoftheinformationinthisPresentationorotherwisearisinginconnectionwithit.GCMislistedontheASXandallapplicableobligationsandrestrictionscontainedin(withoutlimitation)theListingRulesandCorporationsActapplyaccordingly.Theacknowledgementsreferredtoaboveapplyaccordingly.Theacknowledgementsreferredtoabovemaybepleadedasabartoanyclaimthatareadermaybring.

GARDA CAPITAL GROUP(ASX CODE: GCM)