half year results - londonmetric property plc · half year results 30 september 2017. agenda...
TRANSCRIPT
www.londonmetric.com
HALF YEAR RESULTS30 SEPTEMBER 2017

AGENDA
Highlights
Strategy
Financial
Property
Investment
Outlook
2

HIGHLIGHTS

Key HighlightsOur sector calls and income focus continue to deliver
• Technology and social change are driving our sector calls
• Distribution exposure up to 67.4%1
• Retail parks exposure down to 8.5%1
• TPR 6.1% v IPD All Property of 5.0%
• Portfolio metrics reflect our focus on income
• WAULT 12.4 years, 3.5% income expires within 3 years
• Occupancy 99.4%
• LFL income growth 2.7% in H1
• Financial metrics further strengthened
• Debt maturity increased to 5.3 years
• Finance costs fallen to 3.0%
• Loan to value at 34%2
41. Including developments, based on September 2017 valuations. Excluding assets sold with deferred completion (Loughborough & Birkenhead)
2. LTV includes deferred consideration on sales exchanged prior to half year end

Financial HighlightsHalf Year to 30 September 2017
Net Rental Income
£45m+12%
5
Dividend cover
114%Up from 112% last year
Revaluation surplus
+£53mYield compression 12 bps2
Sept 2017 Sept 2016 Change
EPRA Earnings £28.8m £25.3m +14%
EPRA Earnings (pps) 4.2p 4.0p +5%
Dividend (pps) 3.7p 3.6p +3%
Reported Profit / (Loss) £79.6m £(13.1)m +£93m
EPRA NAV (pps) 156p 150p1 +4%
1. Comparative number is as at March 2017
2. Equivalent yield movement on portfolio
Total Accounting Return
+7%HY17: (0.5%)

Acquisition
6.2% yieldOver 70% in distribution
Disposals
5.6% yieldRetail, distribution & leisure
Operational HighlightsEnhancing the portfolio, generating secure and growing income
• £236m of acquisitions1
• Urban & regional distribution
• Selective long income and convenience
• Further £42m acquired PPE
• £180m of disposals1
• Retail, leisure and distribution sold into strong market
• Sale of last office and further residential
• Further £47m disposed PPE2
• 814,000 sq ft of development activity
• Delivering £6.2m additional income
• Costs to complete of £45m
• Bedford land acquisition adds 670,000 sq ft to pipeline
6
Developments under construction
84% pre-letIncluding terms agreed
Occupier activity in H1
32 transactions19 rent reviews & 13 lettings
1. LondonMetric share
2. Commercial disposals

STRATEGY

8
Contractual incomeGlobal Search
for yield
Structural incomeMacro trends and
tech disruption
AlphaTotal return
model
Investment StrategyIncome compounding strategies are likely to outperform hyper active development ones
Repetitive and reliable income is increasingly attractive
Long income with indexation provides the bedrock of certainty
Avoiding dilutive income leakage
Urban and regional logistics rents trending positive
Convenience retail continues to take market share at the expense of traditional food
High terminal value locations will continue to outperform
Short cycle activity delivers attractive yields on cost
Delivering fit for purpose, modern long let real estate

Our PortfolioAligned to structurally supported sectors
9
As at 30 Sept 17 NIY2 Rent3 WAULTTPR
(6m)
TPR
(12m)
Distribution
(£1,123m1)4.9% £59.5m 11.9 yrs 7.2% 13.4%
Long Income 4
(£220m1)6.2% £14.5m 11.4 yrs 7.8% 15.3%
Convenience &
Leisure (£147m1)5.2% £10.4m 17.4 yrs 4.6% 12.9%
Retail Parks
(£142m1)5.6% £8.9m 11.5 yrs 5.6% 9.8%
Residential
(£35m1)n/a £0.5m n/a (3.2%) (3.7%)
5.2% £93.8m 12.4yrs 6.1% 12.0%
Mega,
30%
Regional,
20%
Urban,
17%
13%
9%
9%
2%
1. Including developments. Based on September 2017 valuations excluding assets sold with deferred completion
2. Topped up NIY on investment portfolio as at 30 September 2017
3. Contracted rental income includes developments and assets sold with deferred completion
4. Long Income comprises long let retail with low operational requirements, primarily DFS and MIPP JVs
67.4% Distribution1
10
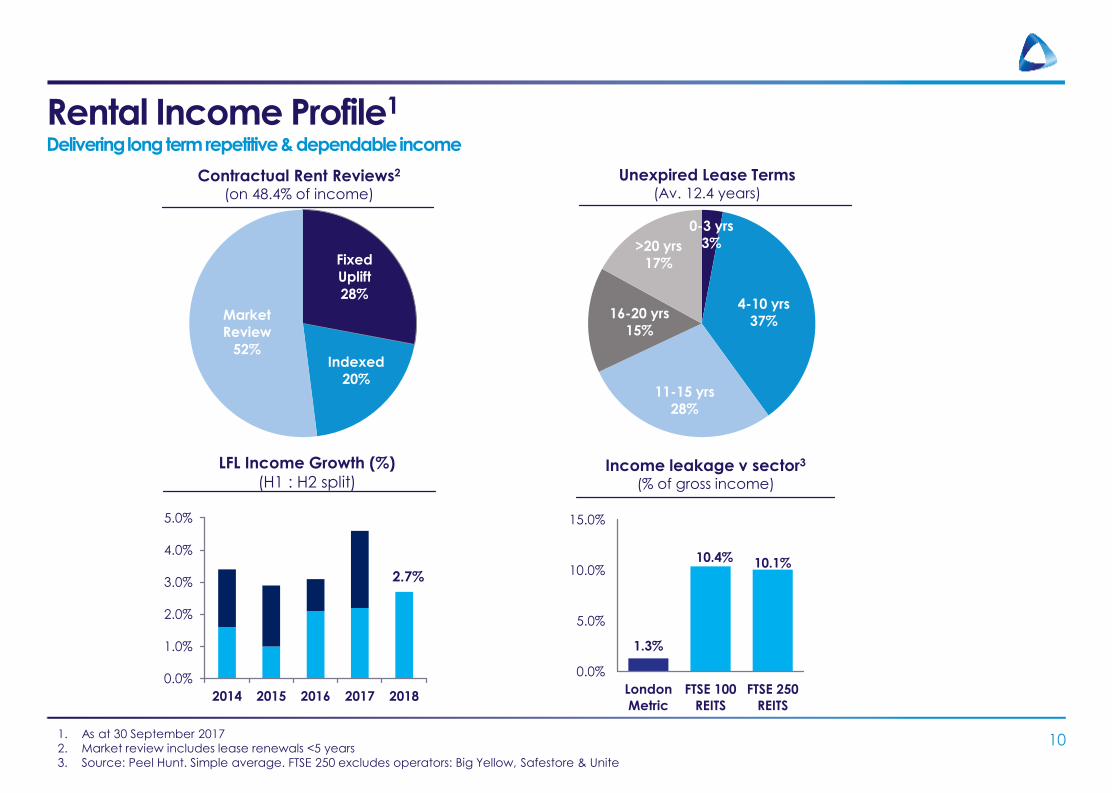
Rental Income Profile1
Delivering long term repetitive & dependable income
Fixed
Uplift
28%
Indexed
20%
Market
Review
52%
0-3 yrs
3%
4-10 yrs
37%
11-15 yrs
28%
16-20 yrs
15%
>20 yrs
17%
Contractual Rent Reviews2
(on 48.4% of income)
Unexpired Lease Terms (Av. 12.4 years)
Income leakage v sector3
(% of gross income)
2.7%
0.0%
1.0%
2.0%
3.0%
4.0%
5.0%
2014 2015 2016 2017 2018
LFL Income Growth (%)
(H1 : H2 split)
1. As at 30 September 2017
2. Market review includes lease renewals <5 years
3. Source: Peel Hunt. Simple average. FTSE 250 excludes operators: Big Yellow, Safestore & Unite
1.3%
10.4% 10.1%
0.0%
5.0%
10.0%
15.0%
London
Metric
FTSE 100
REITS
FTSE 250
REITS

11
Delivering Long Term Shareholder ReturnsOur key focus is to drive earnings and distribute
Earnings
Growth (pps)
1.9
4.2
-
1.0
2.0
3.0
4.0
5.0
6.0
7.0
8.0
9.0
Net Rental
Income (£m)
25.1
44.5
0
10
20
30
40
50
60
70
80
90
Total Shareholder Return1
(rebased to 100)
100
120
140
160
180
200
220Dividend
Share price
28%
67%
0%
10%
20%
30%
40%
50%
60%
70%
80%
Distribution
Exposure (%)
1. Source: Bloomberg as at November 2017
2. Based on financial year end. First year shown is for FY 13/14

FINANCIAL REVIEW

Income Statement1
13
30 September 2017 30 September 2016
Net rental income £44.5m £39.7m
Administrative costs* £(6.7)m £(6.7)m
Finance costs £(9.4)m £(8.2)m
EPRA Earnings £28.8m £25.3m
EPRA Earnings (pps) 4.2p 4.0p
Reported Profit / (Loss)2 £79.6m £(13.1)m
DPS** 3.7p 3.6p
* EPRA cost ratio 15% 17%
** Dividend cover 114% 112%
1. Proportionally consolidated basis, unless otherwise stated2. IFRS basis
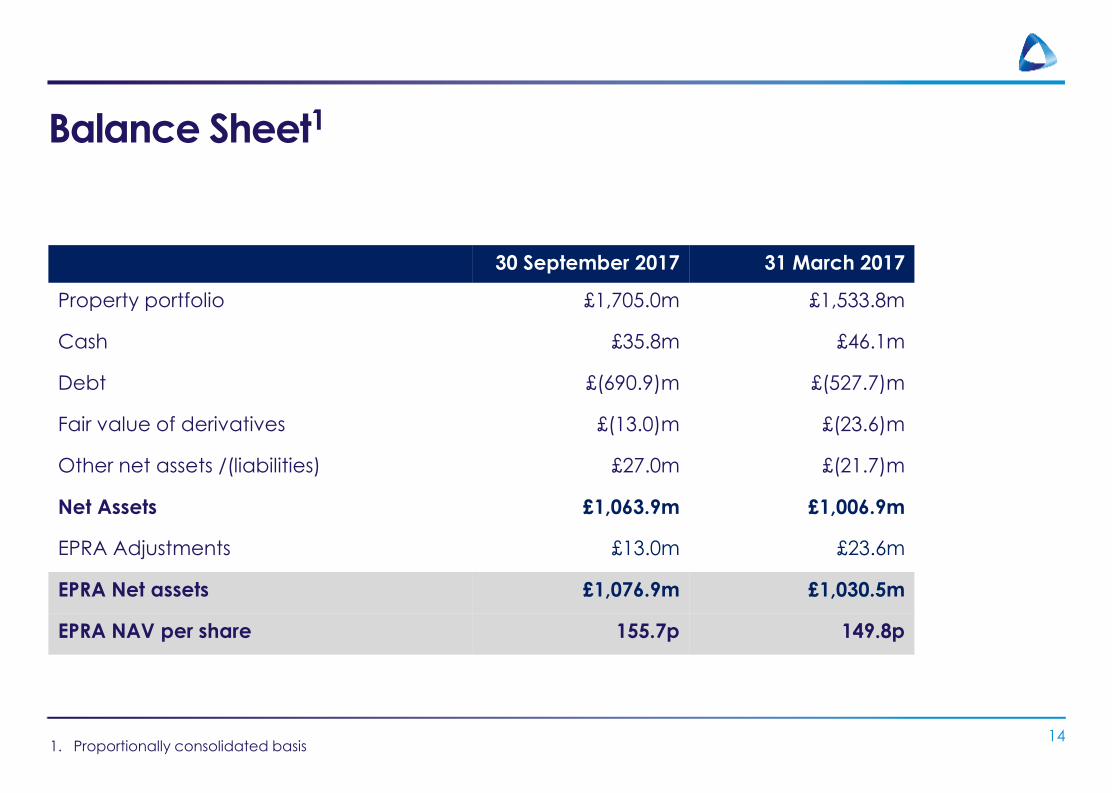
Balance Sheet1
14
30 September 2017 31 March 2017
Property portfolio £1,705.0m £1,533.8m
Cash £35.8m £46.1m
Debt £(690.9)m £(527.7)m
Fair value of derivatives £(13.0)m £(23.6)m
Other net assets /(liabilities) £27.0m £(21.7)m
Net Assets £1,063.9m £1,006.9m
EPRA Adjustments £13.0m £23.6m
EPRA Net assets £1,076.9m £1,030.5m
EPRA NAV per share 155.7p 149.8p
1. Proportionally consolidated basis
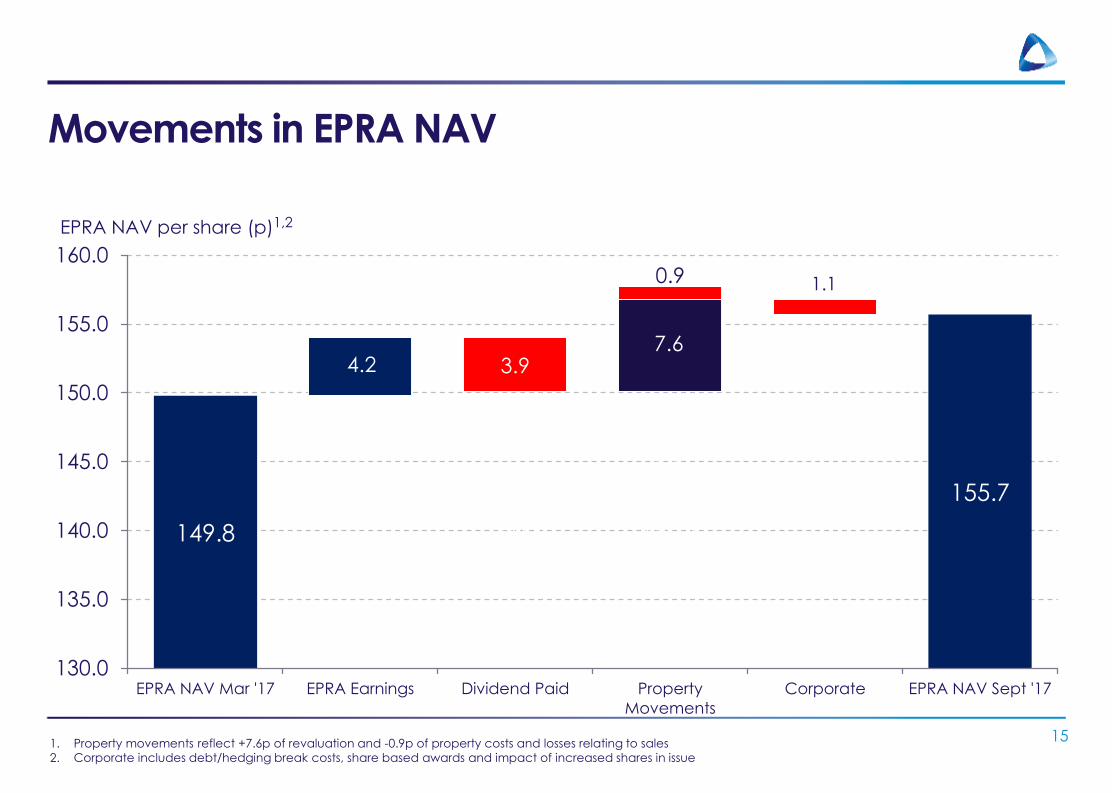
Movements in EPRA NAV
15
EPRA NAV per share (p)1,2
149.8 150.1 150.1
155.7
4.2 3.97.6
1.10.9
130.0
135.0
140.0
145.0
150.0
155.0
160.0
EPRA NAV Mar '17 EPRA Earnings Dividend Paid Property
Movements
Corporate EPRA NAV Sept '17
1.7
2.0
1. Property movements reflect +7.6p of revaluation and -0.9p of property costs and losses relating to sales
2. Corporate includes debt/hedging break costs, share based awards and impact of increased shares in issue

81.8
93.891.3 91.3
98.9
5.59.2
15.7
2.5 Current
Pipeline
60
70
80
90
100
Income Progression
16
(£m)
Net Rental &
Contracted
Income at
Mar 17
Contracted
Income post
developments
Warrington
Bedford
Contracted
Income at
30 Sept 17
1. Sales excludes disposals with delayed completion (Loughborough & Birkenhead)
2. PPE includes disposals with delayed completions
3. See Development slide in Appendix for details
Sales1 Acquisitions
& income growth
from portfolio
Development
Income not yet
contracted3
PPE
Investment
Activity2

Financing
Debt Metrics1 30 September 2017 31 March 2017
Gross Debt £690.9m £527.7m
Average cost of finance 3.0% 3.5%
Marginal cost of debt 1.8% 1.5%
Average maturity 5.3 years 5.2 years
Hedging3 76% 87%
Loan to Value2 34% 30%
1. Proportionally consolidated basis2. LTV includes consideration on disposals with delayed completion at half year end3. Based on fully drawn debt as at 30 September 2017
17

Delivering Financial Management1
18
Warrington
Bedford
Debt Maturity
(years)
3.0
3.7
4.2
5.6
5.25.3
0.0
1.0
2.0
3.0
4.0
5.0
6.0
201
3
201
4
201
5
201
6
201
7
201
8
Interest Cover Ratio
(x)
Cost of Debt
(%)
2.2
2.9
4.0
5.0
4.54.8
0.0
1.0
2.0
3.0
4.0
5.0
6.0
201
3
201
4
201
5
201
6
201
7
201
8
4.03.9
3.7
3.5 3.5
3.0
2.0
2.5
3.0
3.5
4.0
4.5
201
3
201
4
201
5
201
6
201
7
201
8
Loan to Value Ratio
(%)
43
32
36
38
30
34
0
10
20
30
40
50
60
201
3
201
4
201
5
201
6
201
7
201
8
1. All numbers as at year end, except for 2018 which is half year

PROPERTY REVIEW

Distribution Portfolio1
67.4% of portfolio providing end to end logistics
20
Mega Distribution
• 7 assets, 4.7m sq ft
• £24.9m rent (£5.30 psf)
• NIY2 4.7%
• WAULT 13.7 years
• ERV growth +1.8%
• Contractual uplifts 74.2%
Regional Distribution
• 15 assets, 3.4m sq ft
• £17.8m rent (£5.80 psf)
• NIY24.8%
• WAULT 13.3 years
• ERV growth +1.5%
• Contractual uplifts 50.1%
Urban Logistics
• 40 assets, 2.8m sq ft
• £16.8m rent (£6.10 psf)
• NIY2 5.4%
• WAULT 7.4 years
• ERV growth +4.9%
• Contractual uplifts 15.7%
1. As at 30 September 2017, including developments. Rent psf, NIY & WAULT are for the investment portfolio 2. Topped up NIY

Retail Portfolio1
Portfolio biased to management light and long income
21
Retail Parks
• 5 assets, 0.5m sq ft
• £9.0m rent (av £19.20 psf)
• NIY2 5.6%
• WAULT 11.5 years
• Occupancy 99.6%
• 6 lettings, 20.2% ahead of ERV
Long Income
• 30 assets, 1.3m sq ft
• £14.5m rent (av £19.50 psf)
• NIY2 6.2%
• WAULT 11.4 years
• Occupancy 100%
• 4 rent reviews, 12.7%3 ahead of passing
Convenience & Leisure
• 21 assets, 0.7m sq ft
• £10.4m rent (av £15.80 psf)
• NIY2 5.2%
• WAULT 17.4 years
• Occupancy 100%
• 10 rent reviews, 18.1%3 ahead of passing
1. As at 30 September 2017 including developments. Rent psf, NIY & WAULT for Investment portfolio 2. Topped up NIY3. 5 yearly uplift on rent reviews
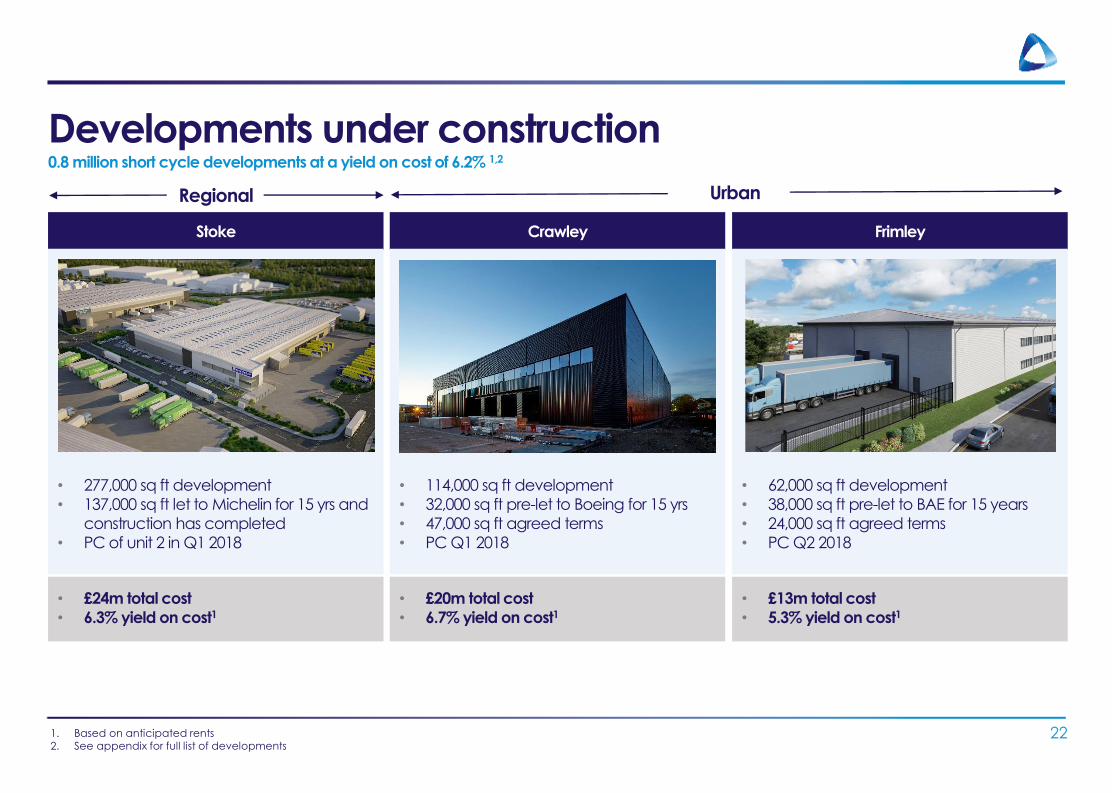
Developments under construction0.8 million short cycle developments at a yield on cost of 6.2% 1,2
22
Stoke
• 277,000 sq ft development
• 137,000 sq ft let to Michelin for 15 yrs and
construction has completed
• PC of unit 2 in Q1 2018
• £24m total cost
• 6.3% yield on cost1
Crawley
• 114,000 sq ft development
• 32,000 sq ft pre-let to Boeing for 15 yrs
• 47,000 sq ft agreed terms
• PC Q1 2018
• £20m total cost
• 6.7% yield on cost1
Frimley
• 62,000 sq ft development
• 38,000 sq ft pre-let to BAE for 15 years
• 24,000 sq ft agreed terms
• PC Q2 2018
• £13m total cost
• 5.3% yield on cost1
1. Based on anticipated rents2. See appendix for full list of developments
Regional Urban

Bedford DevelopmentRecycling disposal proceeds into a supply constrained location at an attractive yield
23
UK Demand / Supply dynamics strong1 Bedford – 40 acre site acquired
• Land purchase PPE, not in books at HY
• Established distribution location
• Phased development commences summer 2018
• In discussions with several potential occupiers
1. Source: CBRE, warehouses > 100,000 SF, 12m rolling period to Q3 2017 2. Based on anticipated rents and costs
Planning consent to build
Up to 670,000 sq ft
Total cost2
£60 million
Yield on cost2
7.3%
Practical completion
2018-19
• 8 months Grade A
• Supply: 9.0m sq ft
• Take up: 13.6m sq ft
• 65% let to retailer / 3PL
• 11m sq ft under construction
• Only 2.6m speculative
• 3-4 months average void period
• Recently committed deals nearby
• Aldi, 0.7m sq ft
• B&M, 1.1m sq ft
• XPO, 0.3m sq ft
• H&M, 0.8m sq ft
M1 (J13)
10 mins
A1
13 mins A421
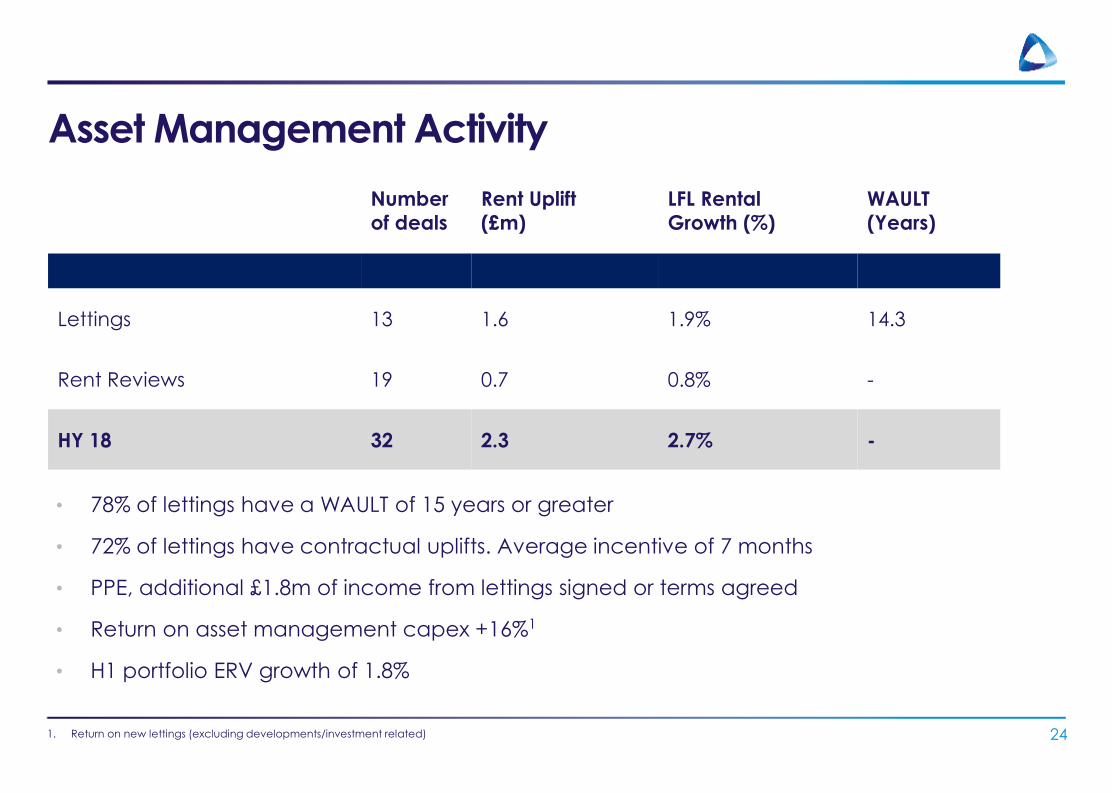
Asset Management Activity
24
Number
of deals
Rent Uplift
(£m)
LFL Rental
Growth (%)
WAULT
(Years)
Lettings 13 1.6 1.9% 14.3
Rent Reviews 19 0.7 0.8% -
HY 18 32 2.3 2.7% -
• 78% of lettings have a WAULT of 15 years or greater
• 72% of lettings have contractual uplifts. Average incentive of 7 months
• PPE, additional £1.8m of income from lettings signed or terms agreed
• Return on asset management capex +16%1
• H1 portfolio ERV growth of 1.8%
1. Return on new lettings (excluding developments/investment related)

100
105
110
115
120
125
2016 2017 2018
Over 2 Years1
+18% v 14% IPD All Property
Distribution +23%
Total +18%
Retail +16%IPD +14%
Total Property Return Performance
25
0.0%
2.0%
4.0%
6.0%
8.0%
H1 2018
+6.1%v 5.0% IPD All Property
1. From September 2015 to September 2017. Cumulative reported returns
Total Return Income Capital
H1 2018 (%) LMP IPD LMP IPD LMP IPD
Distribution 7.2 7.5 2.6 2.5 4.5 4.9
Retail 5.7 3.4 3.1 2.5 2.5 0.9
Core 6.8 2.8 4.0
Total 6.1 5.0 2.8 2.3 3.3 2.6
INVESTMENT REVIEW
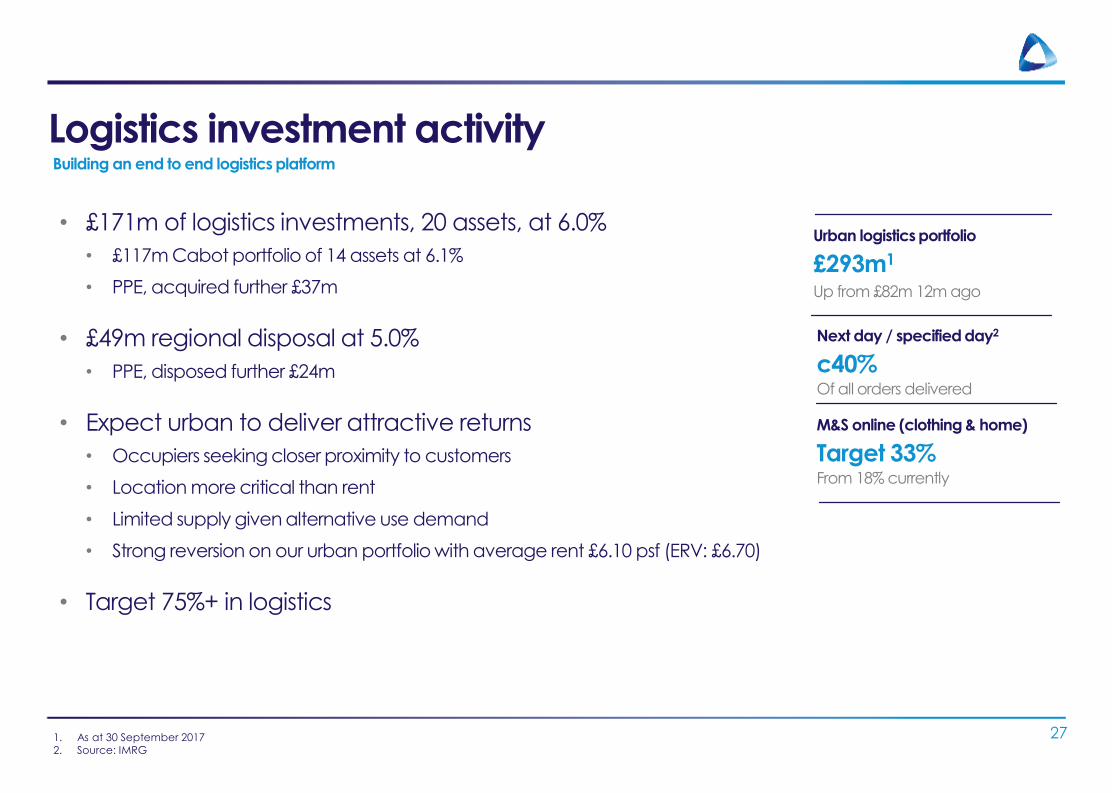
Logistics investment activityBuilding an end to end logistics platform
• £171m of logistics investments, 20 assets, at 6.0%
• £117m Cabot portfolio of 14 assets at 6.1%
• PPE, acquired further £37m
• £49m regional disposal at 5.0%
• PPE, disposed further £24m
• Expect urban to deliver attractive returns
• Occupiers seeking closer proximity to customers
• Location more critical than rent
• Limited supply given alternative use demand
• Strong reversion on our urban portfolio with average rent £6.10 psf (ERV: £6.70)
• Target 75%+ in logistics
27
Urban logistics portfolio
£293m1
Up from £82m 12m ago
1. As at 30 September 20172. Source: IMRG
Next day / specified day2
c40%Of all orders delivered
M&S online (clothing & home)
Target 33% From 18% currently
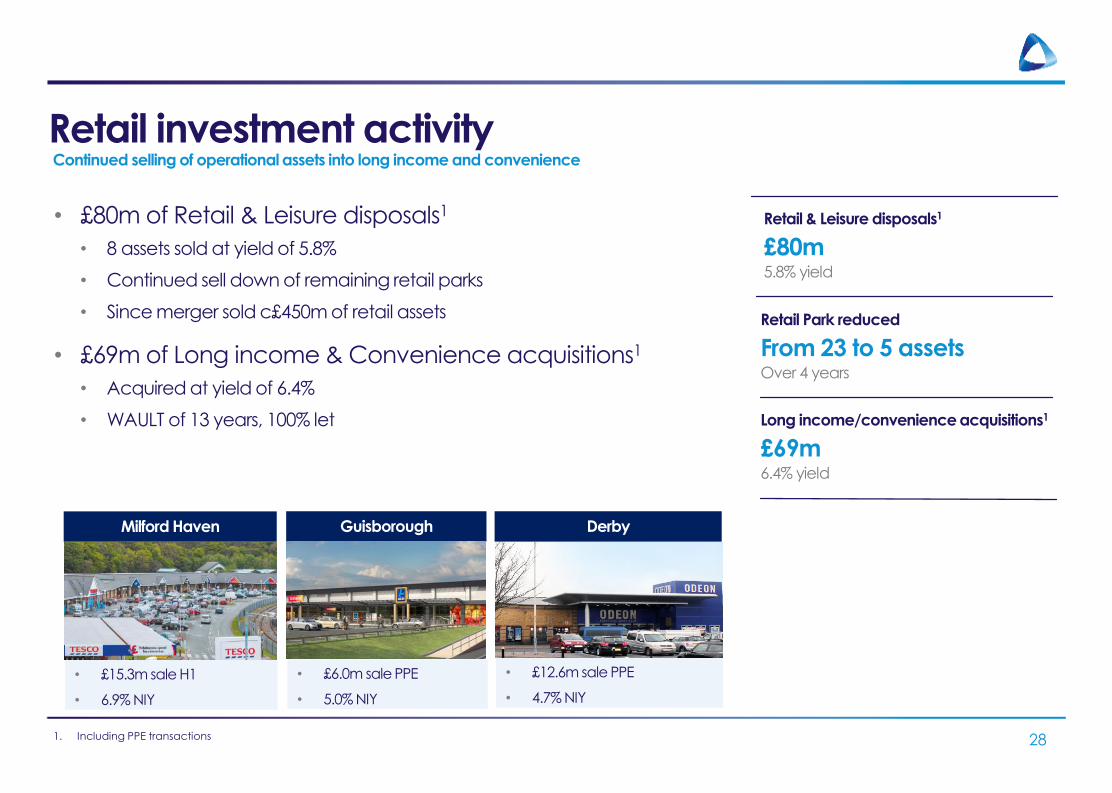
Retail investment activityContinued selling of operational assets into long income and convenience
• £80m of Retail & Leisure disposals1
• 8 assets sold at yield of 5.8%
• Continued sell down of remaining retail parks
• Since merger sold c£450m of retail assets
• £69m of Long income & Convenience acquisitions1
• Acquired at yield of 6.4%
• WAULT of 13 years, 100% let
281. Including PPE transactions
Retail Park reduced
From 23 to 5 assetsOver 4 years
Long income/convenience acquisitions1
£69m6.4% yield
Milford Haven
• £15.3m sale H1
• 6.9% NIY
Guisborough
• £6.0m sale PPE
• 5.0% NIY
Derby
• £12.6m sale PPE
• 4.7% NIY
Retail & Leisure disposals1
£80m5.8% yield
-300
-250
-200
-150
-100

OUTLOOK

Investment market outlookIncome is dominating in an increasingly polarised real estate market
• Income taking centre stage
• Desperate search for reliable, predictable and growing income
• Index linked income in high demand
• Structurally supported sectors in demand
• Technology and social change are disrupting
• Creating a rise in demand for Logistics & “Alternatives”
• Tectonic plates in retail are shifting as consumer spending migrates online
• Liquidity polarising
• Towns deemed “Institutionally Acceptable” halved over 20 years
• Greater liquidity on smaller lot sizes, sub £30m
• Defensive capex & obsolescence weighing on returns
30
Online retail sales(y-o-y)2
+14.2% From 21% to 26% of sales by 20213
Store retail sales (y-o-y)2
-1.2% 3 month average
1. Source Capital Economics2. Source: Barclaycard, November 2017. Average y-o-y change for last 3 months3. Non food sales, source: E-tail
2017 83%
2018 86%
2019 106%
2020 106%
2021 93%
Income as % of total returns1
Average 95%For UK property (next 5 years)
Shopping centre transactions
Lowest in 10 years

OutlookPivot to the right side of structural change
31
Demographics• Demographic surge accentuating need for repetitive & dependable income
• Income will be the defining characteristic of the next decade’s investing environment
Digital disruption• Structural calls will continue to define the winners and losers
• Those that cling onto the more traditional forms of business will be disrupted
Distribution • Pivot to distribution and convenience retail put us on the right side of structural changes
• Our sector focus reflects modern day shopping behaviour
Dividend • Our sustainable and growing earnings are delivering dividend progression that is well covered
• We continue to believe that income compounding strategies will outperform

APPENDICES

Portfolio Metrics
331. Including assets sold with delayed completion2. Topped up NIY3. Developments consist of Stoke, Ipswich, Huyton, Frimley & Crawley
AreaValuation
(Share)Revaluation
Surplus/(Deficit) Occupancy NIY2 WAULT (years)Contracted
RentFixeduplifts
AverageRent
As at 30-Sept-171 (m sq ft) (£m) (£m) (%) (%) (%) Expiry Break (£m) (%) (£ psf)
Mega distribution 4.7 495.1 14.6 3.0 100.0 4.7 13.7 13.5 24.9 74.2 5.3
Regional distribution 3.1 318.1 9.2 3.0 96.9 4.8 13.3 11.9 17.0 50.1 5.8
Urban logistics 2.5 260.9 11.7 4.7 100.0 5.4 7.4 6.0 15.2 15.7 6.1
Total Distribution 10.3 1,074.1 35.5 3.4 99.0 4.9 11.9 11.0 57.1 50.4 5.6
Retail Parks 0.4 136.1 3.1 2.3 99.6 5.6 11.5 10.0 8.4 15.7 19.2
Long Income Retail 1.3 219.5 11.8 5.7 100.0 6.2 11.4 10.1 14.5 31.0 19.5
Convenience 0.4 118.2 (0.9) (0.8) 100.0 4.9 15.9 15.6 6.3 82.7 15.9
Leisure 0.3 66.7 3.0 4.7 100.0 5.7 19.7 19.7 4.1 100.0 15.5
Total Retail and Leisure 2.4 540.5 17.0 3.2 99.9 5.7 13.3 12.3 33.3 45.0 18.1
Total Investment 12.7 1,614.6 52.5 3.4 99.4 5.2 12.4 11.5 90.4 48.4 7.5
Residential – 35.1 (1.6) (4.5) 0.5
Development3 0.6 55.3 1.9 3.5 2.9
Total Portfolio 13.3 1,705.0 52.8 3.2 93.8
34
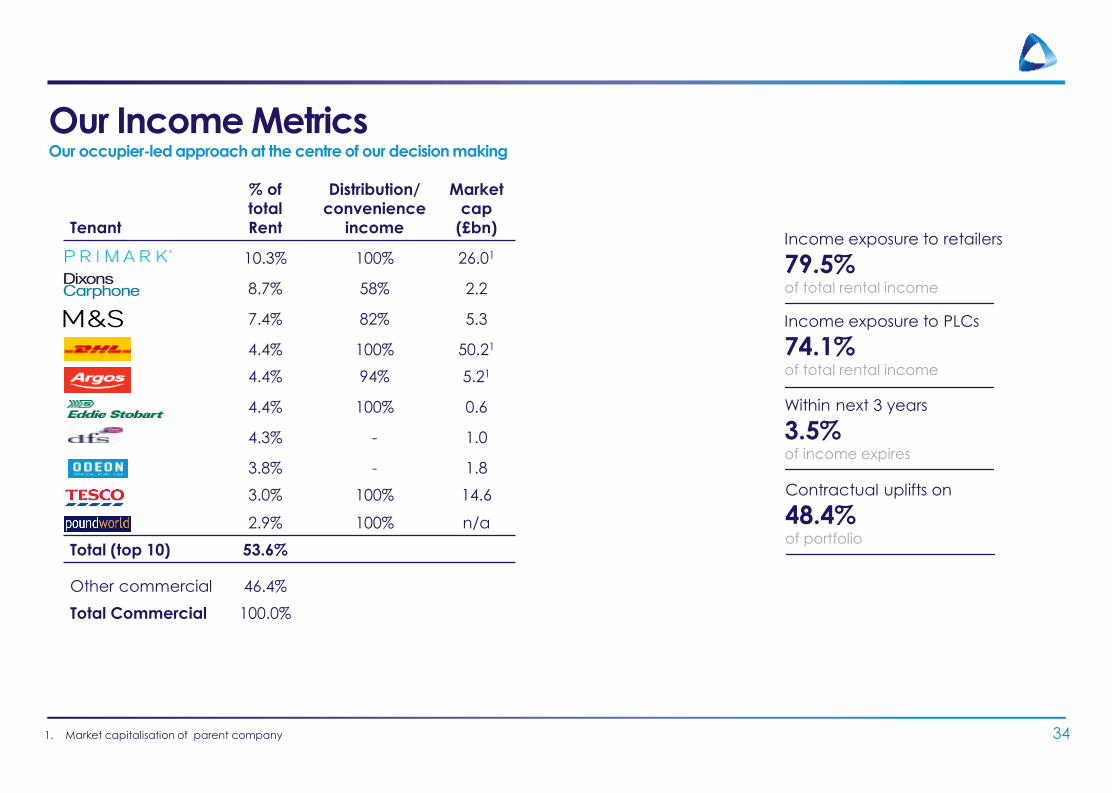
Our Income MetricsOur occupier-led approach at the centre of our decision making
Income exposure to retailers
79.5%of total rental income
Income exposure to PLCs
74.1%of total rental income
Within next 3 years
3.5%of income expires
1. Market capitalisation of parent company
Contractual uplifts on
48.4%of portfolio
Tenant
% of
total
Rent
Distribution/
convenience
income
Market
cap
(£bn)
10.3% 100% 26.01
8.7% 58% 2.2
7.4% 82% 5.3
4.4% 100% 50.21
4.4% 94% 5.21
4.4% 100% 0.6
4.3% - 1.0
3.8% - 1.8
3.0% 100% 14.6
2.9% 100% n/a
Total (top 10) 53.6%
Other commercial 46.4%
Total Commercial 100.0%

Top 10 Assets as at 30 Sept 2017
35
Location Occupier Annualised
rent (£m)
WAULT
(years)
Islip Primark 5.5 23.0
Thrapston Primark 4.1 15.0
Newark Dixons Carphone 4.4 15.8
Dagenham Eddie Stobart 4.1 26.0
Bedford Argos 3.8 5.2
Wakefield Poundworld 2.6 14.0
Sheffield M&S 2.6 6.2
Warrington Amazon 2.1 14.2
Kirkstall Bridge, Leeds Various 2.5 10.9
New Malden Dixons Carphone 1.9 14.2

36
AcquisitionsFY 2018 (YTD)
Sector Value
(LM share)
Yield WAULT
(years)
£m Expiry 1B
Coventry Distribution 5.7 7.0% 10 5
Huyton Distribution 11.8 6.1% 15 15
Crawley1 Distribution 6.4 4.8% 6 1
Newport and Kendal Convenience (M&S)
24.6 5.5% 10 10
Warrington Distribution 4.4 5.6% 10 10
Frimley1 Distribution 13.1 5.3% 15 15
New Malden Long Income Retail 28.3 6.1% 14 10
Uplift in DFS ownership Retail / Distribution 15.1 8.1% 12 12
Cabot portfolio Distribution 116.6 6.1% 6 4
Speke Distribution c10 c6% 15 15
H1 236.2
Sector Value£m
Yield Reversion
Yield 2Expiryyears
1B
Ringwood Leisure 4.3 5.0% 5.7% 25 20
Ollerton Distribution 37.4 4.6% 5.5% 20 20
H2 YTD 41.7
361. Anticipated Yields and WAULTS
2. Reversionary yield based on current ERV or, in case of contractual uplifts, running yield in 5 years based on current inflation expectations

37
DisposalsFY 2018 (YTD)
Sector Value (LM share)
Yield WAULT (years)
£m % Expiry 1B
Loughborough1 Retail 32.5 4.3% 25 25
Birkenhead1 Leisure 5.8 7.2% 12 12
Newcastle Retail 2.8 8.0% 9 9
Marlow Office 68.5 6.7% 7 7
Swansea Retail (DFS) 1.8 8.7% 13 13
Milford Haven Retail 15.3 6.9% 9 9
Daventry Distribution 48.8 5.0% 6 6
Moore House Residential 4.3 2.5% - -
H1 179.8
Sector Value Yield Expiry 1B
Derby Leisure (Odeon) 12.6 4.7% 21 21
Swindon Retail (DFS) 3.5 6.9% 12 12
Guisborough Retail 6.0 5.0% 12 12
Bolton Distribution 24.4 5.4% 4 4
H2 YTD (commercial only) 46.5
371. Disposals subject to delayed completions as at 30 September 2017

S.E. & Midland
Yorkshire
38
Cabot Acquisition (Aug-2017)
Wakefield
103,000 sq ft
Rent: £0.4m
Sheffield
55,000 sq ft
Rent: £0.2m
Doncaster x2
137,000 sq ft
• Rent: £0.6m
• (Regional)
84,000 sq ft
• Rent: £0.4m
North West
Bolton
274,000 sq ft
Rent: £1.4m
(Regional)
Warrington x2
26,000 sq ft
• Rent: £0.1m
45,000 sq ft
• Rent: £0.2m
Ashby-De-La-Zouche
128,000 sq ft
Rent: £0.7m
(Regional)
Solihull
142,000 sq ft
Rent: £0.9m
Coventry
82,000 sq ft
Rent: £0.4m
Bicester
68,000 sq ft
Rent: £0.4m
Milton Keynes x2
28,000 sq ft
• Rent: £0.1m
25,000 sq ft
• Rent: £0.2m
Theale
119,000 sq ft
Rent: £1.0m
• 1.3m sq ft, >50% in S.E. & Midlands
• 14 warehouses across 11 established logistics locations
• 3 regional ~ 35% of portfolio
• 11 urban ~ 65% of portfolio
• Fully income generating
• 6.1% blended yield on cost
• £7.2m rental income
• Av. rent of £5.50 psf
• ERV of £6.00 psf
• Strong prospects for income growth and lease extensions
• 6.6% reversionary yield
• 5.6 yrs WAULT (3.9 yrs to 1B)
£116.6 million logistics portfolio
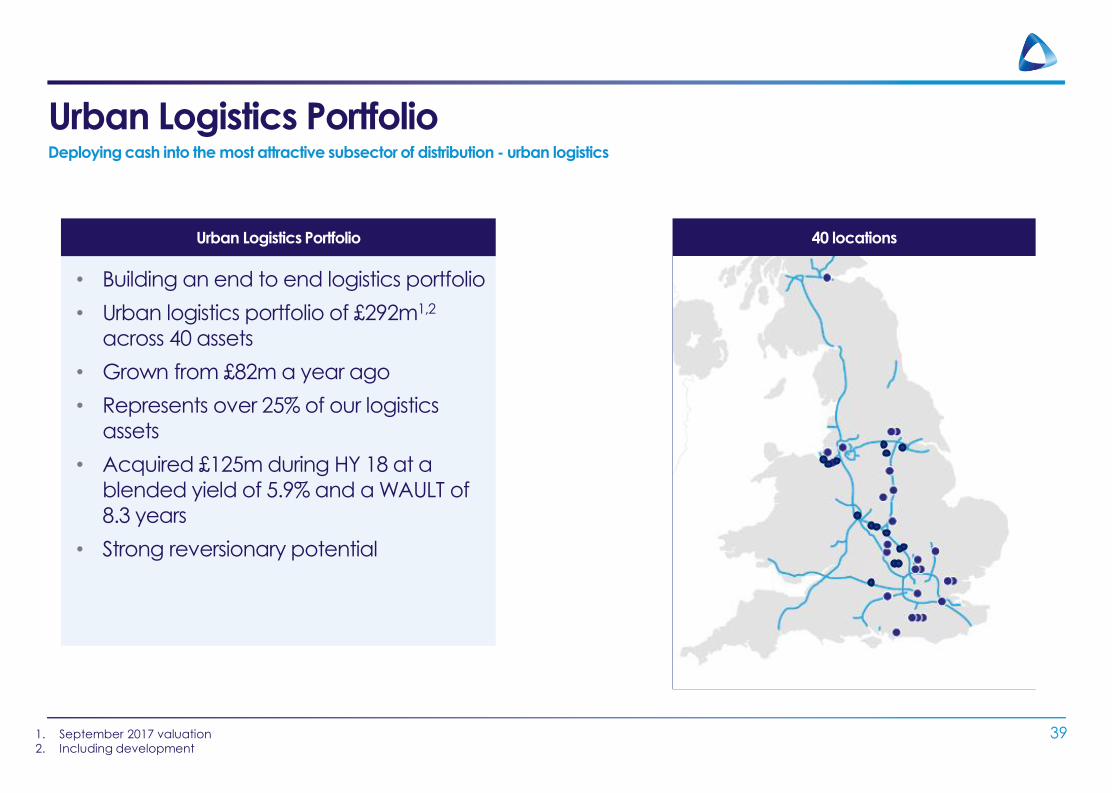
Urban Logistics PortfolioDeploying cash into the most attractive subsector of distribution - urban logistics
39
• Building an end to end logistics portfolio
• Urban logistics portfolio of £292m1,2
across 40 assets
• Grown from £82m a year ago
• Represents over 25% of our logistics
assets
• Acquired £125m during HY 18 at a
blended yield of 5.9% and a WAULT of
8.3 years
• Strong reversionary potential
40 locations
1. September 2017 valuation
2. Including development
Urban Logistics Portfolio

Developments Summary
40
Location Sq ft000
PC3 Rent / uplift £m
YOC(%)
Total cost £m
Costup to Mar 17 H1 H2
FY 18
FY 19
Comment
Stoke2 277 Q1 18 1.5 6.3% 24 8 8 8 16 137k sf let to Michelin
Dagenham 180 Q2 18 0.9 5.7% 16 1 5 10 15 Fully let to Eddie Stobart
Huyton1 120 Q4 17 0.7 6.1% 12 6 6 12 Fully let. Forward funding. Let to Antolin
Crawley2 114 Q1 18 1.4 6.7% 20 9 5 6 11 32k sq ft let to Boeing. Terms on 47k sf
Frimley2 62 Q2 18 0.7 5.3% 13 3 6 9 4 38k sq ft let to BAE. Terms on 24k sf
Ipswich1 31 Q4 17 0.7 6.9% 9 4 2 3 5 Fully let. Await planning on costa pod
Launceston1 30 Q4 17 0.3 6.2% 4 2 2 4 Fully let
In construction 814 6.2 6.2% 98 22 31 41 72 4 £4.1m of £6.2m income is contracted. Terms agreed on additional £1.1m.
Bedford2 670 18/19 4.4 7.3% 60 Land acquired H2. Planning received
Ringwood4 35 H2 18 0.2 5.0% 4 Fully let to Premier Inn. Forward funding
Weymouth2 26 18/19 0.5 6.1% 9 Land acquired H2. Aldi store + 3 pods
Derby 16 18/19 0.4 6.7% 6 Conditionally acquired land. Await planning
Pipeline 747 5.5 7.0% 79
1. Completed post period end2. Based on anticipated rents3. Practical completion based on calendar quarters and years4. Costs and rent shown are LondonMetric share

Recent Distribution developmentsDelivering short cycle big box developments at attractive yield on costs
41
Amazon, Warrington
• Delivered 357,000 sq ft warehouse
• Let to Amazon 5 weeks post PC
• New 15 year lease
• CPI uplifts
• 7.1% yield on cost
Eddie Stobart, Dagenham
• New 180,000 sq ft modern warehouse
• Working in partnership with existing tenant
• New 26 year lease on 436,000 sq ft
• RPI uplifts
• 5.7% yield on cost
Poundworld, Wakefield
• Delivered 527,000 sq ft warehouse
• Let to Poundworld
• New 15 year lease
• RPI uplifts
• 6.3% yield on cost

Historic yield and returns analysis
42

Debt FacilitiesAs at 30 Sept 2017
Facility Drawn Maturity
Sector Lender (£m) (£m) (years) Expiry
Wholly-owned portfolio
Distribution term loan Distribution Helaba 130.0 130.0 6.8 24-Jul-24
Unsecured RCF All Syndicate 337.5 281.4 4.5 01-Apr-22
Unsecured RCF All Syndicate 106.3 88.6 3.5 01-Apr-21
Private Placement All Syndicate 65.0 65.0 6.0 21-Sept-23
Private Placement All Syndicate 40.0 40.0 7.0 21-Sept-24
Private Placement All Syndicate 25.0 25.0 11.0 21-Sept-28
Total wholly-owned 703.8 630.0 5.4
JV portfolio (LondonMetric at share)
MIPP JV (50%) Long income Deutsche Pfandbriefbank 50.0 38.0 5.6 21-Apr-23
DFS JV (45.0%) Long income M&G 22.9 22.9 1.8 23-Jul-19
Total JV portfolio 72.9 60.9 4.1
Total Group and JV 776.7 690.9 5.3
43
43