half year report 2017 - landisgyr.com.br · landis+gyr group ag dear shareholders, landis+gyr group...
TRANSCRIPT

OCTOBER 26, 2017
Half Year Report 2017
Half Year Report 2017Half Year Report 2017
Half Year Report 2017


HALF-YEAR REPORT 2017 3 |
LANDIS+GYR GROUP AG
INDEX TO HALF YEAR REPORT
A Letter to Shareholders 5
B Key Figures 9
C Interim Condensed Consolidated Financial Statements
(unaudited) 11
D Supplemental Reconciliation and Definitions 31
E Dates and Contacts 37
HALF-YEAR REPORT 2017 | 4
LANDIS+GYR GROUP AG

HALF-YEAR REPORT 2017 5 |
LANDIS+GYR GROUP AG
A Letter to ShareholdersLetter to Shareholders
Letter to ShareholdersLetter to Shareholders
HALF-YEAR REPORT 2017 | 6
LANDIS+GYR GROUP AG
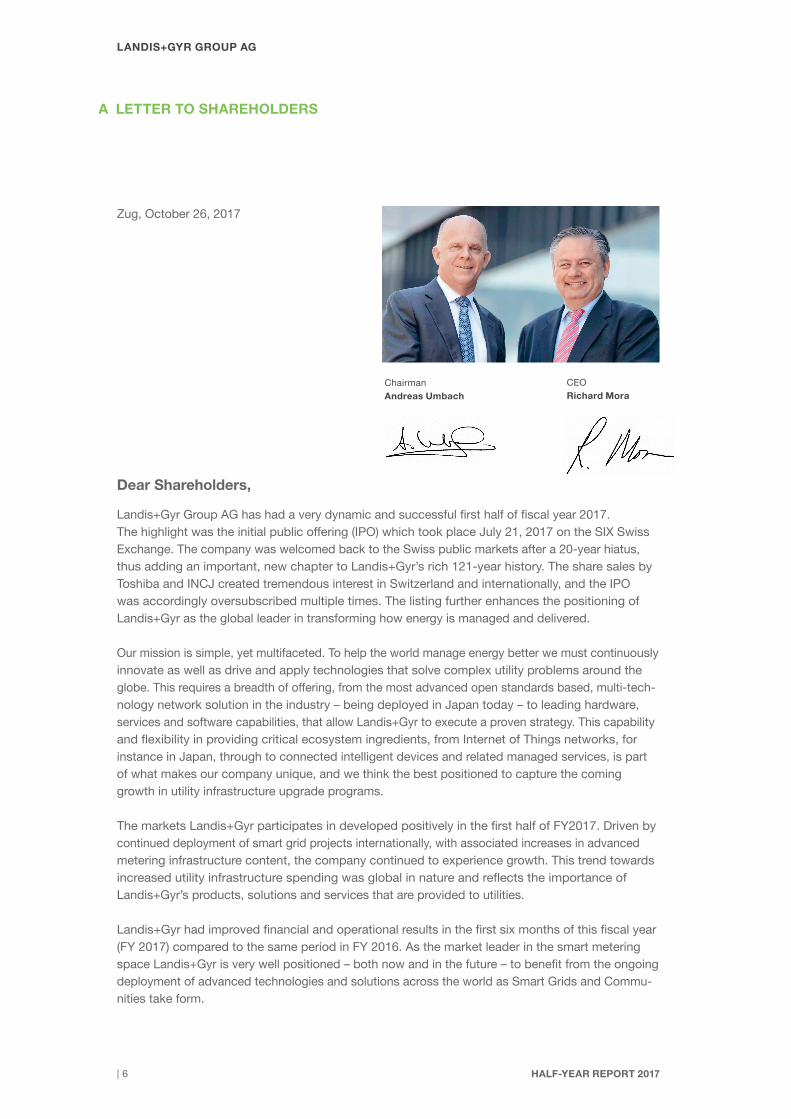
Dear Shareholders,
Landis+Gyr Group AG has had a very dynamic and successful first half of fiscal year 2017. The highlight was the initial public offering (IPO) which took place July 21, 2017 on the SIX Swiss Exchange. The company was welcomed back to the Swiss public markets after a 20-year hiatus, thus adding an important, new chapter to Landis+Gyr’s rich 121-year history. The share sales by Toshiba and INCJ created tremendous interest in Switzerland and internationally, and the IPO was accordingly oversubscribed multiple times. The listing further enhances the positioning of Landis+Gyr as the global leader in transforming how energy is managed and delivered.
Our mission is simple, yet multifaceted. To help the world manage energy better we must continuously innovate as well as drive and apply technologies that solve complex utility problems around the globe. This requires a breadth of offering, from the most advanced open standards based, multi-tech-nology network solution in the industry – being deployed in Japan today – to leading hardware, services and software capabilities, that allow Landis+Gyr to execute a proven strategy. This capability and flexibility in providing critical ecosystem ingredients, from Internet of Things networks, for instance in Japan, through to connected intelligent devices and related managed services, is part of what makes our company unique, and we think the best positioned to capture the coming growth in utility infrastructure upgrade programs.
The markets Landis+Gyr participates in developed positively in the first half of FY2017. Driven by continued deployment of smart grid projects internationally, with associated increases in advanced metering infrastructure content, the company continued to experience growth. This trend towards increased utility infrastructure spending was global in nature and reflects the importance of Landis+Gyr’s products, solutions and services that are provided to utilities.
Landis+Gyr had improved financial and operational results in the first six months of this fiscal year (FY 2017) compared to the same period in FY 2016. As the market leader in the smart metering space Landis+Gyr is very well positioned – both now and in the future – to benefit from the ongoing deployment of advanced technologies and solutions across the world as Smart Grids and Commu-nities take form.
Zug, October 26, 2017
Chairman Andreas Umbach
CEO Richard Mora
A LETTER TO SHAREHOLDERS

HALF-YEAR REPORT 2017 7 |
LANDIS+GYR GROUP AG
Based on continued demand for smart metering products and solutions, net revenues for Landis+Gyr Group reached USD 865.6 million in the first half of FY 2017 growing 9.9% compared to the first half of FY 2016, or 9.6% on a constant currency basis. All three regions contributed to the first half sales performance, with Americas, EMEA and Asia Pacific increasing net revenues by 5.4%, 16.9% and 8.6% respectively on a constant currency basis, compared to the year ago period. Order intake reached USD 821.4 million in the first half of FY 2017, an increase of 27.6% in constant currency terms on the same period last year, reflecting the trust which our customers continue to place in the technological excellence of our market leading portfolio. Committed backlog was USD 2.479 billion at the end of the first half of FY 2017.
Adjusted gross profit for the reporting period was USD 304.4 million, a USD 7.0 million increase year over year from the USD 297.4 million delivered in FY 2016. First half FY 2017 Adjusted EBITDA reached USD 108.8 million compared to USD 96.3 million in the prior year, an increase of 13.0%. We made a number of EBITDA adjustments in the first half of FY 2017 totaling USD 65.7 million, mainly related to IPO expenses of USD 24.2 million (of which USD 9.8 million was funded by the selling shareholders) and warranty adjustments of USD 30.3 million, the latter primarily reflecting a significant increase to warranty provisions in the Americas due to legacy component issues. We are working with the affected customers on these issues as well as ensuring that our current quality processes continue to improve to minimize the risk of such issues recurring. Overall, the adjusted EBITDA margin increased from 12.2% to 12.6% and was primarily driven by an outstanding performance in the Americas’ region.
Net income for the FY 2017 first half was USD 5.1 million, or USD 0.17 per share and compares to a net loss of USD 13.0 million, or a loss of USD 0.44 per share, for the first half FY 2016. Free cash flow, defined as cash flow provided by operating activities (including changes in net working capital) minus cash flow used by investing activities (capital expenditures and intangible assets), reached USD 20.6 million in the first half of FY 2017, an increase of USD 42.0 million from the first half of FY 2016. Net debt fell by USD 121.8 million compared to September 30, 2016 and Landis+Gyr ended the period with net debt of USD 107.3 million, a ratio of net debt to annualized first half FY 2017 adjusted EBITDA of 0.5.
While the three regional performances in net revenues were encouraging, profit flow-through was clearly visible in only one segment. Driven by continued growth across the region, particularly the U.S. public power segment, as well as execution of their business model the Americas region showed an improvement in both net revenues and margins. Adjusted gross profit improved year over year by USD 7.5 million and adjusted EBITDA reached USD 105.9 million, representing a margin increase of 35 basis points.
EMEA’s top line performance was very encouraging, as double-digit growth continued. Driving this result was a broad range of countries, including the UK, France, Spain & Portugal. However, we continued to experience margin pressure with Adjusted EBITDA improving only slightly to a loss of USD 1.6 million as the first savings from our restructuring program (known as Project Phoenix which has a short-term focus on our operating and product costs in EMEA) offset a decline at the gross profit level. As we have shared during the IPO, our major focus in 2017 is improving the financial performance of this region. The good news is that EMEA’s Adjusted EBITDA margins will improve as our identified cost saving initiatives have been making clear progress, and we are on

HALF-YEAR REPORT 2017 | 8
LANDIS+GYR GROUP AG
target to achieve the savings expected by the end of March 2018. Furthermore, Project Lightfoot (which is focused on supply chain and manufacturing rationalization in EMEA) is on track to deliver its expected benefits which, as noted during the IPO, will mainly be realized in FY 2018 and beyond.
In the Asia Pacific region, double digit net revenue expansion was realized with projects in Hong Kong offsetting near term weakness in Australia, as the temporary market slowdown due to the impending Power of Choice program is expected to abate by the end of the calendar year. The upside from that situation is that our intelliHUB service model is designed specifically to participate in and leverage this new market structure. Notwithstanding some pressure at the gross profit margin level during the reporting period, cost control measures allowed for a slight improvement in Adjusted EBITDA.
Overall, global developments continue to progress and Landis+Gyr is positioned extremely well to benefit from these trends. From important product milestones in the UK with the industry’s first SMETS2 meter coming to market, the addition to our services business in Finland at Caruna, India’s Tata Power announcement, and the latest developments in our partnership with TEPCO, there have been many indicators of Landis+Gyr’s leading positioning. Accordingly, Landis+Gyr’s IPO guidance for FY 2017 Adjusted EBITDA is confirmed, which is for flat year over year performance on a USD basis, at approximately USD 212 million. FY 2017 net revenues and free cash flow are expected slightly higher than guidance provided during the IPO, which was for FY 2017 net revenues to increase 3% year over year and free cash flow to be between USD 60 –70 million. The FY 2017 dividend, to be paid out of capital reserves in 2018, will be the Swiss franc equivalent of at least USD 70 million.
Even further ahead, we remain confident in the upcoming revenue opportunities for the Group that primarily comes from the momentum which we see in all regions as technology driven AMI rollouts continue to be announced or expanded. As a result, IPO guidance through FY 2020 is also confirmed. Compared to FY 2016, net revenues are expected to grow annually on average by a high single digit percentage, Adjusted EBITDA margin to expand by 100–150 basis points, free cash flow to be well above USD 100 million per year and a dividend each fiscal year of at least 75% of free cash flow.
Looking through the whirlwind of activity that has surrounded Landis+Gyr for the year to date, we remain convinced that the company has the right strategy, technology, products, and people to continue to be the global leader in this exciting industry. As a business that successfully transitioned from being a dedicated metering provider to offering our customers the most advanced networking and IoT solutions in the industry, Landis+Gyr has been structured to weather global and industrial cycles – and this balance makes us the envy of the industry.
In conclusion, we thank you for your support and ownership of Landis+Gyr, and are extremely pleased that you have joined us in helping the world manage energy better.

HALF-YEAR REPORT 2017 9 |
LANDIS+GYR GROUP AG
B Key figuresB Key figures
B Key figuresB Key figures
HALF-YEAR REPORT 2017 | 10
LANDIS+GYR GROUP AG
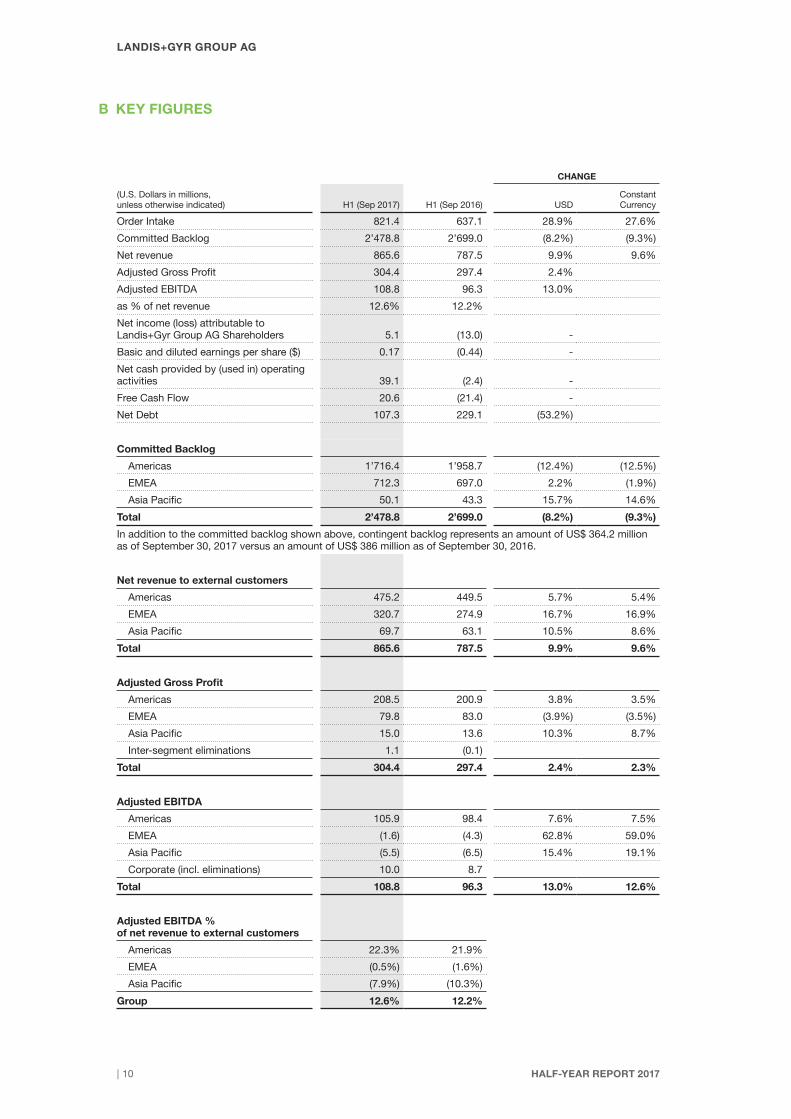
B KEY FIGURES
CHANGE
(U.S. Dollars in millions, unless otherwise indicated) H1 (Sep 2017) H1 (Sep 2016) USD
Constant Currency
Order Intake 821.4 637.1 28.9% 27.6%
Committed Backlog 2’478.8 2’699.0 (8.2%) (9.3%)
Net revenue 865.6 787.5 9.9% 9.6%
Adjusted Gross Profit 304.4 297.4 2.4%
Adjusted EBITDA 108.8 96.3 13.0%
as % of net revenue 12.6% 12.2%
Net income (loss) attributable to Landis+Gyr Group AG Shareholders 5.1 (13.0) -
Basic and diluted earnings per share ($) 0.17 (0.44) -
Net cash provided by (used in) operating activities 39.1 (2.4) -
Free Cash Flow 20.6 (21.4) -
Net Debt 107.3 229.1 (53.2%)
Committed Backlog
Americas 1’716.4 1’958.7 (12.4%) (12.5%)
EMEA 712.3 697.0 2.2% (1.9%)
Asia Pacific 50.1 43.3 15.7% 14.6%
Total 2’478.8 2’699.0 (8.2%) (9.3%)
In addition to the committed backlog shown above, contingent backlog represents an amount of US$ 364.2 million as of September 30, 2017 versus an amount of US$ 386 million as of September 30, 2016.
Net revenue to external customers
Americas 475.2 449.5 5.7% 5.4%
EMEA 320.7 274.9 16.7% 16.9%
Asia Pacific 69.7 63.1 10.5% 8.6%
Total 865.6 787.5 9.9% 9.6%
Adjusted Gross Profit
Americas 208.5 200.9 3.8% 3.5%
EMEA 79.8 83.0 (3.9%) (3.5%)
Asia Pacific 15.0 13.6 10.3% 8.7%
Inter-segment eliminations 1.1 (0.1)
Total 304.4 297.4 2.4% 2.3%
Adjusted EBITDA
Americas 105.9 98.4 7.6% 7.5%
EMEA (1.6) (4.3) 62.8% 59.0%
Asia Pacific (5.5) (6.5) 15.4% 19.1%
Corporate (incl. eliminations) 10.0 8.7
Total 108.8 96.3 13.0% 12.6%
Adjusted EBITDA % of net revenue to external customers
Americas 22.3% 21.9%
EMEA (0.5%) (1.6%)
Asia Pacific (7.9%) (10.3%)
Group 12.6% 12.2%

HALF-YEAR REPORT 2017 11 |
LANDIS+GYR GROUP AG
C Interim Condensed Consolidated Financial Statements (unaudited)Interim Condensed Consolidated Financial Statements (unaudited)
Interim Condensed Consolidated Financial Statements (unaudited)Interim Condensed Consolidated Financial Statements (unaudited)

HALF-YEAR REPORT 2017 | 12
LANDIS+GYR GROUP AG
The accompanying notes are an integral part of these interim condensed consolidated financial statements.
C INTERIM CONDENSED CONSOLIDATED STATEMENTS OF OPERATIONS (UNAUDITED)
SIX MONTHS ENDED
September 30, September 30,U. S. Dollars in thousands 2017 2016
Net revenue $ 865’639 $ 787’464
Cost of revenue 622’913 519’044
Gross profit 242’726 268’420
Operating expenses
Research and development 83’247 81’297
Sales and marketing 54’725 52’073
General and administrative 92’622 98’220
Amortization of intangible assets 17’674 17’530
Operating income (5’542) 19’300
Other income (expense)
Interest income 368 288
Interest expense (3’761) (5’901)
Income (loss) on foreign exchange related to intercompany loans, net 7’862 (10’778)
Income (loss) before income tax expense (1’073) 2’909
Income tax benefit (expense) 6’330 (15’924)
Net income (loss) before noncontrolling interests 5’257 (13’015)
Net income (loss) attributable to noncontrolling interests, net of tax 185 (30)
Net income (loss) attributable to Landis+Gyr Group AG Shareholders $ 5’072 $ (12’985)
Net income (loss) per share
Basic and diluted $ 0.17 $ (0.44)
Weighted average shares used in computing income (loss) per share:
Basic and diluted 29’510’000 29’510’000
HALF-YEAR REPORT 2017 13 |
LANDIS+GYR GROUP AG
The accompanying notes are an integral part of these interim condensed consolidated financial statements.
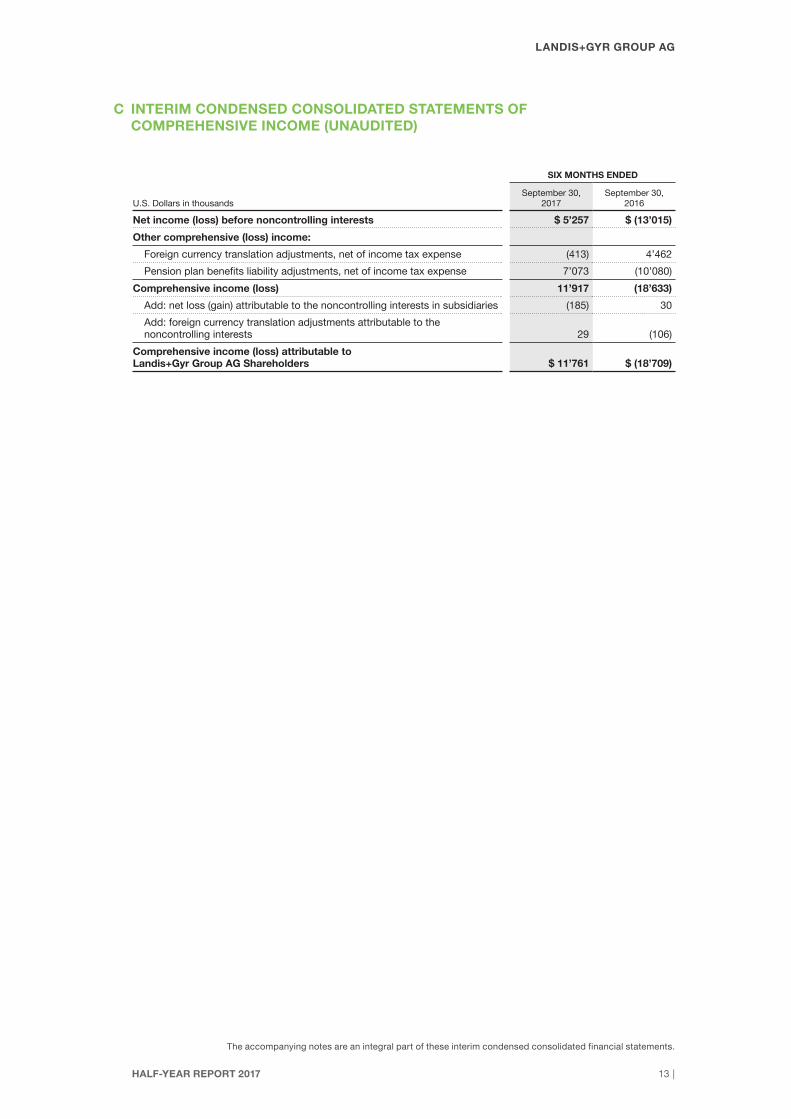
C INTERIM CONDENSED CONSOLIDATED STATEMENTS OF COMPREHENSIVE INCOME (UNAUDITED)
SIX MONTHS ENDED
September 30, September 30, U.S. Dollars in thousands 2017 2016
Net income (loss) before noncontrolling interests $ 5’257 $ (13’015)
Other comprehensive (loss) income:
Foreign currency translation adjustments, net of income tax expense (413) 4’462
Pension plan benefits liability adjustments, net of income tax expense 7’073 (10’080)
Comprehensive income (loss) 11’917 (18’633)
Add: net loss (gain) attributable to the noncontrolling interests in subsidiaries (185) 30
Add: foreign currency translation adjustments attributable to the noncontrolling interests 29 (106)
Comprehensive income (loss) attributable to Landis+Gyr Group AG Shareholders $ 11’761 $ (18’709)
HALF-YEAR REPORT 2017 | 14
LANDIS+GYR GROUP AG
The accompanying notes are an integral part of these interim condensed consolidated financial statements.
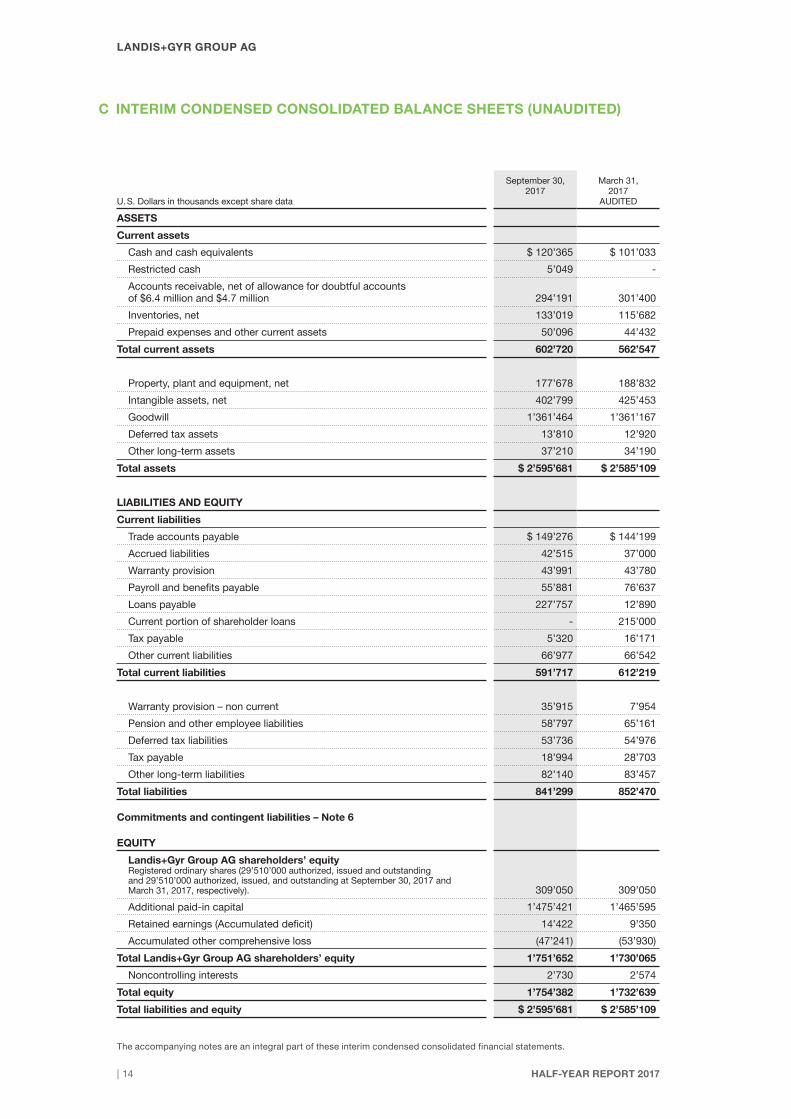
C INTERIM CONDENSED CONSOLIDATED BALANCE SHEETS (UNAUDITED)
U. S. Dollars in thousands except share data
September 30, March 31, 2017 2017
AUDITED
ASSETS
Current assets
Cash and cash equivalents $ 120’365 $ 101’033
Restricted cash 5’049 -
Accounts receivable, net of allowance for doubtful accounts of $6.4 million and $4.7 million 294’191 301’400
Inventories, net 133’019 115’682
Prepaid expenses and other current assets 50’096 44’432
Total current assets 602’720 562’547
Property, plant and equipment, net 177’678 188’832
Intangible assets, net 402’799 425’453
Goodwill 1’361’464 1’361’167
Deferred tax assets 13’810 12’920
Other long-term assets 37’210 34’190
Total assets $ 2’595’681 $ 2’585’109
LIABILITIES AND EQUITY
Current liabilities
Trade accounts payable $ 149’276 $ 144’199
Accrued liabilities 42’515 37’000
Warranty provision 43’991 43’780
Payroll and benefits payable 55’881 76’637
Loans payable 227’757 12’890
Current portion of shareholder loans - 215’000
Tax payable 5’320 16’171
Other current liabilities 66’977 66’542
Total current liabilities 591’717 612’219
Warranty provision – non current 35’915 7’954
Pension and other employee liabilities 58’797 65’161
Deferred tax liabilities 53’736 54’976
Tax payable 18’994 28’703
Other long-term liabilities 82’140 83’457
Total liabilities 841’299 852’470
Commitments and contingent liabilities – Note 6
EQUITY
Landis+Gyr Group AG shareholders’ equity Registered ordinary shares (29’510’000 authorized, issued and outstanding and 29’510’000 authorized, issued, and outstanding at September 30, 2017 and March 31, 2017, respectively). 309’050 309’050
Additional paid-in capital 1’475’421 1’465’595
Retained earnings (Accumulated deficit) 14’422 9’350
Accumulated other comprehensive loss (47’241) (53’930)
Total Landis+Gyr Group AG shareholders’ equity 1’751’652 1’730’065
Noncontrolling interests 2’730 2’574
Total equity 1’754’382 1’732’639
Total liabilities and equity $ 2’595’681 $ 2’585’109

HALF-YEAR REPORT 2017 15 |
LANDIS+GYR GROUP AG
The accompanying notes are an integral part of these interim condensed consolidated financial statements.
C INTERIM
CONDENSED CONSOLIDATED STA
TEMENTS OF CHANGES IN SHAREHOLDERS’ E
QUITY (UNAUDITED)
US
D in
tho
usan
ds
exce
pt
for
shar
esReg
istered ordinary sh
ares 1
Additiona
l paid-in
capital
Retaine
d earn-
ings (Acc
umulat-
ed defi
cit)
Acc
umulated
other compre-
hens
ive inco
me
(loss)
Total L
andis+Gyr
Group
AG equity
Nonc
ontrolling
interests
Total equity
Balan
ce at March
31, 2016
29’510’000
$ 309’050
$ 1’437’078
$ 71’920
$ (90’057)
$ 1’727’991
$ 1’848
$ 1’729’839
Net
inco
me
(loss
)-
- -
(12’
985)
- (1
2’98
5)(3
0)(1
3’01
5)
Fore
ign
curr
ency
tra
nsla
tion
adju
st-
men
ts, n
et o
f inc
ome
tax
exp
ense
- -
- -
4’35
64’
356
106
4’46
2
Pen
sion
pla
n b
enefi
ts li
abili
ty a
dju
st-
men
t, n
et o
f inc
ome
tax
exp
ense
- -
- -
(10’
080)
(1
0’08
0)
- (1
0’08
0)
Balan
ce at Sep
tember 30, 2016
29’510’000
$ 309’050
$ 1’437’078
$ 58’935
$ (95’781)
$ 1’709’282
$ 1’924
$ 1’711’206
Balan
ce at March
31, 2017
29’510’000
$ 309’050
$ 1’465’595
$ 9’350
$ (53’930)
$ 1’730’065
$ 2’574
$ 1’732’639
Net
inco
me
- -
- 5’
072
- 5’
072
185
5’25
7
Fore
ign
curr
ency
tra
nsla
tion
adju
st-
men
ts, n
et o
f inc
ome
tax
exp
ense
- -
- -
(384
)(3
84)
(29)
(413
)
Pen
sion
pla
n b
enefi
ts li
abili
ty a
dju
st-
men
t, n
et o
f inc
ome
tax
exp
ense
- -
- -
7’07
3 7’
073
- 7’
073
IPO
rec
ogni
tion
bon
us-
- 9’
826
- -
9’82
6 -
9’82
6
Balan
ce at Sep
tember 30, 2017
29’510’000
$ 309’050
$ 1’475’421
$ 14’422
$ (47’241)
$ 1’751’652
$ 2’730
$ 1’754’382
1 T
he n
umb
er o
f sha
res
for
all p
erio
ds
has
bee
n re
stat
ed in
co
nnec
tion
with
the
Rev
erse
Sto
ck S
plit
. Ref
er t
o to
No
te 2
“S
hare
hold
er’s
eq
uity
” fo
r fu
rthe
r d
etai
ls.

HALF-YEAR REPORT 2017 | 16
LANDIS+GYR GROUP AG
The accompanying notes are an integral part of these interim condensed consolidated financial statements.
C INTERIM CONDENSED CONSOLIDATED STATEMENTS OF CASH FLOWS (UNAUDITED)
SIX MONTHS ENDED
September 30, September 30, 2017 2016
Cash flow from operating activities
Net income (loss) $ 5’257 $ (13’015)
Adjustments to reconcile net income to net cash provided by (used in) operating activities
Depreciation and amortization 48’629 47’827
IPO recognition bonus – equity component 6’551 -
Accumulated interest on shareholder loans 1’636 4’988
Gain on disposal of property, plant and equipment 516 22
Effect of foreign currencies translation on non-operating items, net 2’886 (5’187)
Change in allowance for doubtful accounts 1’662 (744)
Deferred income tax (1’654) (9’579)
Change in operating assets and liabilities, net of effect of businesses acquired and effect of changes in exchange rates:
Accounts receivable 20’253 8’410
Inventories (5’310) (21’024)
Trade accounts payable (5’318) (5’097)
Interest payment on shareholder loans (2’950) (4’848)
Other assets and liabilities (33’065) (4’134)
Net cash provided by (used in) operating activities 39’093 (2’381)
Cash flow from investing activities
Payments for property, plant and equipment (19’055) (19’019)
Payments for intangible assets (46) (200)
Proceeds from the sale of property, plant and equipment 558 219
Net cash used in investing activities (18’543) (19’000)
Cash flow from financing activities
Capital contribution related to IPO recognition bonus – cash component 3’275 -
Proceeds from third party facility 215’000 -
Repayment of borrowings to third party facility (24) (855)
Proceeds from shareholders and related party facility - 55’663
Repayment of borrowings to shareholders and related party facility (215’000) (35’000)
Net cash used in financing activities 3’251 19’808
Net increase (decrease) in cash and cash equivalents 23’801 (1’573)
Cash and cash equivalents at beginning of period, including restricted cash 101’033 22’092
Effects of foreign exchange rate changes on cash and cash equivalents 580 (142)
Cash and cash equivalents at end of period, including restricted cash $ 125’414 $ 20’377
Supplemental cash flow information
Cash paid for income tax $ 22’296 $ 21’468
Cash paid for interest $ 4’661 $ 5’644
HALF-YEAR REPORT 2017 17 |
LANDIS+GYR GROUP AG
C Notes to Interim Condensed Consolidated Financial Statements (unaudited)Notes to Interim Condensed Consolidated Financial Statements (unaudited)
Notes to Interim Condensed Consolidated Financial Statements (unaudited)Notes to Interim Condensed Consolidated Financial Statements (unaudited)
HALF-YEAR REPORT 2017 | 18
LANDIS+GYR GROUP AG
C NOTES TO INTERIM CONDENSED CONSOLIDATED FINANCIAL STATEMENTS (UNAUDITED)
NOTE 1: SUMMARY OF SIGNIFICANT ACCOUNTING PRINCIPLES1.1 General InformationLandis+Gyr Group AG (“Landis+Gyr”), formerly known as Landis+Gyr Holding AG, and subsidiaries (together, the “Company”) form a leading global provider of energy metering products and solutions to utilities.
On February 6, 2013, Toshiba Corporation, one of the former shareholders, acquired a 100% equity interest in Consert Inc., incorporated in the USA. Consert converts electric consumption in homes and small businesses into cost-effective, clean sources of capacity and energy reserves for utilities. Toshiba Corporation sold certain assets and liabilities of Consert to the Company on November 1, 2016.
The following notes relate to the interim condensed consolidated financial statements of Landis+Gyr and the com-bined presentation of Consert for each of the six months ended September 30, 2017 and September 30, 2016.
The condensed consolidated half-year financial statements have not been audited by the auditors. They were approved for publication by the Board of Directors on October 25, 2017.
1.2 Initial Public OfferingOn July 12, 2017, the Company’s listing application (Securities number: 37115349; ISIN: CH.037’115’349’2; Ticker symbol: LAND) relating to an initial public offering (“IPO”) of its common stock was declared effective by the SIX Swiss Exchange. On July 21, 2017, the Company completed the IPO at a price to the public of CHF 78 per share. In connection with the IPO, the Company’s stockholders sold an aggregate of 29’510’000 shares of common stock, thereof 81’945 shares were set aside to grant and fund the IPO recognition bonus (see Note 2: Shareholders’ equity). The selling stockholders received all of the net proceeds and bore all commissions and dis-counts from the sale of the Company’s common stock. The Company did not receive any proceeds from the IPO.
In preparation for the IPO, the Company incurred $24.2 million of costs for professional services and an IPO recognition bonus. The IPO recognition bonus amounted to $9.8 million, was fully funded by the selling share-holders, and consisted of shares and cash. The Company has expensed the IPO related professional fees as incurred. The IPO recognition bonus was expensed pursuant to the stock compensation guidance and recog-nized as increase in additional paid-in capital (see Note 2: Shareholders’ equity).
Before the IPO, the Company was owned by Toshiba Corporation (60%) and Innovation Network Corporation of Japan (40%).
1.3 Basis of Presentation The unaudited interim condensed consolidated financial statements have been prepared in accordance with generally accepted accounting principles in the Unites States of America (“US GAAP”) for interim financial information and accordingly do not include all information and disclosures as required by US GAAP for complete financial statements. Therefore, such financial information should be read in conjunction with the audited consolidated financial statements for the fiscal year ended March 31, 2017 which were included in the Company’s listing prospectus dated July 12, 2017.
In the opinion of management, these unaudited interim condensed consolidated financial statements reflect all adjustments necessary to fairly state the consolidated balance sheets, statements of operations, statements of comprehensive income, cash flows and changes in shareholders’ equity for the interim periods presented. Management considers all such adjustments to be of a normal recurring nature.
All amounts are presented in United States dollars (“$” or “USD”), unless otherwise stated. The Company’s comparative consolidated financial statements have been retrospectively adjusted to include Consert’s net assets and related operations for all periods during which the entities were under common control. Certain amounts reported in the interim consolidated financial information for prior periods have been reclassified to

HALF-YEAR REPORT 2017 19 |
LANDIS+GYR GROUP AG
conform to the current year’s presentation. These changes primarily relate to the reclassification and netting of deferred tax assets and liabilities, as result of the adoption of an accounting standard update on the classifica-tion of deferred taxes (see Note 1.7: Recent accounting pronouncements).
All share, per share and capital stock amounts for all periods presented have been restated to give effect to the Reverse Stock Split (see Note 2: Shareholders’ equity).
The Company’s interim condensed consolidated financial statements have been prepared on a going concern basis. The Company’s going concern assumption is based on its ability to address near-term financing require-ments. In accordance with ASC 205-40, Going Concern, the Company has evaluated whether the maturity of the loan facility entered into on June 1, 2017 (or a mandatory prepayment of the loan) raises substantial doubt about the Company’s ability to continue as a going concern within one year after the date the interim condensed financial statements are issued. In the event of a capital market transaction or in the event of change in control (as defined by the facility agreement), management will use the proceeds to first settle the outstanding debt thus alleviating substantial doubt of the Company’s ability to continue as a going concern if a mandatory prepayment is required. In the absence of a required prepayment, the loan will become due at maturity whereby Manage-ment’s plan for alleviating substantial doubt of the Company’s ability to continue as a going concern includes refinancing the loan which Management believes it has the ability to do.
1.4 Use of EstimatesThe preparation of consolidated financial statements in accordance with US GAAP requires management to make estimates and assumptions that affect the amounts reported in the interim condensed consolidated financial statements and accompanying notes. Actual results could differ materially from these estimates. If the estimates and assumptions used by management to the best of its knowledge at the date of the financial state-ments happen to differ from subsequent actual facts, the original estimates and assumptions will be adjusted in the reporting period in which the facts have changed.
1.5 Restricted CashWe are required to maintain cash balances that are restricted in order to secure certain bank guarantees. Restricted cash is generally deposited in bank accounts earning market rates; therefore, the carrying value approximates fair value. Such cash is excluded from cash and cash equivalents in the interim condensed consolidated balance sheet.
1.6 Earnings per ShareASC 260, “Earnings per Share”, requires entities to present both basic and diluted earnings per share. Basic earnings per share is calculated by dividing net income by the weighted-average number of common shares outstanding during the period.
Diluted earnings per share is calculated by dividing net income by the weighted average number of common shares outstanding during the period plus all dilutive potential common shares outstanding. Potentially dilutive shares that are anti-dilutive are excluded from the diluted earnings per share calculation.
As of September 30, 2017 and September 30, 2016 the Company had no dilutive shares outstanding.
C NOTES TO INTERIM CONDENSED CONSOLIDATED FINANCIAL STATEMENTS (UNAUDITED)
HALF-YEAR REPORT 2017 | 20
LANDIS+GYR GROUP AG
1.7 Recent Accounting PronouncementsNew accounting pronouncementsIn May 2014, the Financial Accounting Standards Board (FASB) issued Accounting Standards Update (ASU) 2014-09, Revenue from Contracts with Customers: Topic 606, to supersede nearly all existing revenue recogni-tion guidance under US GAAP. The core principle of ASU 2014-09 is to recognize revenues when promised goods or services are transferred to customers in an amount that reflects the consideration that is expected to be received for those goods or services. The guidance provides a five-step analysis of transactions to determine when and how revenue is recognized. Other major provisions include capitalization of certain contract costs, consideration of time value of money in the transaction price, and allowing estimates of variable consideration to be recognized before contingencies are resolved in certain circumstances. The guidance also requires enhanced disclosures regarding the nature, amount, timing and uncertainty of revenue and cash flows arising from an entity’s contracts with customers. The standard permits two methods of adoption: retrospectively to each prior reporting period presented (full retrospective method), or retrospectively with the cumulative effect of initially applying the guidance recognized at the date of initial application (the cumulative catch-up transition method). The Company will adopt the new standard as of April 1, 2018 and is currently in the process of evalu-ating the effect that this guidance will have on its consolidated financial statements and related disclosures.
In March 2017, the FASB issued ASU 2017-07, Compensation – Retirement Benefits (Topic 715): Improving the Presentation of Net Periodic Pension Cost and Net Periodic Postretirement Benefit Cost, which requires an entity to present net periodic pension cost and net periodic postretirement benefit cost as a net amount that may be capitalized as part of an asset where appropriate. The amendments in this guidance require that an employer report the service cost component in the same line item or items as other compensation costs arising from services rendered by the pertinent employees during the period. It also requires the other compo-nents of net periodic pension cost and net periodic postretirement benefit cost to be presented in the consoli-dated income statement separately from the service cost component and outside a subtotal of income from operations, if one is presented. The Company will adopt the new standard as of April 1, 2018 and does not believe that this update will have a significant impact on its consolidated financial statements, other than the statement of operations presentation.
Recently Adopted Accounting PronouncementsIn September 2015, the FASB issued ASU 2015-16 Business Combinations (Topic 805): Simplifying the Accounting for Measurement-Period Adjustments, which eliminates the requirement that an acquirer in a busi-ness combination account for measurement-period adjustments retrospectively. Instead, an acquirer will recog-nize a measurement-period adjustment during the period in which it determines the amount of the adjustment. The Company has adopted this guidance as of April 1, 2017. There were no transactions within the scope of the new guidance in the interim period ended September 30, 2017.
In November 2015, the FASB issued ASU 2015-17, Income Taxes (Topic 740): Balance Sheet Classification of Deferred Taxes which requires deferred tax liabilities and assets to be classified as noncurrent in the consoli-dated statement of financial position. The Company has adopted this guidance as of April 1, 2017 on a retro-spective basis. This resulted in a decrease of $43.9 million of current deferred tax assets and a decrease of less than $0.1 million of current deferred tax liabilities, offset by an increase in the non-current deferred tax assets of $3.5 million and a decrease in the non-current deferred tax liabilities of $40.3 million.
On November 17, 2016, the FASB issued ASU 2016-18 Statement of Cash Flows (Topic 230): Restricted Cash which requires that the statement of cash flows explain the change during the period in the total of cash, cash equivalents, and amounts generally described as restricted cash or restricted cash equivalents. The Company has early adopted this guidance as of April 1, 2017 on a retrospective basis. As result of the adoption, the Com-pany is now presenting the restricted cash combined with unrestricted cash and cash equivalents when recon-ciling the beginning and end of period balances of statement of cash flow.
C NOTES TO INTERIM CONDENSED CONSOLIDATED FINANCIAL STATEMENTS (UNAUDITED)
HALF-YEAR REPORT 2017 21 |
LANDIS+GYR GROUP AG
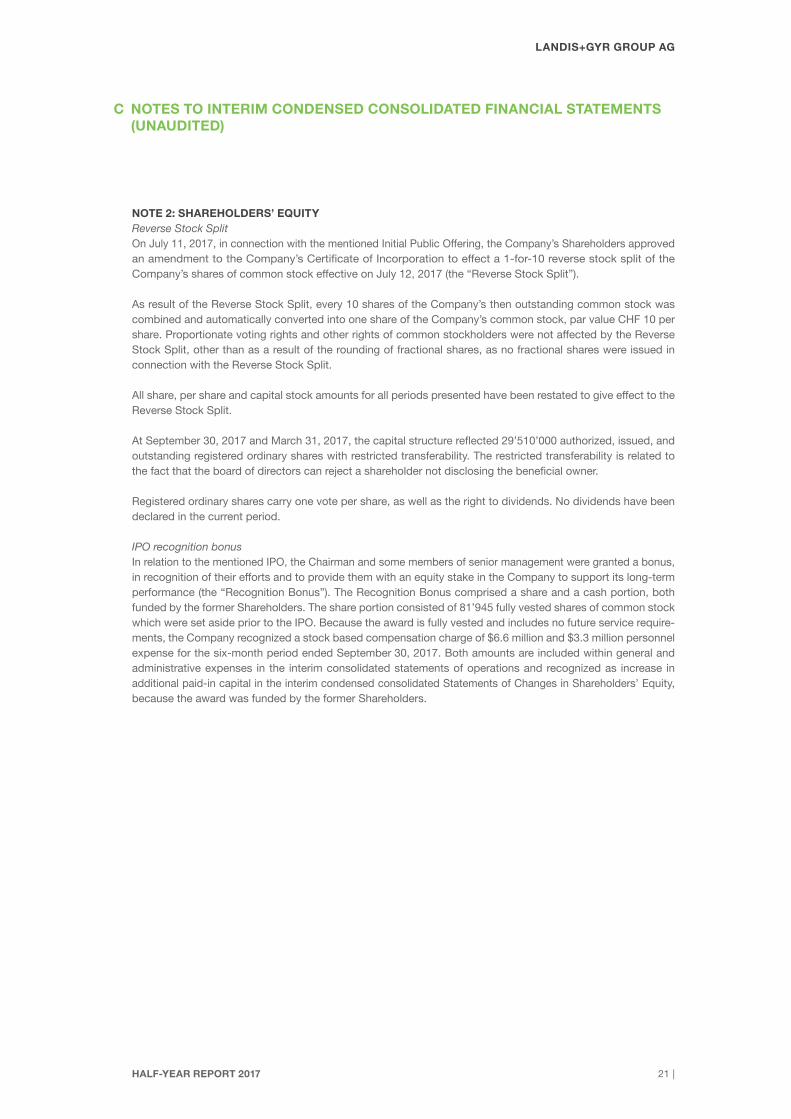
NOTE 2: SHAREHOLDERS’ EQUITYReverse Stock SplitOn July 11, 2017, in connection with the mentioned Initial Public Offering, the Company’s Shareholders approved an amendment to the Company’s Certificate of Incorporation to effect a 1-for-10 reverse stock split of the Company’s shares of common stock effective on July 12, 2017 (the “Reverse Stock Split”).
As result of the Reverse Stock Split, every 10 shares of the Company’s then outstanding common stock was combined and automatically converted into one share of the Company’s common stock, par value CHF 10 per share. Proportionate voting rights and other rights of common stockholders were not affected by the Reverse Stock Split, other than as a result of the rounding of fractional shares, as no fractional shares were issued in connection with the Reverse Stock Split.
All share, per share and capital stock amounts for all periods presented have been restated to give effect to the Reverse Stock Split.
At September 30, 2017 and March 31, 2017, the capital structure reflected 29’510’000 authorized, issued, and outstanding registered ordinary shares with restricted transferability. The restricted transferability is related to the fact that the board of directors can reject a shareholder not disclosing the beneficial owner.
Registered ordinary shares carry one vote per share, as well as the right to dividends. No dividends have been declared in the current period.
IPO recognition bonusIn relation to the mentioned IPO, the Chairman and some members of senior management were granted a bonus, in recognition of their efforts and to provide them with an equity stake in the Company to support its long-term performance (the “Recognition Bonus”). The Recognition Bonus comprised a share and a cash portion, both funded by the former Shareholders. The share portion consisted of 81’945 fully vested shares of common stock which were set aside prior to the IPO. Because the award is fully vested and includes no future service require-ments, the Company recognized a stock based compensation charge of $6.6 million and $3.3 million personnel expense for the six-month period ended September 30, 2017. Both amounts are included within general and administrative expenses in the interim consolidated statements of operations and recognized as increase in additional paid-in capital in the interim condensed consolidated Statements of Changes in Shareholders’ Equity, because the award was funded by the former Shareholders.
C NOTES TO INTERIM CONDENSED CONSOLIDATED FINANCIAL STATEMENTS (UNAUDITED)

HALF-YEAR REPORT 2017 | 22
LANDIS+GYR GROUP AG
Accumulated Other Comprehensive Income (Loss)The components of accumulated other comprehensive loss (AOCL) of Landis+Gyr Group AG consists of (in thousands):
SEPTEMBER 30,
2017 2016
Foreign currency translation adjustments $ (27’369) $ (30’527)
Pension plan benefits liability adjustments, net of taxes of $2’271 and $2’300 as of September 30, 2017 and September 30, 2016, respectively (19’872) (65’254)
Accumulated other comprehensive income (loss) $ (47’241) $ (95’781)
The following tables present the reclassification adjustments in accumulated other comprehensive income (loss) by component (in thousands):
USD in thousandsDefined benefit pension items
Foreign currency items Total
Beginning balance, April 1, 2017 $ (26’945) $ (26’985) $ (53’930)
Other comprehensive income (loss) before reclassifications 7’294 (384) 6’910
Amounts reclassified from accumulated other comprehensive income (221) - (221)
Net current-period other comprehensive income (loss) 7’073 (384) 6’689
Ending balance, September 30, 2017 $ (19’872) $ (27’369) $ (47’241)
USD in thousandsDefined benefit pension items
Foreign currency items Total
Beginning balance, April 1, 2016 $ (55’174) $ (34’883) $ (90’057)
Other comprehensive income (loss) before reclassifications (11’353) 4’356 (6’997)
Amounts reclassified from accumulated other comprehensive income 1’273 - 1’273
Net current-period other comprehensive income (loss) (10’080) 4’356 (5’724)
Ending balance, September 30, 2016 $ (65’254) $ (30’527) $ (95’781)
C NOTES TO INTERIM CONDENSED CONSOLIDATED FINANCIAL STATEMENTS (UNAUDITED)
HALF-YEAR REPORT 2017 23 |
LANDIS+GYR GROUP AG
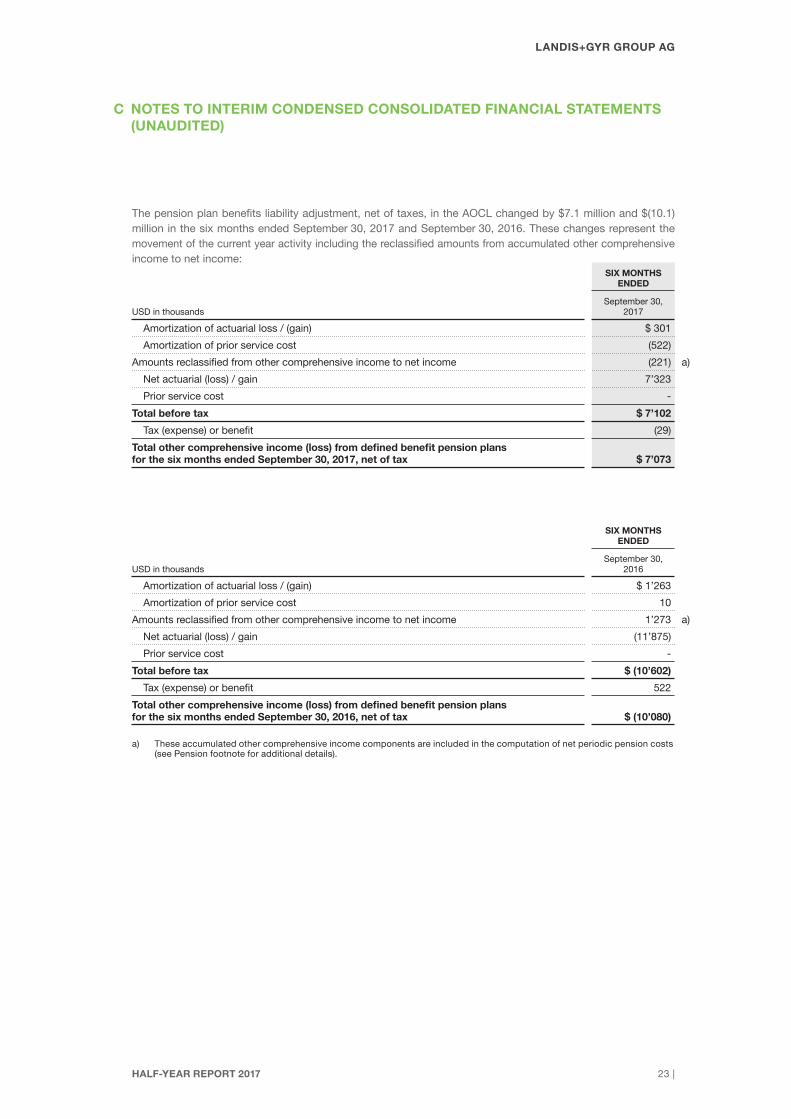
The pension plan benefits liability adjustment, net of taxes, in the AOCL changed by $7.1 million and $(10.1)million in the six months ended September 30, 2017 and September 30, 2016. These changes represent the movement of the current year activity including the reclassified amounts from accumulated other comprehensive income to net income:
SIX MONTHS ENDED
September 30,USD in thousands 2017
Amortization of actuarial loss / (gain) $ 301
Amortization of prior service cost (522)
Amounts reclassified from other comprehensive income to net income (221) a)
Net actuarial (loss) / gain 7’323
Prior service cost -
Total before tax $ 7’102
Tax (expense) or benefit (29)
Total other comprehensive income (loss) from defined benefit pension plans for the six months ended September 30, 2017, net of tax $ 7’073
SIX MONTHS ENDED
September 30,USD in thousands 2016
Amortization of actuarial loss / (gain) $ 1’263
Amortization of prior service cost 10
Amounts reclassified from other comprehensive income to net income 1’273 a)
Net actuarial (loss) / gain (11’875)
Prior service cost -
Total before tax $ (10’602)
Tax (expense) or benefit 522
Total other comprehensive income (loss) from defined benefit pension plans for the six months ended September 30, 2016, net of tax $ (10’080)
a) These accumulated other comprehensive income components are included in the computation of net periodic pension costs (see Pension footnote for additional details).
C NOTES TO INTERIM CONDENSED CONSOLIDATED FINANCIAL STATEMENTS (UNAUDITED)

HALF-YEAR REPORT 2017 | 24
LANDIS+GYR GROUP AG
NOTE 3: DEBT PAYABLEOn June 1, 2017, the Company entered into a facility agreement with a lender in the amount of $215 million to replace the shareholder loan. On June 8, 2017, the Company received the funds from the lender and repaid the shareholder loan without any pre-payment penalties. The new loan has a stated interest rate equal to the LIBOR rate plus a margin of 0.8% per annum. The principal including accrued interest is payable on May 31, 2018. The facility agreement also contains a financial covenant requiring that the Company’s net debt divided by EBITDA be less than 2.00x and its EBITDA be greater than zero, on a quarterly rolling basis in respect of the most recent four financial quarters. Further, the Company is required to make a mandatory prepayment towards the facility in the amount of (1) 100% of the net proceeds from any capital market transactions (debt and equity transac-tions) of a Group Company (as defined by the facility agreement) within 45 days after proceeds are received by the Group Company and (2) the entire outstanding balance on the last day of the month of a change in control (as defined by the facility agreement) transaction.
NOTE 4: PENSION AND POST RETIREMENT BENEFIT PLANS Net periodic pension benefit costs for the Company’s defined benefit plans include the following components (in thousands):
SIX MONTHS ENDED
USD in thousandsSeptember 30,
2017September 30,
2016
Service cost $ 3’636 $ 3’691
Interest cost 1’623 1’506
Termination benefits - 29
Expected return on plan assets (3’676) (3’336)
Amortization of prior service costs (benefit) (522) 10
Amortization of actuarial loss (gain) 301 1’263
Settlements and curtailments - (16)
Net periodic benefit cost $ 1’362 $ 3’147
Employer contributions for the six month ended September 30, 2017 and 2016 were $3.3 million and $3.8 million, respectively.
NOTE 5: INCOME TAXES Our tax provision as a percentage of income before tax typically differs from the statutory rate of 7.83%, and may vary from period to period, due to fluctuations in the forecast mix of earnings in domestic and interna-tional jurisdictions, new or revised tax legislation and accounting pronouncements, tax credits, state income taxes, adjustments to valuation allowances, and uncertain tax positions, among other items.
Income taxes for the six month period ended September 30, 2017 were provided at a rate of 589.9%, including $10.6 million benefit from the change in unrecognized tax benefits related to uncertain tax positions whose likelihood was reassessed in connection with the IPO.
Income taxes for the six month period ended September 30, 2016 were provided at a rate of 547.4%, including $7.6 million expense related to uncertain tax positions, changes in valuation allowance and other discrete items.
C NOTES TO INTERIM CONDENSED CONSOLIDATED FINANCIAL STATEMENTS (UNAUDITED)

HALF-YEAR REPORT 2017 25 |
LANDIS+GYR GROUP AG
NOTE 6: COMMITMENTS & CONTINGENCIESCommitments:The Company is obligated under capital leases covering certain machinery and equipment that will expire at various dates during the next three years. The gross amount of property, plant and equipment and related accumulated amortization recorded under capital leases were as follows (in thousands):
SIX MONTHS ENDED
September 30, March 31,USD in thousands 2017 2017
Machinery and equipment $ 5’110 $ 4’812
Less: accumulated amortization 4’191 3’930
$ 919 $ 882
Amortization of assets held under capital leases is included within depreciation expenses.
The Company is also party to several noncancelable operating leases, primarily for office space and company vehicles, that expire over the next five years. These leases generally contain renewal options for periods ranging from one to five years and require the Company to pay all common area maintenance costs such as mainte-nance and insurance.
Minimum rent payments under operating leases are recognized on a straight-line basis over the term of the lease including any periods of free rent. Rental expense for operating leases for the six months ended September 30, 2017 and September 30, 2016 was $12.0 million and $11.3 million, respectively.
Guarantees From time to time, the Company issues performance guarantees whereby it guarantees its performance under the specific terms of contracts with suppliers, customers, and financial institutions. These guarantees are typically comprised of performance bonds and bank guarantees. These guarantees could become payable in the event that the Company were to default under the related contracts. The Company had total outstanding performance bonds and bank guarantees of $111.0 million as of September 30, 2017.
The Company, from time to time, guarantees the obligations of its wholly owned subsidiaries, including obliga-tions under certain contracts with customers. At September 30, 2017, the Company had a maximum potential amount payable of $1’077 million under such financial guarantees outstanding. The guarantees outstanding have various maturity dates.
Legal proceedingsThe Company is subject to various legal proceedings and claims of which the outcomes are subject to signifi-cant uncertainty. Our policy is to assess the likelihood of any adverse judgments or outcomes related to legal matters, as well as ranges of probable losses. A determination of the amount of the liability required, if any, for these contingencies is made after an analysis of each known issue. A liability is recognized and charged to operating expense when the Company determines that a loss is probable and the amount can be reasonably estimated.
In August 2015, Energisa SA and a number of other plaintiffs filed two related lawsuits in Brazil, alleging that our electric meters were excessively vulnerable to fraud. The initial petitions requested Landis+Gyr to provide new firmware to the plaintiffs and to reimburse their cost of installation in meters supplied with this firmware. L+G has filed a petition with technical inquiries (“Levantamento de quesitos”) for a technical expert in metering to evaluate the L+G meters’ performance in relation to the functional requirement of the project. There is a juris-dictional conflict to be defined at the Federal Superior Court.
C NOTES TO INTERIM CONDENSED CONSOLIDATED FINANCIAL STATEMENTS (UNAUDITED)

HALF-YEAR REPORT 2017 | 26
LANDIS+GYR GROUP AG
C NOTES TO INTERIM CONDENSED CONSOLIDATED FINANCIAL STATEMENTS (UNAUDITED)
IndemnificationWe generally provide an indemnification related to the infringement of any patent, copyright, trademark, or other intellectual property right on software or equipment within our customer contracts. This indemnification typically covers damages and related costs, including attorney’s fees with respect to an indemnified claim, provided that (a) the customer promptly notifies us in writing of the claim and (b) we control the defense and all related settlement negotiations. We may also provide an indemnification to our customers for third party claims resulting from damages caused by the negligence or willful misconduct of our employees/agents under certain contracts. These indemnification obligations typically do not have liability caps. It is not possible to predict the maximum potential amount of future payments under these or similar agreements.
WarrantyA summary of the warranty accrual account activity is as follows (in thousands):
USD in thousands 2017 2016
Beginning balance, April 1, $ 51’734 $ 91’643
New product warranties 42’981 16’864
Other changes / adjustments to warranties (6’118) (9’381)
Claims activity (10’408) (11’671)
Effect of changes in exchange rates 1’717 (1’803)
Ending balance, September 30, 79’906 85’652
Less: current portion of warranty (43’991) (27’467)
Long-term warranty $ 35’915 $ 58’185
New product warranties for the six month periods ended September 30, 2017 and 2016 include warranty accruals of $40.9 million and $11.7 million, respectively, due to legacy component issues in the Americas segment which are unrelated to the X2 capacitor issue. For further details, refer to the warranty provision paragraph in the “Supplemental reconciliation and definitions” section.

HALF-YEAR REPORT 2017 27 |
LANDIS+GYR GROUP AG
NOTE 7: RESTRUCTURING CHARGES The Company continually reviews its business, manages costs and aligns resources with market demand. As a result, the Company has taken several actions to reduce fixed costs, eliminate redundancies, strengthen operational focus, and better position itself to respond to market pressures or unfavorable economic conditions.
During the six months ended September 30, 2017, the Company continued its cost reduction effort within the EMEA geographical area, aimed at reducing costs and improving operating performance in a number of European countries. In connection with these restructuring plans, the Company recognized costs related to termination benefits for employee positions that were eliminated. The restructuring charges, net, of approxi-mately $8.1 million for the six months ended September 30, 2017 consist of severance related costs. Some of the severance payments were completed during the six months ended September 30, 2017 and the remaining payments are expected to be completed during the fiscal year ending March 31, 2018.
A summary of the Company’s restructuring activity, including costs incurred during the six months ended September 30, 2017 and September 30, 2016 is as follows (in thousands):
USD in thousands 2017 2016
Balance as of April, 1 $ 2’460 $ 2’478
Restructuring charges, net 8’149 1’198
Cash payments (4’471) (2’069)
Effect of changes in exchanges rates 215 (49)
Balance as of September 30, $ 6’353 $ 1’558
The outstanding balance at September 30, 2017 and September 30, 2016, respectively, is included under accrued liabilities in the interim consolidated balance sheets. Substantially all of the remaining accrued restruc-turing balance is expected to be paid out by the end of the fiscal year ending March 31, 2018.
Restructuring activity charges have been recognized in the following statement of operations line items (in thousands):
SIX MONTHS ENDED
September 30, September 30,USD in thousands 2017 2016
Cost of revenue $ 1’981 $ 305
Research and development 690 138
Sales and marketing 644 50
General and administrative 4’834 705
Total $ 8’149 $ 1’198
C NOTES TO INTERIM CONDENSED CONSOLIDATED FINANCIAL STATEMENTS (UNAUDITED)

HALF-YEAR REPORT 2017 | 28
LANDIS+GYR GROUP AG
The following table outlines the cumulative and the current costs incurred to date under the program per operating segment (in thousands):
CUMULATIVE COSTS
INCURRED UP TO
TOTAL COSTS INCURRED IN
THE SIX MONTHS ENDED
September 30, September 30,USD in thousands 2017 2017
Americas $ 5’971 $ (62)
EMEA 22’125 7’682
Asia Pacific 9’775 -
Corporate 1’788 529
Restructuring Charges $ 39’659 $ 8’149
The cumulative costs incurred up to September 30, 2017 represent the Company’s ongoing restructuring efforts under various programs from FY 2011 to FY 2016. The expected future costs for the restructuring programs are $11.3 million spread over the next four years and are limited to EMEA.
NOTE 8: RELATED PARTY TRANSACTIONShareholder loan Upon the acquisition of Landis+Gyr AG, the Company received a loan from Toshiba Corporation in the amount of $600.1 million. The loan was fully repaid on June 8, 2017 with the proceeds obtained from the third party lender facility (refer to Note 3: Debt payable). The outstanding balance as of March 31, 2017 was $ 215.0 million.
NOTE 9: SEGMENT INFORMATIONIn the fourth quarter of 2016 fiscal year, there was an organizational shift in the business as result of the planned IPO. Accordingly, the Company realigned its operations into the following operating segments: Americas, EMEA (Europe Middle East and Africa) and Asia Pacific, which are also our reportable segments. Prior to the realign-ment, the Company operated and managed its business as one distinct operating segment. A description of each reportable segment is as follows:
• Americas – The Americas generates the majority of its revenue in the United States, with most of the residual balance produced in South America, Canada and Japan.
• EMEA – The EMEA segment produces the majority of its revenue in Europe with most of the residual balance generated in South Africa.
• Asia Pacific – The Asia Pacific segment, which excludes Japan, generates the majority of its revenue in Australia, China, India and Hong Kong.
The Chief Operating Decision Maker (CODM) is the Company’s Chief Executive Officer. The CODM allocates resources to and assesses the performance of each operating segment using the information outlined in the table below. Decisions by the chief operating decision maker on how to allocate resources and assess perfor-mance are based on a reported measure of segment profitability.
We have two primary measures for evaluating segment performance: revenue to third parties (excluding any inter-company sales) and adjusted earnings before interest, taxes, depreciation and amortization (Adjusted EBITDA). We define Adjusted EBITDA as income (loss) before income tax expense excluding interest income and expense, net, gain (loss) on foreign exchange related to intercompany loans, net, depreciation and amorti-zation, impairment of intangible and long-lived assets, restructuring charges, exceptional warranty related expenses, warranty normalization adjustments and special items.
C NOTES TO INTERIM CONDENSED CONSOLIDATED FINANCIAL STATEMENTS (UNAUDITED)

HALF-YEAR REPORT 2017 29 |
LANDIS+GYR GROUP AG
C NOTES TO INTERIM CONDENSED CONSOLIDATED FINANCIAL STATEMENTS (UNAUDITED)
SIX MONTHS ENDED
September 30, September 30,USD in thousands 2017 2016
Net revenues
Americas $ 477’338 $ 450’353
thereof to external customers 475’196 449’487
thereof to other segments 2’142 867
EMEA 355’998 302’771
thereof to external customers 320’660 274’831
thereof to other segments 35’338 27’940
Asia Pacific 72’192 65’151
thereof to external customers 69’783 63’146
thereof to other segments 2’409 2’005
Elimination (39’889) (30’812)
Total Company $ 865’639 $ 787’464
Adjusted EBITDA
Americas $ 105’936 $ 98’371
EMEA (1’569) (4’350)
Asia Pacific (5’497) (6’514)
Corporate and elimination 9’882 8’764
Total by Segment 108’752 96’271
Restructuring charges1 (8’149) (1’198)
Exceptional warranty related expenses2 (2’419) (1’449)
Warranty normalization adjustments3 (30’339) (4’263)
Special items4 (24’758) (22’234)
Depreciation (23’888) (23’166)
Amortization of intangible assets (24’741) (24’661)
Interest income 368 288
Interest expense (3’761) (5’901)
Income (loss) on foreign exchange related to intercompany loans, net 7’862 (10’778)
Income (loss) before income tax expense $ (1’073) $ 2’909
1 Restructuring charges are summarized in note 7 including the line items in the statements of operations that include the restructuring charges.
2 Exceptional warranty related expense related to the X2 matter. Refer to the warranty provision paragraph in the “Supplemental reconciliation and definitions” section.
3 Warranty normalization adjustments represents warranty expense that diverge from three-year average of actual warranty costs incurred (in cash or the value of other compensation paid out to customers) in respect of warranty and warranty-like claims. For the calculation of the average of actual warranty costs incurred, refer to the warranty provision paragraph in the “Supplemental reconciliation and definitions” section.
4 Special items represent costs incurred, or income earned, related to non-recurring events, certain settlements of litigation and other miscellaneous items. Special items for the six months ended September 30, 2017 included $24.2 million costs incurred in connection with the IPO and $0.6 million other miscellaneous items. Special items for the six months ended September 30, 2016 included the settlement amount (including legal costs) for a patent case of $15.6 million, costs incurred for strategic activities that did not materialize of $6.0 million and $0.6 million other miscellaneous items.

HALF-YEAR REPORT 2017 | 30
LANDIS+GYR GROUP AG
The following table represents the continuing operations’ revenue for the six months ended September 30, 2017 and 2016.
SIX MONTHS ENDED SEPTEMBER 30, 2017
USD in thousands Total Americas EMEA Asia Pacific
Total revenue $ 865’639 $ 475’196 $ 320’660 $ 69’783
thereof United States 428’985 428’985 - -
thereof United Kingdom 98’263 - 98’263 -
thereof Switzerland 29’419 - 29’419 -
thereof Australia 29’294 - - 29’294
SIX MONTHS ENDED SEPTEMBER 30, 2016
USD in thousands Total Americas EMEA Asia Pacific
Total revenue $ 787’464 $ 449’487 $ 274’831 $ 63’146
thereof United States 388’728 388’728 - -
thereof United Kingdom 81’794 - 81’794 -
thereof Switzerland 30’107 - 30’107 -
thereof Australia 33’957 - - 33’957
NOTE 10: SUBSEQUENT EVENTSThe Company evaluated subsequent events and transactions that occurred after the balance sheet date. As at October 25, 2017, which is the date that the interim financial statements were available to be issued, the Company has no subsequent events which either warrant a modification of the value of its assets and liabilities or any additional disclosure.
C NOTES TO INTERIM CONDENSED CONSOLIDATED FINANCIAL STATEMENTS (UNAUDITED)
HALF-YEAR REPORT 2017 31 |
LANDIS+GYR GROUP AG
D Supplemental Reconciliation and DefinitionsSupplemental Reconciliation and Definitions
Supplemental Reconciliation and DefinitionsSupplemental Reconciliation and Definitions

HALF-YEAR REPORT 2017 | 32
LANDIS+GYR GROUP AG
D SUPPLEMENTAL RECONCILIATION AND DEFINITIONS
ADJUSTED EBITDAThe reconciliation of EBITDA to Adjusted EBITDA is as follows for the six months period ended September 30, 2017 and 2016:
L+G Group AG Americas EMEA Asia PacificCorporate and eliminations
(U. S. Dollars in millions, unless otherwise indicated) H1 17 H1 16 H1 17 H1 16 H1 17 H1 16 H1 17 H1 16 H1 17 H1 16
Operating income (5.5) 19.3 36.7 46.2 (15.1) (16.5) (8.2) (8.9) (18.9) (1.5)
Amortization of intangible assets 24.7 24.7 16.6 16.7 3.7 3.6 1.1 0.9 3.3 3.5
Depreciation 23.9 23.1 15.1 15.1 6.8 6.4 1.8 1.6 0.2 -
Impairment of intangible and long-lived assets - - - - - -
EBITDA 43.1 67.1 68.4 78.0 (4.6) (6.5) (5.3) (6.4) (15.4) 2.0
Restructuring charges 8.1 1.2 (0.1) 1.2 7.7 - - - 0.5 -
Exceptional warranty related expenses 2.4 1.4 - - 2.4 1.4 - - - -
Normalized warranty related expenses 30.3 4.3 37.6 3.6 (7.1) 0.8 (0.2) (0.1) 0.0 0.0
Special items 24.8 22.3 - 15.6 - - - - 24.8 6.7
Adjusted EBITDA 108.8 96.3 105.9 98.4 (1.6) (4.3) (5.5) (6.5) 10.0 8.7
Adjusted EBITDA margin (%) 12.6% 12.2% 22.3% 21.9% (0.5%) (1.6%) (7.9%) (10.3%)
ADJUSTED GROSS PROFITThe reconciliation of Gross Profit to Adjusted Gross Profit is as follows for the six months period ended Septem-ber 30, 2017 and 2016:
L+G Group AG Americas EMEA Asia PacificCorporate and eliminations
(U. S. Dollars in millions, unless otherwise indicated) H1 17 H1 16 H1 17 H1 16 H1 17 H1 16 H1 17 H1 16 H1 17 H1 16
Gross Profit 242.7 268.4 154.9 180.9 73.1 75.5 13.5 12.2 1.2 (0.2)
Amortization of intangible assets 7.1 7.1 2.8 2.9 3.5 3.5 0.8 0.7 - -
Depreciation 19.9 19.4 13.2 13.2 5.8 5.3 0.9 0.8 - 0.1
Restructuring charges 2.0 0.3 - 0.3 2.0 - - - - -
Exceptional warranty related expenses 2.4 (2.1) - - 2.4 (2.1) - - - -
Normalized warranty related expenses 30.3 4.3 37.6 3.6 (7.0) 0.8 (0.2) (0.1) (0.1) 0.0
Special items - - - - - - - - - -
Adjusted Gross Profit 304.4 297.4 208.5 200.9 79.8 83.0 15.0 13.6 1.1 (0.1)
Adjusted Gross Profit margin (%) 35.2% 37.8% 43.9% 44.7% 24.9% 30.2% 21.5% 21.6%
HALF-YEAR REPORT 2017 33 |
LANDIS+GYR GROUP AG
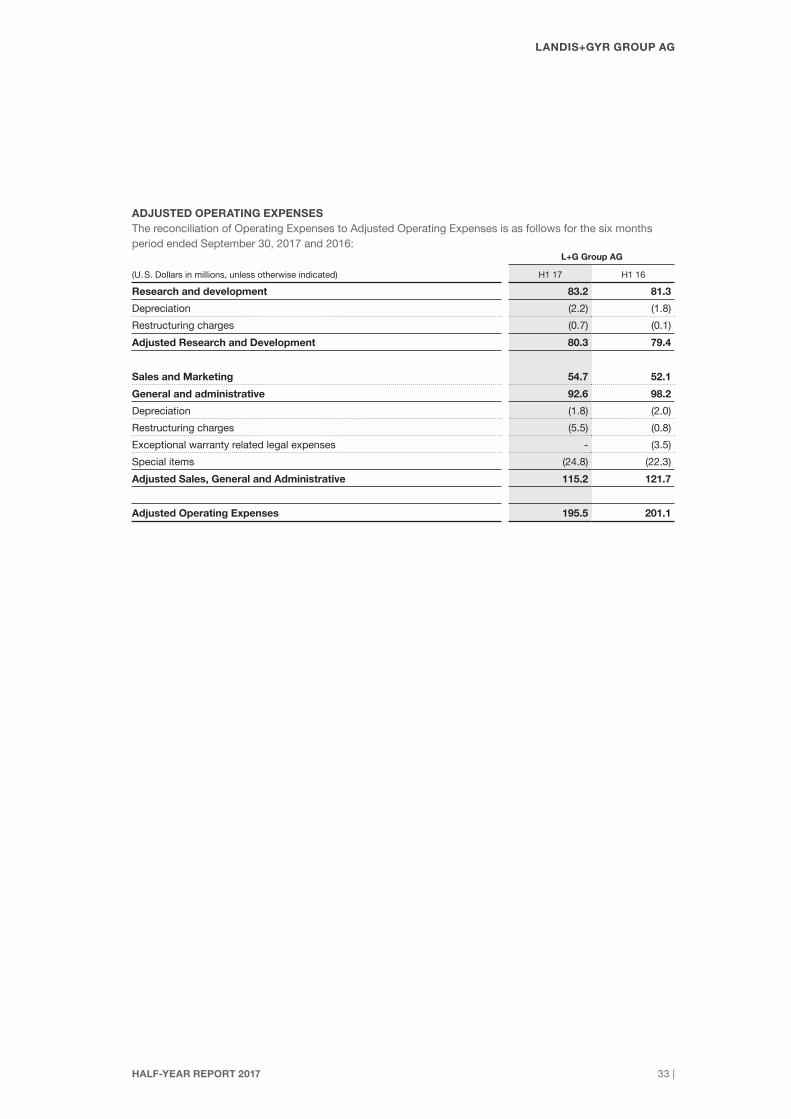
ADJUSTED OPERATING EXPENSESThe reconciliation of Operating Expenses to Adjusted Operating Expenses is as follows for the six months period ended September 30, 2017 and 2016:
L+G Group AG
(U. S. Dollars in millions, unless otherwise indicated) H1 17 H1 16
Research and development 83.2 81.3
Depreciation (2.2) (1.8)
Restructuring charges (0.7) (0.1)
Adjusted Research and Development 80.3 79.4
Sales and Marketing 54.7 52.1
General and administrative 92.6 98.2
Depreciation (1.8) (2.0)
Restructuring charges (5.5) (0.8)
Exceptional warranty related legal expenses - (3.5)
Special items (24.8) (22.3)
Adjusted Sales, General and Administrative 115.2 121.7
Adjusted Operating Expenses 195.5 201.1
HALF-YEAR REPORT 2017 | 34
LANDIS+GYR GROUP AG
WARRANTY PROVISIONWe offer standard warranties on our metering products and our solutions for periods ranging from one to five years. In some instances, warranty periods can be further extended based on customer specific negotiations. Under limited circumstances, we may also settle certain quality-related issues experienced by our customers even if not strictly required to do so by the terms of a warranty (referred to as “warranty-like” items). Our warranty accruals represent our estimate of the cost of projected warranty and warranty-like claims and are based on historical and projected warranty trends, specific quality issues identified (if any), supplier information and other business and economic projections as well as other commercial considerations. Our results in any given period are affected by additions to as well as by releases of, or other adjustments to, these accruals.
For the six-month period ended September 30, 2017 and 2016 our statements of operations include net chang-es to the warranty and warranty-like accruals, which we record in cost of goods sold, of USD 36.9 million and USD 7.5 million, respectively, comprising additions to and releases of, or other adjustments to, accruals in respect of such claims. Our results were historically significantly impacted by warranty claims relating to the X2 capacitors (the “X2 matter”), which resulted in net changes to the accruals for warranty and warranty-like claims of USD 0.2 million, and USD (2.1) million, respectively, for the six-month period ended September 30, 2017 and 2016. In addition, we incurred legal expenses related to the X2 matter in the amount of USD nil and USD 3.5 million in the six-month period ended September 30, 2017 and 2016, respectively.
Management considers the X2 matter to be an exceptional warranty case because of the uniqueness of the matter and because it was part of an industry wide component failure that impacted not only our products, but also those of our competitors and the electronics industry generally. Excluding X2-related accruals, our net changes to accruals for warranty and warranty-like claims for the six-month period ended September 30, 2017 and 2016 would have been USD 36.7 million and USD 9.6 million, respectively. The first half of 2017 net changes to warranty accruals were impacted by additional accruals of $40.9 million related to legacy component issues in the Americas.
In assessing the underlying operational performance of the business over time, Management believes it is useful to consider average actual warranty costs incurred (in cash or the value of other compensation paid out to customers) in respect of warranty and warranty-like claims as an alternative to warranty accruals, which are estimates and subject to change and significant period-to-period volatility. For the purposes of determining warranty normalization adjustments, the average actual warranty costs incurred (in cash or the value of other compensation paid out to customers) in respect of warranty and warranty-like claims is calculated on the basis of a three-year rolling average for the six-month period ended September 30, 2017. For the six-month period ended September 30, 2016, we have used half of the three-year average actual warranty costs incurred (in cash or the value of other compensation paid out to customers) of USD 10.6 million that was fully disclosed in the offering memorandum.
Management presents Adjusted EBITDA in this Half-Year Report 2017 as an alternative performance measure (both at the Group and at the segment level). With regards to warranty and warranty-like claims, Adjusted EBITDA excludes the accruals associated with the X2 claim (as well as the associated legal expenses) and, with respect to other warranty and warranty-like claims, includes only the average actual warranty costs incurred (in cash or the value of other compensation paid out to customers) in respect of such claims, which amounted to USD 6.4 million and USD 5.3 million for the six-month period ended September 30, 2017 and 2016. For the six-month period ended September 30, 2017 and 2016, the warranty normalization adjustments made in calcu-lating Adjusted EBITDA amounted to USD 30.3 million and USD 4.3 million, respectively.
HALF-YEAR REPORT 2017 35 |
LANDIS+GYR GROUP AG
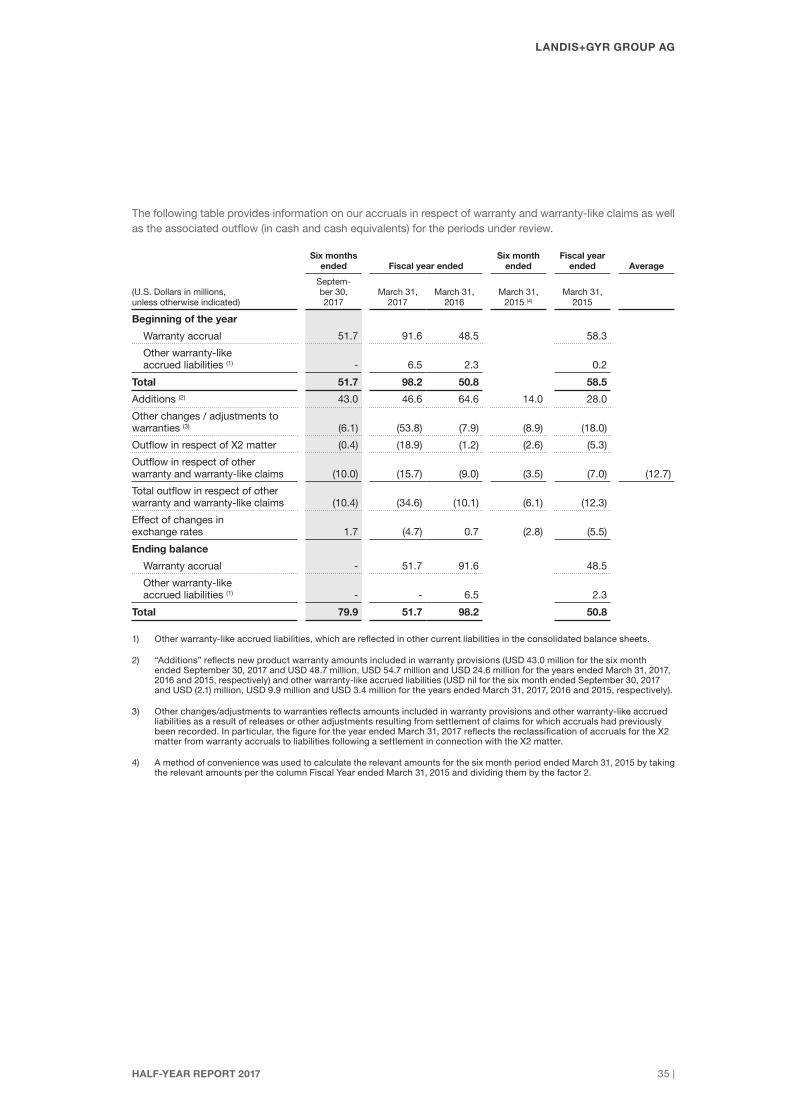
The following table provides information on our accruals in respect of warranty and warranty-like claims as well as the associated outflow (in cash and cash equivalents) for the periods under review.
Six months ended Fiscal year ended
Six month ended
Fiscal year ended Average
(U.S. Dollars in millions, unless otherwise indicated)
Septem-ber 30, 2017
March 31, 2017
March 31, 2016
March 31, 2015 (4)
March 31, 2015
Beginning of the year
Warranty accrual 51.7 91.6 48.5 58.3
Other warranty-like accrued liabilities (1) - 6.5 2.3 0.2
Total 51.7 98.2 50.8 58.5
Additions (2) 43.0 46.6 64.6 14.0 28.0
Other changes / adjustments to warranties (3) (6.1) (53.8) (7.9) (8.9) (18.0)
Outflow in respect of X2 matter (0.4) (18.9) (1.2) (2.6) (5.3)
Outflow in respect of other warranty and warranty-like claims (10.0) (15.7) (9.0) (3.5) (7.0) (12.7)
Total outflow in respect of other warranty and warranty-like claims (10.4) (34.6) (10.1) (6.1) (12.3)
Effect of changes in exchange rates 1.7 (4.7) 0.7 (2.8) (5.5)
Ending balance
Warranty accrual - 51.7 91.6 48.5
Other warranty-like accrued liabilities (1) - - 6.5 2.3
Total 79.9 51.7 98.2 50.8
1) Other warranty-like accrued liabilities, which are reflected in other current liabilities in the consolidated balance sheets.
2) “Additions” reflects new product warranty amounts included in warranty provisions (USD 43.0 million for the six month ended September 30, 2017 and USD 48.7 million, USD 54.7 million and USD 24.6 million for the years ended March 31, 2017, 2016 and 2015, respectively) and other warranty-like accrued liabilities (USD nil for the six month ended September 30, 2017 and USD (2.1) million, USD 9.9 million and USD 3.4 million for the years ended March 31, 2017, 2016 and 2015, respectively).
3) Other changes/adjustments to warranties reflects amounts included in warranty provisions and other warranty-like accrued liabilities as a result of releases or other adjustments resulting from settlement of claims for which accruals had previously been recorded. In particular, the figure for the year ended March 31, 2017 reflects the reclassification of accruals for the X2 matter from warranty accruals to liabilities following a settlement in connection with the X2 matter.
4) A method of convenience was used to calculate the relevant amounts for the six month period ended March 31, 2015 by taking the relevant amounts per the column Fiscal Year ended March 31, 2015 and dividing them by the factor 2.

HALF-YEAR REPORT 2017 | 36
LANDIS+GYR GROUP AG
Six month period ended
(U.S. Dollars in millions, unless otherwise indicated)September 30,
2017September 30,
2016
Additions
Additions (including X2) (1) 43.0 16.9
X2 Additions (0.2) -
Additions (excluding X2) 42.8 16.9
Other changes / adjustments to warranties
Releases (including X2) (6.1) (9.4)
X2 Reclassification - -
X2 Releases - 2.1
Releases (excluding X2) (6.1) (7.3)
Net changes to warranty and warranty-like accruals (including X2) 36.9 7.5
Net changes to warranty and warranty-like accruals relating to X2 (0.2) 2.1
Net changes to warranty and warranty-like accruals (excluding X2) 36.7 9.6
Three year average actual warranty costs incurred (in cash or the value of oth-er compensation paid out to customers) in respect of warranty claims (excluding X2) 6.4 5.3
Warranty normalization adjustments 30.3 4.3
1) “Additions” reflects new product warranty amounts included in warranty provisions (USD 43.0 million and USD 16.9 million for the periods ended September 30, 2017 and 2016, respectively).
MAIN EXCHANGE RATES APPLIEDThe following exchange rates against the USD have been applied for the most important currencies concerned:
Income statement Exchange rate
average exchange rate, 6 months on balance-sheet date
Exchange rates 2017 2016 30.09.2017 31.03.2017
Euro countries – EUR 1.1381 1.1227 1.1814 1.0652
United Kingdom – GBP 1.2943 1.3714 1.3394 1.2554
Switzerland – CHF 1.0275 1.0276 1.0327 0.9965
Brazil – BRL 0.3131 0.2964 0.3162 0.3202
Australia – AUD 0.7702 0.7516 0.7833 0.7628

HALF-YEAR REPORT 2017 37 |
LANDIS+GYR GROUP AG
E Dates and ContactsDates and Contacts
Dates and Contacts
HALF-YEAR REPORT 2017 | 38
LANDIS+GYR GROUP AG
Important Dates– Release Annual Results: June 5, 2018– Ordinary General Assembly: June 28, 2018, Lorzensaal, Cham, Switzerland
Contact AddressesGroup Communications and Investor Relations Investor [email protected] Michael Düringer c/o IRF Communications AG +41 43 244 8142 Michael [email protected]
Landis+Gyr Group AGTheilerstrasse 1CH-6301 Zug+41 41 935 [email protected]/investors
Declaration of forward-looking statements:This Half Year Report includes forward-looking information and statements, including statements concerning the outlook for our businesses. These statements are based on current expectations, estimates and projections about the factors that may affect our future performance, including global economic conditions, and the eco-nomic conditions of the regions and industries that are major markets for Landis+Gyr Group AG. These expec-tations, estimates and projections are generally identifiable by statements containing words such as “expects,” “believes,” “estimates,” “targets,” “plans,” “outlook” or similar expressions.
There are numerous risks and uncertainties, many of which are beyond our control that could cause our actual results to differ materially from the forward-looking information and statements made in this Half Year Report and which could affect our ability to achieve any or all of our stated targets. Forward-looking statements involve inherent known and unknown risks, uncertainties and contingencies because they relate to events and depend on circumstances that may or may not occur in the future and may cause the actual results, performance or achievements of Landis+Gyr Group AG to be materially different from those expressed or implied by such forward-looking statements. The important factors that could cause such differences include, among others:
• business risks associated with the volatile global economic environment and political conditions• costs associated with compliance activities• market acceptance of new products and services• changes in governmental regulations and currency exchange rates,• estimates of future warranty claims and expenses and sufficiency of accruals; and• such other factors as may be discussed from time to time in Landis+Gyr Group AG filings with the SIX
Swiss Exchange.
Although Landis+Gyr Group AG believes that its expectations reflected in any such forward-looking statementsare based upon reasonable assumptions, it can give no assurance that those expectations will be achieved. As a result, investors are cautioned not to place undue reliance on such forward-looking statements.
This Half Year Report contains non-GAAP measures of performance. Definitions of these measures and recon-ciliations between these measures and their US GAAP counterparts can be found in the “Supplemental recon-ciliations and definitions” section of this Half Year Report.
Except as otherwise required by law, Landis+Gyr Group AG disclaims any intention or obligation to update any forward-looking statements as a result of developments occurring after the date of this report.
E DATES AND CONTACTS


Contact AddressesGroup Communications and Investor Relations Investor [email protected] Michael Düringer c/o IRF Communications AG +41 43 244 8142 Michael [email protected]
Landis+Gyr Group AGTheilerstrasse 1CH-6301 Zug+41 41 935 [email protected]/investors