capital markets day - landis+gyr
TRANSCRIPT

1 | © Landis+Gyr | January 27, 2020 | Capital Markets Day
Zurich, January 27, 2020
Capital Markets Day

2 | © Landis+Gyr | January 27, 2020 | Capital Markets Day
Forward-looking information
Presentations given during the Landis+Gyr 2020 Capital Markets Day include forward-looking information and statements including statements
concerning the outlook for our businesses. These statements are based on current expectations, estimates and projections about the factors that may
affect our future performance, including global economic conditions, and the economic conditions of the regions and industries that are major markets for
Landis+Gyr Group AG. These expectations, estimates and projections are generally identifiable by statements containing words such as “expects,”
“believes,” “estimates,” “targets,” “plans,” “outlook” or similar expressions.
There are numerous risks and uncertainties, many of which are beyond our control, that could cause our actual results to differ materially from the
forward-looking information and statements made in this presentation and which could affect our ability to achieve our stated targets. The important
factors that could cause such differences include, among others: business risks associated with the volatile global economic environment and political
conditions; costs associated with compliance activities; market acceptance of new products and services; changes in governmental regulations and
currency exchange rates; estimates of future warranty claims and expenses and sufficiency of accruals; and such other factors as may be discussed from
time to time in Landis+Gyr Group AG filings with the SIX Swiss Exchange. Although Landis+Gyr Group AG believes that its expectations reflected in any
such forward-looking statement are based upon reasonable assumptions, it can give no assurance that those expectations will be achieved.
Market Data
Presentations given during the Landis+Gyr 2020 Capital Markets Day may contain estimates of market data and information derived therefrom that
cannot be gathered from publications by market research institutions or any other independent sources. Such information is prepared by Landis+Gyr
based on third-party sources and its own experience and internal estimates of market conditions. Although Landis+Gyr believes that its internal market
observations are reliable, there can be no assurance that any of these estimates are accurate or correctly reflect its position in the industry, and such
estimates have not been verified by any independent sources.
∙Alternative Performance Measures
∙Presentations given during the Landis+Gyr 2020 Capital Markets Day may contain information regarding alternative performance measures. Definitions
of these measures and reconciliations between such measures and their US GAAP counterparts may be found on pages 36 to 40 of the Landis+Gyr Half
Year Report 2019 on our website at www.landisgyr.com/investors.
Disclaimer

3 | © Landis+Gyr | January 27, 2020 | Capital Markets Day
Agenda
Start Agenda Item Lead
08:30h Industry Dynamics, Strategy & Performance Richard Mora, CEO
Americas Prasanna Venkatesan, EVP Americas
EMEA Susanne Seitz, EVP EMEA
10:15h Coffee Break
10:45h Asia-Pacific Steve Jeston, Head AP
Finance Jonathan Elmer, CFO
Q&A
12:15h Lunch / Product Demos

4 | © Landis+Gyr | January 27, 2020 | Capital Markets Day
CEO IntroductionRichard Mora, CEO

5 | © Landis+Gyr | January 27, 2020 | Capital Markets Day
Landis+Gyr at a Glance
Swiss HQ with
offices in 30+ countries
worldwide
Frost & Sullivan
Global AMI Company
of the Year 2019 - the
5th consecutive year
More than
USD 1 Billion
of self-funded R&D
since 2011
Largest installed base
300+ million
devices globally
Over 100 million
connected intelligent
devices deployed
More than 15 million
meter points under
managed services
of service to
3’500+ customers
as a trusted partner
to utilities
Group Net Revenues FY 2018
Americas1
USD 986m
56%36%
8%
EMEA
USD 632m
Asia-Pacific
USD 147m
120+
1 incl. Japan

6 | © Landis+Gyr | January 27, 2020 | Capital Markets Day
Landis+Gyr Management Presenting Today
Richard MoraCEO1
21 years with Landis+Gyr
Over 30 years
multinational experience
Prasanna VenkatesanEVP Americas1
13 years with Landis+Gyr
Over 30 years technology
and management
experience
Susanne SeitzEVP EMEA1
1 year with Landis+Gyr
20 years international
B2B experience
Steve JestonHead Asia-Pacific
24 years with Landis+Gyr
Over 35 years experience
in energy management
Jonathan ElmerCFO1
23 years with Landis+Gyr
Over 30 years experience
in financial & general
management
1. Member of Group Executive Management

7 | © Landis+Gyr | January 27, 2020 | Capital Markets Day
Industry Dynamics, Strategy & PerformanceRichard Mora, CEO

8 | © Landis+Gyr | January 27, 2020 | Capital Markets Day
1. Source: Statista
2. Source: IEA (World Energy Outlook 2019).
3. Source: IEA - Renewables 2019
∙>50%of total electricity
generation by 2040 coming
from low-carbon sources2
∙>250%Increase in distributed solar
PV capacity during the
period 2019-24, reaching
530 GW by 20243
75 billionBy 2025, 75 billion IoT
devices are expected to be
connected and sharing
data worldwide1
Industry Dynamics

9 | © Landis+Gyr | January 27, 2020 | Capital Markets Day
Smart meters, as grid edge sensors, are
the foundation of enabling infrastructure
for future energy distribution systems
3D Factors Fueling Energy Grid Transformation
EMBRACE NEW
BUSINESS MODELS
NEW CUSTOMER
EXPERIENCE
REDESIGN
REGULATORY
PARADIGM
DEPLOY ENABLING
INFRASTRUCTURE
Transformation
Decarbonization
Decentralization
Digitalization
10 | © Landis+Gyr | January 27, 2020 | Capital Markets Day
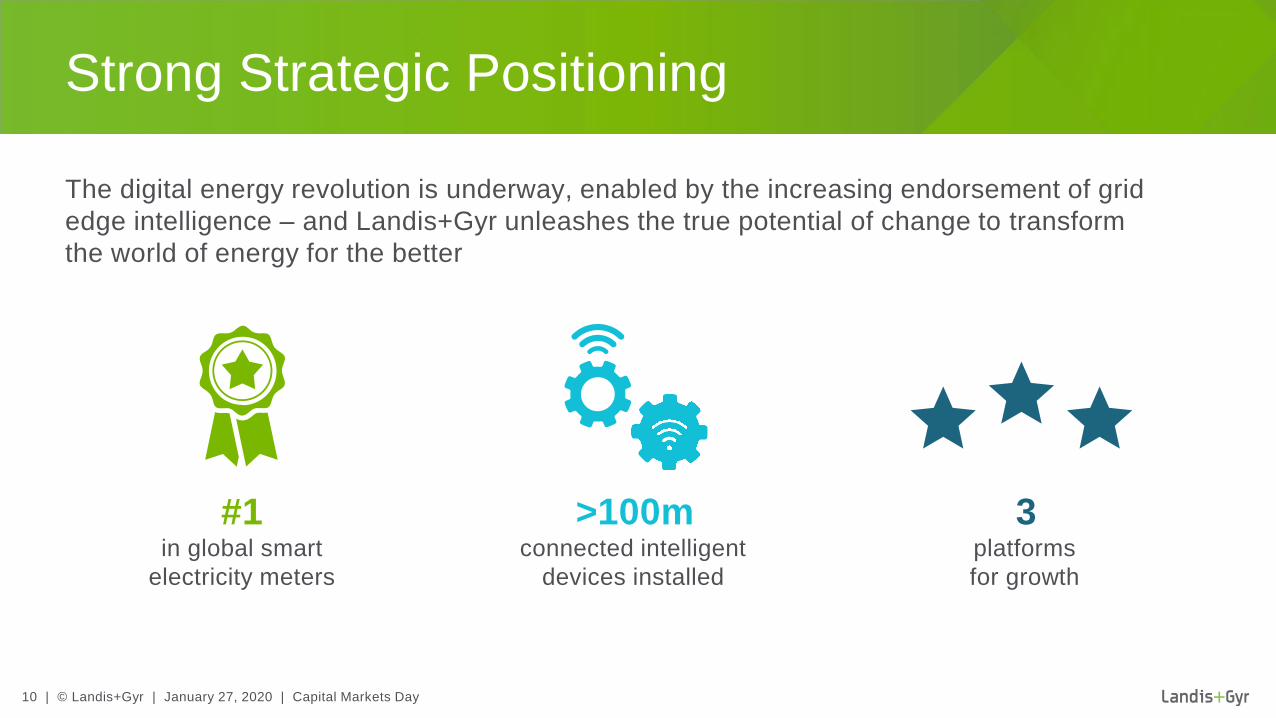
The digital energy revolution is underway, enabled by the increasing endorsement of grid
edge intelligence – and Landis+Gyr unleashes the true potential of change to transform
the world of energy for the better
Strong Strategic Positioning
∙>100mconnected intelligent
devices installed
∙3platforms
for growth
#1in global smart
electricity meters

11 | © Landis+Gyr | January 27, 2020 | Capital Markets Day
Capitalizing on Industry Dynamics with 3 Platforms for Growth
Continued Global Leadership in
SMART METERING
Enabling New Business Models Through
GRID EDGE INTELLIGENCE
Leveraging IoT Expertise for Growth in
SMART INFRASTRUCTURE
1
2
3

12 | © Landis+Gyr | January 27, 2020 | Capital Markets Day
Geographic Diversity of Smart Metering Business Fueling Long-
Term Growth and Transitioning into Grid Edge IntelligenceSmartMetering
1
1. Northeast placed Landis+Gyr as market leader in 2018.
Sources: Berg Insight, Frost & Sullivan, Northeast Group, IHS Markit and company information. All market shares
based on global units ex. China
Grid Edge
Ready
Advanced Metering
Infrastructure (AMI)
Grid Edge
Intelligence
Smart
Metering
∙Global Smart
ELECTRICITY
Meter Market
#1
We are in a growing market, however, the growth can be lumpy
due to the size and timing of some of these projects
∙Global Smart
GAS
Meter Market
#2Global
HEAT
Meter Market
#2∙Global Leader1 AMI
MANAGED SERVICES
Market
#1
Early Stage Mass Deployments Replacement
With strong local presence poised
for capturing emerging smart
metering business…
…with leading role in many of the
largest national AMI rollouts…
…well positioned to capture growth and
transition into grid edge intelligence

13 | © Landis+Gyr | January 27, 2020 | Capital Markets Day
Higher expectations of service delivery, more devices connected to the grid, and a higher awareness of
and commitment to environmental protection
The Digital Energy Revolution is Underway, and Grid Edge Intelligence is a Key EnablerGrid Edge
Intelligence
2
Utility CloudServices
Grid Analytics
Consumer Analytics
DistributionAutomation
Cyber Security
Smart Connectivity
Demand Response
Advanced Load Management
Consumer Insightsand Awareness
Smart Meteringand Sensors
14 | © Landis+Gyr | January 27, 2020 | Capital Markets Day
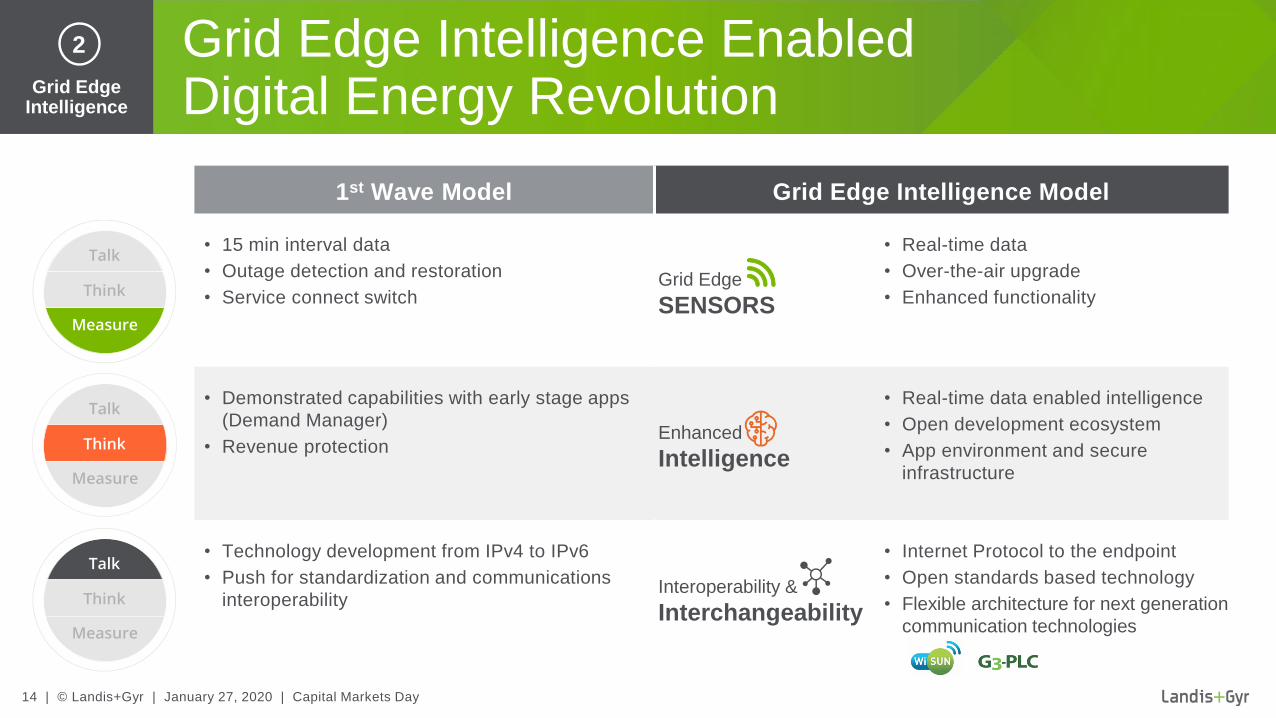
Grid Edge Intelligence Enabled Digital Energy RevolutionGrid Edge
Intelligence
2
1st Wave Model Grid Edge Intelligence Model
• 15 min interval data
• Outage detection and restoration
• Service connect switch
• Real-time data
• Over-the-air upgrade
• Enhanced functionality
• Demonstrated capabilities with early stage apps
(Demand Manager)
• Revenue protection
• Real-time data enabled intelligence
• Open development ecosystem
• App environment and secure
infrastructure
• Technology development from IPv4 to IPv6
• Push for standardization and communications
interoperability
• Internet Protocol to the endpoint
• Open standards based technology
• Flexible architecture for next generation
communication technologies
Grid Edge
SENSORS
Enhanced
Intelligence
Interoperability &
Interchangeability

15 | © Landis+Gyr | January 27, 2020 | Capital Markets Day
Similar to the mobile industry’s approach to applications, Landis+Gyr is
creating a platform that allows us to build an open ecosystem of apps
and developers — these innovative apps will directly benefit the utility
and, in the end, their customers
Gridstream Connect Apps
App OS App Studio App Marketplace
OS
Grid Edge Intelligence
2 ®

16 | © Landis+Gyr | January 27, 2020 | Capital Markets Day
Continue leveraging connectivity platforms to further
integrate sensors and devices for use cases beyond smart
metering and grid edge applications, building smart
infrastructure ecosystem for sustainable energy future
Smart Infrastructure Offers Additional Avenues for Expansion
Smart
Streetlighting
solutions
∙Smart Water
resource usage
solutions
∙EV Load Management and
Charging Optimization
solutions
∙Other IoT
Application
solutions & services
Smart Infrastructure
3
17 | © Landis+Gyr | January 27, 2020 | Capital Markets Day
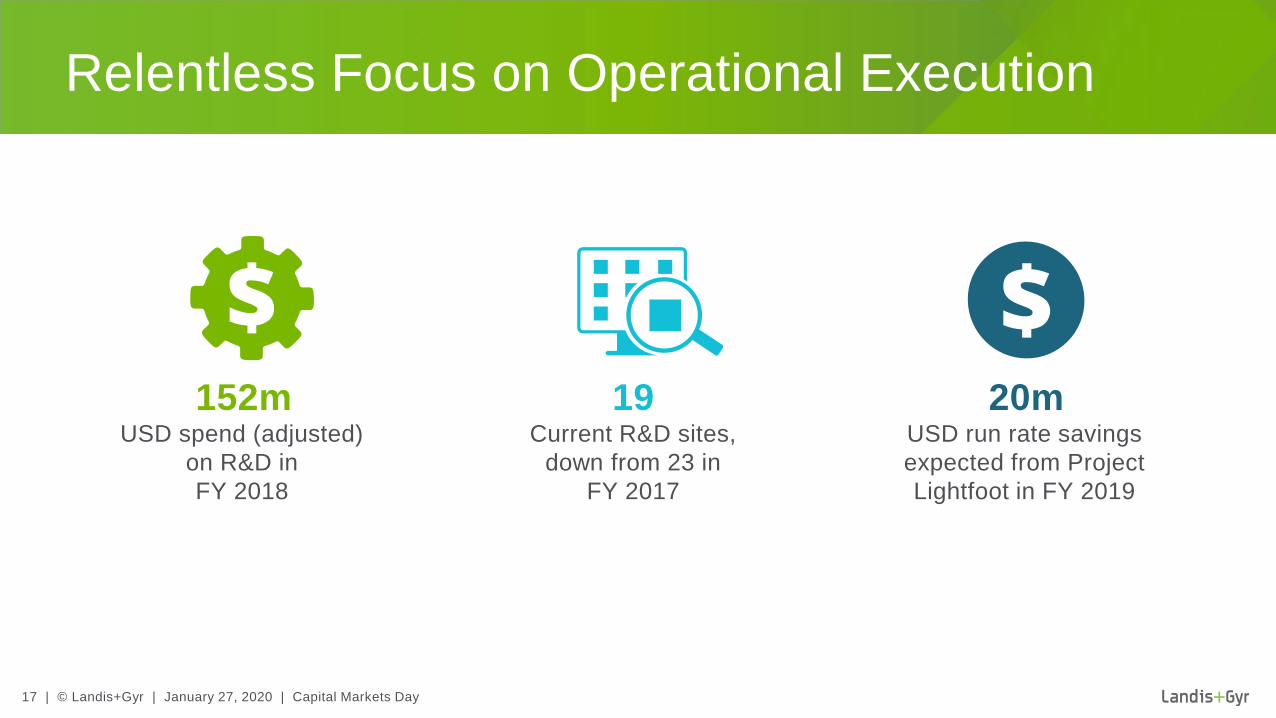
Relentless Focus on Operational Execution
19Current R&D sites,
down from 23 in
FY 2017
∙20mUSD run rate savings
expected from Project
Lightfoot in FY 2019
∙152mUSD spend (adjusted)
on R&D in
FY 2018

18 | © Landis+Gyr | January 27, 2020 | Capital Markets Day
Innovation Pipeline Benefits from Productivity Gains
R&D capacity has been growing at a lower
cost base driven by productivity gains from:
• Investment in Platforms
− Modularization of software and firmware
infrastructure
− Technology reusability has increased, and lead
times have been reduced
• R&D Site Consolidation
− Current R&D footprint spans across 19 sites,
down from 23 in FY 2017
− Continued progress in building teams in low
cost countries
∙Getting the most out of every dollar spent
Adjusted R&D / sales ratio
159158
152
75
9.6%
9.1%
8.6%
8.7%
FY16 FY17 FY18 FY19 H1
Adjusted R&D (USDm) % sales

19 | © Landis+Gyr | January 27, 2020 | Capital Markets Day
Stockport
Nuremberg
Montlucon
Corinth
Romania
Poland
Johannesburg
Vietnam /
Malaysia
∙Shifting to an asset light supply chain:
• Introduction of a dual source/site using existing EMS sites
• Optimize/ramp-down/close selected manufacturing facilities∙Project Status
• Manufacturing activities in Zug (CH) have
been closed
• Northfields (UK) factory closed with 100%
of UK electricity meter volumes outsourced
• Montlucon (FR) reduced to Linky
production only
• Stockport (UK) factory workforce has been
reduced by almost half and 75% of our UK
gas meter volumes have been outsourced
∙Savings
• USD 20m expected to be delivered in FY
2019, with an additional USD 5m savings
to be delivered in FY 2020
Lightfoot to Deliver Annualized Savings of USD 25m in FY 2020 in EMEA
Major EMS SitesLandis+Gyr Manufacturing Sites
20 | © Landis+Gyr | January 27, 2020 | Capital Markets Day
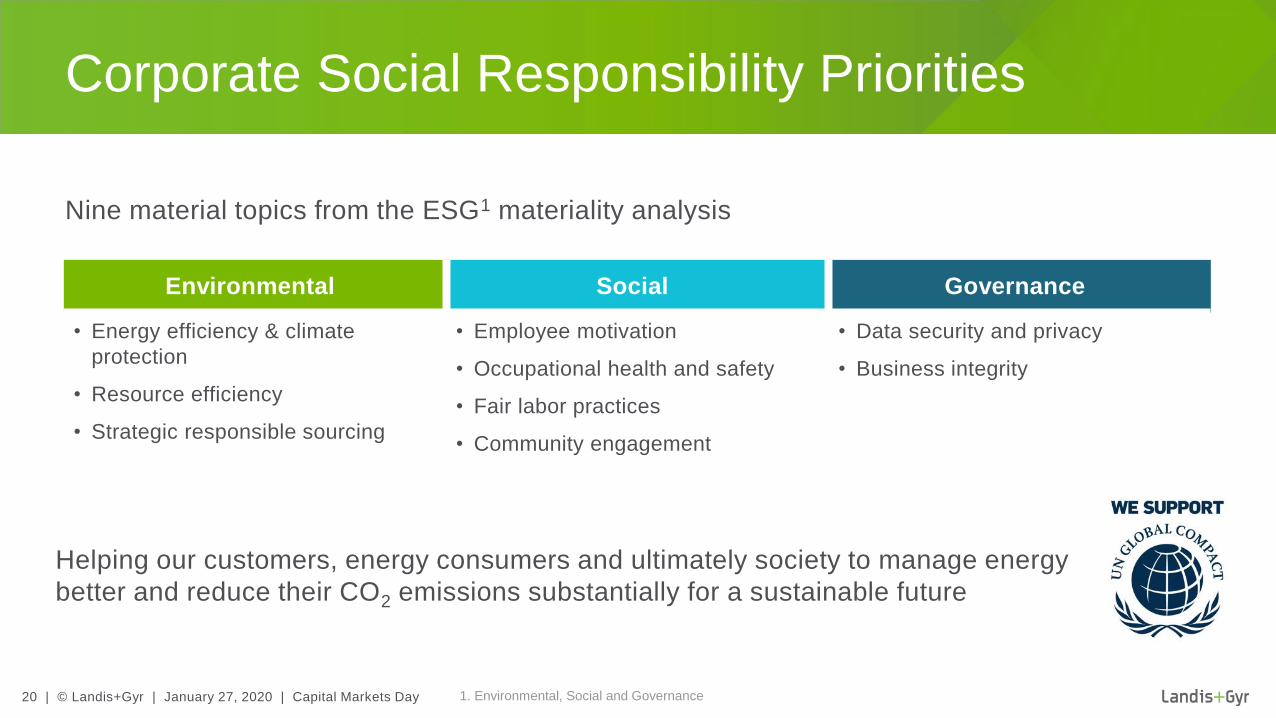
Helping our customers, energy consumers and ultimately society to manage energy
better and reduce their CO2 emissions substantially for a sustainable future
Corporate Social Responsibility Priorities
Environmental Social Governance
• Energy efficiency & climate
protection
• Resource efficiency
• Strategic responsible sourcing
• Employee motivation
• Occupational health and safety
• Fair labor practices
• Community engagement
• Data security and privacy
• Business integrity
Nine material topics from the ESG1 materiality analysis
1. Environmental, Social and Governance

21 | © Landis+Gyr | January 27, 2020 | Capital Markets Day
Landis+Gyr enabled 7 million tons of direct
CO2 emission reduction in 2018 through the
installed Smart Meter base
Equal to 7x the CO2 Emissions of the City of Zurich in 2018

22 | © Landis+Gyr | January 27, 2020 | Capital Markets Day
Number of functions and use cases proven to significantly contribute to overall
reduction of CO2
Environmental Impacts of Smart Metering
Insights
in energy consumption
increase awareness and
help reducing the
consumption
Remote
reads and supply
switch management
significantly
reduce truck rolls
Proactive alarming of
faults and outages leading
to faster service restoration
positively impacting
CO2 emissions
Smart Metering
supported
peak load shifting
leading to enhanced
efficiency
23 | © Landis+Gyr | January 27, 2020 | Capital Markets Day
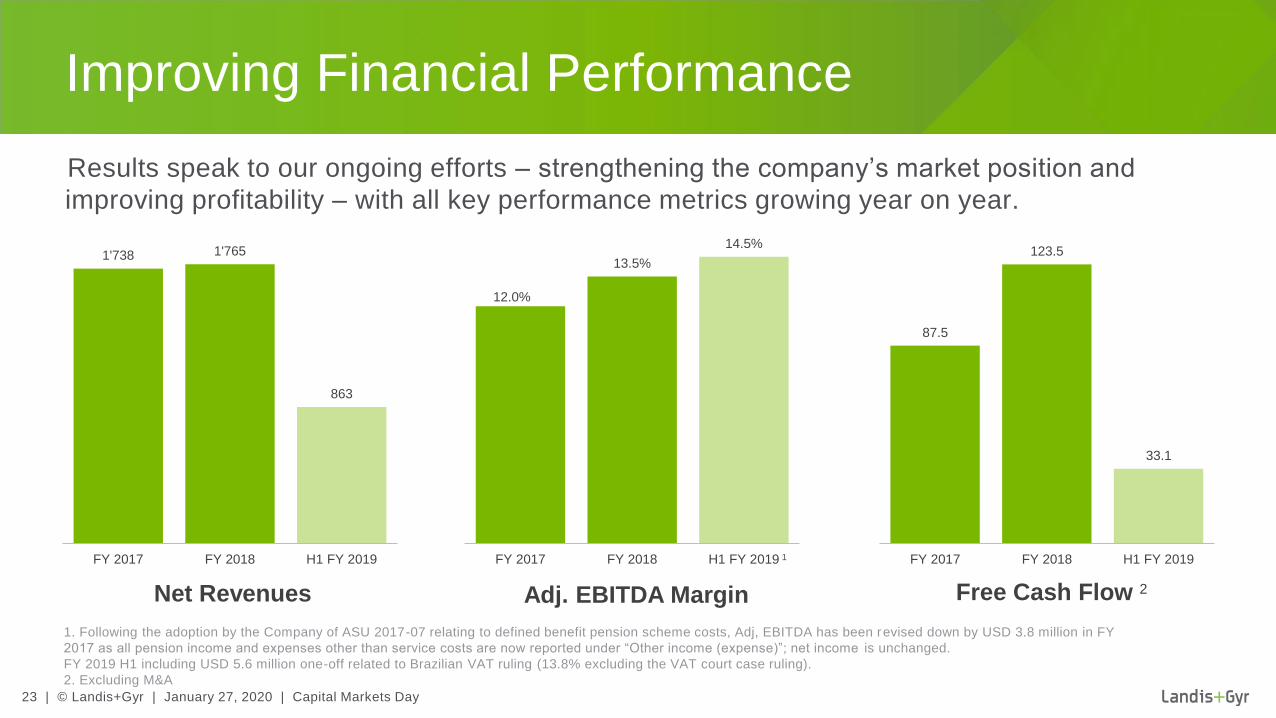
∙Results speak to our ongoing efforts – strengthening the company’s market position and
improving profitability – with all key performance metrics growing year on year.
Improving Financial Performance
1. Includes one-off gain of USD 5.6 million resulting from a Brazilian
VAT court case ruling (13.8% excluding the VAT court case ruling).
2. Excluding M&A
1. Following the adoption by the Company of ASU 2017-07 relating to defined benefit pension scheme costs, Adj, EBITDA has been revised down by USD 3.8 million in FY
2017 as all pension income and expenses other than service costs are now reported under “Other income (expense)”; net income is unchanged.
FY 2019 H1 including USD 5.6 million one-off related to Brazilian VAT ruling (13.8% excluding the VAT court case ruling).
2. Excluding M&A
1'738 1'765
863
FY 2017 FY 2018 H1 FY 2019
Net Revenues
12.0%
13.5%
14.5%
FY 2017 FY 2018 H1 FY 2019
Adj. EBITDA Margin
1
87.5
123.5
33.1
FY 2017 FY 2018 H1 FY 2019
Free Cash Flow 2

24 | © Landis+Gyr | January 27, 2020 | Capital Markets Day
Mid-term (FY 2022) Guidance
Net Revenues
(Relative to FY 2018)
Mid-single digit CAGR in constant currency with growth backend
loaded towards FY 2022 due to regulatory delays in the US
Adjusted EBITDAAdjusted EBITDA margin between 13.5% and 14.5%
of net revenues
Free Cash Flow
(excl. M&A)Above USD 150 million
Capital StructureNet debt expected to remain below
1.5 times Adjusted EBITDA
Mid-term guidance unchanged

25 | © Landis+Gyr | January 27, 2020 | Capital Markets Day
Name, Title
AmericasPrasanna Venkatesan, EVP Americas

26 | © Landis+Gyr | January 27, 2020 | Capital Markets Day
• Continued growth as the leading utility partner,
leveraging Gridstream® Connect, including flexible
communications and application enablement
• Major 2019 wins include:
− Hawaiian Electric Company (HECO)
− Ameren Missouri
− Colorado Springs – showcasing continued leadership in
multi-commodity utilities
• Leading the industry in support of renewables,
improved grid resiliency, and consumer benefits.
Examples include TEP, HECO, WEC, LIPA, and Oncor
• Achievements recognized by the industry:
− Frost & Sullivan Global Company of the Year Award
− Wi-SUN FAN 1.0 certification
Regional Highlights
Americas Highlights
14 operation centers,2 manufacturing
facilities, and a regional
HQ across the region
World’s largest utility
IoT network with
24+ million endpoints deployed
Customer operations center processing meter
reads for >10% of the US
meter population
65+ millionconnected
intelligent devices
Leading advanced metering
partner for utilities
in the Americas
27 | © Landis+Gyr | January 27, 2020 | Capital Markets Day
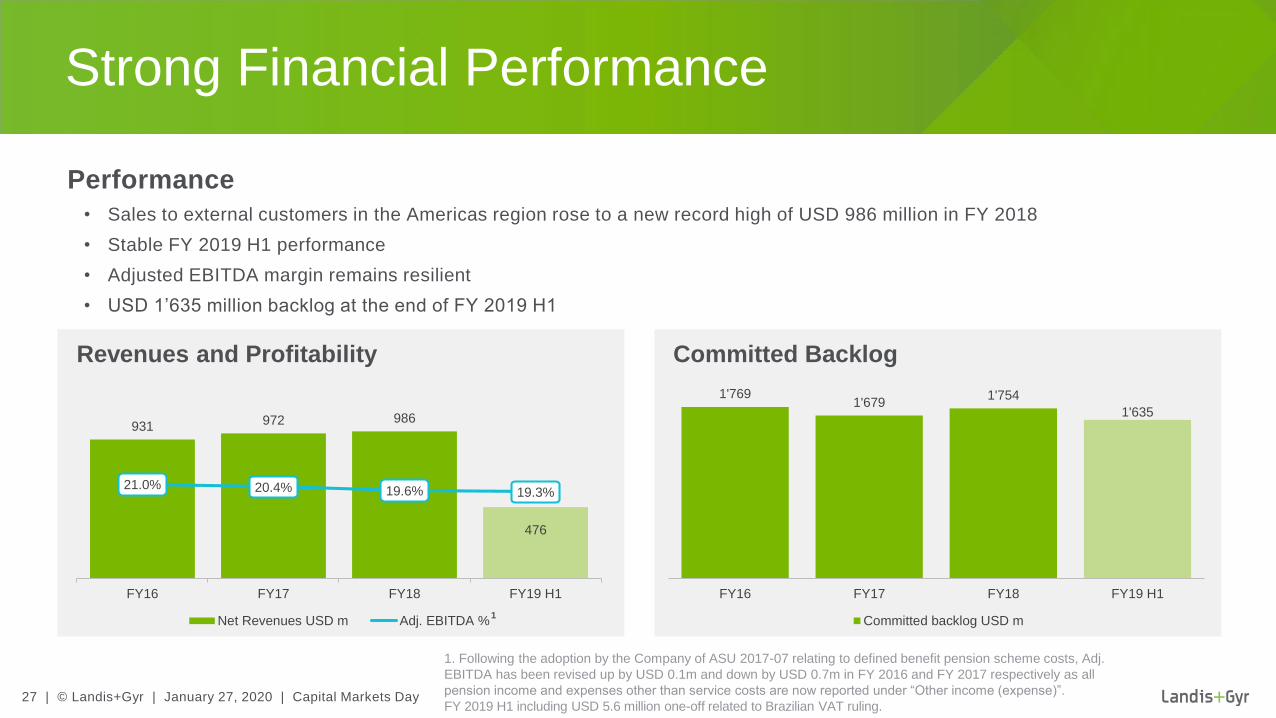
Revenues and Profitability Committed Backlog
∙Performance
• Sales to external customers in the Americas region rose to a new record high of USD 986 million in FY 2018
• Stable FY 2019 H1 performance
• Adjusted EBITDA margin remains resilient
• USD 1’635 million backlog at the end of FY 2019 H1
Strong Financial Performance
931 972 986
476
21.0% 20.4% 19.6% 19.3%
FY16 FY17 FY18 FY19 H1
Net Revenues USD m Adj. EBITDA %
1'7691'679
1'754
1'635
FY16 FY17 FY18 FY19 H1
Committed backlog USD m
1. Following the adoption by the Company of ASU 2017-07 relating to defined benefit pension scheme costs, Adj.
EBITDA has been revised up by USD 0.1m and down by USD 0.7m in FY 2016 and FY 2017 respectively as all
pension income and expenses other than service costs are now reported under “Other income (expense)”.
FY 2019 H1 including USD 5.6 million one-off related to Brazilian VAT ruling.
∙1

28 | © Landis+Gyr | January 27, 2020 | Capital Markets Day
Estimated market segments 1
USD b
NAM Smart Electricity: AMI market driven by current
large-scale deployments and
upcoming refresh cycle
LAM Smart Electricity:Delays experienced in this
market; growth will be driven
by Brazil
Japan Smart Electricity:1st wave AMI rollout near
completion; start of
replacement cycle expected
for 2023
Market Forecast
1. Company estimates, including inputs from IHS Markit (2019) and Frost & Sullivan (2019)
2. Market share based on IHS Markit (2019) and Frost & Sullivan (2019)
Market Evolution
Latin America
Smart electricity
meters market
share, 2018, units 2
26%
#1
#1
North America
Smart electricity
meters market
share, 2018, units 2
35%
Market Position
Landis+Gyr
Japan Smart Electricity Communications
LAM Smart Electricity Meters
NAM Smart Electricity Meters
2018 2022
+2%
CAGR 18-22
+2%
+20%
-9%Σ 1.5
Σ 1.7

29 | © Landis+Gyr | January 27, 2020 | Capital Markets Day
US Electric Utility Market Structure
1. Internal Landis+Gyr analysis and research
Investor-Owned Utility (IOU)1
• Large install base: typically 500k – 3m endpoints
• ~190 utilities in US covering 73% of endpoints
• Driven by return on investment dependent on regulatory framework and quality of service to its “rate payers”
• Regulated by State-appointed Public Utilities Commission
Public Power (PP) 1
Rural Electric Cooperative (REC) Municipality, Gov’t (MUNI)
• Smaller install base: typically 10k - 150k endpoints
• ~875 utilities in US covering 13% of endpoints
• Driven by prudent investment to enable quality
service to its “members”
• Governed by member-based board
• Wide range of install base: typically 5k - 1m+ endpoints
• ~2’000 utilities in US covering 14% of endpoints
• Driven by quality service to its “constituents”
• Federal, State, or City-based governing body

30 | © Landis+Gyr | January 27, 2020 | Capital Markets Day
∙Regulatory trends1,2,3
• Wide agreement AMI and smart
meters are foundational for
achieving desired benefits
• Technology advancement is
creating a tighter link between
AMI, meters, and utility grid
modernization
• Protracted regulatory reviews and
resubmission requirements are
delaying new AMI deployments
• Resubmissions are due to: lack of
benefits for consumers, energy
efficiency, environmental & further
benefits of an AMI system
∙Landis+Gyr actions and implications
• Assist utilities with fact-based information for regulatory submission
• We see headwinds that could lower revenues in FY 2020
• Manage the cost base during the delays
Regulatory Process and Delays
Proposed utility AMI projects by status (Q1 2018 – Q1 2019)4
1. UtilityDive.com (January 6, 2020)
2. The Edison Foundation, IEI (December 2019)
3. Internal Landis+Gyr analysis and research
4. Wood Mackenzie Power & Renewables (2019)
Resubmission required
Pending approval
Approved
5 utilities
4 utilities
7 utilities
∙~ 4.8m endpoints
∙~5m endpoints
∙~4m endpoints

31 | © Landis+Gyr | January 27, 2020 | Capital Markets Day
2.5
4.6 5
11.4
15.3
89
5.26.2 6.4
7.56.8
2007 2008 2009 2010 2011 2012 2013 2014 2015 2016 2017 2018
• Resilient North American
AMI market
• 2nd wave rollout is driven
by age of installed endpoint
and the technology
available at that time
• Early movers starting 2nd
wave rollouts, including
grid edge functionality and
smart infrastructure
• Early AMI adopters have
systems which do not have
the technology to address
current and emerging uses
US Electric Utility Market Status
Meter Contract Status (as of end of 2018)
US AMI Deployment
AMI deployed
AMI under contract
AMI not yet deployed
Source: EIA, Landis+Gyr intelligence
Yearly AMI Meter Deployments
Today, out of the 85m
AMI meters deployed,
over 23m are 10
years old or more
Next 2 years will double
2nd wave potential: until
2022 over 46m are 10
years old or more
85m /
56%
32m /
21%
35m /
23%

32 | © Landis+Gyr | January 27, 2020 | Capital Markets Day
• Utility market dynamics are rapidly
changing, increasing the demands on
AMI solutions to provide expanded
consumer benefits, enablement of
Distributed Energy Resources, and
much greater grid resiliency
• Regulators and other utility stakeholders
are aligning future business and rate
cases to provide new functionality and
are increasing the investment
potential for AMI
• Intelligence at the grid edge will be a
fundamental platform for transforming
the grid and be a critical element of the
2nd wave of smart meters
Evolving Market Demands New Technology
Bill forecasting
Demand management
Consumer portal
Home energy
management
Load disaggregation
Time-of-use , CPP Support
Move-in/
Move-out
Distribution
automation
Outage detection Power quality
Meter to cash
Remote meter reading
Remote disconnect
Revenue protection
1st wave use cases
2nd wave use cases
Direct consumer benefit
Uti
lity
op
era
tio
ns b
en
efi
t
Outage management
+ Grid ResiliencyAsset Analytics
Electric
vehicles
CVR/VVO
Behavioral Conservation
DER
Support
33 | © Landis+Gyr | January 27, 2020 | Capital Markets Day
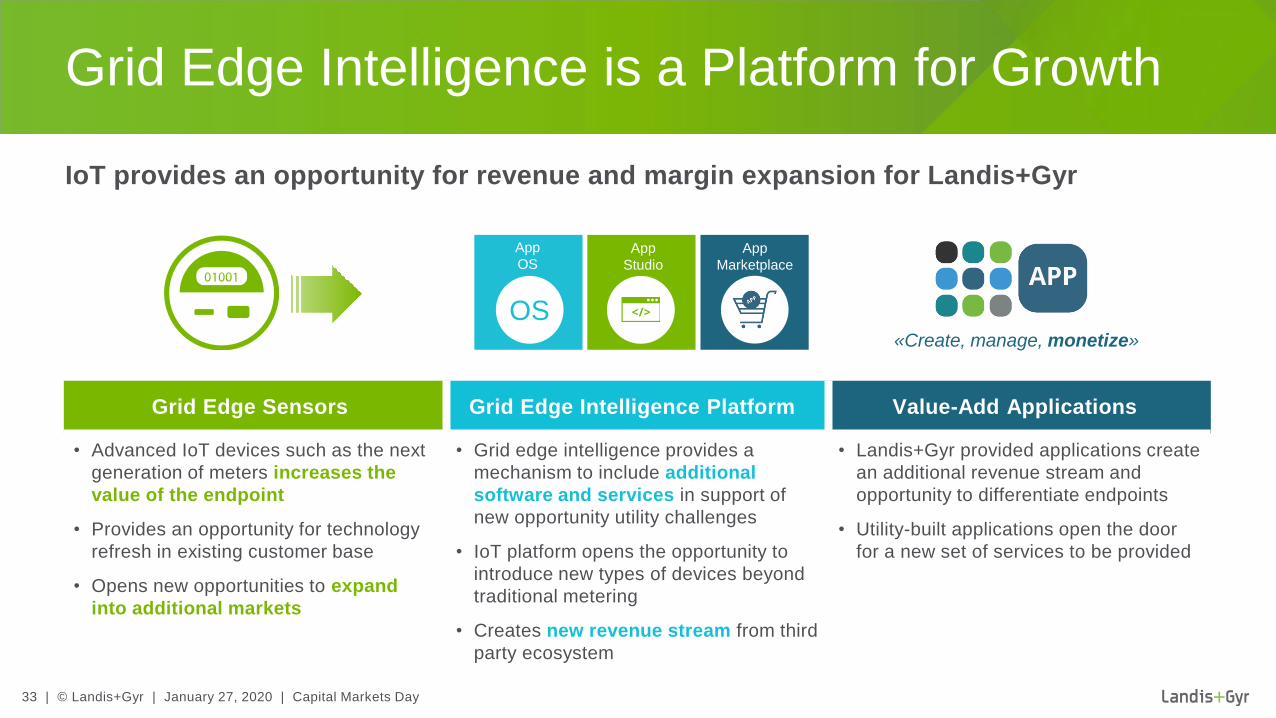
IoT provides an opportunity for revenue and margin expansion for Landis+Gyr
Grid Edge Intelligence is a Platform for Growth
Grid Edge Sensors Grid Edge Intelligence Platform Value-Add Applications
• Advanced IoT devices such as the next
generation of meters increases the
value of the endpoint
• Provides an opportunity for technology
refresh in existing customer base
• Opens new opportunities to expand
into additional markets
• Grid edge intelligence provides a
mechanism to include additional
software and services in support of
new opportunity utility challenges
• IoT platform opens the opportunity to
introduce new types of devices beyond
traditional metering
• Creates new revenue stream from third
party ecosystem
• Landis+Gyr provided applications create
an additional revenue stream and
opportunity to differentiate endpoints
• Utility-built applications open the door
for a new set of services to be provided
«Create, manage, monetize»
App
OSApp
Studio
App
Marketplace
OS

34 | © Landis+Gyr | January 27, 2020 | Capital Markets Day
App
OSApp
Studio
App
Marketplace
OS
Landis+Gyr Edge IoT Platform
«Create, manage, monetize»G
rid
-sid
eA
pp
sC
on
su
me
r-sid
eA
pp
s
Pre-installed Apps add value on day 1
Home
Analytics
Real-time High
Energy Usage Alerts
Meter Safety
Alerts
Grid Location
Awareness
Anomaly
Detection
Intelligent Voltage
Monitoring
Expanding Utility Value through Grid Edge Intelligence

35 | © Landis+Gyr | January 27, 2020 | Capital Markets Day
FOCUS® S4xElite
Uniquely powering edge intelligence
with grid metering capability,
providing Landis+Gyr with an
unrivaled market differentiator
Embedded generation interconnect
technology to support Distributed
Energy Resources integration at
the edge
Core grid & consumer-side edge
applications provide unique benefits
to utilities and consumers and new
revenue opportunities for Landis+Gyr
A common platform will streamline
development and manufacturing
processes and allow for a quick
response to rapidly changing
market needs
Introducing the Revelo Electricity Metering Offering A Grid Game Changer for Utility IoT Solutions
™

36 | © Landis+Gyr | January 27, 2020 | Capital Markets Day
∙Smart meters
deployed by
Landis+Gyr in NAM
∙Utilities served
by Landis+Gyr
∙Meters hosted
in Landis+Gyr
Cloud offering
∙Meter readings
processed per day
in our Customer
Operations Center
∙Market Dynamic / Customer Challenges
• 1st wave AMI roll-outs are reaching maturity, while 2nd wave
is just starting; remaining utilities and 2nd wave utilities will
require new use cases and broader benefits
• North American market leader in smart metering software
and services with contracted relationships extending up to
40 years
∙Our Solution Offering / Priorities
• Continue to win high share of AMI deals with grid edge
intelligence, expansion to IoT services, and our innovative,
next generation technology roadmap
• Growth in edge intelligence, data, and complex devices drive
utility demand for Landis+Gyr’s established expertise in utility-
focused software and services
Focus Point:
North American Market
∙Licensed endpoints
with MDMS across
the globe
~38m 800+ >21m >2bn 70m+

37 | © Landis+Gyr | January 27, 2020 | Capital Markets Day
∙Electricity meter refresh
over 10 years
∙Start of government-driven
replacement cycle of all
meters over a 10-year period
∙Daily reads –
unsurpassed network scale
and functionality achieved
World’s largest utility IoT
network with 24+ million
endpoints deployed
∙Market Dynamic / Customer Challenges
• Japan is in the midst of an energy transition as a result of the
recent deregulation of the electricity and gas market
• Next generation smart meter refresh planned for 2023
∙Our Solution Offering / Priorities
• Continue Landis+Gyr’s strong relationship with TEPCO and
capitalize on the next AMI wave
• Development of relationships with Japanese meter companies to
grow our business
>80m 2023 >1bn
Focus Point:
Japan

38 | © Landis+Gyr | January 27, 2020 | Capital Markets Day
Americas Positioning for Success
Proven Success
in the Americas
Unparalleled Reputation
in Cloud Services
New Value with Grid
Edge Intelligence
Strategic Advantage
in Japan
• Track-record of success
with the largest, longest-
running deployments
• Recognized as #1
provider for Utility IoT
• 2019 wins support
continued leadership
across existing and new
customers
• Established base of 300+
customers, many with
multi-year relationships
• Expertise in complex
data services and utility
business needs to grow
foothold
• Foundational software
expertise for edge
application development
• Defining the technology
vision for the market
roadmap, poised to take
advantage of market
refresh
• Building an app ecosystem
of partnerships
• Monetization of platform
• Deep-rooted market
position in Japan with
24m+ endpoints
connected
• Largest global utility IoT
platform
• Strategic positioning with
utility, partners, and
technology for next wave

39 | © Landis+Gyr | January 27, 2020 | Capital Markets Day
Name, Title
EMEASusanne Seitz, EVP EMEA

40 | © Landis+Gyr | January 27, 2020 | Capital Markets Day
• Consolidated our position in UK and France large rollouts
• Launch of Gridstream® Connect – our Utility IoT Platform
• 1 million metering points for Gridstream Connect solution
to E.ON Sweden
• First Software as a Service (SaaS) contract outside
Nordics
• Strong revenues growth mainly driven by UK
• Return to profitability – continued journey to
improved performance and profitability
Regional Highlights
EMEA Highlights
Sales offices in 18
countries across the
EMEA region
1.6+ millionmeter points under
Managed Services
160 end-to-end smart metering
solutions in the field
Installed base in Europe of
35+ million connected
intelligent devices
1’300+ utilitiesserved as
trusted partner

41 | © Landis+Gyr | January 27, 2020 | Capital Markets Day
Revenues and Profitability Committed Backlog
∙Performance
• Revenue growth driven by UK; expected Brexit destocking did not materialize
• Full effect from completed introduction of product cost downs
• Project Phoenix completed in FY 2018
• Project Lightfoot expected to deliver USD 20m of annual savings in FY 2019 with an add. USD 5m savings to be delivered in FY 2020
• Committed backlog up on the back of contract wins in the Nordics and the UK
Continued Turnaround Yielding Strong Top Line and Profitability Improvements
682654
755 790
FY16 FY17 FY18 FY19 H1
1. Following the adoption by the Company of ASU 2017-07 relating to defined benefit pension scheme costs,
Adj. EBITDA has been revised down by USD 1.5m and by USD 3.1m in FY 2016 and FY 2017 respectively as
all pension income and expenses other than service costs are now reported under “Other income (expense)”
588627 633
306
-0.1%
-…
3.1%
7.6%
FY16 FY17 FY18 FY19 H1
Net Revenues USD m Adj. EBITDA % ¹
-1.9%

42 | © Landis+Gyr | January 27, 2020 | Capital Markets Day
∙Measures
a. Improved Margin Quality: +0.5% to +1.0%
Product cost downs have been completed on
high volume AMI products
b. Lightfoot Savings: +2.0% to +2.5%
Ahead of plan to deliver USD 25 million
savings in FY 2020
c. Operating Leverage: +3.5% to +4.5%
Higher net revenue volumes lead to
economies of scale. Further efficiency
gains on operating expenses.
EMEA’s Adjusted EBITDA Margin on Track to Hit 10% in FY 2020
Adjusted EBITDA as a % of Net Revenues
3.1%
a
b
c c. 10%
43 | © Landis+Gyr | January 27, 2020 | Capital Markets Day
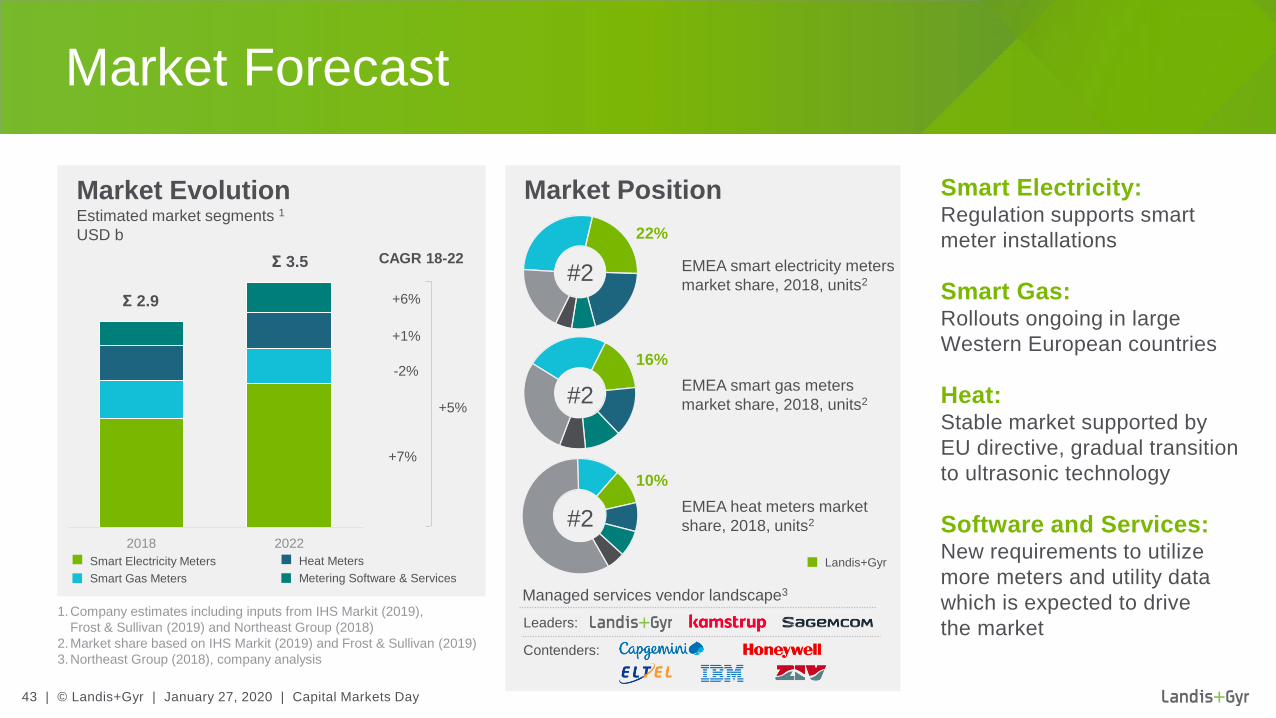
22%Estimated market segments 1
USD b
Smart Electricity:Regulation supports smart
meter installations
Smart Gas: Rollouts ongoing in large
Western European countries
Heat: Stable market supported by
EU directive, gradual transition
to ultrasonic technology
Software and Services: New requirements to utilize
more meters and utility data
which is expected to drive
the market
Market Forecast
1.Company estimates including inputs from IHS Markit (2019),
Frost & Sullivan (2019) and Northeast Group (2018)
2.Market share based on IHS Markit (2019) and Frost & Sullivan (2019)
3.Northeast Group (2018), company analysis
Market Evolution Market Position
Smart Electricity Meters
Smart Gas Meters
Heat Meters
Metering Software & Services
EMEA smart electricity meters
market share, 2018, units2
16%
EMEA smart gas meters
market share, 2018, units2
#2
#2
#2
10%
EMEA heat meters market
share, 2018, units2
Managed services vendor landscape3
Leaders:
Contenders:
Landis+Gyr
2018 2022
+5%
CAGR 18-22
+7%
+1%
+6%
-2%
Σ 2.9
Σ 3.5
44 | © Landis+Gyr | January 27, 2020 | Capital Markets Day
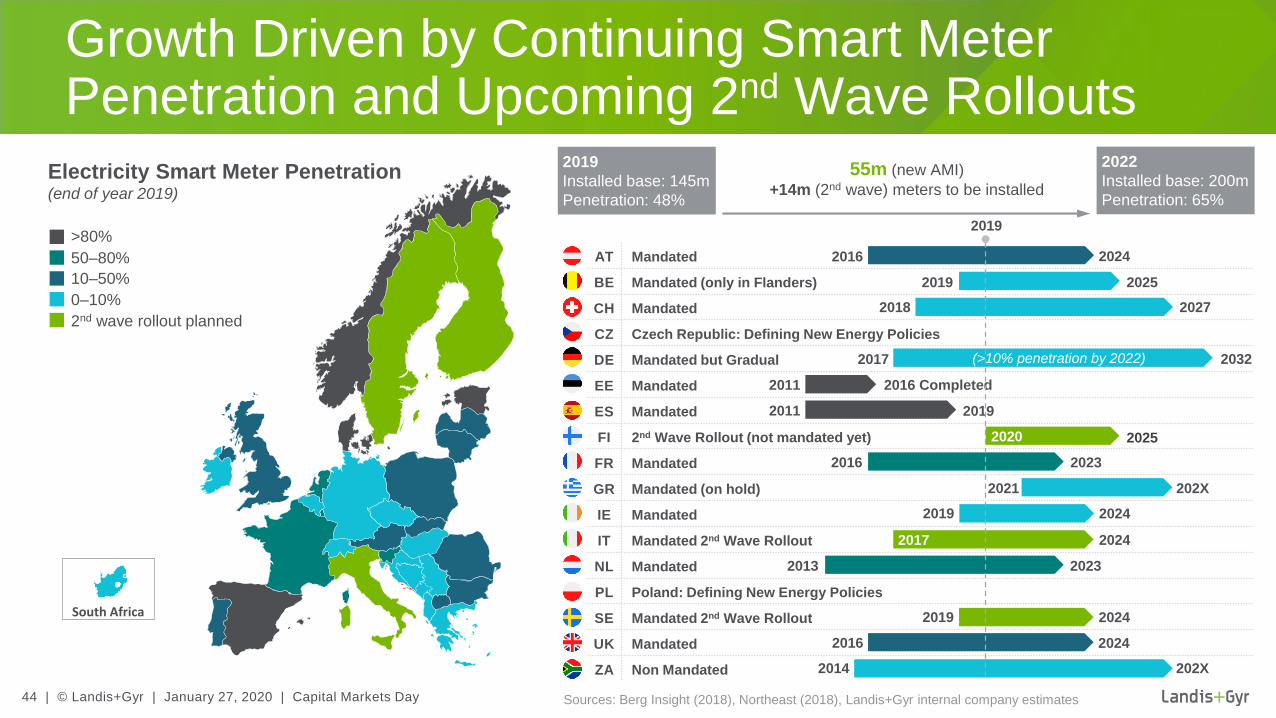
Growth Driven by Continuing Smart Meter Penetration and Upcoming 2nd Wave Rollouts
Sources: Berg Insight (2018), Northeast (2018), Landis+Gyr internal company estimates
South Africa
>80%
2nd wave rollout planned
10–50%
0–10%
50–80%
Electricity Smart Meter Penetration(end of year 2019)
AT Mandated
BE Mandated (only in Flanders)
CH Mandated
CZ Czech Republic: Defining New Energy Policies
DE Mandated but Gradual
EE Mandated
ES Mandated
FI 2nd Wave Rollout (not mandated yet)
FR Mandated
GR Mandated (on hold)
IE Mandated
IT Mandated 2nd Wave Rollout
NL Mandated
PL Poland: Defining New Energy Policies
SE Mandated 2nd Wave Rollout
UK Mandated
ZA Non Mandated
2019 2025
2018 2027
2011 2016 Completed
2011 2019
20252020
2013 2023
2016 2024
2017 2032(>10% penetration by 2022)
202X2021
202X2014
2019 2024
2017 2024
2019 2024
2016 2023
2016 2024
2019
2019
Installed base: 145m
Penetration: 48%
2022
Installed base: 200m
Penetration: 65%
55m (new AMI)
+14m (2nd wave) meters to be installed

45 | © Landis+Gyr | January 27, 2020 | Capital Markets Day
∙Smart electricity and gas
meters to be deployed during
the full rollout
∙Smart meters
deployed1
∙SMETS meters supplied or
under contract for
Landis+Gyr
∙Meters already supplied
by Landis+Gyr
∙Market Development
• Moving to a decentralized power grid
• Establish accurate on-time billing data (instead of estimation)
• Better facilitate pre-payment models
• Rollout prolonged to 2024
∙Our Solution Offering / Priorities
• Further expansion of our smart meter base
• Building on current smart meter offering
− Development of alternative communication technology
− Grid edge intelligence use cases
• Services to optimize customers' operational efficiency
53m 15.6m 21m 9m
Focus Point UK:
Leveraging a Large-scale Rollout
1. BEIS, November 2019

46 | © Landis+Gyr | January 27, 2020 | Capital Markets Day
∙Residential meters
to be deployed
∙Linky meters installed
per day
∙Supplied by
Landis+Gyr
∙Reduction of
suppliers
∙Market Development
• Modernization of the network for the Energy Transition
• More than 23 million already installed, 90% completed
by 2021
• Capitalize on the Linky technology
• Leverage AMI infrastructure to enable new offerings
∙Our Solution Offering / Priorities
• Residential AMI deployment Linky is the 1st step of network
digitalization.
• The next steps are:
− Commercial and Industrial AMI with new meter
− Low voltage monitoring at the sub-station level
− Electrical mobility
35m 30k 25% 6 3
Focus Point France:
Linky Rollout in Full Swing, New Use Cases Emerging

47 | © Landis+Gyr | January 27, 2020 | Capital Markets Day
∙Smart meters to
be replaced in Sweden
by 2024
∙Metering points
contracted for Landis+Gyr
in Sweden
∙Metering points
in Finland
∙For each
Nordic country
∙Market Development
• Sweden replaces 1st generation smart meters with latest
technology
• 2nd generation rollouts in Finland are about to start
• Strong demand for Managed Services across the Nordic region
• DSO’s focus on utilizing the data for improved grid efficiency
and customer service excellence
∙Our Solution Offering / Priorities
• Introduction of Gridstream Connect IoT platform with NB-IoT
communication technologies and latest meter portfolio for grid
edge intelligence
• Extending our Managed Services offering
5.4m >1m 3.5mDataHub
Focus Point Nordics:
2nd Wave Deployments

48 | © Landis+Gyr | January 27, 2020 | Capital Markets Day
Focus Point Switzerland, Germany, Central and Eastern Europe:
Early Phase Opportunities
∙Meters installed base Meters installed base ∙Meters installed base
4.8m 45m 50m
∙Switzerland ∙Central and Eastern Europe∙Germany
Difference in drivers for AMI
between EU and non-EU countries
• Priority EU countries: win large share of
rollout e.g. in Poland and Czech
Republic
• Opportunity in other countries to offer
solutions to reduce technical and non-
technical losses and to secure grid
reliability
Delayed energy transition and
mass rollout
• Grow smart metering and capture large
shares in smart meter deployments
• Pilot services model for small and mid-
sized utilities (Infrastructure as a
Service)
Market Leader
• New regulation in place requiring 80%
of meters being smart by 2027
• Market is preparing
• Priority: maintain market leading
position and expand into service
business
49 | © Landis+Gyr | January 27, 2020 | Capital Markets Day
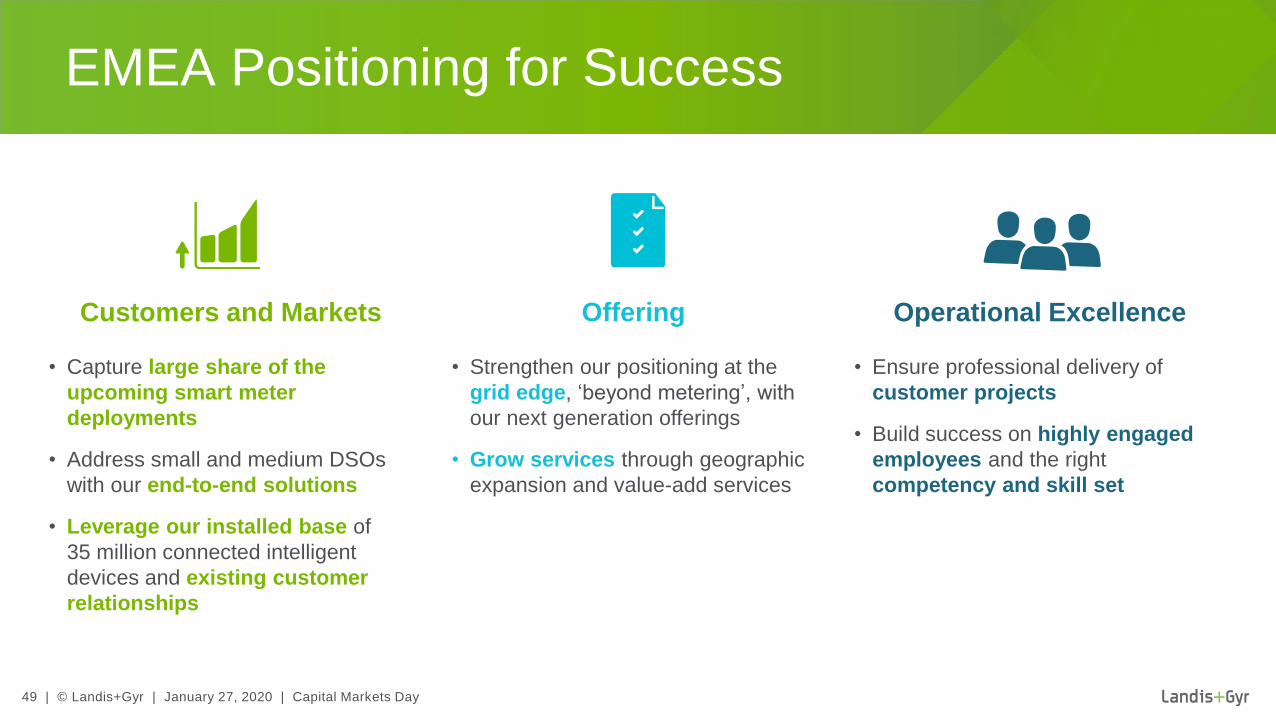
EMEA Positioning for Success
Customers and Markets Offering Operational Excellence
• Capture large share of the
upcoming smart meter
deployments
• Address small and medium DSOs
with our end-to-end solutions
• Leverage our installed base of
35 million connected intelligent
devices and existing customer
relationships
• Strengthen our positioning at the
grid edge, ‘beyond metering’, with
our next generation offerings
• Grow services through geographic
expansion and value-add services
• Ensure professional delivery of
customer projects
• Build success on highly engaged
employees and the right
competency and skill set

50 | © Landis+Gyr | January 27, 2020 | Capital Markets Day
Coffee Break

51 | © Landis+Gyr | January 27, 2020 | Capital Markets Day
Name, Title
Asia-PacificSteve Jeston, Head AP

52 | © Landis+Gyr | January 27, 2020 | Capital Markets Day
• Strengthened our position as leading supplier in
smart metering
• Strong improvements in profitability due to lower
cost base
• Smart metering contracts in targeted growth areas:
Australia, Hong Kong and India
− Awarded CLP contract extension covering AMI system and
Meters (Hong Kong)
− TATA canopy now connected +160k AMI meters (India)
− Growth in AMI meters, via local JV partner intelliHUB (ANZ)
Business Highlights
Asia-Pacific Highlights
Serving major markets
across the region
Leading Supplierin smart metering1
with deployments in Australia,
Hong Kong and India
4+ million connected intelligent
devices in the field
Strong customer
relationships/service drives continued
long term success
1. excluding China except Hong Kong
53 | © Landis+Gyr | January 27, 2020 | Capital Markets Day
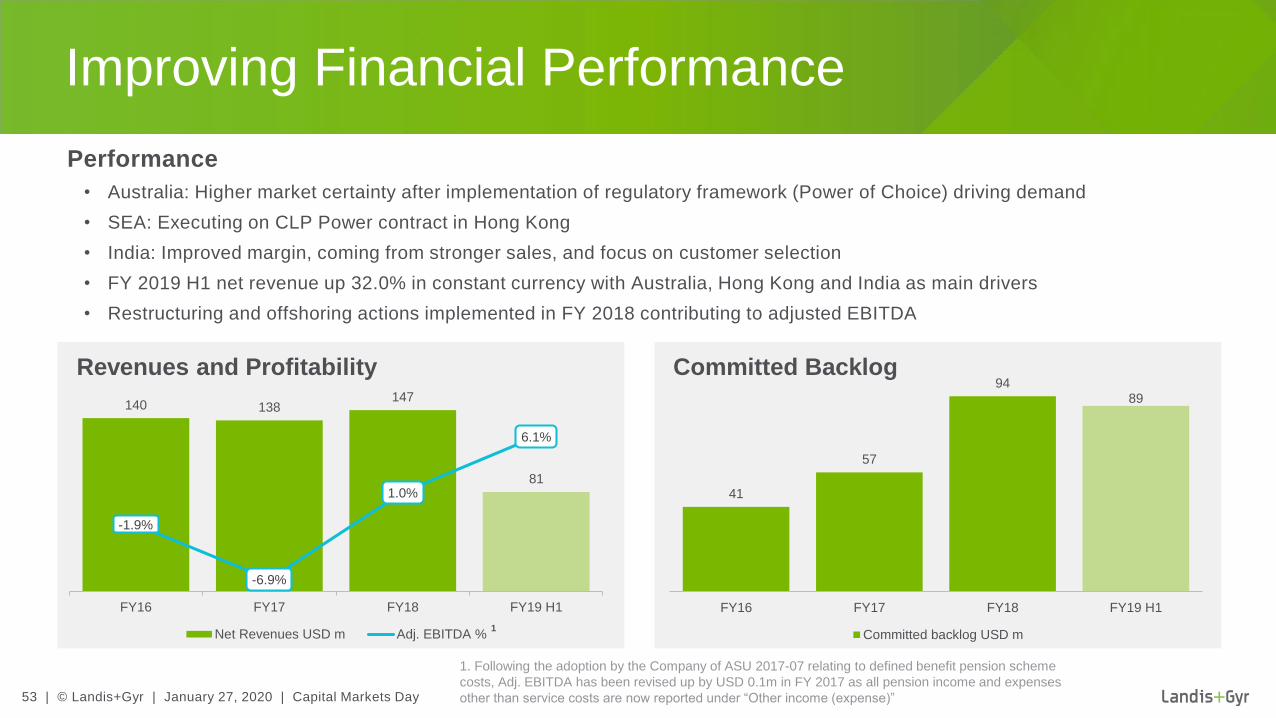
∙Performance
• Australia: Higher market certainty after implementation of regulatory framework (Power of Choice) driving demand
• SEA: Executing on CLP Power contract in Hong Kong
• India: Improved margin, coming from stronger sales, and focus on customer selection
• FY 2019 H1 net revenue up 32.0% in constant currency with Australia, Hong Kong and India as main drivers
• Restructuring and offshoring actions implemented in FY 2018 contributing to adjusted EBITDA
Improving Financial Performance
Revenues and Profitability Committed Backlog
41
57
9489
FY16 FY17 FY18 FY19 H1
Committed backlog USD m
140 138147
81
-1.9%
-6.9%
1.0%
6.1%
FY16 FY17 FY18 FY19 H1
Net Revenues USD m Adj. EBITDA %
1. Following the adoption by the Company of ASU 2017-07 relating to defined benefit pension scheme
costs, Adj. EBITDA has been revised up by USD 0.1m in FY 2017 as all pension income and expenses
other than service costs are now reported under “Other income (expense)”
∙1

54 | © Landis+Gyr | January 27, 2020 | Capital Markets Day
32%
16%
32%
ANZ Smart Electricity: Constant growth with
application of Power of
Choice, refresh cycle
expected in New Zealand
South East Asia
Smart Electricity:We concentrate on selected
countries showing concrete
sign of AMI deployment
India Smart Electricity: Shifting to a more selective
targeted customer focus, in
turn drives improved bottom
line financial performance.
Dynamic Market Outlook
Market Evolution Market Position
ANZ smart electricity meters
market share, 2018, units2
10%
SEA smart electricity meters
market share, 2018, units2
#2
#3
#4
16%
India smart electricity meters
market share, 2018, units2
1. Company estimates including inputs from IHS Markit (2019) and Frost & Sullivan (2019)
2. Market share based on IHS Markit (2019) and Frost & Sullivan (2019)
ANZ Smart Electricity Meters
SEA Smart Electricity Meters
India Smart Electricity Meters Landis+Gyr
Estimated market segments1
USD b
2018 2022
+14%
CAGR 18-22
+8%
+36%
+10%
Σ 0.3
Σ 0.6

55 | © Landis+Gyr | January 27, 2020 | Capital Markets Day
Growth Driven by Upcoming AMI Deployments
Sources: Company knowledge, Northeast (2018), Frost & Sullivan (2019)
AMI Meter Penetration
NZ 2nd Wave Rollout
SG Regulated
AU Regulated
HK Regulated
MY Tendering + Deploying
IN Piloting + Tendering + Deploying
TH Piloting + Tendering
BD Pilot + Tendering
PK Pilot + Tendering
ID Piloting + Tendering
PH Planning Phase
VN Investigating
>80%
2nd wave rollout planned
10–50%
0–10%
50–80%
No Plans
Not Accessible
CHINA
INDIA
NEW ZEALAND
SEA
AUSTRALIA
2019 2026
AMI Market Deployment Stage
INF
AN
CY
EM
ER
GIN
GG
RO
WT
H

56 | © Landis+Gyr | January 27, 2020 | Capital Markets Day
∙Smart meter penetration in
ANZ (~3m smart meters
deployed to date)
∙Of homes have
roof top solar
(>2m homes)
∙Australia share of
global residential battery
demand in 2019 (70k)
∙Forecast household
battery installations
by 2025
∙Market Dynamic and Customer Challenges
• Electrical network stability under increasing pressure from
significant renewable energy sources being installed
• AEMC/AEMO1 creating regulation to drive greater renewable
distributed generation in the market
• Utilities evaluating network monitoring and control
• Power of Choice market gaining momentum with replacement
requirements
• Refresh cycle expected in New Zealand from 2024
∙Our Solution Offering / Priorities
• Gridstream® Connect enables smart network monitoring
and control
• Driving greater distributed intelligence at the household
through grid edge offerings
• Driving ownership costs down through flexible solution offerings
such as integrated hardware designs, Software-as-a-Service
(SaaS), managed service offering via our JV partner intelliHUB
27% 21% 30% 1m
Focus Point:
Australia and New Zealand
Sources: Company information 1. Australian Energy Market Commission, Australian Energy Market Operator

57 | © Landis+Gyr | January 27, 2020 | Capital Markets Day
Solar-power microgrid
trial in Warranyjarri
Broome Western Australia
∙Use of Landis+Gyr’s
technology
∙Solution delivered a
reduction of CO2 and
excess renewable energy
for charging batteries
∙Expected yearly savings per
consumer compared to
traditional network
(~USD 1’750)
∙Customer Challenge
• Horizon Power network has significant cost to serve
remote locations in North Western Australia
• Goals of the project:
− Reduce cost to serve while also reducing CO2 emission
− Improve local network reliability and availability
− Improved customer experience and engagement
∙Our Solution Offering / Priorities
• Landis+Gyr’s technology provided connectivity,
measurement, control of decentralized devices
(home solar, batteries)
• Enablement of 3rd party home energy management
system application
Grid Edge Proof of Concept “Sun Smart”
Sources: Horizon Power, LandCorp, SwitchDIN,
70%

58 | © Landis+Gyr | January 27, 2020 | Capital Markets Day
∙Estimated cost to Indian
economy due to
inefficiencies / distortions1
across energy sector
∙Estimated
distribution losses
∙Ranking for installed
capacity of renewable
energy globally
∙Additional Gridstream
AMI meters connected
under RF canopy
∙Market Dynamic and Customer Challenges
• Massive saving available through improved efficiencies
• Largest global renewable generation program target of
175 GW by 2022 (90 GW installed as of 2018)
• Ministry of Power publicly announced AMI target of
240m AMI meters by 2022
∙Our Solution Offering / Priorities
• Gridstream® Connect enables more than AMI: smart grid
canopy for distribution automation and advanced network
applications including prepayment
• Leveraging our experience of domestic solar in Australia
into Indian market
• Leveraging our innovation program to achieve low cost
products specific to the Indian requirements
USD 86.1bn
19% 5th +175k
Focus Point:
India
1. Distortions include all inefficiencies across electricity generation, transmission, distribution, subsidies, tariff,
reliability and business and personal competitiveness. Source The World Bank: In the Dark report 2019
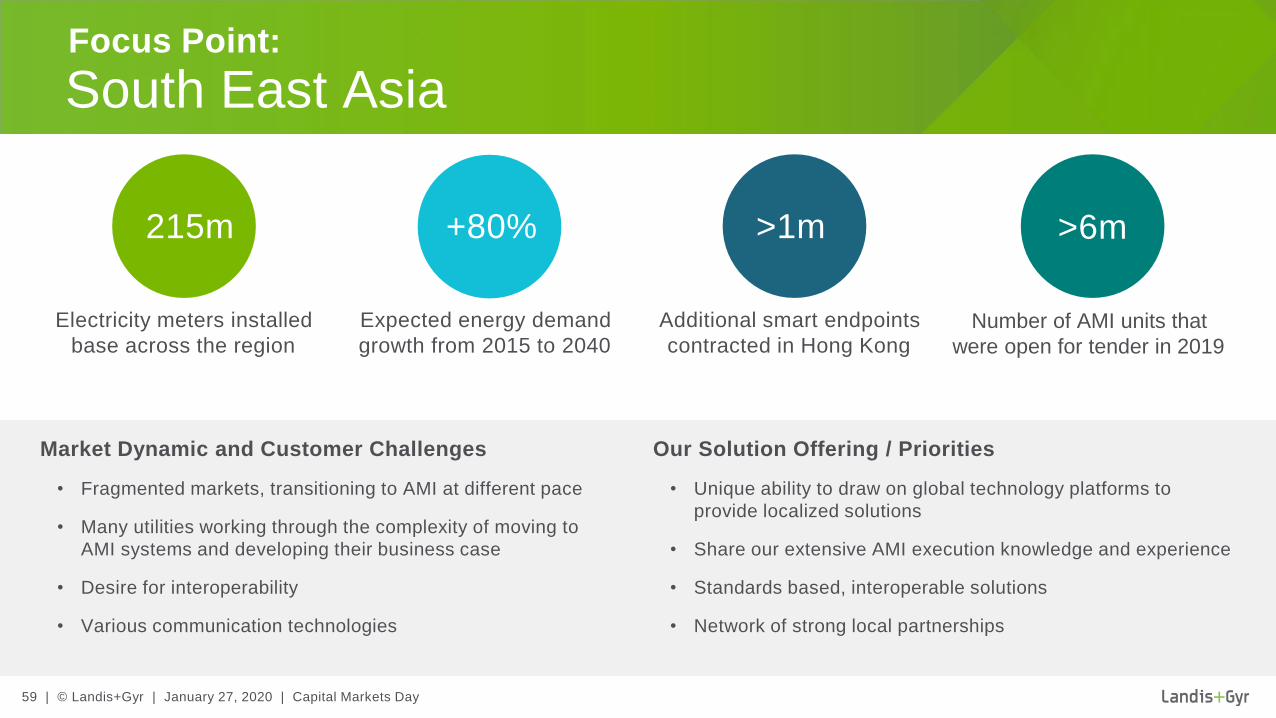
59 | © Landis+Gyr | January 27, 2020 | Capital Markets Day
∙Additional smart endpoints
contracted in Hong Kong∙Number of AMI units that
were open for tender in 2019
∙Expected energy demand
growth from 2015 to 2040
∙Electricity meters installed
base across the region
∙Market Dynamic and Customer Challenges
• Fragmented markets, transitioning to AMI at different pace
• Many utilities working through the complexity of moving to
AMI systems and developing their business case
• Desire for interoperability
• Various communication technologies
∙Our Solution Offering / Priorities
• Unique ability to draw on global technology platforms to
provide localized solutions
• Share our extensive AMI execution knowledge and experience
• Standards based, interoperable solutions
• Network of strong local partnerships
>1m >6m+80%215m
Focus Point:
South East Asia

60 | © Landis+Gyr | January 27, 2020 | Capital Markets Day
Asia-Pacific Positioning for Success
Grow on the back of emerging AMI
opportunities across the region
through close customer relationships
and strong partner network
Continue to build out competitive market
offering for targeted opportunities.
Expand market offering as demand
for grid edge applications grow
Margins will continue to improve
through a combination of value
adding services and continued focus
on our portfolio cost out programs

61 | © Landis+Gyr | January 27, 2020 | Capital Markets Day
Name, Title
FinanceJonathan Elmer, CFO

62 | © Landis+Gyr | January 27, 2020 | Capital Markets Day
∙FY 2019 H1: Net Revenues Development
• Group: +3.4% growth y-o-y in constant currency
• Americas: Impacted by roll-off of two major
projects
• EMEA: UK continues to drive performance
• AP: Australia, Hong Kong and India driving growth
FY 2019 H1: Adjusted EBITDA %
• Adjusted EBITDA margin improved by 130bps,
excluding one-off VAT impact in Brazil of USD
5.6m
• EMEA and AP recovery drives profitability
improvement
Group Performance:
Revenue Growth and Operational Improvements Drive Margins Higher
1. Following the adoption by the Company of ASU 2017-07 relating to defined benefit pension
scheme costs, Adj. EBITDA has been revised down by USD 1.4m and by USD 3.8 million in FY
2016 and FY 2017 respectively as all pension income and expenses other than service costs are
now reported under “Other income (expense)”; net income is unchanged.
FY 2019 H1 including USD 5.6 million one-off related to Brazilian VAT ruling.
USD in millions
1'6591'738 1'765
863
12.7%12.0%
13.5%
14.5%
FY16 FY17 FY18 FY19 H1
Net Revenues USD m Adj. EBITDA % ¹

63 | © Landis+Gyr | January 27, 2020 | Capital Markets Day
∙FY 2019 H1: Net Revenues Development
• H1 sales are lower by -4.1% in constant currency
compared to previous year primarily due to the
roll-off of two major contracts in North America
• Japan net revenue of USD 12.9 million, down
USD 1.4 million
FY 2019 H1: Adjusted EBITDA %
• USD 5.6 million one-off gain related to court
ruling in VAT case in Brazil (included in Adjusted
Operating Expenses)
• Adjusted EBITDA % remains resilient at 19.3%
(18.2% excluding the VAT case in Brazil)
Resilient EBITDA Margins Despite Some Top-line Headwinds
Americas Performance:
USD in millions
931972 986
476
21.0% 20.4%19.6% 19.3%
FY16 FY17 FY18 FY19 H1
Net Revenues USD m Adj. EBITDA % ¹
1. Following the adoption by the Company of ASU 2017-07 relating to defined benefit pension
scheme costs, Adj. EBITDA has been revised up by USD 0.1m and down by USD 0.7m in FY
2016 and FY 2017 respectively as all pension income and expenses other than service costs are
now reported under “Other income (expense)”.
FY 2019 H1 including USD 5.6 million one-off related to Brazilian VAT ruling.

64 | © Landis+Gyr | January 27, 2020 | Capital Markets Day
∙FY 2019 H1: Net Revenues Development
• +10.5% growth year-on-year in constant
currency
• H1 revenue growth driven by UK; expected
Brexit destocking did not materialize
FY 2019 H1: Adjusted EBITDA %
• Turnaround yielding strong top line and
profitability improvements
• H1 margin improvements continue with Project
Lightfoot ahead of plan to deliver USD 25 million
savings in FY 2020; approx. USD 20 million
annual savings to be realized in FY 2019
• Project Phoenix was successfully completed
in FY 2018
Turnaround Under Way as Revenues and Margins Grow
EMEA Performance:
1. Following the adoption by the Company of ASU 2017-07 relating to defined benefit pension
scheme costs, Adj. EBITDA has been revised down by USD 1.5m and by USD 3.1m in FY 2016
and FY 2017 respectively as all pension income and expenses other than service costs are now
reported under “Other income (expense)”
USD in millions
588
627 633
306
-0.1%
-1.9%
3.1%
7.6%
FY16 FY17 FY18 FY19 H1
Net Revenues USD m Adj. EBITDA % ¹
-1.9%
-0.1%

65 | © Landis+Gyr | January 27, 2020 | Capital Markets Day
∙Potential Implications of Brexit
• WTO terms would result in import duties of
1.1% on electricity and 2.1% on gas meters
• New import procedures and possible customs
congestion
• Exchange rate fluctuations may impact margins
• UK may become a more uncertain market
∙Mitigation measures
• Landis+Gyr UK has registered for transitional
simplified procedures (TSP) to mitigate impact
of a no deal Brexit on importing goods
produced in EU counties
• Main outsourced providers are based in EU
countries and are aligned with our import
procedures under TSP
• FX hedging mitigates currency exposures
Brexit Uncertainties
UK remains the largest market in EMEA and 2nd largest market
globally for Landis+Gyr

66 | © Landis+Gyr | January 27, 2020 | Capital Markets Day
∙FY 2019 H1: Net Revenues Development
• +32% growth year-on-year in constant currency
• H1 revenue growth driven by higher revenue in
Australia, in SEA (CLP Power contract) and
India (Tata contract)
∙FY 2019 H1: Adjusted EBITDA %
• Lower operating expense as a result of
restructuring and intelliHUB carve-out
Strong Margin Improvement as Top-line Grows on Lower Cost Base
USD in millions
140 138
147
81
-1.9%
-6.9%
1.0%
6.1%
FY16 FY17 FY18 FY19 H1
Net Revenues USD m Adj. EBITDA %
Asia-Pacific Performance:
1. Following the adoption by the Company of ASU 2017-07 relating to defined benefit pension
scheme costs, Adj. EBITDA has been revised up by USD 0.1m in FY 2017 as all pension income
and expenses other than service costs are now reported under “Other income (expense)”
∙1

67 | © Landis+Gyr | January 27, 2020 | Capital Markets Day
Asset Light Business Model Increases Operational Flexibility
Transition to outsourced providers continues
to progress:
• Manufacturing restructuring largely completed
in EMEA (Project Lightfoot)
• Outsourcing improves operational flexibility
• Benefit of leveraging supply chain capabilities
reduces risk
Capex / sales ratio
43
38
40
13
2.6%
2.2%2.3%
1.5%
FY16 FY17 FY18 FY19 H1
Capex (USD m) % sales

68 | © Landis+Gyr | January 27, 2020 | Capital Markets Day
• H2 has historically been much
stronger in terms of Free Cash
Flow (excl. M&A) generation
• Warranty settlement cash outs
in FY 2017 and FY 2018 skewed
to H1; these cash outs will be
more balanced in FY 2019
• Employee incentive pay-outs are
skewed to H1
• OWC improvement expected in
FY 2019 H2
Cash Flow Seasonality –Free Cash Flows Excluding M&A
Historical Free Cash Flow (excl. M&A)USD in millions
20.6
66.9
14.1
109.4
33.1
H1 H2 H1 H2 H1 H2
FY 2018:
123.5
FY 2019 guidance:
120 – 135
FY 2017:
87.5
69 | © Landis+Gyr | January 27, 2020 | Capital Markets Day
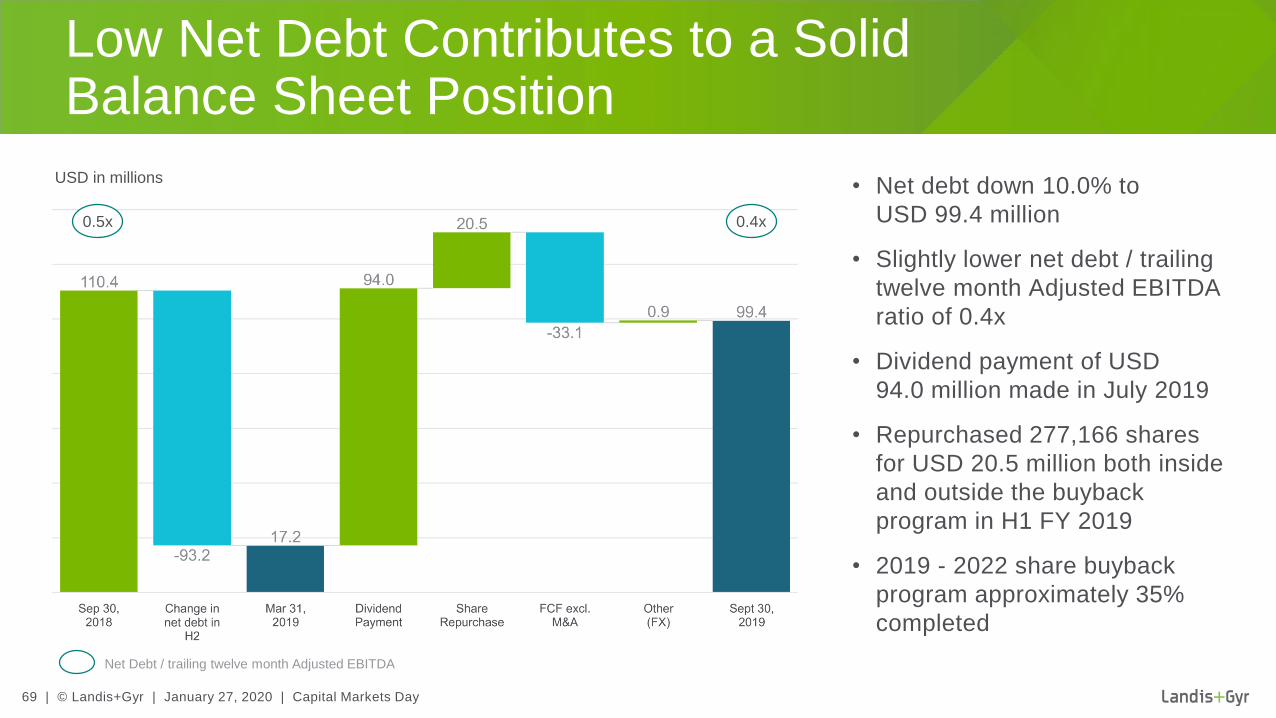
• Net debt down 10.0% to
USD 99.4 million
• Slightly lower net debt / trailing
twelve month Adjusted EBITDA
ratio of 0.4x
• Dividend payment of USD
94.0 million made in July 2019
• Repurchased 277,166 shares
for USD 20.5 million both inside
and outside the buyback
program in H1 FY 2019
• 2019 - 2022 share buyback
program approximately 35%
completed
Low Net Debt Contributes to a Solid Balance Sheet Position
0.5x 0.4x
USD in millions
Net Debt / trailing twelve month Adjusted EBITDA
70 | © Landis+Gyr | January 27, 2020 | Capital Markets Day
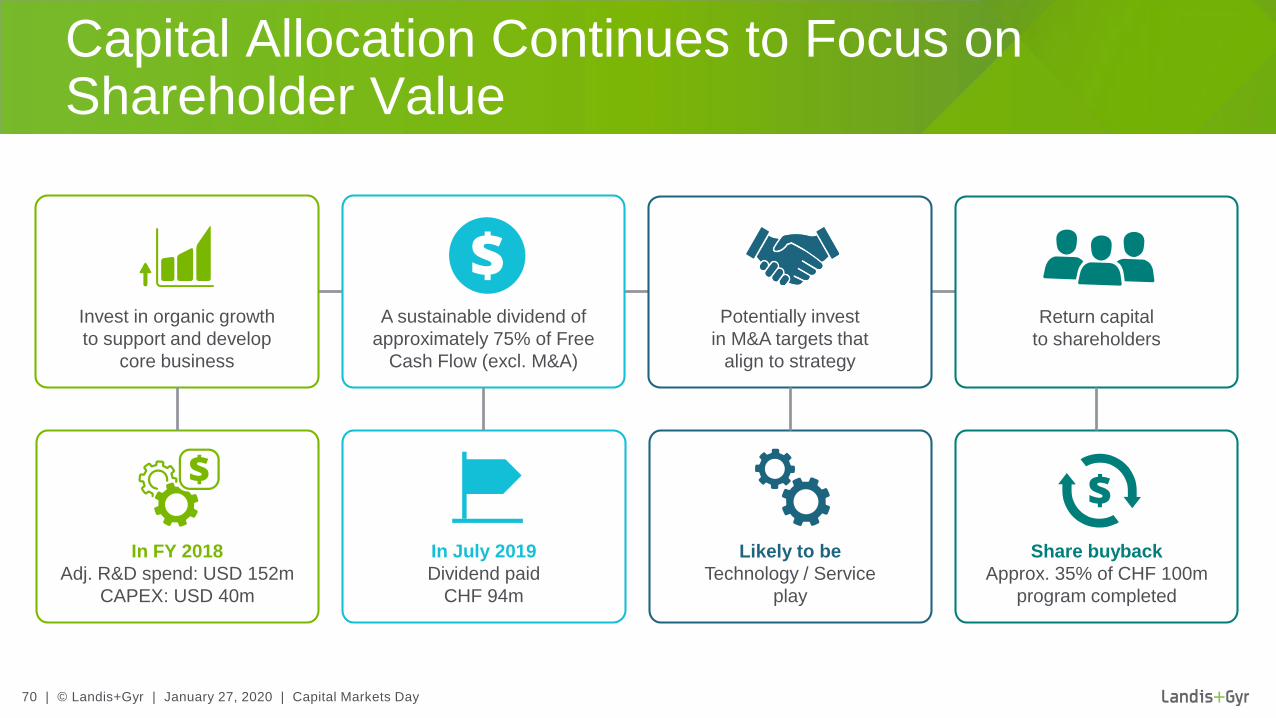
Capital Allocation Continues to Focus on Shareholder Value
Likely to be
Technology / Service
play
Return capital
to shareholders
A sustainable dividend of
approximately 75% of Free
Cash Flow (excl. M&A)
Share buyback
Approx. 35% of CHF 100m
program completed
Invest in organic growth
to support and develop
core business
In July 2019
Dividend paid
CHF 94m
Potentially invest
in M&A targets that
align to strategy
In FY 2018
Adj. R&D spend: USD 152m
CAPEX: USD 40m

71 | © Landis+Gyr | January 27, 2020 | Capital Markets Day
Guidance for FY 2019
∙Group Adjusted EBITDA
to be between
USD 240 million
and USD 255 million
∙unchanged
∙Free Cash Flow
(excl. M&A) to be
between USD 120 million
and USD 135 million
∙unchanged
~1- 4%USD
240 -255million
USD
120-135million
∙Net revenues growth
of approximately 1- 4% in
constant currency
∙unchanged
Dividend of at least 75% of Free Cash Flow (excl. M&A)
Net revenues, Adjusted EBITDA and Free Cash Flow (excl. M&A) likely to be around the lower
end of the ranges as revenue headwinds, primarily in the US, expected to materialize

72 | © Landis+Gyr | January 27, 2020 | Capital Markets Day
Mid-term (FY 2022) Guidance
Net Revenues
(Relative to FY 2018)
Mid-single digit CAGR in constant currency with growth backend
loaded towards FY 2022 due to regulatory delays in the US
Adjusted EBITDAAdjusted EBITDA margin between 13.5% and 14.5%
of net revenues
Free Cash Flow
(excl. M&A)Above USD 150 million
Capital StructureNet debt expected to remain below
1.5 times Adjusted EBITDA
A sustainable dividend of approximately 75% of Free Cash Flow (excl. M&A)
73 | © Landis+Gyr | January 27, 2020 | Capital Markets Day
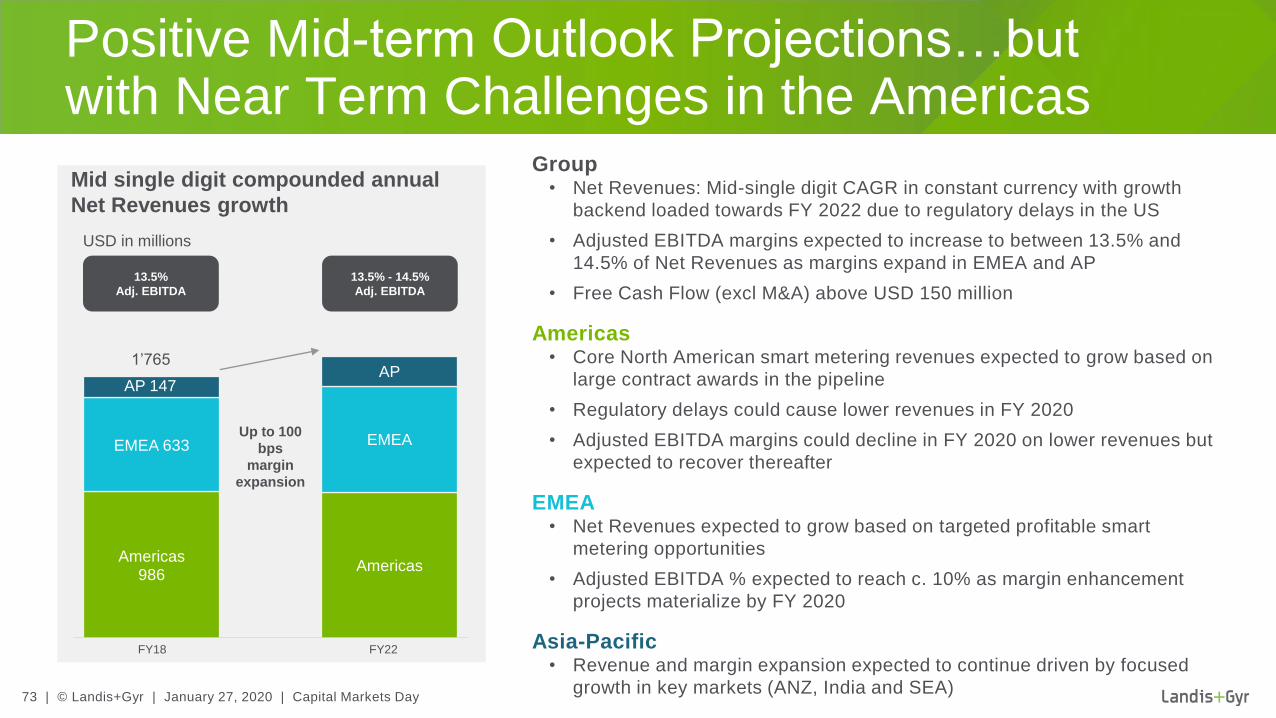
Americas986
Americas
EMEA 633 EMEA
AP 147AP
Up to 100
bps
margin
expansion
1’765
FY18 FY22
∙Group• Net Revenues: Mid-single digit CAGR in constant currency with growth
backend loaded towards FY 2022 due to regulatory delays in the US
• Adjusted EBITDA margins expected to increase to between 13.5% and
14.5% of Net Revenues as margins expand in EMEA and AP
• Free Cash Flow (excl M&A) above USD 150 million
∙Americas• Core North American smart metering revenues expected to grow based on
large contract awards in the pipeline
• Regulatory delays could cause lower revenues in FY 2020
• Adjusted EBITDA margins could decline in FY 2020 on lower revenues but
expected to recover thereafter
∙EMEA• Net Revenues expected to grow based on targeted profitable smart
metering opportunities
• Adjusted EBITDA % expected to reach c. 10% as margin enhancement
projects materialize by FY 2020
∙Asia-Pacific• Revenue and margin expansion expected to continue driven by focused
growth in key markets (ANZ, India and SEA)
Positive Mid-term Outlook Projections…but with Near Term Challenges in the Americas
Mid single digit compounded annual
Net Revenues growth
USD in millions
13.5%
Adj. EBITDA
13.5% - 14.5%
Adj. EBITDA

74 | © Landis+Gyr | January 27, 2020 | Capital Markets Day
Capital Markets Day – Wrap UpRichard Mora, CEO

75 | © Landis+Gyr | January 27, 2020 | Capital Markets Day
Underlying Equity Growth Story
Market developments have validated our platform strategy around
smart metering, grid edge intelligence and smart infrastructure
Landis+Gyr is a leader in an essential industry driving improved environmental
outcomes globally
We are in a growing market – however the growth can be lumpy due to the size
and timing of some of these projects
We will continue to invest in our leading edge technologies, remaining at the
forefront of the innovation curve
We have improving margins, strong free cash flow, a solid balance sheet
and an attractive dividend policy
Committed to delivering continuous improvement in our sustainability programs

76 | © Landis+Gyr | January 27, 2020 | Capital Markets Day
Glossary
AMI Advanced metering infrastructure
CAGR Compound Annual Growth Rate
CMD Capital Markets Day
CO2 Carbon dioxide
CPP Critical peak pricing
CSR Corporate social responsibility
CVR/VVO Conservation voltage reduction and voltage/VAR optimization
DER Distributed energy resources
DSO Distribution system operator
EIA Energy Information Administration (US)
EMS Electronic manufacturing services
EV Electric vehicles
FAN Field area network
FX Foreign Exchange
ICG Industrial, commercial and grid
IEA International Energy Agency
IoT Internet of things
IOU Investor-owned utility
IPv6/v4 Internet protocol version 6/4
JV Joint venture
KPI Key performance indicator
MDMS Meter data management system
NB-IoT Narrowband IoT
OTA Over the air
OWC Operating working capital
PP Public Power
PUC Public utility commission
PV Photovoltaic
REC Rural electric cooperative
RF Radiofrequency
SaaS Software as a service
SCADA Supervisory control and data acquisition
SMETS Smart metering equipment technical specifications
TOU Time-of-use
TSP Transitional simplified procedures
WTO World trade organization
Reference: IHS Markit technology research (Informa Tech) - Smart Utility Meter Intelligence
Service, 2019. Market share based on unit shipments. Results are not an endorsement of
Landis+Gyr AG. Any reliance on these results is at the third-party’s own risk

77 | © Landis+Gyr | January 27, 2020 | Capital Markets Day
Dates and Contacts
Release of FY 2019 Results:
May 6, 2020
Publication of
Annual Report 2019:
May 28, 2020
Annual General Meeting:
June 30, 2020
Casino Theater, Zug
Release of H1 FY 2020 Results:
October 28, 2020
Important Dates CMD DocumentsContact Investor
Relations
Stan March – New York
SVP Group Communications
and Investor Relations
Phone +1 678 258 1321
Christian Waelti – Zug
Phone +41 41 935 6331
www.landisgyr.com/investors