gun violence in chicago, 2016 - uchicago urban labs · pdf file2 gun violence in chicago, 2016...
TRANSCRIPT

GUN VIOLENCEIN CHICAGO, 2016

2
GUN VIOLENCE IN CHICAGO, 2016January 2017
University of Chicago Crime Lab1
Acknowledgments: The University of Chicago Crime Lab is a privately-funded, independent, non-partisan academic research center founded in 2008 to help cities identify the most effective and humane ways to control crime and violence, and reduce the harms associated with the administration of criminal justice. We are grateful to the Chicago Police Department for making available the data upon which this report is based, to Ben Hansen for help assembling data on Chicago weather patterns, and to Aaron Chalfin, Philip Cook, Aurélie Ouss, Harold Pollack, and Shari Runner for valuable comments. We thank the Joyce Foundation, the John D. and Catherine T. MacArthur Foundation, the McCormick Foundation, and the Pritzker Foundation for support of the University of Chicago Crime Lab and Urban Labs, as well as Susan and Tom Dunn, and Ira Handler. All opinions and any errors are our own and do not necessarily reflect those of our funders or of any government agencies.
1 This report was produced by Max Kapustin, Jens Ludwig, Marc Punkay, Kimberley Smith, Lauren Speigel, and David Welgus, with theinvaluable assistance of Roseanna Ander, Nathan Hess, and Julia Quinn. Please direct any comments and questions to [email protected].

3
INTRODUCTIONA total of 764 people were murdered in Chicago in 2016. They were sons, brothers, and fathers; sisters, daughters, and mothers; they were, as the title of The New York Times reporter Fox Butterfield’s book on urban violence noted, All God’s Children. This report represents a first step towards understanding what happened with the goal of helping the city of Chicago prevent another year like the one that just passed.
We draw on data obtained from the Chicago Police Department (CPD) and other sources to provide a more complete picture of the change in our city’s crime problem in 2016. Our analysis highlights a number of key facts that are important for understanding what happened, but also raises some new puzzles as well. While this report focuses on establishing basic facts and avoids delving too deeply into solutions, we will continue to partner with policymakers, the civic community, and local nonprofits to identify promising approaches for moving forward. We plan to share our thinking about how to reduce violence in Chicago, informed by the best available data and research, in other venues in the future.
Between 2015 and 2016, Chicago experienced 58 percent more homicides and 43 percent more non-fatal shootings. Annual increases of this size are not unprecedented among American cities, particularly in recent years, but are rare for a city of Chicago’s size. One striking feature of Chicago’s increase in gun violence is how sudden it was: as of December 2015, there was no indication that gun violence was on the verge of rising sharply. But in January 2016, homicides and shootings surged relative to their 2015 levels and remained higher in almost every month that followed, threatening 20 years of progress on violent crime in Chicago. This increase was mostly in gun crimes; other crimes did not change by nearly as much.
The characteristics of homicide were generally similar in 2016 and 2015; what changed in Chicago was not so much the nature of our violence problem, but rather its prevalence. Most murders involved guns, occurred in public places, and stemmed from what police believe was some sort of altercation. This violence continues to be very regressive in its impact, disproportionately affecting the city’s most disadvantaged residents. Most gun violence victims and suspects were African American men, more often than not having had some prior encounter with the criminal justice system.
Compared to other cities, a larger share of homicide suspects in Chicago consists of adolescents, although the majority of all homicide suspects are in their 20s or older. The increase in gun violence occurred disproportionately in several disadvantaged neighborhoods on the city’s South and West sides, which now account for an even larger share of the city’s homicides. Another change is that from 2015 to 2016, the share of homicides that CPD believes stemmed from an altercation, as well as the share of homicide offenders who were recorded by CPD as having a gang affiliation, seemed to decline.
What caused Chicago’s sudden surge in gun violence in 2016 remains a puzzle. Weather cannot explain the surge in homicides and shootings, since monthly temperatures in 2016 were close to their historical averages. City spending on social services and public education did not change much in 2016 compared to previous years, and while the state budget impasse disrupted funding for many community organizations, this did not seem to change sharply in December 2015.
4
Most relevant measures of police activity did not change abruptly enough to explain the surge in gun violence. Overall arrests declined in 2016, driven by narcotics arrests, but arrests for violent crimes, including homicides and shootings, barely changed. One policing measure that declined was the chance of arrest for homicides and shootings (the “clearance rate”), which was a result of arrests for these crimes not keeping pace with the increase in gun violence. Another policing measure that declined was the number of investigatory street stops. However, for this to explain why shootings increased in Chicago would also require an explanation for why the previous dramatic decline in street stops in New York City did not lead to more gun violence there.
We also cannot know the effect of factors not measurable in the available data, such as any change in street gangs or the use of social media. However, given the timing of the recent increase in gun violence, for any alternative explanation to make sense it would need to involve something that changed abruptly near the end of 2015 and disproportionately affected gun crimes.
Not knowing the definitive cause of Chicago’s sudden and substantial increase in gun violence does not mean the city should be paralyzed in crafting a response. The solution to a problem need not be the opposite of its cause. One key implication of these data is the importance of a policy response that is focused on the core problem: violence concentrated largely in a moderate number of our most disadvantaged neighborhoods, carried out by teens and young adults in public places with illegally owned, and perhaps increasingly lethal, firearms.

5
CHICAGO’S CRIME IN 2016: WHAT HAPPENED?Chicago’s homicide rate increased substantially in 2016 relative to 2015.The city recorded 764 homicides last year, an increase of 58 percent from 2015.2
Source: Crime Lab analysis of CPD records
To put this increase into context, the homicide rate in Chicago reached its recent peak in the early 1990s—the height of the nationwide crack cocaine epidemic—at 33 per 100,000. Since then it has declined by more than half, reaching a low of almost 15 per 100,000 in 2014. The increase in our homicide rate the past two years (from 15.1 to 27.8 per 100,000) has eroded approximately two thirds of the decrease Chicago experienced since the early 1990s.
Source: Federal Bureau of Investigations (FBI) Uniform Crime Reports (UCR), Crime Lab analysis of CPD records
2 We calculated 764 homicides in 2016 using data current as of January 11, 2017. Media reports on or around January 1, 2017 referenced 762 homicides in 2016. The discrepancy reflects the fact that the underlying data change as additional information is incorporated.
0
5
10
15
20
25
30
35
1985 1990 1995 2000 2005 2010 2015
Hom
icid
es p
er 10
0,0
00
Figure 2: Homicide Rate in Chicago, 1985-2016
15.12014
27.82016
437 437506
421 416485
764
2010 2011 2012 2013 2014 2015 2016
Figure 1: Homicide Victims in Chicago, 2010-2016

6
The size of Chicago’s increase in homicides is not unprecedented, but is rare for a city its size.In 2015, the U.S. experienced the largest single year increase in its homicide rate since 1990, according to the most recently available data from the FBI.3 In that year, cities like Baltimore, Milwaukee, and Washington, D.C. saw their homicide rates grow at least as fast as Chicago’s did in 2016. Early indications suggest that homicide rates also increased in many other cities around the U.S. in 2016.4 However, all of the cities that experienced one- or two-year increases in gun violence as large as Chicago’s have much smaller populations than ours. None of the other five largest cities in the U.S.—Houston, Los Angeles, New York City, and Philadelphia, in addition to Chicago—has witnessed a single-year homicide increase over the past 25 years that rivals Chicago’s increase in 2016.
3 The national homicide rate in 2015 rose from 4.4 to 4.9 per 100,000, and is now at approximately the same level as it was in 2010, still well below the peak of 10.2 per 100,000 recorded in 1980.
4 http://www.wsj.com/articles/homicides-rose-in-most-big-cities-this-year-1482402602
0
10
20
30
40
50
60
70
80
90
198
5
198
6
198
7
198
8
198
9
199
0
199
1
199
2
199
3
199
4
199
5
199
6
199
7
199
8
199
9
200
0
200
1
200
2
200
3
200
4
200
5
200
6
200
7
200
8
200
9
2010
2011
2012
2013
2014
2015
2016
Hom
icid
es p
er 10
0,0
00
Figure 3: Homicide Rates, Chicago and East Coast Cities, 1985-2016
Chicago Baltimore Washington, D.C.
0
10
20
30
40
50
60
70
80
198
5
198
6
198
7
198
8
198
9
199
0
199
1
199
2
199
3
199
4
199
5
199
6
199
7
199
8
199
9
200
0
200
1
200
2
200
3
200
4
200
5
200
6
200
7
200
8
200
9
2010
2011
2012
2013
2014
2015
2016
Hom
icid
es p
er 10
0,0
00
Figure 4: Homicide Rates, Chicago and Midwest Cities, 1985-2016
Chicago Milwaukee Detroit St. Louis

7
Source: FBI UCR, Crime Lab analysis of CPD records
Chicago is an outlier with respect to total homicides but not homicide rates per capita. Chicago has more total homicides than any other U.S. city because of its size combined with its higher homicide rate per capita relative to that of the other largest cities in the country. But compared to all cities in the U.S., Chicago’s homicide rate per 100,000 residents is about in the middle of the pack. Even after its recent increase, Chicago’s homicide rate remains lower than that of (smaller) cities like Detroit, New Orleans, or St. Louis.
0
5
10
15
20
25
30
35
40
198
5
198
6
198
7
198
8
198
9
199
0
199
1
199
2
199
3
199
4
199
5
199
6
199
7
199
8
199
9
200
0
200
1
200
2
200
3
200
4
200
5
200
6
200
7
200
8
200
9
2010
2011
2012
2013
2014
2015
2016
Hom
icid
es p
er 10
0,0
00
Figure 5: Homicide Rates, Chicago and Large Cities, 1985-2016
Chicago Los Angeles New York Houston Philadelphia

8
Chicago’s homicide increase was sudden and sustained.As recently as December 2015, nothing in the data foreshadowed what would happen in 2016. Homicides in December 2015 were actually down slightly from December 2014, consistent with the larger pattern that we have seen in recent years where some months have more homicides than the same month in the prior year, while other months have fewer.5 Chicago’s increase in homicides began suddenly in January 2016, when the number of victims rose by 67 percent from January of the year before. Almost each month that followed in 2016 saw more homicides compared to the same month in 2015.6
Source: Crime Lab analysis of CPD records
5 The number of homicide victims in March 2012 (52) represented a 126 percent increase over the number in March 2011 (23). Chicago experienced a mild winter in 2012, to which experts partially attributed this increase. http://www.npr.org/2012/05/16/152852264/experts-stumped-by-chicagos-soaring-homicide-rate
6 We focus on year-to-year changes in each month to avoid confusing a change in the trend over time in gun violence (shootings are up or down this year compared to last year) with seasonal effects (over the course of any given year, gun violence usually increases in the warmer months and decreases in the colder months). For more details see the Appendix.
-100%
-50%
0%
50%
100%
150%
200%
1/0
0
1/0
1
1/0
2
1/0
3
1/0
4
1/0
5
1/0
6
1/0
7
1/0
8
1/0
9
1/10 1/11
1/12
1/13
1/14
1/15
1/16
Figure 6: Homicide Victims: Percent Change Compared to Prior Year, 2000-2016

9
Chicago’s increase in homicides in 2016 was due mostly to additional gun homicides. In 2016, 90 percent of the city’s homicides were committed with a firearm, up from 88 percent in 2015. By comparison, the share of homicides committed with a firearm in 2016 was 58 percent in New York City, 72 percent in Los Angeles, 80 percent in Houston, and 84 percent in Philadelphia.
Source: Crime Lab analysis of CPD records
Gun homicides drive the difference between higher- and lower-homicide cities. Most of the difference in overall homicide rates across the five largest U.S. cities is driven by the difference in their gun homicide rates. The non-gun homicide rate is much more similar across these cities. The reason Chicago has a high overall homicide rate is entirely due to its elevated gun homicide rate.
Source: Crime Lab analysis of police department records
88% 90%
0%
20%
40%
60%
80%
100%
2015 2016
Figure 7: Homicides Involving a Firearm, 2015 vs. 2016
2.7 1.6 2.1 2.7 2.7
25.1
2.35.3
10.614.7
0
4
8
12
16
20
24
28
32
Chicago New York Los Angeles Houston Philadelphia
Hom
icid
es p
er 10
0,0
00
Figure 8: Gun and Non-gun Homicide Rates, 2016
Non-gun Homicide Rate Gun Homicide Rate

10
Gun crimes increased much more rapidly than did non-gun crimes in 2016.The crime increase Chicago experienced in 2016 occurred disproportionately among offenses that involved a firearm: gun homicides, non-fatal shootings, and gun robberies.7 The fact that gun robberies increased alongside other forms of gun violence may suggest the increase in 2016 was not driven exclusively by gang feuds or altercations, since robberies typically also have a financial motivation. The increase from 2015 to 2016 was, for the most part, much smaller (in percentage terms) for crimes that did not involve guns, including violent crimes with no gun involvement and property crimes.
Though non-gun homicides increased by 31 percent, since relatively few occur each year even small absolute changes can yield large percentage changes: from 2015 to 2016, there were 18 additional non-gun homicides (from 59 to 77), compared to 261 additional gun homicides (from 426 to 687). This suggests that what happened in Chicago in 2016 was less about an overall increase in the prevalence of anti-social or criminal behavior, but more about a focused increase in gun violence.
Source: Crime Lab analysis of CPD records
61%
43%
26%31%
10%6%
0%
10%
20%
30%
40%
50%
60%
70%
Gun Homicide Shooting Gun Robbery Non-gun Homicide
Non-gun Violent
Property (Incidents)
Figure 9: Gun and Non-gun Crime Victims:Percent Change, 2015-2016
7 For information on how non-fatal shootings and other crimes referenced in this report are defined, please see the Appendix.
11
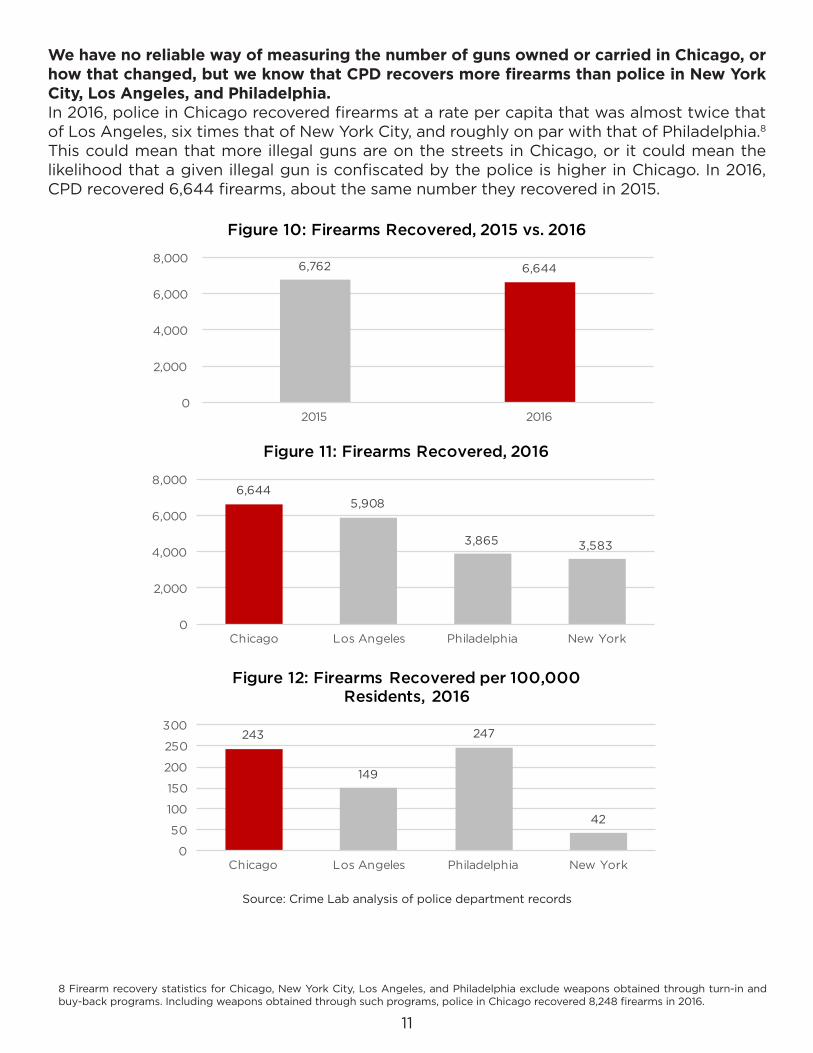
We have no reliable way of measuring the number of guns owned or carried in Chicago, or how that changed, but we know that CPD recovers more firearms than police in New York City, Los Angeles, and Philadelphia.In 2016, police in Chicago recovered firearms at a rate per capita that was almost twice that of Los Angeles, six times that of New York City, and roughly on par with that of Philadelphia.8 This could mean that more illegal guns are on the streets in Chicago, or it could mean the likelihood that a given illegal gun is confiscated by the police is higher in Chicago. In 2016, CPD recovered 6,644 firearms, about the same number they recovered in 2015.
Source: Crime Lab analysis of police department records
6,762 6,644
0
2,000
4,000
6,000
8,000
2015 2016
Figure 10: Firearms Recovered, 2015 vs. 2016
8 Firearm recovery statistics for Chicago, New York City, Los Angeles, and Philadelphia exclude weapons obtained through turn-in and buy-back programs. Including weapons obtained through such programs, police in Chicago recovered 8,248 firearms in 2016.
6,6445,908
3,865 3,583
0
2,000
4,000
6,000
8,000
Chicago Los Angeles Philadelphia New York
Figure 11: Firearms Recovered, 2016
243
149
247
42
0
50
100
150
200
250
300
Chicago Los Angeles Philadelphia New York
Figure 12: Firearms Recovered per 100,000 Residents, 2016

12
The data also show that the types of guns recovered by CPD are changing.A growing share of firearms recovered in Chicago consists of 9mm and .40 caliber handguns, which accommodate larger-diameter ammunition than .22 caliber weapons.9 These larger-caliber handguns also often support higher-capacity magazines that allow more ammunition to be fired without reloading. The combination of larger ammunition and greater magazine capacity may combine to make these weapons increasingly lethal, although there remains some uncertainty on this point. This trend was also highlighted in a 2014 report released by the Office of the Mayor of the City of Chicago, and recent reporting by The Baltimore Sun and The Trace.10
Source: Crime Lab analysis of CPD records
0%
5%
10%
15%
20%
25%
30%
35%
2001 2002 2003 2004 2005 2006 2007 2008 2009 2010 2011 2012 2013 2014 2015 2016
Figure 13: Firearm Recoveries by Caliber, 2001-2016
.22 in 9mm .40 in
9 Figure 13 reports the fraction of 9mm, .40 caliber, and .22 caliber firearms submitted by Chicago police for tracing through mid-2016. Firearms of other calibers submitted for tracing are omitted from the figure for clarity. The vast majority of .22 caliber firearms submitted for tracing consists of handguns, and are distinct from firearms able to fire .223 caliber rounds such as the AR-15, M16, and M4 rifles.
10 https://www.cityofchicago.org/content/dam/city/depts/mayor/Press%20Room/Press%20Releases/2014/May/05.27.14CPDReport.pdf, http://data.baltimoresun.com/news/shoot-to-kill/, https://www.thetrace.org/2016/12/americas-obsession-powerful-handguns-rising- gunshot-lethality/

13
HOW DID GUN VIOLENCE CHANGE IN 2016?Most available measures that describe the circumstances, victims, and offenders of gun violence in Chicago suggest that the character of the problem did not change much from 2015 to 2016, simply the volume. That is, Chicago for the most part experienced a broad increase in all the same types of shootings that the city has experienced in years past.
African Americans continue to be overrepresented among Chicago’s homicide victims. Although African Americans comprise about one-third of the city’s population, they made up almost 80 percent of homicide victims in both 2015 and 2016. This phenomenon is even more acute among African American men aged 15 to 34, who made up over half of the city’s homicide victims despite accounting for just 4 percent of the city’s population. In contrast, whites comprise about one-third of the city’s population but make up approximately 5 percent of its homicide victims.
Most homicide victims were in their 20s and 30s.In 2015, almost half of homicide victims (48 percent) were between the ages of 20 and 29, decreasing to 45 percent in 2016.
Sources: Crime Lab analysis of CPD records
79%
16%
4%
78%
16%
5%
0%10%20%30%40%50%60%70%80%90%
African American Hispanic White
Figure 14: Homicide Victims by Race, 2015 vs. 2016
2015 2016
17%
48%
19%16%
19%
45%
22%
14%
0%
10%
20%
30%
40%
50%
60%
10-19 20-29 30-39 40-64
Figure 15: Ages of Homicide Victims, 2015 vs. 2016
2015 2016

14
Most homicide victims had prior contact with the criminal justice system. Around 80 percent of Chicago’s homicide victims in 2015 and 2016 had at least one prior arrest, almost 40 percent had a prior violent crime arrest, and almost 30 percent had a prior gun arrest. Nearly 40 percent of victims had more than 10 prior arrests, while the share with more than 20 prior arrests rose from 14 to 18 percent in 2016. The share of victims with a current or prior gang affiliation as recorded by CPD was about the same in both years (53 and 54 percent).
Most gun violence occurs in public places.In 2016, 77 percent of gun homicides and shootings took place on the street or in an alley, up from 75 percent in 2015.
Sources: Crime Lab analysis of CPD records
79%
36%27%
38%
14%
79%
38%26%
38%
18%
0%
20%
40%
60%
80%
100%
Prior arrest Prior violent crime arrest
Prior gun arrest
>10 prior arrests
>20 prior arrests
Figure 16: Homicide Victims:Prior Arrests, 2015 vs. 2016
2015 2016
53% 54%
0%
20%
40%
60%
2015 2016
Figure 17: Homicide Victims: Gang Affiliation, 2015 vs. 2016
75%
12%5% 2% 5%
77%
10%5% 2% 5%
0%
20%
40%
60%
80%
100%
Street/Alley House/Residence Auto Parking Lot/Garage
Other
Figure 18: Locations of Gun Homicide and Shooting Incidents, 2015 vs. 2016
2015 2016
15
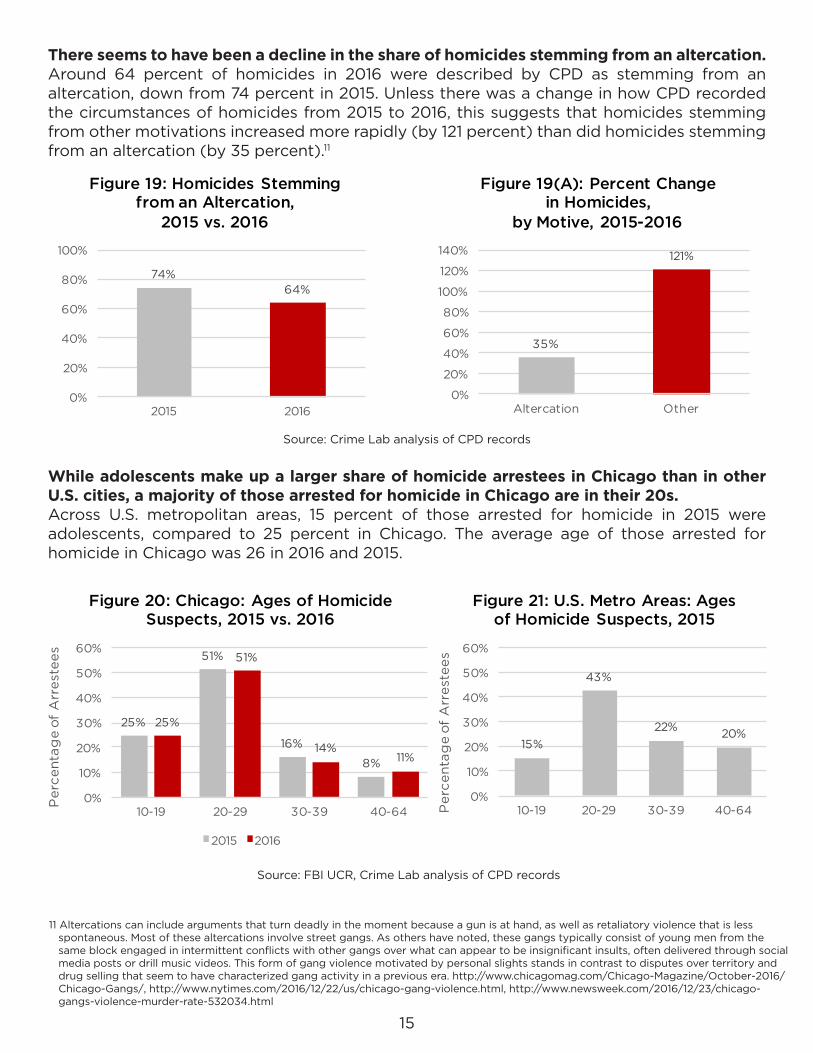
There seems to have been a decline in the share of homicides stemming from an altercation. Around 64 percent of homicides in 2016 were described by CPD as stemming from an altercation, down from 74 percent in 2015. Unless there was a change in how CPD recorded the circumstances of homicides from 2015 to 2016, this suggests that homicides stemming from other motivations increased more rapidly (by 121 percent) than did homicides stemming from an altercation (by 35 percent).11
Source: Crime Lab analysis of CPD records
While adolescents make up a larger share of homicide arrestees in Chicago than in other U.S. cities, a majority of those arrested for homicide in Chicago are in their 20s. Across U.S. metropolitan areas, 15 percent of those arrested for homicide in 2015 were adolescents, compared to 25 percent in Chicago. The average age of those arrested for homicide in Chicago was 26 in 2016 and 2015.
Source: FBI UCR, Crime Lab analysis of CPD records
74%64%
0%
20%
40%
60%
80%
100%
2015 2016
Figure 19: Homicides Stemming from an Altercation,
2015 vs. 2016
35%
121%
0%
20%
40%
60%
80%
100%
120%
140%
Altercation Other
Figure 19(A): Percent Change in Homicides,
by Motive, 2015-2016
11 Altercations can include arguments that turn deadly in the moment because a gun is at hand, as well as retaliatory violence that is lessspontaneous. Most of these altercations involve street gangs. As others have noted, these gangs typically consist of young men from the same block engaged in intermittent conflicts with other gangs over what can appear to be insignificant insults, often delivered through social media posts or drill music videos. This form of gang violence motivated by personal slights stands in contrast to disputes over territory and drug selling that seem to have characterized gang activity in a previous era. http://www.chicagomag.com/Chicago-Magazine/October-2016/Chicago-Gangs/, http://www.nytimes.com/2016/12/22/us/chicago-gang-violence.html, http://www.newsweek.com/2016/12/23/chicago-gangs-violence-murder-rate-532034.html
25%
51%
16%
8%
25%
51%
14%11%
0%
10%
20%
30%
40%
50%
60%
10-19 20-29 30-39 40-64
Per
cent
age
of A
rres
tees
Figure 20: Chicago: Ages of Homicide Suspects, 2015 vs. 2016
2015 2016
15%
43%
22% 20%
0%
10%
20%
30%
40%
50%
60%
10-19 20-29 30-39 40-64Per
cent
age
of A
rres
tees
Figure 21: U.S. Metro Areas: Ages of Homicide Suspects, 2015

16
Gun violence suspects continue to be people with extensive prior criminal records.12 Individuals arrested for a homicide or shooting in Chicago in 2016 and 2015 had similar prior criminal records: around 90 percent had at least one prior arrest, approximately 50 percent had a prior arrest for a violent crime specifically, and almost 40 percent had a prior gun arrest. The average person arrested for a homicide or shooting in both years had nearly 12 prior arrests, with almost 45 percent having had more than 10 prior arrests, and almost 20 percent having had more than 20 prior arrests.
Source: FBI UCR, Crime Lab analysis of CPD records
Gun violence involving those not in gangs increased more rapidly than those committed by gang-affiliated people.The share of offenders with a current or prior gang affiliation, as noted by CPD, declined from 73 percent in 2015 to 67 percent in 2016, suggesting that individuals not affiliated with gangs may have been overrepresented among those driving the increase in violence. The number of gang-affiliated individuals arrested for gun violence decreased by 6 percent in 2016 relative to 2015, while the number without a gang affiliation rose by 25 percent. While data on gang affiliations are inherently imperfect, we have no reason to believe at this point in time that the way CPD measured and recorded gang affiliation changed substantially in 2016 relative to 2015.
Source: Crime Lab analysis of CPD records
73%67%
0%
20%
40%
60%
80%
2015 2016
Figure 23: Homicide and Shooting Suspects:
Gang Affiliation, 2015 vs. 2016
12 Most gun violence perpetrators remain unidentified (as discussed later in this report, there is no suspect arrested in the majority of homicides and shootings), so the extensive criminal records of known suspects may not be representative of all perpetrators. The number of individuals arrested for a homicide or shooting in 2015 and 2016 are 529 and 542, respectively.
-6%
25%
-20%
-10%
0%
10%
20%
30%
Gang affiliated Not gang affiliated
Figure 23(A): Percent Change in Homicide and Shooting
Suspects, by Gang Affiliation, 2015-2016
92%
50%39% 43%
16%
88%
48%35%
44%
19%
0%
20%
40%
60%
80%
100%
Prior arrest Prior violent crime arrest
Prior gun arrest >10 prior arrests >20 prior arrests
Figure 22: Homicide and Shooting Suspects:Prior Arrests, 2015 vs. 2016
2015 2016

17
Chicago’s homicide increase was disproportionately concentrated in neighborhoods that have historically been among the city’s most disadvantaged.Of Chicago’s 77 community areas, 46 recorded more homicides in 2016 than 2015, while 31 recorded fewer or the same number.13 In neighborhoods where homicide increased—primarily on the city’s South and West Sides—almost 27 percent of the population lives below the poverty level, compared to 17 percent in neighborhoods where homicide decreased or remained the same, and 13.5 percent nationally.14 Despite containing only 9 percent of Chicago’s population, the five neighborhoods with the largest homicide increases—Austin, Englewood, New City, West Englewood, and Greater Grand Crossing—accounted for 32 percent of homicides in 2016, up from 25 percent in 2015. These five neighborhoods alone account for nearly half (45 percent) of the city’s overall homicide increase.15
Figure 24: Homicide Rates in Chicago
Source: Crime Lab analysis of CPD records
1 ROGERS PARK 17 DUNNING 33 NEAR SOUTH SIDE 49 ROSELAND 65 WEST LAWN 2 WEST RIDGE 18 MONTCLARE 34 ARMOUR SQUARE 50 PULLMAN 66 CHICAGO LAWN 3 UPTOWN 19 BELMONT CRAGIN 35 DOUGLAS 51 SOUTH DEERING 67 WEST ENGLEWOOD 4 LINCOLN SQUARE 20 HERMOSA 36 OAKLAND 52 EAST SIDE 68 ENGLEWOOD 5 NORTH CENTER 21 AVONDALE 37 FULLER PARK 53 WEST PULLMAN 69 GREATER GRAND CROSSING 6 LAKE VIEW 22 LOGAN SQUARE 38 GRAND BOULEVARD 54 RIVERDALE 70 ASHBURN 7 LINCOLN PARK 23 HUMBOLDT PARK 39 KENWOOD 55 HEGEWISCH 71 AUBURN GRESHAM 8 NEAR NORTH SIDE 24 WEST TOWN 40 WASHINGTON PARK 56 GARFIELD RIDGE 72 BEVERLY 9 EDISON PARK 25 AUSTIN 41 HYDE PARK 57 ARCHER HEIGHTS 73 WASHINGTON HEIGHTS 10 NORWOOD PARK 26 WEST GARFIELD PARK 42 WOODLAWN 58 BRIGHTON PARK 74 MOUNT GREENWOOD 11 JEFFERSON PARK 27 EAST GARFIELD PARK 43 SOUTH SHORE 59 MCKINLEY PARK 75 MORGAN PARK 12 FOREST GLEN 28 NEAR WEST SIDE 44 CHATHAM 60 BRIDGEPORT 76 OHARE 13 NORTH PARK 29 NORTH LAWNDALE 45 AVALON PARK 61 NEW CITY 77 EDGEWATER 14 ALBANY PARK 30 SOUTH LAWNDALE 46 SOUTH CHICAGO 62 WEST ELSDON 15 PORTAGE PARK 31 LOWER WEST SIDE 47 BURNSIDE 63 GAGE PARK 16 IRVING PARK 32 LOOP 48 CALUMET HEIGHTS 64 CLEARING
13 Data on each community area’s homicides in 2015 and 2016 are presented in the Appendix.14 http://www.census.gov/content/dam/Census/library/publications/2016/demo/p60-256.pdf15 This calculation accounts for the fact that some neighborhoods experienced homicide declines from 2015 to 2016, while others experienced increases. These five neighborhoods accounted for 40 percent of the total increase among only those neighborhoods that experienced homicide increases from 2015 to 2016.

18
WHAT CAUSED CHICAGO’S HOMICIDE INCREASE? THE UNSOLVED PUZZLEMany candidate explanations have been offered for why crime—and gun crime in particular—increased in Chicago so sharply in 2016. Our review of news articles published in both local and national outlets offers a wide-ranging list of claims:16 fractured gang hierarchies and rivalries; high rates of neighborhood poverty and segregation; an influx of guns from other places; insufficient penalties for illegal gun-carrying; social media disputes; demolition of public housing; a lack of resources devoted to solving serious crimes; police department management and manpower; reduced police activity; changes in city and state funding for social services and other core government functions; the absence of family involvement in the lives of youth; closing of mental health clinics; and weather.
However, the fact that Chicago’s increase in gun violence happened so suddenly at the start of 2016 would seem to cast doubt on many of these explanations, which often focus on factors that did not change much from 2015 to 2016. For example, Chicago’s proximity to Indiana, Alabama, and Mississippi—states with less restrictive gun laws where many of the weapons used in crimes in Chicago are initially purchased—did not change abruptly at the end of 2015. Nor were there abrupt changes to important but generally slow-moving social conditions, such as the city’s poverty rate or level of neighborhood economic and racial segregation. And while some important social conditions have changed in Chicago quite sharply at particular points in time—for example, the demolition of highly distressed public housing projects such as the Robert Taylor Homes and Cabrini-Green—the timing of those events does not fit with the recent increase.17
We focus here on hypotheses that could potentially explain the timing of the gun violence increase—that is, why homicides and shootings increased so suddenly in early 2016—and for which we are able to bring some data to bear. We unfortunately cannot say much about candidate explanations for which there is little relevant data. For example, factors such as shifting gang structures, rivalries, and disputes, or changes in the use of social media by Chicago gangs, could in principle have played a role in driving the city’s recent increase in violence, but because we are unable to measure these factors we do not know whether or how they changed from 2015 to 2016. In what follows we explore what the available data can tell us about what explanations might matter, and which ones clearly do not.
16 We surveyed major news outlets for pieces written in 2016 that offered at least one explanation for Chicago’s homicide and gun violence increase that year. We limited our search to the top 10 print news outlets by readership (USA Today, The New York Times, The Wall Street Journal, Los Angeles Times, New York Post, Chicago Tribune, The Washington Post, Newsday, Daily News, amNewYork), local publications (Chicago Sun-Times, DNAinfo Chicago, The Trace), news magazines (The New Yorker, Newsweek, Newsday, Forbes), and non-print sources (FiveThirtyEight, NPR, Slate, The Root, WBEZ, US News, Vice News).17 For example, the demolition of these housing projects concluded in 2007 and 2011, respectively.

19
This is not about weather. Conventional wisdom among both residents and front-line practitioners is that warmer weather leads to more crime, and inclement weather to less crime. This conventional wisdom is also supported by social science research.18 However, the available data offer no evidence that unusual weather patterns contributed to Chicago’s surge in gun violence in 2016. This past year was only slightly warmer than the historical average, and many of the months in 2016 that showed large year-to-year increases in homicides had temperatures almost exactly equal to that month’s historical average.
Source: National Oceanic and Atmospheric Administration, Crime Lab analysis of CPD records
18 Brian Jacob, Lars Lefgren, and Enrico Moretti (2007). “The Dynamics of Criminal Behavior: Evidence from Weather Shocks.” Journal of Human Resources, 42(3) 489-527. See also the Appendix to Jillian Carr and Jennifer Doleac (2016). “Keep the kids inside? Juvenile curfews and urban gun violence,” UVA Working paper, http://jenniferdoleac.com/wp-content/uploads/2015/03/Carr_Doleac_ ShotSpotter_Curfew.pdf
0
10
20
30
40
50
60
70
80
-100%
-75%
-50%
-25%
0%
25%
50%
75%
100%
125%
150%
175%
200%
1/13
2/13
3/1
34
/13
5/1
36
/13
7/13
8/1
39
/13
10/1
311
/13
12/1
31/
142/
143
/14
4/1
45
/14
6/1
47/
148
/14
9/1
410
/14
11/1
412
/14
1/15
2/15
3/1
54
/15
5/1
56
/15
7/15
8/1
59
/15
10/1
511
/15
12/1
51/
162/
163
/16
4/1
65
/16
6/1
67/
168
/16
9/1
610
/16
11/1
612
/16
Tem
per
atur
e (F
)
Hom
icid
e V
icti
ms
% C
hang
e
Figure 25: Homicide Victims: Percent Change Compared to Prior Year, Monthly and Historical Temperature
Monthly Temperature Historical Temperature
2013 2014 2015 2016
20
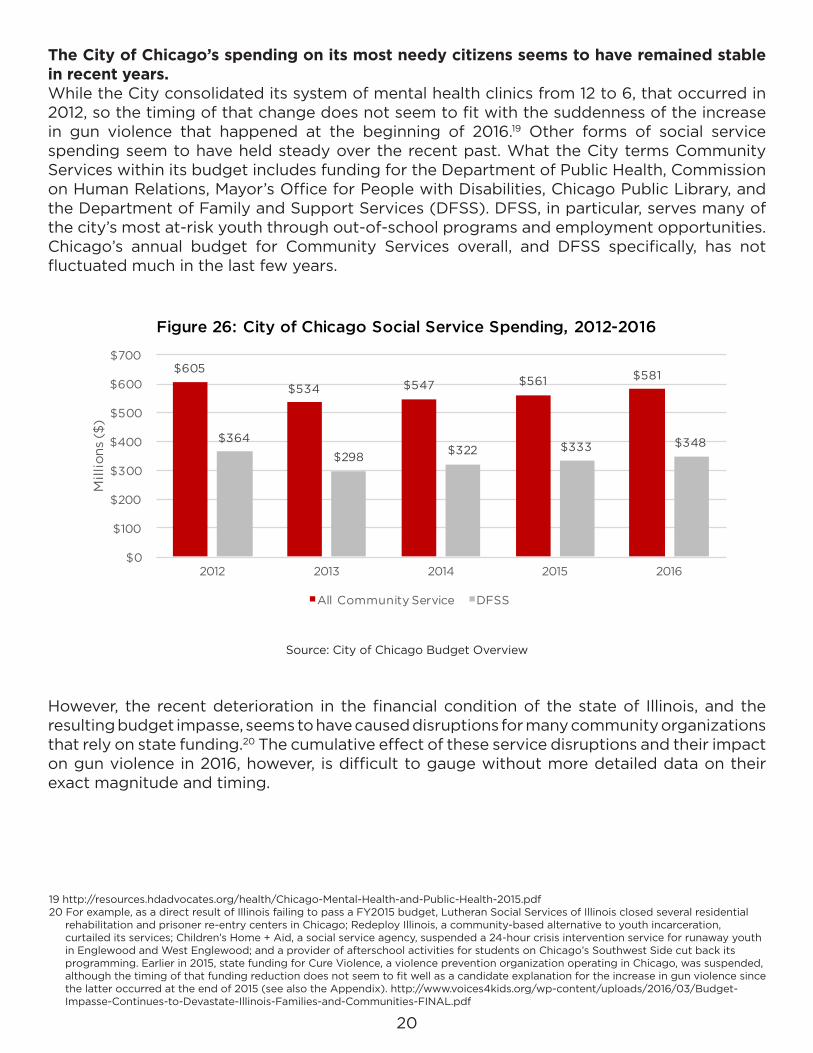
The City of Chicago’s spending on its most needy citizens seems to have remained stable in recent years.While the City consolidated its system of mental health clinics from 12 to 6, that occurred in 2012, so the timing of that change does not seem to fit with the suddenness of the increase in gun violence that happened at the beginning of 2016.19 Other forms of social service spending seem to have held steady over the recent past. What the City terms Community Services within its budget includes funding for the Department of Public Health, Commission on Human Relations, Mayor’s Office for People with Disabilities, Chicago Public Library, and the Department of Family and Support Services (DFSS). DFSS, in particular, serves many of the city’s most at-risk youth through out-of-school programs and employment opportunities. Chicago’s annual budget for Community Services overall, and DFSS specifically, has not fluctuated much in the last few years.
Source: City of Chicago Budget Overview
However, the recent deterioration in the financial condition of the state of Illinois, and the resulting budget impasse, seems to have caused disruptions for many community organizations that rely on state funding.20 The cumulative effect of these service disruptions and their impact on gun violence in 2016, however, is difficult to gauge without more detailed data on their exact magnitude and timing.
19 http://resources.hdadvocates.org/health/Chicago-Mental-Health-and-Public-Health-2015.pdf20 For example, as a direct result of Illinois failing to pass a FY2015 budget, Lutheran Social Services of Illinois closed several residential
rehabilitation and prisoner re-entry centers in Chicago; Redeploy Illinois, a community-based alternative to youth incarceration, curtailed its services; Children’s Home + Aid, a social service agency, suspended a 24-hour crisis intervention service for runaway youth in Englewood and West Englewood; and a provider of afterschool activities for students on Chicago’s Southwest Side cut back its programming. Earlier in 2015, state funding for Cure Violence, a violence prevention organization operating in Chicago, was suspended, although the timing of that funding reduction does not seem to fit well as a candidate explanation for the increase in gun violence since the latter occurred at the end of 2015 (see also the Appendix). http://www.voices4kids.org/wp-content/uploads/2016/03/Budget-Impasse-Continues-to-Devastate-Illinois-Families-and-Communities-FINAL.pdf
$605
$534 $547 $561 $581
$364
$298 $322 $333 $348
$0
$100
$200
$300
$400
$500
$600
$700
2012 2013 2014 2015 2016
Mill
ions
($)
Figure 26: City of Chicago Social Service Spending, 2012-2016
All Community Service DFSS

21
Chicago’s spending on public schools did not appear to change dramatically.Instructional spending per student in the Chicago Public Schools system declined slightly during the 2015-16 academic year, though the high school cohort graduation rate rose gradually in recent years. There is no evidence in the available data that a collapse in education spending or performance in Chicago public schools contributed to the 2016 homicide increase.
Source: Chicago Public Schools
$8,294 $7,970
$8,458 $8,586 $8,291
$0
$2,000
$4,000
$6,000
$8,000
$10,000
0%
20%
40%
60%
80%
2011-12 2012-13 2013-14 2014-15 2015-16
Inst
ruct
iona
l Sp
end
ing
per
Pup
il
Gra
dua
tion
Rat
e
Figure 27: Chicago Public Schools Spending & Graduation Rate, 2012-2016
Instructional Spending per Pupil Graduation Rate

22
Arrests were down in 2016, although this decline was concentrated among drug arrests. In 2016, Chicago police made 24 percent fewer arrests than in 2015, accelerating the steady downward trend in arrests the city has seen in recent years. However, this overall reduction in arrests seems to have been driven largely by a decline in arrests for drug offenses, which fell by 44 percent from 2015 to 2016.21 Arrests for property and violent crimes did not decline as much, and arrests for homicides and shootings actually rose by 3 and 4 percent, respectively, while arrests for illegal gun possession remained largely unchanged.
Source: Crime Lab analysis of CPD records
21 Two recent legislative changes affecting narcotics arrests by Chicago police include the enactment of local and state measures decriminalizing possession of small amounts of marijuana. The City enacted its measure, which reduced the penalty for possessing 15 grams or less of marijuana to a ticket of $250-$500, in August 2012. The state law, Illinois SB2228, was signed in July 2016 and introduced penalties of $100-$200 for possession of up to 10 grams of marijuana.
0
5,000
10,000
15,000
20,000
Figure 28: Monthly Total Arrests, 2010-2016
0
1,000
2,000
3,000
4,000
5,000
Figure 29: Monthly Narcotics Arrests, 2010-2016
0
500
1,000
1,500
2,000
Figure 30: Monthly Property Crime Arrests, 2010-2016
0
200
400
600
800
1,000
Figure 31: Monthly Violent Crime Arrests, 2010-2016
0
100
200
300
400
500
Figure 32: Monthly Gun Arrests, 2010-2016
0
20
40
60
Figure 33: Monthly Shooting Arrests, 2010-2016
0
20
40
60
80
Figure 34: Monthly Homicide Arrests, 2010-2016

23
The clearance rate for gun crimes declined in 2016.Because both homicides and shootings increased markedly in 2016, while arrests for these offenses held steady, there was a decrease in the likelihood of arrest (or “clearance rate”) for gun violence. From 2015 to 2016, the clearance rate fell from 36 percent to 26 percent for homicide, and from 7 percent to 5 percent for shootings.22 This decrease in the clearance rate is unlikely to have been what caused the surge in gun violence initially, but it may have accelerated this phenomenon, for example by fueling a cycle of retaliatory violence.23
Source: Crime Lab analysis of CPD records
22 With the data available to us, we can only approximate the clearance rate by dividing the number of incidents in which an arrest wasmade by the number of incidents that occurred. For example, in 2016, 726 homicide incidents (yielding 764 homicide victims) occurred, while the police made at least one arrest in 189 homicide incidents (occurring in 2016 or a previous year), yielding a clearance rate of 26 percent. Other ways of calculating the clearance rate are unlikely to change the basic conclusion that it was lower in 2016 relative to 2015 for gun violence.
23 If homicide and shooting arrests had declined in 2016, then that could in principle have been the main cause of Chicago’s increase ingun violence. Instead, the data show such arrests holding steady but failing to keep pace with a surge in gun violence that must have been precipitated by something else. By failing to keep pace, however, the likelihood that shooters are held accountable declines. In addition, public confidence in the criminal justice system may have declined as community members saw those who committed acts of violence remain free. Instead of formally seeking justice, some may have been encouraged to resort to retaliation, continuing the cycle of violence and further eroding trust in law enforcement.
37%
43%39%
46%44%
36%
26%
0%
20%
40%
60%
2010 2011 2012 2013 2014 2015 2016
Figure 35: Homicide Clearance Rate, 2010-2016
11% 10%9%
11%10%
7%
5%
0%
10%
20%
2010 2011 2012 2013 2014 2015 2016
Figure 36: Shooting Clearance Rate, 2010-2016

24
Another form of police activity that declined in 2016 is street stops.Chicago police recorded over 80 percent fewer stops in January 2016 than they had in November 2015. This drop, from an average of over 50,000 stops per month in 2015 (through November) to approximately 10,000 stops per month starting in early 2016, began a few months before rates of gun violence in Chicago began to increase. What caused the decline is itself unclear. Several frequently-mentioned candidate explanations—the release of video footage showing the shooting by a CPD officer of teenager Laquan McDonald, announcement of a U.S. Department of Justice (DOJ) investigation of CPD, implementation of an agreement between the City and the American Civil Liberties Union (ACLU) concerning street stops, and a new state law regarding street stops—all happened essentially within a few weeks of each other in late 2015 and early 2016.24
Source: Crime Lab analysis of CPD records
24 The video of the fatal shooting of Laquan McDonald was released on November 24, 2015, while the announcement that DOJ opened a civil pattern or practice investigation of CPD came on December 7, 2015. On January 1, 2016, an agreement between the City and the ACLU went into effect, requiring an independent evaluation of CPD practices and procedures, and introducing a new Investigatory Stop Report (ISR) that officers were required to complete after every street stop. On the same day, Illinois SB1304 went into effect, also requiring police to record information about each investigative street stop, as well as requiring them to issue a receipt after each such stop.
0
10,000
20,000
30,000
40,000
50,000
60,000
70,000
80,000
90,000
1/14
2/1
4
3/1
4
4/1
4
5/1
4
6/1
4
7/1
4
8/1
4
9/1
4
10/1
4
11/1
4
12/1
4
1/15
2/1
5
3/1
5
4/1
5
5/1
5
6/1
5
7/1
5
8/1
5
9/1
5
10/1
5
11/1
5
12/1
5
1/16
2/1
6
3/1
6
4/1
6
5/1
6
6/1
6
7/1
6
8/1
6
9/1
6
10/1
6
11/1
6
Figure 37: Street Stops, 2014-2016

25
Nor is it clear what role, if any, the decline in street stops played in contributing to the increase in gun violence in Chicago in 2016,25 since other cities have experienced large declines in street stops without similar increases in gun crime. For example, police in New York City reported a reduction in street stops between 2011 and 2015 of 97 percent, while homicides over this period did not increase at all—and in fact continued their long-term decline.26 It is possible that reducing street stops could have different effects across cities, but this is not something that is currently well understood.
Source: New York Civil Liberties Union, FBI UCR
0
100
200
300
400
500
600
700
800
0
1
2
3
4
5
6
7
8
2002 2003 2004 2005 2006 2007 2008 2009 2010 2011 2012 2013 2014 2015 2016
Stre
et S
top
s (T
hous
and
s)
Hom
icid
es p
er 10
0,0
00
Figure 38: Homicide Rate and Street Stops, New York, 2002-2016
Homicide Rate Street Stops
25 Although previous studies examining various forms of preventive or problem-solving policing on crime have generally found them tobe effective, the studies are typically of small pilot programs implemented in ways that did not exacerbate tensions with the community. The effects of a much larger scale, citywide effort are difficult to determine from the available academic research. See: Sherman, Lawrence and Dennis Rogan (1995). “Effects of gun seizures on gun violence: “Hot spots” patrol in Kansas City.” Justice Quarterly, 12(4), 673-693. Cohen, Jacqueline and Jens Ludwig (2003). “Policing Crime Guns.” Evaluating Gun Policy: Effects on Crime and Violence, 217-218. Braga, Anthony and David Weisburd (2010). Policing Problem Places: Crime Hot Spots and Effective Prevention. New York: Oxford University Press.
26 http://www.nytimes.com/2016/09/28/nyregion/what-donald-trump-got-wrong-on-stop-and-frisk.html. Even during a two-weekperiod in late 2014 and early 2015 when arrests for low-level crimes in New York City fell by over 90 percent, crime initially declined before rising modestly. http://www.nytimes.com/2015/01/06/nyregion/decrease-in-new-york-police-arrests-continues-for-a-second-week.html

26
CONCLUSIONOur hope is that the data reported here may be helpful to the ongoing conversation in Chicago about how to improve the safety and well-being of all residents of our home city, particularly those living in our most disadvantaged neighborhoods where the burden of crime is most severe. The data indicate that overall crime in the city of Chicago is not spiraling out of control. However, the city has witnessed a sudden, large, and seemingly sustained increase in gun crime occurring in public, involving teens and men in their 20s and 30s, in a small number of distressed neighborhoods on Chicago’s South and West sides.
Unfortunately, the available data cannot at this time point definitively to what caused the increase in gun violence in Chicago in 2016. Many common hypotheses for the gun violence problem in Chicago—such as proximity to states with less restrictive gun laws, or social conditions —evolve slowly over time and did not change abruptly at the end of 2015. As a result, these explanations are difficult to reconcile with the sudden and dramatic increase in gun violence at the start of 2016. Factors such as weather, city spending on social services or public education, or overall police activity (as measured by arrests) did not seem to change abruptly enough in 2016 to explain the violence increase either, while the effect of disruption to community organizations stemming from the state budget impasse is difficult to measure. We do see declines in 2016 in selected measures of police activity, such as the likelihood of arrest for a homicide or shooting and investigatory street stops. However, the contribution of these changes to the increase in gun violence remains unclear. Other factors that we cannot measure with currently available data, such as the structure of gang activity and social media use, could also have played a role. The fact that many other American cities saw homicides increase in 2015 and 2016 suggests that part of what Chicago experienced this past year may not be unique to our city.
Despite the uncertainty about what caused the increase in gun violence in Chicago in 2016, the city need not be paralyzed in crafting a response. The solution to a problem need not be the opposite of its cause. For example, in 1950, the U.S. experienced 22 motor vehicle fatalities for every 100,000 residents. Most of those fatalities were due to some type of driver error, such as speeding, veering into an oncoming lane, and running through stop signs or red lights. But progress in reducing auto fatalities in the U.S. did not come from eliminating all driver mistakes; instead, it came in large part from improving the safety of cars and roadways. The result is that U.S. motor vehicle fatalities per 100,000 people today are less than half what they were in 1950. This example is not intended to illustrate or endorse any particular strategy for reducing gun violence in Chicago, but rather to emphasize that the set of possible solutions the city can consider is broader than whatever turn out to be the causes of the 2016 surge in gun violence. The key lesson from the available data is that the problem does not represent a widespread change in anti-social or criminal behavior in general, but rather a narrower challenge of gun crimes committed in public places, frequently by young people—adults as well as teenagers—in our city’s most distressed neighborhoods.
While this report is intended to present just the facts, our goal is to inform the ongoing conversation about how the city can reverse this trend and keep all city residents safe. We will continue to partner with the city and civic community to share, help implement, and evaluate (when possible) the most promising solutions, and aim to share our current thinking and best ideas in other venues in the future.

27
APPENDIX
Motivation for focusing on monthly year-to-year changes to track the increase in gun violence
Because gun violence follows a seasonal pattern—higher in the summer, lower in the winter—we focus on monthly year-to-year changes to isolate trends over time in the data from regular seasonal changes in violence that occur every year. That is, by comparing rates of gun violence in each month of the year to the rate of crime in the same month in the prior year, we can avoid confusing changes in trends with seasonal effects.
To see why this is important, consider the number of homicides in each month of 2014 and 2015. As one can see in the figure below, homicides began to increase in the spring of 2015 and into the summer. Focusing just on those month-to-month changes over the course of 2015 might lead to a conclusion that something in the winter or spring of 2015 (e.g., the cut in state funding to Cure Violence in March 2015) contributed to the subsequent increase in homicides. But the figure below also shows that a similar increase in homicides occurred in 2014 as the temperature increased; that is, at least part of the homicide increase that occurred after March 2015 was due to the normal seasonal pattern that we see every year. The figure below shows that, for a few months over the summer, homicides in 2015 were indeed above their levels in 2014, but by the fall, October, November, and December of 2015 looked very similar to the same months in 2014. There does not appear to have been any change over the course of 2015 that caused a sustained increase in lethal violence in the city.
Source: Crime Lab analysis of CPD records
0
10
20
30
40
50
60
70
1 2 3 4 5 6 7 8 9 10 11 12
Month
Figure 39: Homicide Victims, 2014-2015
2014 2015

28
In contrast, the figure below also includes homicide counts for each month of 2016. This figure makes it clear that, beginning in January 2016, homicides were immediately much higher than they were in January 2015, and this remained true for each subsequent month.
Finally, the figure below reproduces part of Figure 6 in the main text and shows the homicide change in each month of 2016 relative to 2015, expressed in percentage terms. For example, the 50 homicide victims in January 2016 represent a 67 percent increase over the 30 victims in January 2015. This figure makes clear that the 2016 homicide surge began suddenly in January of that year, and was sustained in almost each month that followed.
Sources: Crime Lab analysis of CPD records
67%
142%
32%
6%
43%
60%
28%
90%
-3%
165%
97%
69%
-20%
0%
20%
40%
60%
80%
100%
120%
140%
160%
180%
1 2 3 4 5 6 7 8 9 10 11 12
Month
Figure 41: Homicide Victims:2016 Percent Change Compared to Prior Year
0
20
40
60
80
100
1 2 3 4 5 6 7 8 9 10 11 12
Month
Figure 40: Homicide Victims, 2014-2016
2014 2015 2016

29
Data SourcesThe crime-related data used in this report are drawn from multiple sources.
Crime, victimization, and arrest
Homicide rate data were obtained from the FBI Uniform Crime Reporting (UCR) Program for 1985-2015, specifically from “Table 8: Offenses Known to Law Enforcement, by State by City.” Homicide rates are calculated per 100,000 people using each city’s annual population data, as reported to the UCR. For calculating 2016 homicide rates, we use the population each city reported to the UCR in 2015.
Final homicide data for Chicago in 2016 were obtained from internal CPD records, and for the cities of New York, Los Angeles, Houston, and Philadelphia from their respective police departments. For the cities of Baltimore, Washington, D.C., Milwaukee, Detroit, and St. Louis, 2016 homicide data were obtained from public sources, including news accounts.27
This report also includes data on homicides committed with and without the use of a firearm. These data are not available at the city agency level through the FBI, and were obtained separately from the police departments of Chicago, New York City, Los Angeles, Houston, and Philadelphia.
Data on the ages of individuals arrested for homicide were collected from the FBI UCR Crime in the U.S. 2015 report, specifically from “Table 52: Arrests: Metropolitan Counties, by Age.”
Demographic and prior arrest data for homicide suspects and victims in Chicago, as well as aggregate counts of crimes, arrests, and victimizations, were obtained from internal CPD records.
Drug arrests include any arrests for possession, sale, or manufacture of narcotics, or misuse of prescription drugs. Gun-related arrests include only arrests for weapons violations and do not include arrests for violent crimes where a gun was used. Throughout this report, a non-fatal shooting is defined as an instance of aggravated battery with a firearm against an individual.
Firearm recoveries
Firearm recovery data for 2011-2016 were obtained from the Chicago Police Department, the New York City Police Department, and the Los Angeles Police Department. As noted in the report, these numbers exclude any firearms recovered as a result of gun buyback or trade-in programs. Firearm recovery rates are calculated using the number of recovered guns per city per year and the corresponding population data for each city, retrieved from the UCR for each year. The caliber information reported for recovered guns in Chicago was provided by the Chicago Police Department.
Neighborhood poverty and population
Data on Chicago households below the poverty line, unemployment rate, population, and per capita income by community area come from the 2014 American Community Survey 5-year estimates.
27 Baltimore: http://www.baltimoresun.com/news/maryland/crime/bs-md-ci-overnight-shooting-20170101-story.html
Washington, D.C.: http://mpdc.dc.gov/page/district-crime-data-glance
Milwaukee: http://archive.jsonline.com/news/crime/Milwaukee-Homicide-Tracker-367120481.html
Detroit: http://www.freep.com/story/news/local/michigan/detroit/2017/01/03/crime-detroit-overall-homicides/96134646/
St. Louis: http://www.stltoday.com/news/local/crime-and-courts/st-louis-murders-in-tied-with/article_03532127-f975-511c-8c6c-65f25b09e69c.html

30
Weather
Daily weather data for Chicago, reported at Chicago Midway International Airport, were obtained from the Global Historical Climatology Network (GHCN) at the National Oceanic and Atmospheric Administration (NOAA).
Chicago social service spending, education spending, and graduation rates
Data on social service spending by the City of Chicago were obtained from its public budget documents. Data on instructional spending per pupil by the Chicago Public Schools were obtained from public budgets for academic years 2012 through 2016. Instructional spending is defined as the sum of student-oriented spending on core instruction, diverse learners, bilingual education, early childhood programs, other programs, and discretionary funds. Cohort graduation rates were obtained from public data reported by the Chicago Public Schools.
Street stops
Monthly data on police investigatory street stops in Chicago were provided by the CPD. Annual street stop data for New York City were obtained from public data reported by the New York Civil Liberties Union (NYCLU).

31
Homicides by Community Area, 2015–2016
Community Area Homicides Homicides per 100,000
Name Number Population 2015 2016 Change 2015 2016 Change
(1) (2) (3) (4) (5) (6) (7) (8) (9)
Austin 25 99,711 48 87 39 48.1 87.3 39.1Englewood 68 27,297 21 49 28 76.9 179.5 102.6New City 61 41,598 18 41 23 43.3 98.6 55.3West Englewood 67 34,272 17 36 19 49.6 105.0 55.4Greater Grand Crossing 69 32,849 18 34 16 54.8 103.5 48.7Roseland 49 44,267 18 32 14 40.7 72.3 31.6Auburn Gresham 71 47,611 13 27 14 27.3 56.7 29.4West Garfield Park 26 18,885 15 28 13 79.4 148.3 68.8East Garfield Park 27 20,271 17 28 11 83.9 138.1 54.3Humboldt Park 23 54,515 18 28 10 33.0 51.4 18.3North Lawndale 29 35,623 23 33 10 64.6 92.6 28.1Chicago Lawn 66 56,293 10 19 9 17.8 33.8 16.0Washington Park 40 11,647 4 11 7 34.3 94.4 60.1Gage Park 63 40,381 7 14 7 17.3 34.7 17.3Hermosa 20 24,836 0 6 6 0.0 24.2 24.2Lower West Side 31 34,979 4 10 6 11.4 28.6 17.2South Chicago 46 28,550 12 18 6 42.0 63.0 21.0Brighton Park 58 44,130 5 11 6 11.3 24.9 13.6Washington Heights 73 26,435 9 15 6 34.0 56.7 22.7South Lawndale 30 72,881 13 18 5 17.8 24.7 6.9South Shore 43 48,816 16 21 5 32.8 43.0 10.2West Lawn 65 33,477 0 5 5 0.0 14.9 14.9Near North Side 8 84,305 1 5 4 1.2 5.9 4.7West Town 24 84,319 5 9 4 5.9 10.7 4.7Ashburn 70 42,809 6 10 4 14.0 23.4 9.3West Ridge 2 73,019 4 7 3 5.5 9.6 4.1Archer Heights 57 13,998 1 4 3 7.1 28.6 21.4Near West Side 28 58,899 11 13 2 18.7 22.1 3.4Douglas 35 19,430 3 5 2 15.4 25.7 10.3Fuller Park 37 2,543 3 5 2 118.0 196.6 78.6Hyde Park 41 26,705 0 2 2 0.0 7.5 7.5Avalon Park 45 10,098 2 4 2 19.8 39.6 19.8Pullman 50 6,970 0 2 2 0.0 28.7 28.7Riverdale 54 7,190 3 5 2 41.7 69.5 27.8West Elsdon 62 19,165 3 5 2 15.7 26.1 10.4Norwood Park 10 41,867 0 1 1 0.0 2.4 2.4Dunning 17 43,053 0 1 1 0.0 2.3 2.3Avondale 21 39,117 2 3 1 5.1 7.7 2.6Loop 32 30,642 1 2 1 3.3 6.5 3.3Near South Side 33 22,021 2 3 1 9.1 13.6 4.5Armour Square 34 13,850 1 2 1 7.2 14.4 7.2Oakland 36 6,473 2 3 1 30.9 46.3 15.4Grand Boulevard 38 22,531 7 8 1 31.1 35.5 4.4Woodlawn 42 25,451 7 8 1 27.5 31.4 3.9South Deering 51 15,570 1 2 1 6.4 12.8 6.4East Side 52 23,739 1 2 1 4.2 8.4 4.2Lincoln Square 4 39,547 1 1 0 2.5 2.5 0.0North Center 5 34,815 0 0 0 0.0 0.0 0.0Lake View 6 97,968 1 1 0 1.0 1.0 0.0Lincoln Park 7 65,951 0 0 0 0.0 0.0 0.0Edison Park 9 10,993 0 0 0 0.0 0.0 0.0Jefferson Park 11 26,975 1 1 0 3.7 3.7 0.0Forest Glen 12 18,478 0 0 0 0.0 0.0 0.0North Park 13 18,058 0 0 0 0.0 0.0 0.0Calumet Heights 48 13,400 2 2 0 14.9 14.9 0.0Hegewisch 55 9,338 0 0 0 0.0 0.0 0.0Garfield Ridge 56 34,743 3 3 0 8.6 8.6 0.0McKinley Park 59 16,449 1 1 0 6.1 6.1 0.0Clearing 64 24,452 0 0 0 0.0 0.0 0.0Beverly 72 21,002 0 0 0 0.0 0.0 0.0Mount Greenwood 74 18,357 0 0 0 0.0 0.0 0.0Edgewater 77 55,276 1 1 0 1.8 1.8 0.0Rogers Park 1 55,053 6 5 -1 10.9 9.1 -1.8Portage Park 15 64,427 2 1 -1 3.1 1.6 -1.6Montclare 18 12,840 1 0 -1 7.8 0.0 -7.8Belmont Cragin 19 79,069 8 7 -1 10.1 8.9 -1.3Kenwood 39 18,217 5 4 -1 27.4 22.0 -5.5Bridgeport 60 31,939 3 2 -1 9.4 6.3 -3.1O'Hare 76 22,239 1 0 -1 4.5 0.0 -4.5Albany Park 14 52,930 5 3 -2 9.4 5.7 -3.8Irving Park 16 56,490 7 5 -2 12.4 8.9 -3.5Morgan Park 75 29,300 6 4 -2 20.5 13.7 -6.8Logan Square 22 74,055 7 4 -3 9.5 5.4 -4.1Chatham 44 31,493 22 19 -3 69.9 60.3 -9.5Burnside 47 2,618 3 0 -3 114.6 0.0 -114.6Uptown 3 54,062 12 8 -4 22.2 14.8 -7.4West Pullman 53 31,878 15 10 -5 47.1 31.4 -15.7