gulustan dogan, yildiz technical university umit …€¦ · if i have data, i will know :)...
TRANSCRIPT

Beginner’s Guide to Data Science
by Turkish Women in Computing
Latife Genc, Groupon
Gokcen Cilingir, Intel
Rabia Nuray-Turan, Moodwire Inc
Umit Yalcinalp, myappellation.com
Gulustan Dogan, Yildiz Technical University1
Data Science is: PopularLots of Data => Lots of Analysis => Lots of Jobs
Universities: Starting new multidisciplinary programs
Industry: Cottage industry evolving for online and training courses
Goal of this Talk:
● Hear if from people who do it and what they do ● Use it for further learning and specialization
2

Data is: Big! ● 2.5 quintillion (1018) bytes of data are generated every day!
● Everything around you collects/generates data
● Social media sites● Business transactions● Location-based data● Sensors● Digital photos, videos● Consumer behaviour (online and store transactions)
● More data is publicly available● Database technology is advancing● Cloud based & mobile applications are widespread
Source: IBM http://www-01.ibm.com/software/data/bigdata/
Lots of Data => Lots of Analysis => Lots of Jobs
3
If I have data, I will know :) Everyone wants better predictability, forecasting, customer satisfaction, market differentiation, prevention, great user experience, ...
● How can I price a particular product?
● What can I recommend online customers to buy after buying X, Y or Z?
● How can we discover market segments? group customers into market segments?
● What customer will buy in the upcoming holiday season? (what to stock?)
● What is the price point for customer retention for subscriptions?
4
Data Science is: making sense of DataLots of Data => Lots of Analysis => Lots of Jobs
● Multidisciplinary study of data collections for analysis, prediction, learning and
prevention.
● Utilized in a wide variety of industries.
● Involves both structured or unstructured data sources.
5

Data Science is: multidisciplinary● Statisticians● Mathematicians● Computer Scientists in
○ Data mining ○ Artificial Intelligence & Machine Learning○ Systems Development and Integration○ Database development○ Analytics
● Domain Experts○ Medical experts○ Geneticists○ Finance, Business, Economy experts○ etc.
6
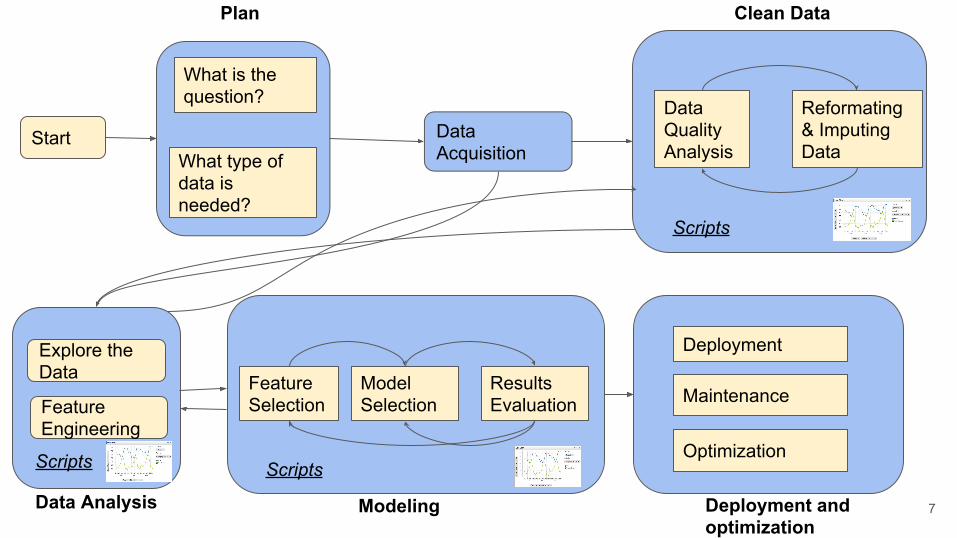
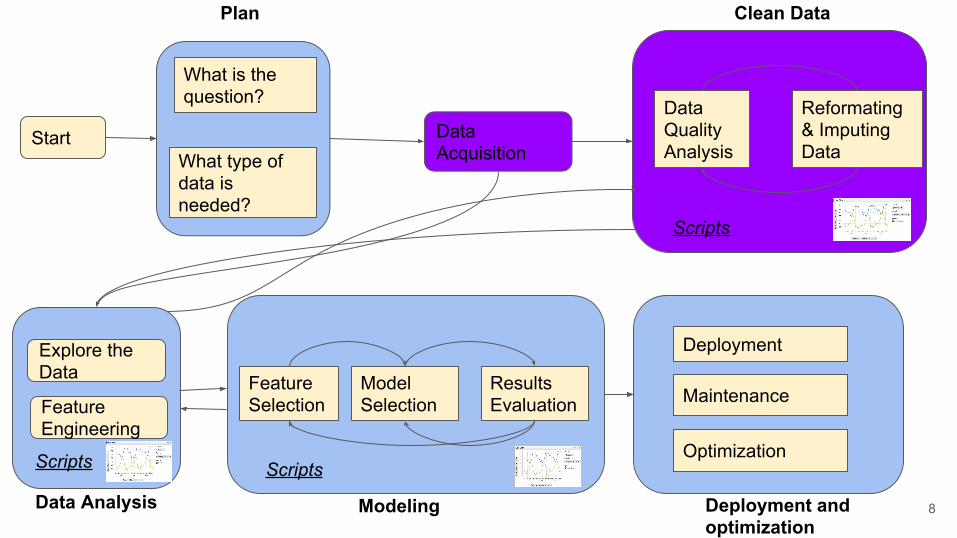
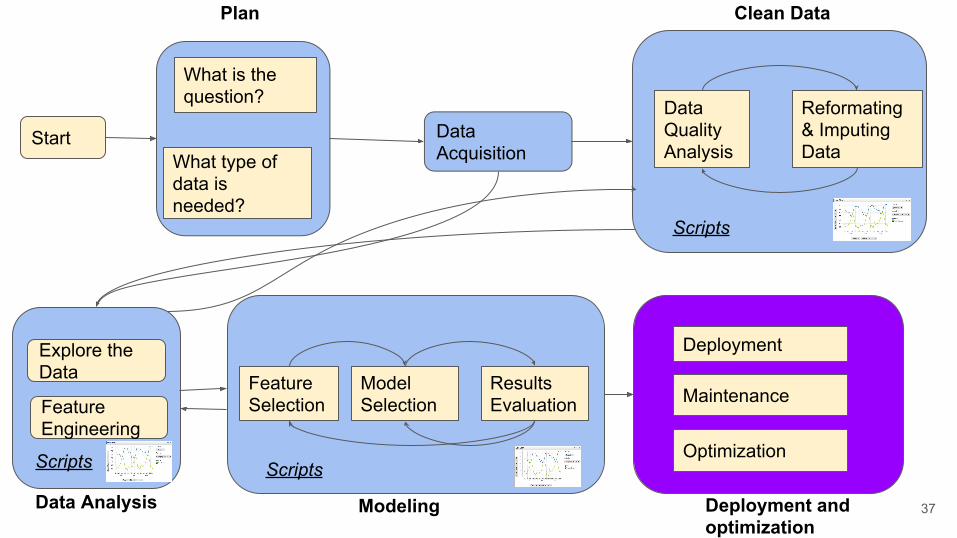
Start Data Acquisition
What is the question?
What type of data is needed?
Data Quality Analysis
Reformating & Imputing Data
Plan Clean Data
Scripts
Scripts
Feature Selection
Model Selection
Results Evaluation
Modeling Deployment and optimization
Data Analysis
Explore the Data
Scripts
Feature Engineering
Maintenance
Deployment
Optimization
7
Start Data Acquisition
What is the question?
What type of data is needed?
Data Quality Analysis
Reformating & Imputing Data
Plan Clean Data
Scripts
Scripts
Feature Selection
Model Selection
Results Evaluation
Modeling Deployment and optimization
Data Analysis
Explore the Data
Scripts
Feature Engineering
Maintenance
Deployment
Optimization
8

Data Acquisition Stage● As soon as the data scientist identified the problem she is trying to solve, she
must assess:● What type of data is available● What might be required and currently is not collected● Is it available from other units of the company?● Does she need to crawl/buy data from third parties?● How much data is needed? (Data volume)● How to access the data?● Is the data private? ● Is it legally OK to use the data?
9

Data Acquisition Stage● Data may not exist● Sources of data may be public or private● Not all sources of data may be suitable for processing● Data are often incomplete and dirty● Data consolidation and cleanup are essential
○ Pieces of data may be in different sources○ Formats may not match/may be incompatible○ Unstructured data may need to be accounted for
10
Data Acquisition Stage -- Example
Example: Online customer experience may require collecting lots of data such as
● clicks● conversions● add-to-cart rate● dwell time● average order value● foot traffic● bounce rate● exits and time to purchase
11
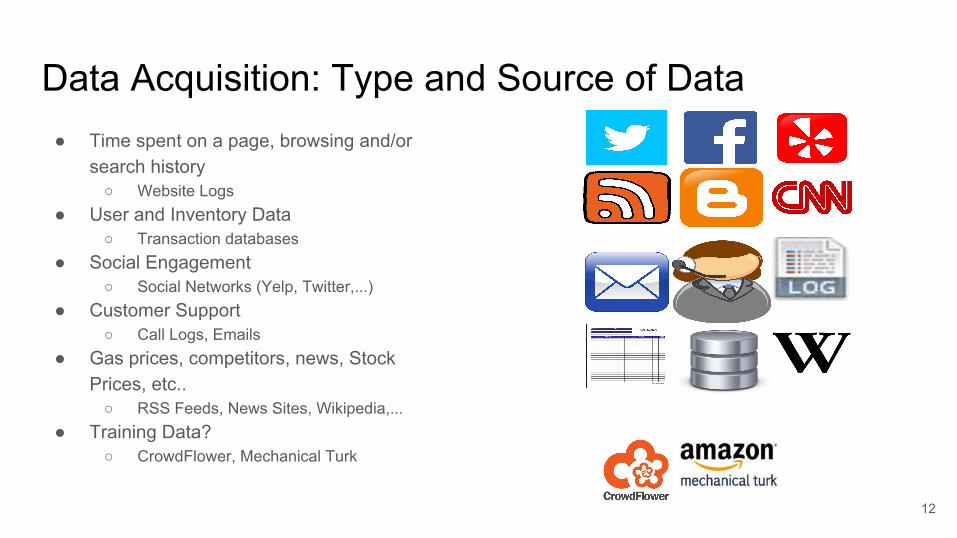
Data Acquisition: Type and Source of Data● Time spent on a page, browsing and/or
search history○ Website Logs
● User and Inventory Data○ Transaction databases
● Social Engagement○ Social Networks (Yelp, Twitter,...)
● Customer Support○ Call Logs, Emails
● Gas prices, competitors, news, Stock Prices, etc..
○ RSS Feeds, News Sites, Wikipedia,...● Training Data?
○ CrowdFlower, Mechanical Turk
12

Data Acquisition : Storage and Access● Where the data resides
○ Cloud or Computing Clusters● Storage System
○ SQL, NoSQL, File System○ SQL: MySQL, Oracle, MS Server,...○ NoSQL: MongoDB, Cassandra,
Couchbase, Hbase, Hive, ...○ Text Indexing: Solr, ElasticSearch,...
● Data Processing Frameworks:○ Hadoop, Spark, Storm etc...
13
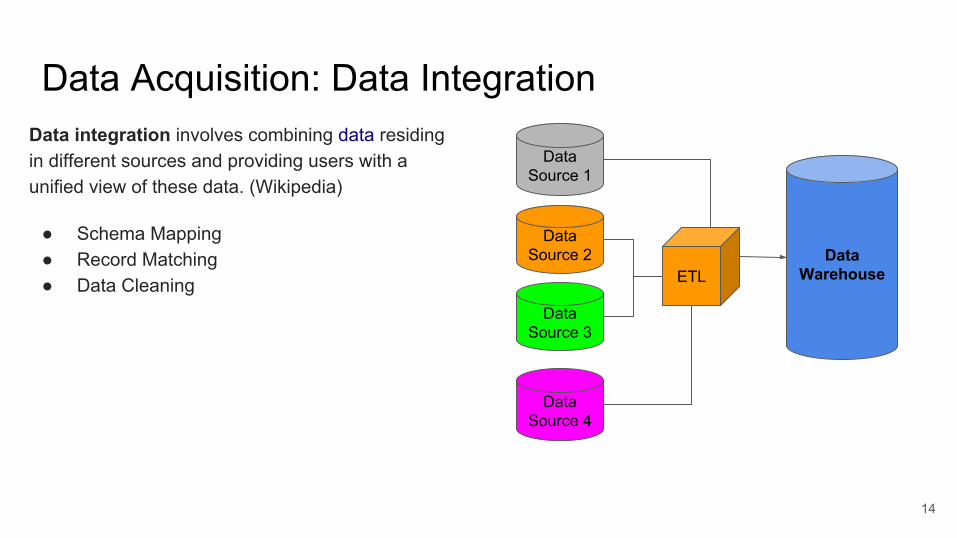
Data Acquisition: Data IntegrationData integration involves combining data residing in different sources and providing users with a unified view of these data. (Wikipedia)
● Schema Mapping● Record Matching● Data Cleaning
Data Source 1
Data Source 2
Data Source 3
Data Source 4
ETLData
Warehouse
14
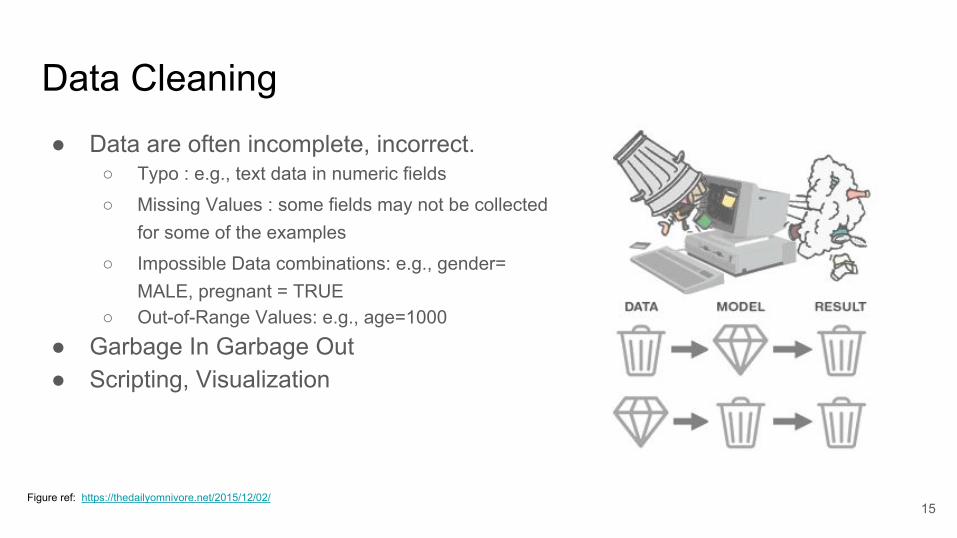
Data Cleaning● Data are often incomplete, incorrect.
○ Typo : e.g., text data in numeric fields
○ Missing Values : some fields may not be collected for some of the examples
○ Impossible Data combinations: e.g., gender= MALE, pregnant = TRUE
○ Out-of-Range Values: e.g., age=1000
● Garbage In Garbage Out● Scripting, Visualization
Figure ref: https://thedailyomnivore.net/2015/12/02/ 15
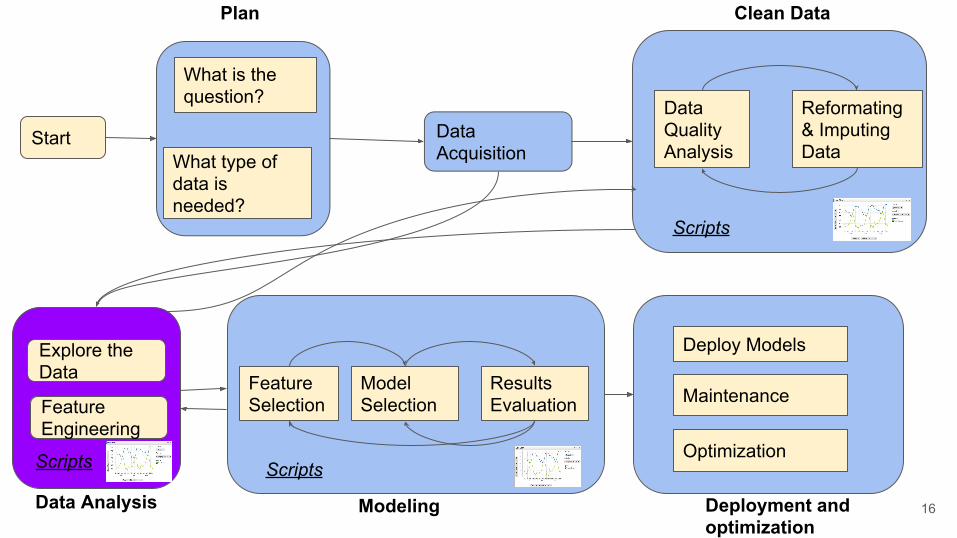
Start Data Acquisition
What is the question?
What type of data is needed?
Data Quality Analysis
Reformating & Imputing Data
Plan Clean Data
Scripts
Scripts
Feature Selection
Model Selection
Results Evaluation
Modeling Deployment and optimization
Data Analysis
Explore the Data
Scripts
Feature Engineering
Maintenance
Deploy Models
Optimization
16
Analysis - Data Preparation ● Univariate Analysis: Analyze/explore variables one by one● Bivariate Analysis: Explore relationship between variables ● Coverage, missing values: treating unknown values● Outliers: detect and treat values that are distant from other observations● Feature Engineering: Variable transformations and creation of new better
variables from raw features
Commonly used tools: ● SQL● R: plyr, reshape, ggplot2, data.table,● Python: NumPy, Pandas, SciPy, matplotlib
17
Analysis - Exploratory Analysis Univariate Analysis: Analyze/explore variables one by one
- Continuous variable: explore central tendency and spread of the values- Summary statistics
- mean, median, min, max - IQR, standard deviation, variance, quartile
- Visualize Histograms, Boxplots
18
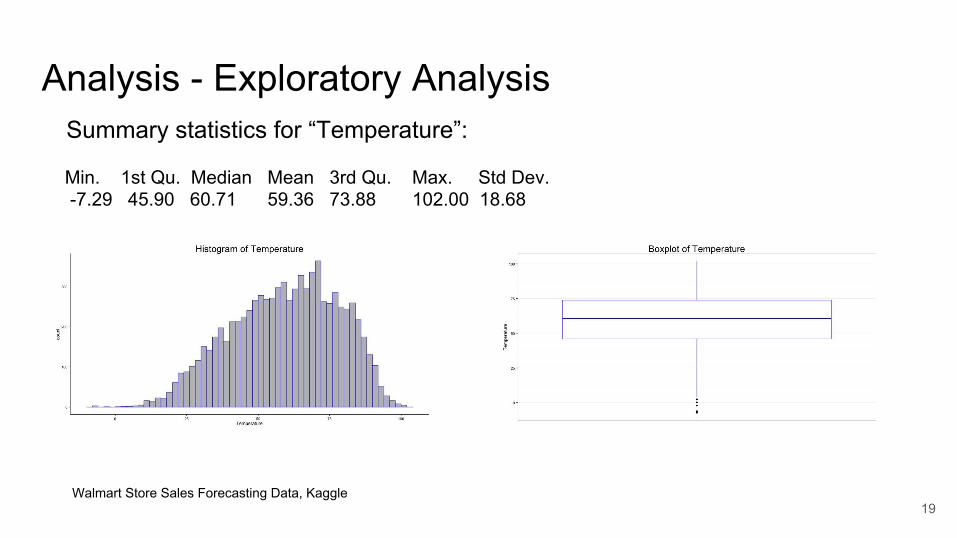
Analysis - Exploratory Analysis
Walmart Store Sales Forecasting Data, Kaggle
Summary statistics for “Temperature”:
Min. 1st Qu. Median Mean 3rd Qu. Max. Std Dev. -7.29 45.90 60.71 59.36 73.88 102.00 18.68
19
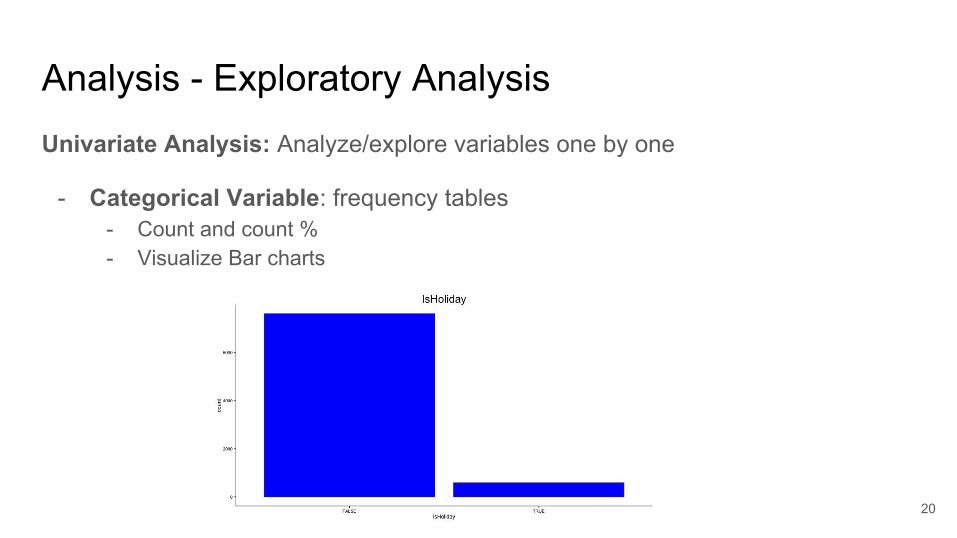
Analysis - Exploratory Analysis Univariate Analysis: Analyze/explore variables one by one
- Categorical Variable: frequency tables- Count and count %- Visualize Bar charts
20
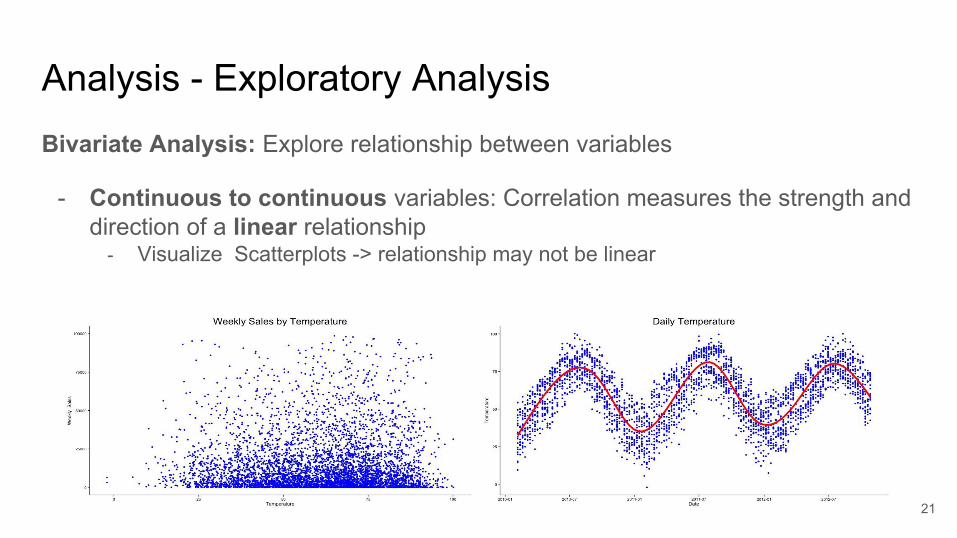
Analysis - Exploratory Analysis Bivariate Analysis: Explore relationship between variables
- Continuous to continuous variables: Correlation measures the strength and direction of a linear relationship
- Visualize Scatterplots -> relationship may not be linear
21

Analysis - Exploratory Analysis Bivariate Analysis: Explore relationship between variables
- Categorical to categorical variables -> crosstab table- Visualize Stacked bar charts
- Continuous to categorical variables -> - Visualize Boxplots, Histograms for each level(category)
22

Analysis - Correlation vs CausationCorrelation ⇏ causation!
23

Analysis - Correlation vs CausationCorrelation ⇏ causation!
To prove causation:
● Randomized controlled experiments● Hypothesis testing, A/B testing
24
Analysis - Feature EngineeringCreate new features from existing raw features: discretize, bin
Transform Variables
Create new categorical variables: too many levels, levels that rarely occur, one level almost always occur
Extremely skewed data - outliers
Imputation: Filling in missing data
25
Analysis - Missing Values Missing values are unknown values of a feature.
Important as they may lead to biased models or incorrect estimations and conclusions.
Some ML algorithms accept missing values: for example some tree based models treat missing values as a separate branch while many other algorithms require complete dataset. Therefore, we can
● omit: remove missing values and use available data● impute: replace missing values estimating by mean/median/mode value of the
existing data, by most similar data points (KNN) or more complex algorithms like Random Forest
26
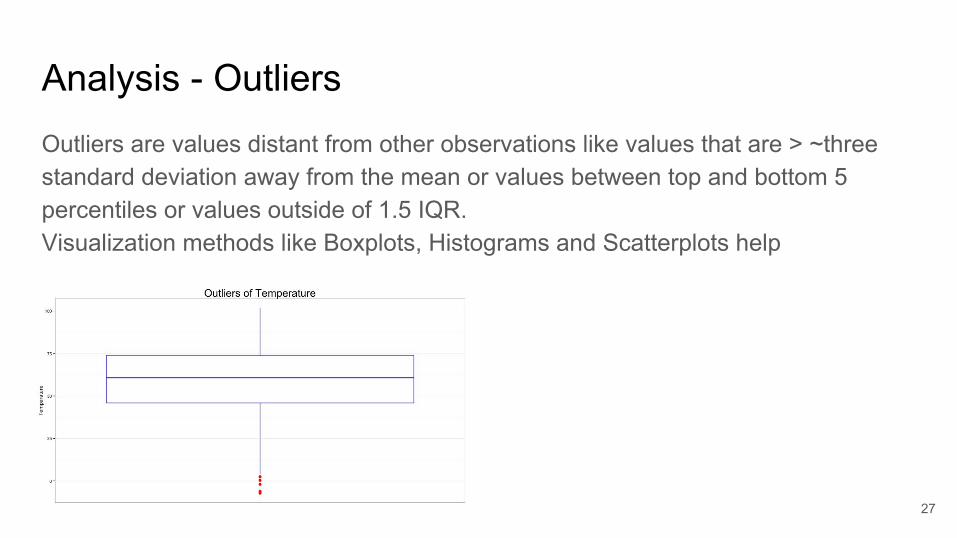
Analysis - Outliers Outliers are values distant from other observations like values that are > ~three standard deviation away from the mean or values between top and bottom 5 percentiles or values outside of 1.5 IQR.Visualization methods like Boxplots, Histograms and Scatterplots help
27
Analysis - Outliers Some algorithms like regression are sensitive to outliers and can cause high error variance and bias in the estimated values.
Delete, cap, transform or impute like missing values.
28
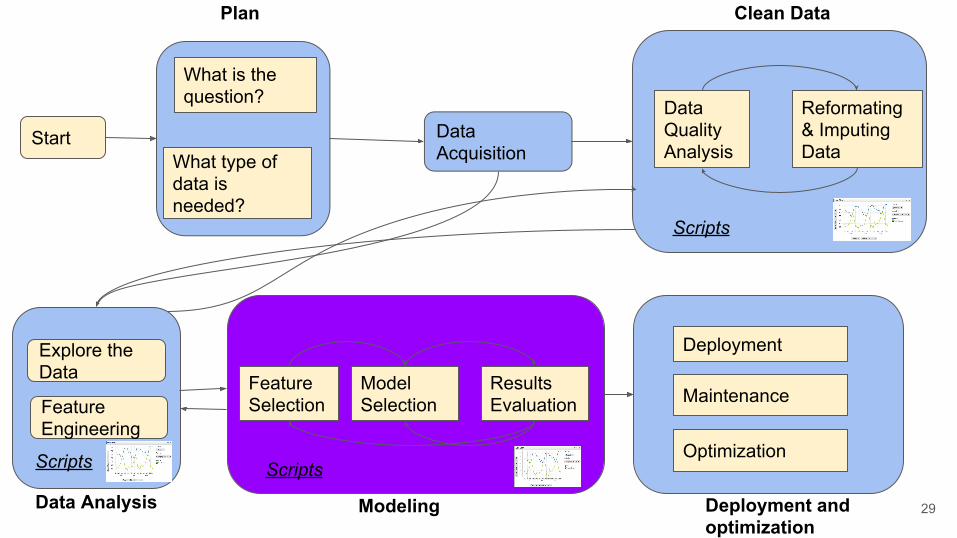
Start Data Acquisition
What is the question?
What type of data is needed?
Data Quality Analysis
Reformating & Imputing Data
Plan Clean Data
Scripts
Scripts
Feature Selection
Model Selection
Results Evaluation
Modeling Deployment and optimization
Data Analysis
Explore the Data
Scripts
Feature Engineering
Maintenance
Deployment
Optimization
29
Predictive data modelingPrediction, that is the end goal of many data science adventures!
Data on consumer behaviour is collected:
● to predict future consumer behaviour and to take action accordingly
Examples:
● Recommendation systems (netflix, pandora, amazon, etc.)● Online user behaviour is used to predict best targeted ads● Customer purchase histories are used to determine how to price,stock,
market and display future products.
30
Machine learning
● Machine Learning is the study of algorithms that improve their performance at some task with example data or past experience
○ Foundation to many ML algorithms lie in statistics and optimization theory○ Role of Computer science: Efficient algorithms to
■ Solve the optimization problem■ Represent and evaluate data models for inference
● Wide variety of off-the-shelf algorithms are available today. Just pick a library and go! (is it really that easy?)
○ Short answer: no. Long answer: model selection and tuning requires deeper understanding.
31
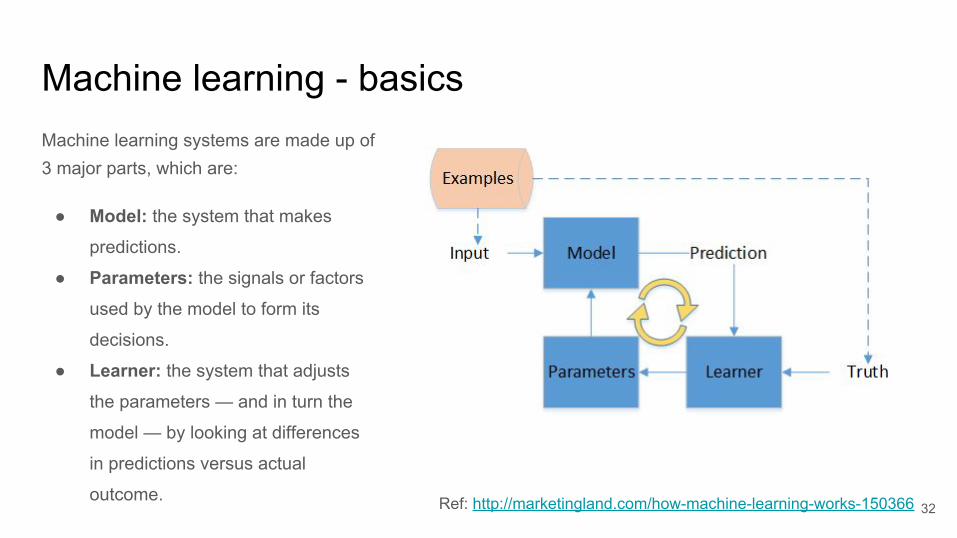
Machine learning - basicsMachine learning systems are made up of 3 major parts, which are:
● Model: the system that makes
predictions.
● Parameters: the signals or factors
used by the model to form its
decisions.
● Learner: the system that adjusts
the parameters — and in turn the
model — by looking at differences
in predictions versus actual
outcome. Ref: http://marketingland.com/how-machine-learning-works-150366 32
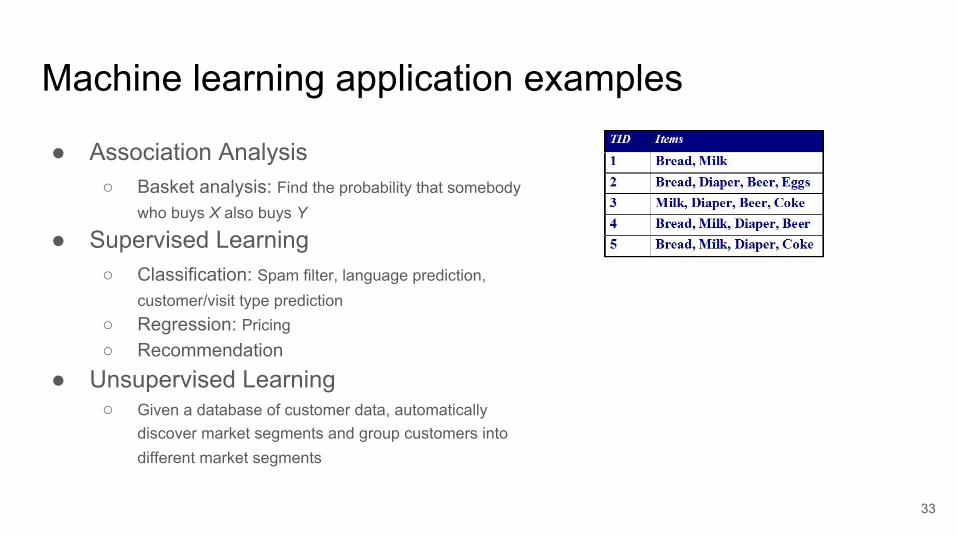
Machine learning application examples
● Association Analysis○ Basket analysis: Find the probability that somebody
who buys X also buys Y
● Supervised Learning○ Classification: Spam filter, language prediction,
customer/visit type prediction○ Regression: Pricing○ Recommendation
● Unsupervised Learning○ Given a database of customer data, automatically
discover market segments and group customers into different market segments
33

Model selection and generalization● Learning is an ill-posed problem; data is
not sufficient to find a unique solution● There is a trade-off between three
factors:○ Model complexity ○ Training set size○ Generalization error (expected error
on new data)● Overfitting and underfitting problems
Ref: http://www.inf.ed.ac.uk/teaching/courses/iaml/slides/eval-2x2.pdf 34
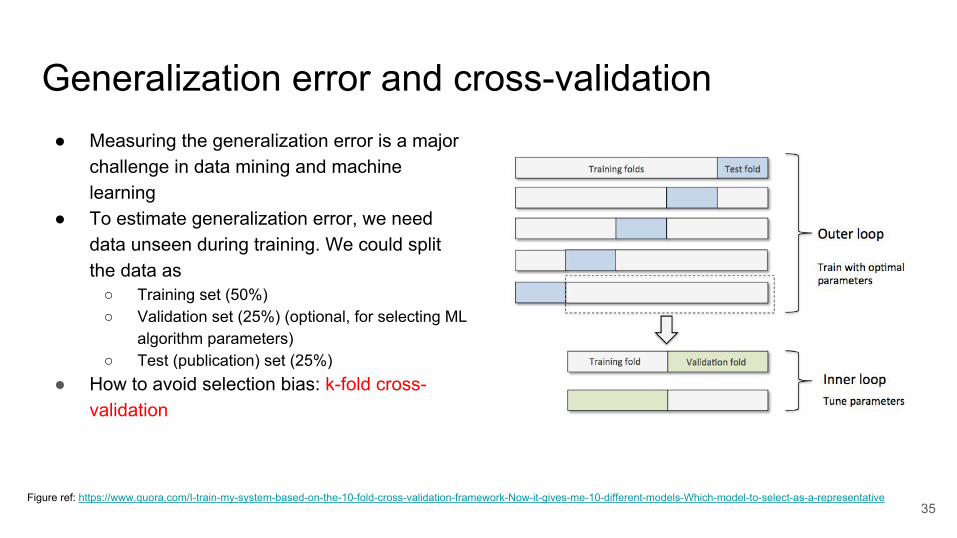
Generalization error and cross-validation● Measuring the generalization error is a major
challenge in data mining and machine learning
● To estimate generalization error, we need data unseen during training. We could split the data as
○ Training set (50%)○ Validation set (25%) (optional, for selecting ML
algorithm parameters)○ Test (publication) set (25%)
● How to avoid selection bias: k-fold cross-validation
Figure ref: https://www.quora.com/I-train-my-system-based-on-the-10-fold-cross-validation-framework-Now-it-gives-me-10-different-models-Which-model-to-select-as-a-representative35

Deep Learning ● Neural networks(NN) has been around for decades but they just weren’t “deep” enough. NNs with
several hidden layers are called deep neural networks (DNN). ● Different than many ML approaches, deep learning attempts to model high-level abstractions in data.● Deep learning is suited best when input space is locally structured – spatial or temporal – vs. arbitrary
input features
36
Start Data Acquisition
What is the question?
What type of data is needed?
Data Quality Analysis
Reformating & Imputing Data
Plan Clean Data
Scripts
Scripts
Feature Selection
Model Selection
Results Evaluation
Modeling Deployment and optimization
Maintenance
Deployment
Optimization
Data Analysis
Explore the Data
Scripts
Feature Engineering
37
Deployment, maintenance and optimization● Deployed solutions might include:
○ A trained data model (model + parameters)○ Routines for inputting and prediction
○ (Optional) Routines for model improvement (through feedback, deployed system can improve itself)
○ (Optional) Routines for training
● Once the model has been deployed in production, it is time for regular maintenance and operations.
● The optimization phase could be triggered by failing performance, need to add new data sources and retraining the model, or even to deploy improved versions of the model based on better algorithms.
Ref: http://www.datasciencecentral.com/m/blogpost?id=6448529%3ABlogPost%3A234092 38
Recap - Software Toolbox of Data Scientists: ● Database
○ SQL○ NoSQL languages for target databases
● Programming Languages and Libraries○ Python (due to availability of libraries for data management) scikit-learn, pyML, pandas○ R ○ General programming languages such as Java for gluing different systems○ C/C++] mlpack, dlib
● Tools: Orange, Weka, Matlab
● Vendor Specific Platforms for data analytics (such as Adobe Marketing Cloud, etc.)
● Hive ● Spark
39
Conclusion: It takes a teamMust haves:
- Programming and Scripting skills- Statistics and data analysis skills- Machine learning skills
Necessary but not sufficient:
- Database management skills- Distributed computing skills
Domain knowledge may make or break a system: If you do not realize a type of data is essential, the results will not be very useful
40
Resources
● [DDS] Doing Data Science (O’Neill, Schutt) O Reilly Press● [CACM Blog Data] Science Workflow Overview and Challenges
http://cacm.acm.org/blogs/blog-cacm/169199-data-science-workflow-overview-and-challenges/fulltext
41