gulf keystone petroleum · appointment of a new non-executive chairman jaap huijskes –joined...
TRANSCRIPT

Gulf Keystone Petroleum
Full Year 2017 Results
11 April, 2018
2
DisclaimerThese Presentation Materials are for information purposes only and must not be used or relied upon for the purpose of making any
investment decision or engaging in any investment activity and should not be construed as, an offer for sale or subscription of, or solicitation
of any offer to buy or subscribe for, any securities of Gulf Keystone Petroleum Limited (the “Company”). Whilst the information contained
herein has been prepared in good faith, neither the Company, its subsidiaries (together, the “Group”) nor any of the Group’s directors,
officers, employees, agents or advisers makes any representation or warranty in respect of the fairness, accuracy or completeness of the
information or opinions contained in this presentation and no responsibility or liability will be accepted in connection with the same. The
information contained herein is provided as at the date of this presentation and is subject to updating, completion, revision, verification and
further amendment without notice.
These Presentation Materials contain forward-looking statements in relation to the Group. By its very nature, such forward-looking
information requires the Company to make assumptions that may not materialise or that may not be accurate. Such forward-looking
statements involve known and unknown risks, uncertainties and other important factors beyond the control of the Company that could cause
the actual performance or achievements of the Company to be materially different from any future results, performance or achievements
expressed or implied by such forward-looking statements. Nothing in this presentation should be construed as a profit forecast. Past share
performance cannot be relied on as a guide to future performance.
Note: The photograph on the cover of this presentation shows an active natural oil seep at an Eocene aged outcrop located on the Shaikan block, north of Production Facility 1

2017 Highlights: Jón Ferrier, CEO

Highlights4
Shaikan Crude Oil Sales Agreement Key milestone – moving away from flat payments
Strong operational performance
Gross production at 35,298 bopd despite limited investment 34,794 bopd in 2016
Robust financial position and material cash generation
$104m EBITDA – moving into profit
Ready to resume investment in 2018
Appointment of a new Non-Executive Chairman Jaap Huijskes – joined Board in November 2017
Further Board appointments expected in 2018
Improved KPIs introduced in 2017 Further aligning organisation with shareholders
Corporate Governance 5
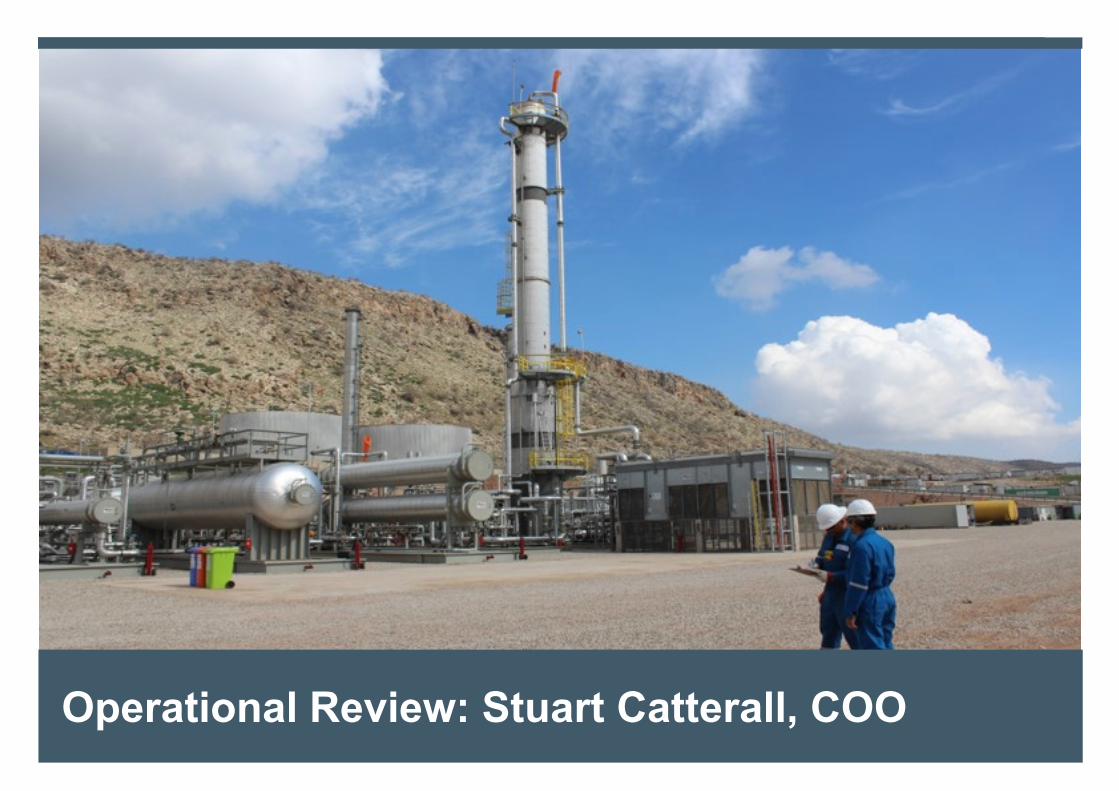
Operational Review: Stuart Catterall, COO

Operational Highlights7
No lost time incidents; now over 3 million man hours without LTI
99% plant uptime
Average daily gross production of 35,298 bopd
Versus guidance of 32,000-38,000 bopd
Cumulative production from Shaikan of c.48 MMstb
Reservoir understanding enhanced
Opex per bbl reduced to $2.8/bbl in 2017 (2016: $3.5/bbl)
Shaikan oil back in Kurdistan export pipeline since November
Ongoing optimisation of the development programme
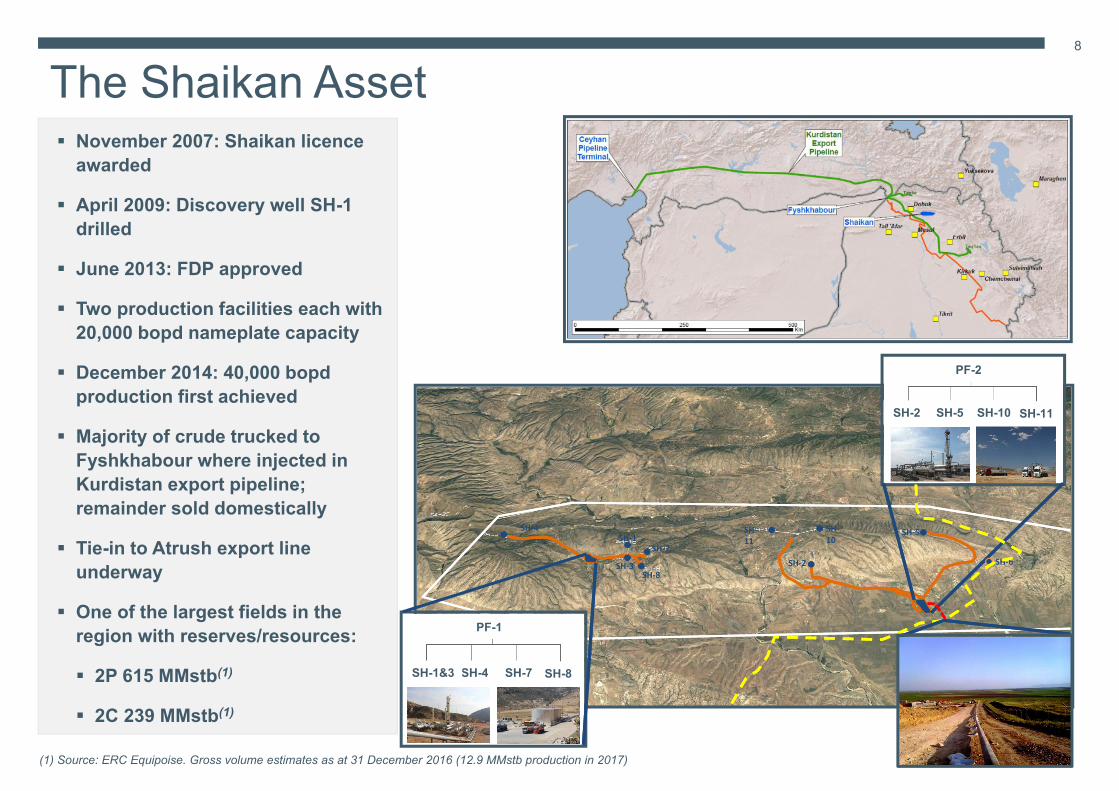
November 2007: Shaikan licence awarded
April 2009: Discovery well SH-1 drilled
June 2013: FDP approved
Two production facilities each with 20,000 bopd nameplate capacity
December 2014: 40,000 bopd production first achieved
Majority of crude trucked to Fyshkhabour where injected in Kurdistan export pipeline; remainder sold domestically
Tie-in to Atrush export line underway
One of the largest fields in the region with reserves/resources:
2P 615 MMstb(1)
2C 239 MMstb(1)
The Shaikan Asset8
SH‐4SH‐1
SH‐3
SH‐7
SH‐8
SH‐11
SH‐10
SH‐5
SH‐2 SH‐6
PF-2
SH-2 SH-5 SH-10 SH-11
SH-4 SH-7 SH-8SH-1&3
PF-1
(1) Source: ERC Equipoise. Gross volume estimates as at 31 December 2016 (12.9 MMstb production in 2017)

Discovered and Producing Reservoirs: Jurassic9
Production is currently from the Jurassic reservoirs
Substantial oil column – c.1,000m – gravity ranging from 18° API at the top to 11° API at the bottom
48 MMstb produced to date with no gas or water breakthrough
Production and reservoir pressure data continue to support our geological model and understanding of the field
Jurassic reserves/resources:
2P 568 MMstb(1)
2C 80 MMstb(1)
(1) Source: ERC Equipoise. Gross volume estimates as at 31 December 2016 (12.9 MMstb Jurassic production in 2017)
Areal extent of the Jurassic is 135 sq. km

Upside from Other Reservoirs: Triassic & Cretaceous10
Oil has been discovered in the Cretaceous: Heavy oil, 2P 3 MMstb / 2C 53 MMstb(1)
And the Triassic: Light oil with 38 - 43 ° API and gas condensate 2P 44 MMstb / 2C 106 MMstb(1)
(1) Source: ERC Equipoise. Gross volume estimates as at 31 December 2016
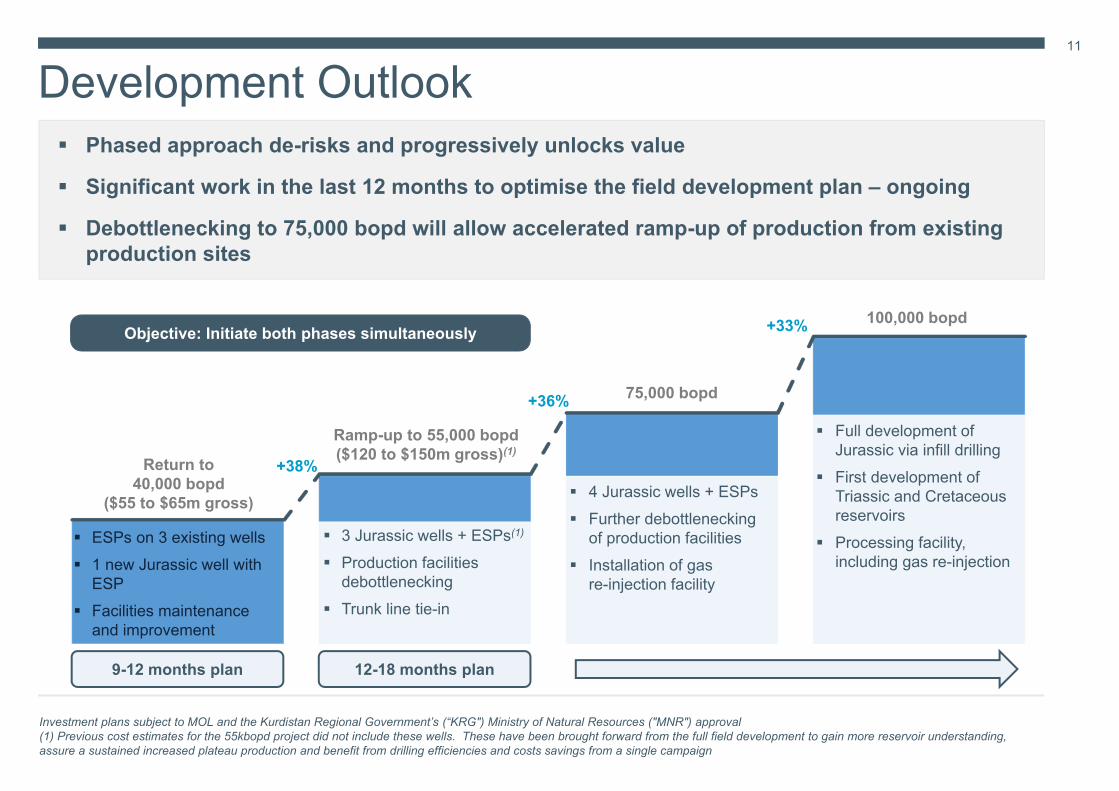
Development Outlook11
Phased approach de-risks and progressively unlocks value
Significant work in the last 12 months to optimise the field development plan – ongoing
Debottlenecking to 75,000 bopd will allow accelerated ramp-up of production from existing production sites
Investment plans subject to MOL and the Kurdistan Regional Government’s (“KRG") Ministry of Natural Resources ("MNR") approval(1) Previous cost estimates for the 55kbopd project did not include these wells. These have been brought forward from the full field development to gain more reservoir understanding, assure a sustained increased plateau production and benefit from drilling efficiencies and costs savings from a single campaign
3 Jurassic wells + ESPs(1)
Production facilities debottlenecking
Trunk line tie-in
4 Jurassic wells + ESPs Further debottlenecking
of production facilities Installation of gas
re-injection facility
Full development of Jurassic via infill drilling
First development of Triassic and Cretaceous reservoirs
Processing facility, including gas re-injection
+36%
+33%
+38%
9-12 months plan 12-18 months plan
ESPs on 3 existing wells 1 new Jurassic well with
ESP Facilities maintenance
and improvement
Return to 40,000 bopd
($55 to $65m gross)
Ramp-up to 55,000 bopd ($120 to $150m gross)(1)
75,000 bopd
100,000 bopdObjective: Initiate both phases simultaneously
Financial Review: Sami Zouari, CFO
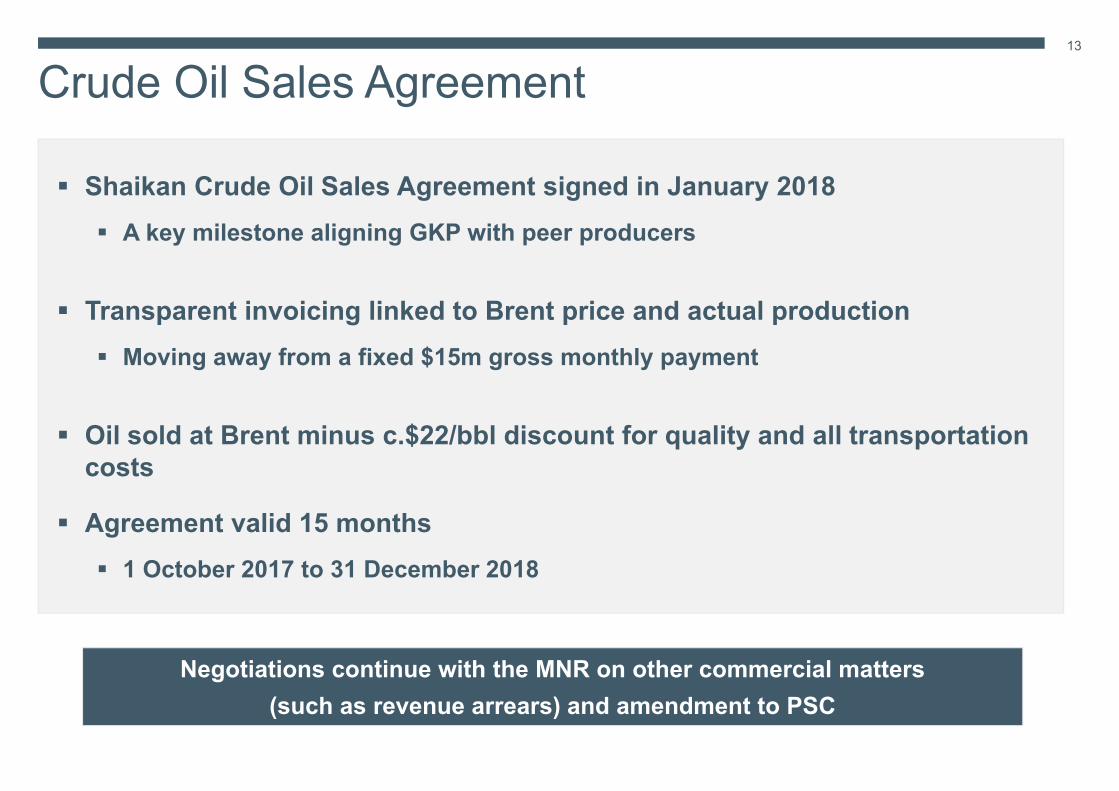
Shaikan Crude Oil Sales Agreement signed in January 2018 A key milestone aligning GKP with peer producers
Transparent invoicing linked to Brent price and actual production Moving away from a fixed $15m gross monthly payment
Oil sold at Brent minus c.$22/bbl discount for quality and all transportation costs
Agreement valid 15 months 1 October 2017 to 31 December 2018
13
Crude Oil Sales Agreement
Negotiations continue with the MNR on other commercial matters (such as revenue arrears) and amendment to PSC

Significantly higher payments since February 2018Note: February payment comprised October & November 2017 oil sales
14
Increased Monthly Payments
Payment from KRG – Net to GKP ($m)
Q4 2016 Oil Sales Full Year 2017 Oil Sales
$12.0 $12.0 $12.0 $12.0 $12.0 $12.0 $12.0 $12.0 $12.0 $12.0 $12.0 $12.0
$30.4
$17.0
$0.0
$5.0
$10.0
$15.0
$20.0
$25.0
$30.0
$35.0
Jan-17 Feb-17 Mar-17 Apr-17 May-17 Jun-17 Jul-17 Aug-17 Sep-17 Oct-17 Nov-17 Dec-17 Jan-18 Feb-18 Mar-18

15
Financial Highlights
Cash Balance: +73%$160m (vs $93m at 31 Dec 2016)
Cash Received for Oil Sales: +28%
Netback per barrel: +45%
Profit After Tax: $14.1m (vs $17.4m loss)
Strong Upward Trends(2017 vs 2016)
Robust operating performance in 2017 delivered further improvements of key metrics and trends
Oil Production Costs: –25%
Shaikan Field Opex per barrel: –19%
G&A Expenses: –17%
Steady Downward Trends(2017 vs 2016)

16
Upward Trends: Revenue and Cash ReceiptsRevenue Change in Cash
$157m of revenue based on cash received (by 31 March 2018)
$15m of payables to the MNR offset against revenue arrears
Netback: $34.6/bbl (2016: $23.8/bbl)
Brent $54.9/bbl less $20.3/bbl for Shaikan quality discount and transportation costs
2017 positive cash flow driven by steady operating activities, payments from KRG and limited investment
$67m net cash increase in 2017
$203m cash with $100m debt as at 10 April 2018
3986
122157
72 15
0
50
100
150
200
250
2014 2015 2016 2017
$ million
Revenue ‐ Cash Component Revenue ‐ Payables Offset
93
160
+85
+1(9)
(9)
0
50
100
150
200
OpeningCash
OperatingActivities
Net Interests InvestingActivities
FX Closing Cash
$ million
$172m$194m
17
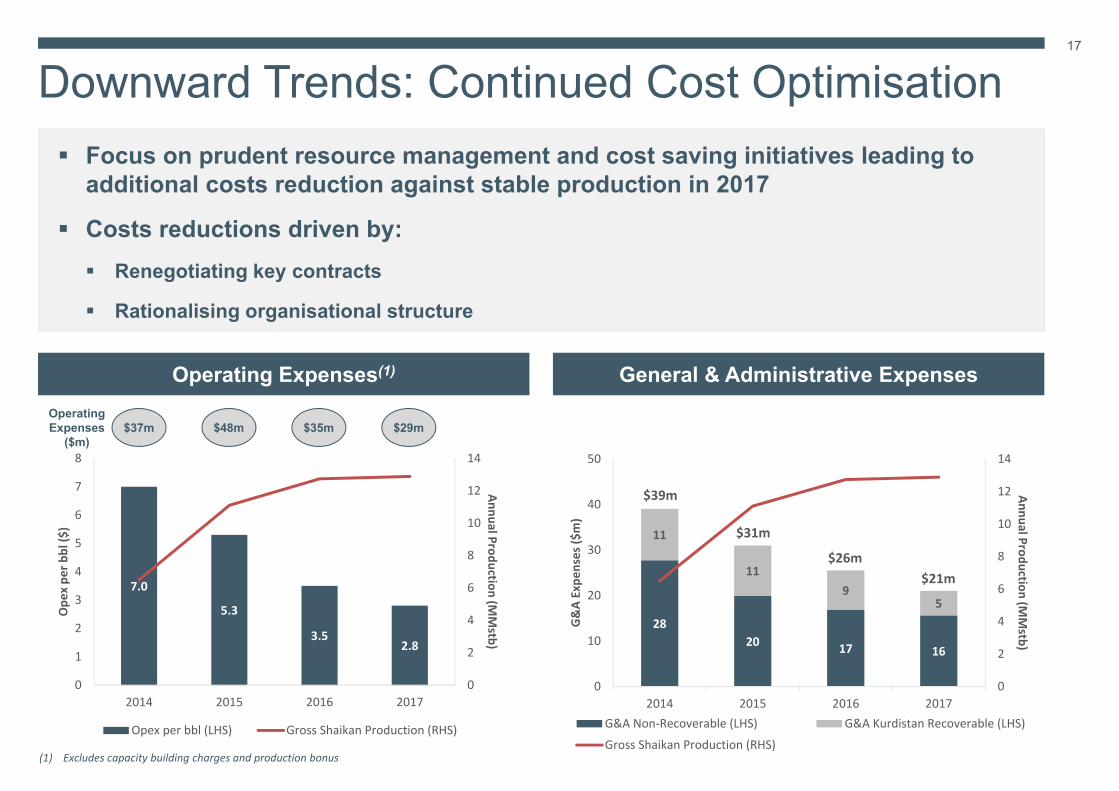
Downward Trends: Continued Cost Optimisation
Operating Expenses(1) General & Administrative Expenses
Focus on prudent resource management and cost saving initiatives leading to additional costs reduction against stable production in 2017
Costs reductions driven by: Renegotiating key contracts
Rationalising organisational structure
(1) Excludes capacity building charges and production bonus
7.0
5.3
3.52.8
0
2
4
6
8
10
12
14
0
1
2
3
4
5
6
7
8
2014 2015 2016 2017
Annual Production (MMstb)
Ope
x pe
r bbl ($
)
Opex per bbl (LHS) Gross Shaikan Production (RHS)
2820 17 16
11
119
5
0
2
4
6
8
10
12
14
2014 2015 2016 20170
10
20
30
40
50
Annual Production (MMstb)
G&A Expe
nses ($
m)
G&A Non‐Recoverable (LHS) G&A Kurdistan Recoverable (LHS)
Gross Shaikan Production (RHS)
$37m $48m $29mOperating Expenses
($m)$35m
$39m
$31m
$26m$21m
18
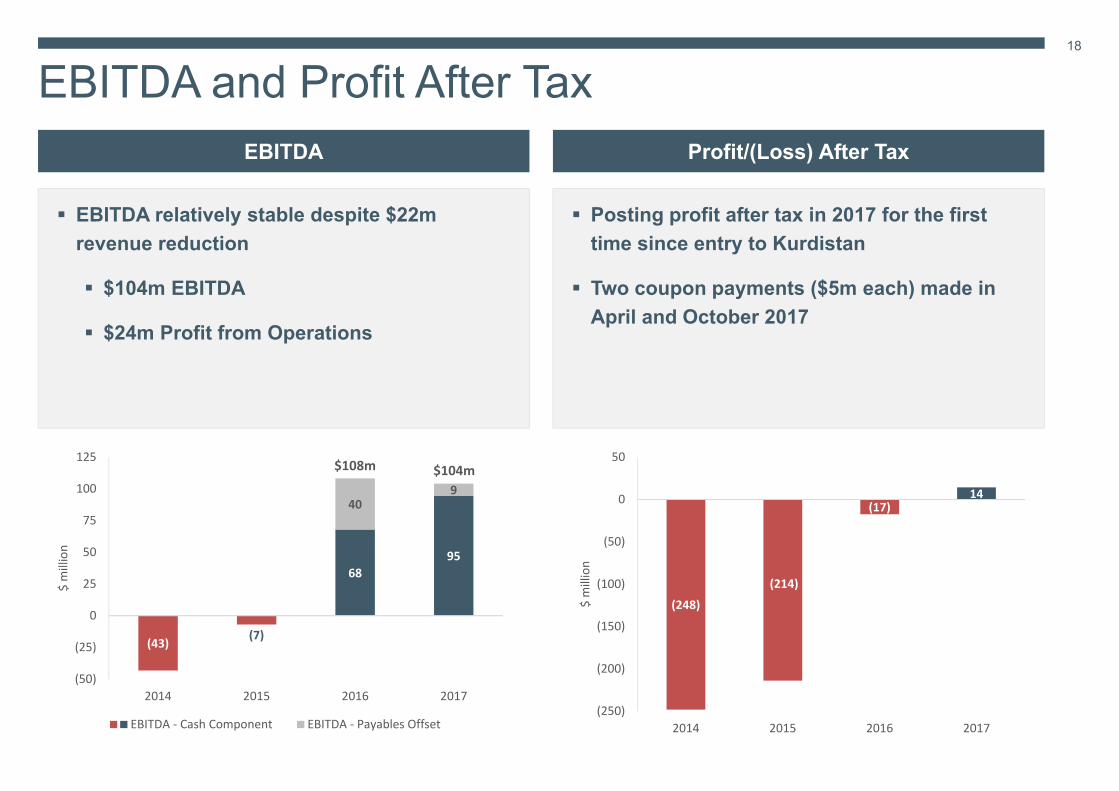
EBITDA and Profit After TaxEBITDA Profit/(Loss) After Tax
EBITDA relatively stable despite $22m revenue reduction
$104m EBITDA
$24m Profit from Operations
Posting profit after tax in 2017 for the first time since entry to Kurdistan
Two coupon payments ($5m each) made in April and October 2017
(43) (7)
6895
409
(50)
(25)
0
25
50
75
100
125
2014 2015 2016 2017
$ million
EBITDA ‐ Cash Component EBITDA ‐ Payables Offset
(248)
(214)
(17)14
(250)
(200)
(150)
(100)
(50)
0
50
2014 2015 2016 2017
$ million
$104m$108m
Conclusion
20
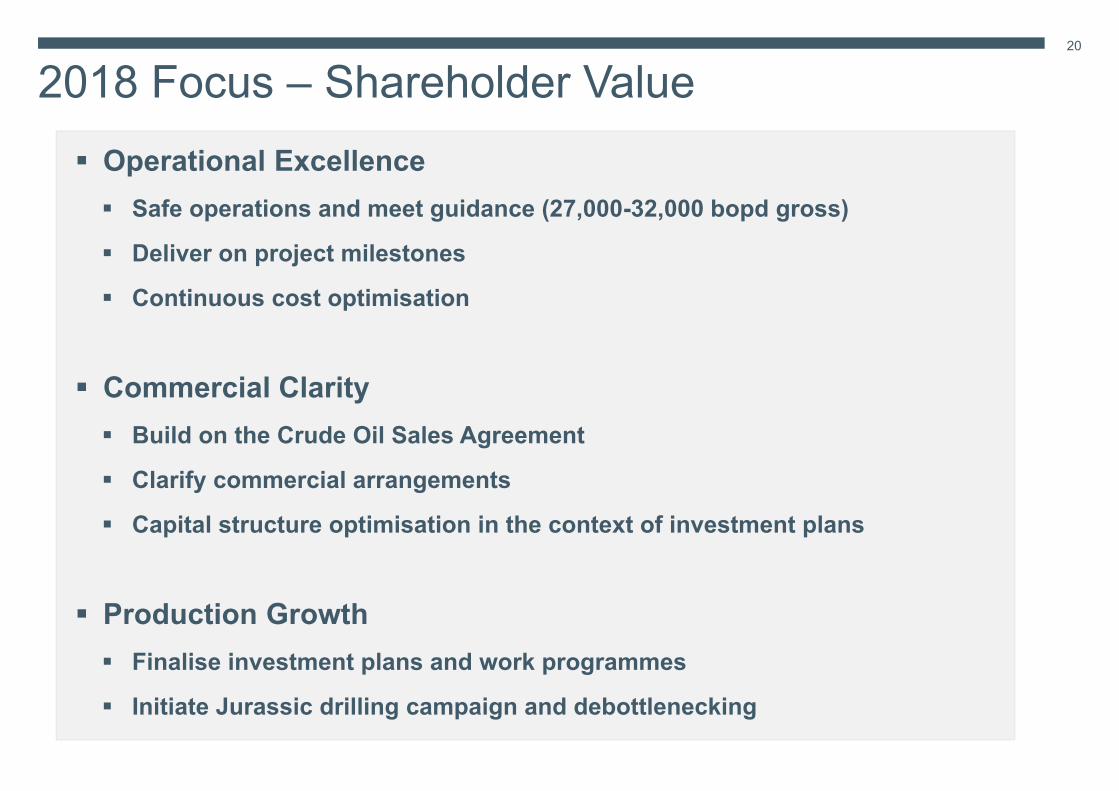
2018 Focus – Shareholder Value Operational Excellence Safe operations and meet guidance (27,000-32,000 bopd gross)
Deliver on project milestones
Continuous cost optimisation
Commercial Clarity Build on the Crude Oil Sales Agreement
Clarify commercial arrangements
Capital structure optimisation in the context of investment plans
Production Growth Finalise investment plans and work programmes
Initiate Jurassic drilling campaign and debottlenecking

Thank youMore resources are available at:
www.gulfkeystone.com