guidelines for optimization and scale-up in...
TRANSCRIPT

34 BioPharm International JANUARY 2003
are conveniently called modes of operation (4).For many separations, the best mode of interac-tion is easily specified, and scale-up or optimiza-tion focuses on choosing the mode of operation.
The appropriate mode of interaction for agiven feedstock is often clear, and the choice liesonly in picking the best mode of operation. In in-dustrial practice, several constraints often restrictthe selection to isocratic elution, sequential stepwise elution, or gradient elution.
Thermodynamically driven separations. The mosteffective form of sequential stepwise elution in-volves choosing appropriate levels for the mobilephase modulator (for example, salts in ion-exchange or organic solvents in reversed-phase)in each step so that only desired product, free ofimpurities, elutes in one of the steps. (If severalcomponents of the feedstock are to be recovered,each component must elute alone in its own mod-ulator step.)
Under these conditions, selectivity becomes ir-relevant because the components are never foundtogether. Hence the column plate count becomesunimportant. This sort of sequential stepwise elu-tion schedule, which can be called thermodynami-cally driven, can be used when feed componentsexhibit on–off binding, that is when feed compo-nents are either very strongly bound or almostcompletely unbound. This kind of “all-or-nothing”adsorption can be used for macromolecules (5,6)and is often exploited in solid-phase extractions.Under these conditions, large particles can be usedwith impunity, both at bench and at process scales.The only problem in scaling up such separations isthe possibility of overloading the column too heav-ily. Because the product is selectively displaced
Preparative chromatography is the domi-nant technique for purifying biologicalcompounds in production, especially inthe pharmaceutical and biotechnologicalindustries. Our theoretical understandingof chromatography tools has deepenedduring the past 20 years. Nevertheless
many obstacles prevent us from making purelytheoretical predictions that realistically mimic aprocess-scale run using biological feedstock.New theoretical advances can, however, supportand supplement purely empirical approaches toscale-up and optimization.
In this article we examine state-of-the-art theo-retical and experimental methods for scale-up andoptimization, and offer some guidelines forstreamlining the design process. We present theelements of a method development strategy forbench-scale use, a simple quantitative scale-upcalculation, and a summary of practical consider-ations in scale-up. More detailed and sophisti-cated scale-up considerations are available in several books (1–3) as well as in the recent chromatography literature.
INTERACT ION AND OPER AT IO N MO D ESThe various kinds of chemical interactions usedin chromatography for selective separations arecalled modes of interaction. Examples includeelectrostatic interactions in ion-exchange or ionchromatography and hydrophobic interactions in reversed-phase or in some affinity-chromatography separations. Once a mode of interaction has been chosen, the various separa-tion methods (isocratic or gradient elution, step-wise elution, displacement, or frontal analysis)
Optimizing yourpurification and
separation process whenyour complex biological
feedstock is ready forscale-up can be daunting.
Your design process can be streamlined,
simplified, and made cost efficient if you
supplement yourempirical approach with the theoretical
and experimental toolspresented in this article.
Guidelines for Optimization and Scale-Upin Preparative Chromatography
Guidelines for Optimization and Scale-Upin Preparative ChromatographyAnurag Rathore and Ajoy VelayudhanAnurag Rathore and Ajoy Velayudhan

BioPharm International JANUARY 2003 35
from binding sites by more retentive impurities, anoverloaded column can cause the product to movefaster than expected and emerge in more than onestep of the stepwise elution schedule. That prob-lem can be avoided by reducing the loading or in-creasing the column length.
Kinetically driven separations. Many separationsof practical importance cannot be run in asequential stepwise manner. The product peakcomigrates with one or more impurities implyingthat kinetic factors will have an effect in deter-mining the extent of mixing between adjacentpeaks in the chromatogram, and therefore affectsrecovery and production rates (1). Gradient elu-tion is a kinetically driven separation method thatis particularly important for biological products.The primary step for using gradient-elution chro-matography is screening a variety of resins sothat the optimal resin is chosen. That choice ismade by ensuring that the objective is clear, iden-tifying the nature of the separation problem, look-ing for literature precedents, and using priorexperience with the product. Input from yourchromatographic media and instrumentationvendors can also be useful at this stage.
L A B -S C ALE PROCESS DEVELOPMENTThe thermodynamic component of method devel-opment can be simple and rapid. For manyseparations, the choice of the stationary-phasemethod is more important than the choice ofmobile phase (particularly for ion-exchange runsin which standard salts are used as mobile phasemodulators). Of course, specific binding oftenrequires the use of special additives to the mobilephase, but this article refers only to the stationaryphase to help make the general approach clear.
Holding one phase constant. To develop the mostefficient separation process, we use a standardmobile phase, then rapidly and equitably screen avariety of stationary-phase resins reducing theproblem to one of “resin screening.” Once resincandidates are available, we screen to select thebest resin for performing a particular separation— perhaps the most important step in methodoptimization (3,7–11).
Resin screening. The algorithm shown in Figure 1 and the screening approach we suggestin the “Two-Stage Approach to Resin Screening”sidebar use ion-exchange chromatography in thegradient mode of operation, but the decisions inthat figure and in the resin selection steps can begeneralized to other contexts.
In most cases, the primary criterion for resinscreening is selectivity. However other screening
Figure 1. Resin screening protocol (7)
Pick pH and buffer
Step 1. Batch experimentto check binding
Step 2. Run a test gradient
Step 3. Run a comparison gradient
Selectivity No
No
No
ENDRemove resinfrom further
consideration
Yes
Pick aresin
Evaluate celution and tw
BindingAppropriate
Calculate recoveryand pool purity
Economicconsiderations
Finaldecision
Resinsremaining?
Yes
YesEND
Remove resinfrom further
consideration
Figure 2. Scaling up from bench or laboratory production to pilot plant production
ConstantLinear flow velocity
Stationary mobile phaseProtein loadingFeed conditions
GradientBed height
IncreaseColumn diameter
Bed height
LimitationsColumn pressureFlow distributionUniform packing
Column A
Column B

36 BioPharm International JANUARY 2003
criteria can also be identified and used forparticular separation problems. The general resinselection approach that we describe has twostages that focus on a comparison gradient asshown in the resin screening sidebar. A compari-son gradient is an equitable way of comparingdifferent stationary phases for a given feedmixture because each stationary phase has a gra-dient that is optimized for its particular retention pattern. With that comparison available, the typi-cal quantitative parameters (production rate,product recovery, and product purity) can be usedto determine which stationary phase is best.
Additional resin selection considerations. Thesimple approach we outline provides a rapidselection tool for choosing the best resin. If thechromatography step of process development isintended for preparative-scale operation, particu-larly for commercial manufacture, other issuesmust be addressed before final resin selection: theresin cost, the physical and chemical stability ofthe resin at bed height, the number of cycles theresin will be reused at the manufacturing plant,the media availability for commercial-scaledemand, the resin lifetime, the leaching ofligands, the regulatory support files offered bythe vendor, and the batch-to-batch variation inresin quality, among others.
Optimization of kinetics at bench-scale. Once thestationary and mobile phases have been chosen,the optimal kinetics or operating conditions needto be determined. These are the studies that deter-mine particle size, column dimensions, optimalgradient slope, and feed loadings.
Operating conditions can be optimized by usingexperiments to evaluate the effect of different op-erating parameters that affect resin performanceselectivity and protein loading. These parameterscan include mobile-phase conditions (pH, organiccontent, and buffer composition, for example) andgradient (slope) design. Optimum mobile-phaseconditions and the gradient design are then chosenfrom the experimental data obtained.
Flow velocity and protein loading are thenevaluated for their effect on separation quality.Resin performance, bed height, protein loading,and flow velocity should offer satisfactory resolu-tion and cycle times. Laboratory experimentsshould be done at the bed height that will be usedat pilot scale to obtain comparable column per-formance data after scale-up. A detailed analysisof the interaction among these kinetic parametersis complicated. In industrial practice, a heuristicapproach similar to the one we describe is oftenused and is likely to produce effective, if notnecessarily optimal, operating conditions in the
To develop the most efficient separation process, we use a standard mobile phase,then rapidly and equitably screen a variety of stationary-phase resins reducing theproblem to one of resin screening as shown in Figure 1. Once resin candidates areavailable, we use a two-stage process to select the best resin for performing a particularseparation. In our example, we have used ion-exchange chromatography in thegradient operation mode, but the decisions in these resin selection steps can begeneralized to other contexts.
Stage 1Pack all stationary phases into columns of identical size. If possible, run all columns at thesame flow rate. (Running at the same flow rate is not always practical. For instance, ifthe particle sizes available for different stationary phases are markedly different,pressure drop constraints can limit the range of flow rates.)
Run a test gradient that spans a wide range of modulator level to facilitate retention. Makethe gradient as shallow as practicable to get as much resolution simultaneously aspossible under these conditions.
Exclude stationary phases that exhibit little or no product retention at this stage. You canalso exclude stationary phases in which little resolution is found between the productand the primary impurities. That decision, however, should be made carefully becausethe test gradient may be a poor indicator of a sorbent’s resolution. In other words, asorbent may provide poor resolution of the product under the test gradient, but highresolution under another gradient, so excluding a resin at this stage should usually bebased on additional supporting data.
Stage 2In this stage of resin selection, parameters such as the feed loading and equilibrationbuffer should be kept the same for all stationary phases. If the same flow rate was usedfor all runs in Stage 1, then maintain that flow rate at this stage. If different sorbentswere run with different flow rates, use the same flow rate used in Stage 1 for eachsorbent in this stage.
Determine a tailored comparison gradient for each of the stationary phases remaining. Thecomparison is intended to show each sorbent under its most effective conditions for thegiven feed mixture. The comparison gradient is centered around the modulatorconcentration at which the product eluted in the test gradient in Stage 1. By making theassumption that, all other parameters being constant, the band spreading of the peaksis inversely proportional to the gradient slope, we get equation 1.
where � and w are respectively the gradient slope and the product peak width in the testgradient, and � and m are the corresponding parameters in the comparison gradient. Ifwe require that all comparison gradients have the same time (for standardization), thenthe starting and ending modulator concentrations (cx and cy respectively) can bedetermined from the following equations (2 and 3)
where celution and tw are respectively the concentration and the time at which the centerof the product peak eluted in the test gradient, n is the number of column volumes inwhich the comparison gradient is run, F is the flow rate, and V is the column volume. Ifthe beginning concentration cx is found to be negative, it is set to zero. Now, the usualquantitative parameters of production rate and recovery and purity can be used todetermine which stationary phase is best.
The assumption that peak width is inversely proportional to the gradient slope is anapproximation and will be invalid or fail in some situations (if there is significantcompetition among the product and impurities for binding sites on the adsorbent, forinstance). However, the assumption is likely to be a reasonable approximation for manyseparations. More detailed methods of this kind can be established (15), but usuallyrequire more data for each sorbent. Similarly, optimal gradients have been determinedin normal and reversed-phase systems through numerical optimization of the governingequations (16); this optimization is a significant advance in the field, but is not yet at thelevel of accessibility in which industrial practitioners would use it routinely. Our two-stage approach was chosen for its simplicity and for its ease of use in an industrialcontext (7).
(3) c y = c elution + α2
nm
t wFV
(2) c x = c elution – α2
nm
t wFV
(1) α × w = β × m
A Two-Stage Approach to Resin Screening

38 BioPharm International JANUARY 2003
Figures 2 and 3 illustrate a common method for scale-up for pilotoperations: handling increased volume by increasing columndiameter, keeping column volume proportional. But such simple“volumetric” scale-up is not always appropriate. The quantitativeanalysis we describe can be used to show whether a volumetricscale-up approach can be used.
Because the quality of the separation achieved at small scale needsto be maintained but the optimal operating conditions for differentscales of operation are unknown, we settle for determining effective,near-optimal operating conditions at bench scale. Effective scale-uprules should then produce comparable results at larger scale.
The usual approach to scale-up is to hold the plate count constantand increase the feed volume and column volume proportionately.
If subscript b describes the parameters at bench scale and l theparameters at large-scale, we have equations 4 and 5
where N is the number of plates, Vfeed the feed volume, and Vcolumnthe column volume.
If band spreading is dominated by pore diffusion, as is often the case(1,2), then the plate count can be described by using equation 6
where L is the column length, u is the mobile phase linear velocity,and dp is the particle diameter. The proportionality constant Kincludes geometrical factors (such as phase ratio) andthermodynamic factors (such as retention factor). The plate countcan also be derived from the van Deemter equation (14), when A andB terms in the van Deemter equation are negligible relative to the C term, and the C term dominated is by pore diffusion.
By combining equations 4 and 6, we get
Equation 7 represents one constraint on the three variables Ll, ul, dp,l.Because this approach is based on mimicking large-scale resultsfrom bench-scale results, the variables Lb, ub, dp,b are assumed to beknown.
Using Darcy’s Law in the following form (equation 8) can help usquantify the pressure drop across the columns
where k is the permeability without any dependence on particlediameter, (which has been factored out) and � is the mobile phaseviscosity. In general, the best results are obtained at the maximumallowable pressure drop (1). If the maximum permissible pressure
drop is different at bench and large scales, we use equation 9
where P is the ratio of maximum pressure drops at large and benchscale. More commonly, in cases where P=1, the result becomesequation 10
.
Dividing our combined equation (equation 7) by the equation above(equation 10) gives the simple expression shown in equation 11
.
Thus equality between plate counts and between maximum pressuredrops leads to equality between mobile phase velocities acrossscales. Substituting equation 11 into either our combined equation 7or the equation for different maximum pressure drops at bench andlarge scales (equation 10), gives us the familiar result in equation 12.
Typically, the choice of particle size is limited during large-scaleprocessing by cost or availability. Once a particle size is chosen, theprevious equation specifies the column length. An approximate theoretical calculation for the optimal lengthis given in the article by Guiochon et al. (1). That equationcan also be used to give us another estimate of the column length,given the particle size.
To determine the column diameter at large scale, equation 5 can berewritten as equation 13.
.
In equation 13, � is the scale-up factor (which must be specifiedbefore scale-up can begin), and Dc is the column diameter. Becausethe column length at large-scale has been determined from equation12, the column diameter can be obtained from equation 14.
In cases in which the particle diameter is kept constant during scale-up, we obtain the scale-up results by “volume overloading” (fromequation 12) and the column length remains constant (in addition tothe particle diameter and the mobile phase velocity). So scale-up inthose cases consists simply of increasing the column diameter by afactor of .
The results in these equations have been obtained for pore diffusionas the process that dominates band spreading. Generalizations ofthe method to mass-transfer as the controlling step, and the effectsof nonlinear adsorption, are summarized in a recent review (17). Thisapproach remains valid for many kinds of overloaded separations.Further discussions on the effects of nonlinear adsorption on scale-up can also be found in the literature (1,2).
These calculations assumed that the phase ratio remained constantupon scale-up. That is not always a good assumption when theoverall scale-up factor is very large (above 100). A recent example ofsuch variations in phase ratio is described by Heuer et al. (18). Inpractice, it is worthwhile to estimate the phase ratio experimentally ateach scale and use the results above with caution if the phase ratiochanges appreciably with scale.
Experimental techniques to avoid changes in packing structure onscale-up include axial compression, radial compression, and annularexpansion (mixed radial and axial compression). Useful reviews ofthese packing methods are found in several references (19–21). Inmany cases, the approaches suggested have resulted in improvedcolumn performance.
σ
(14)D c , l
D c , b= σ L l
L b
12
(13)V feed , l
V feed , b= σ =
V column , l
V column , b=
L lL b
D c , l2
D c , b2
d p2
L
(12)d p , l
2
L l=
d p , b2
L b
(11) u l = u b
(10)u l L l
d p , l2
=u b L b
d p , b2
(9)u l L l
d p , l2
= Pu b L b
d p , b2
(8) u = kd p
2
µ∆p
L
(7)L l
u l d p , l2
=L b
u b d p , b2
(6) N = K Lu d p
2
(5)V feed , l
V column , l=
V feed , b
V column , b(4) N l = N b
Scale-Up Calculations
BioPharm International JANUARY 2003 39
hands of an experienced practitioner. Detailedanalyses of such optimizations have beenpublished elsewhere (12).
A Q U A N T ITAT IVE MODEL FOR SCALE -UPThe performance of a chromatographic column de-pends on a variety of design and operating factors.To facilitate scale-up, you need to maintain kinetic(particle size, pore size, ligand chemistry, tempera-ture, mobile phase) and dynamic (bed height, flowvelocity, packing density) equivalence between thechromatography columns used in the laboratoryand those used in the pilot plant.
Kinetic and dynamic equivalence can be main-tained by using the identical stationary and
mobile phases in the two columns and operatingthem at identical bed height, linear flow velocity,protein loading (mg protein per mL resin), feedconditions, gradient length, and slope (3). Tohandle the increased load volume on a column atpilot scale, the most common procedure is toincrease the column diameter so that the columnvolume increases proportionately (13). Thiskeeps the residence time and the stability of theproduct constant.
Scouting experiments (to find optimal condi-tions) in the laboratory are typically done in smallcolumns to minimize consumption of stationaryand mobile phases; this also permits several runs
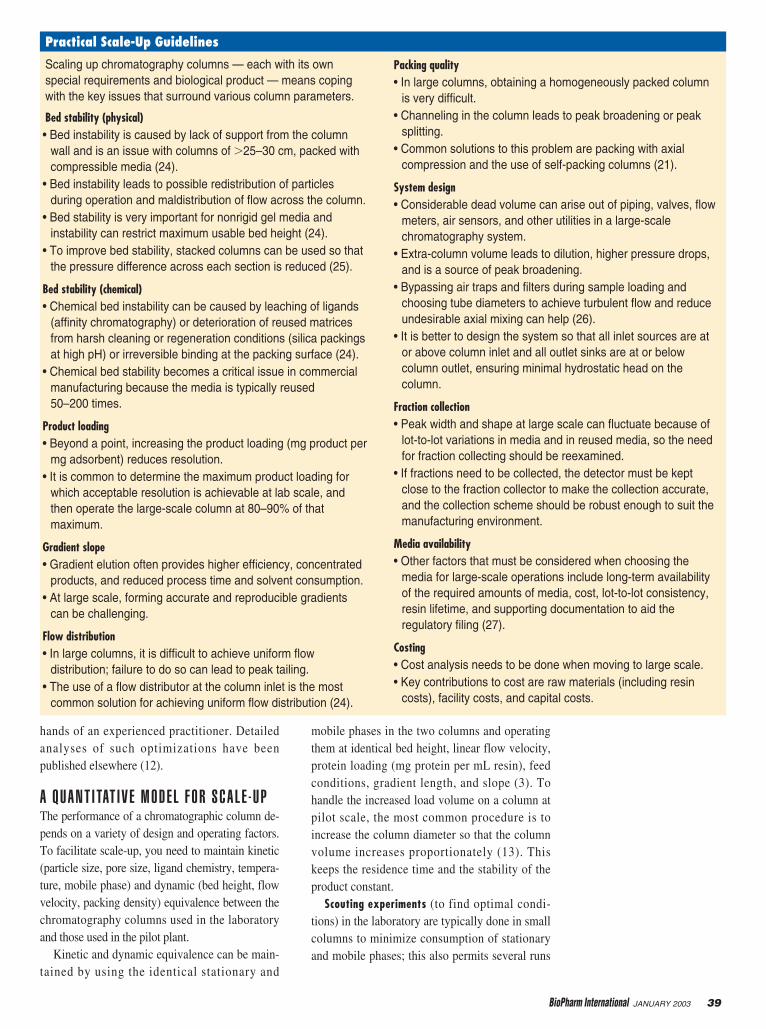
Scaling up chromatography columns — each with its ownspecial requirements and biological product — means copingwith the key issues that surround various column parameters.
Bed stability (physical)• Bed instability is caused by lack of support from the column
wall and is an issue with columns of �25–30 cm, packed withcompressible media (24).
• Bed instability leads to possible redistribution of particlesduring operation and maldistribution of flow across the column.
• Bed stability is very important for nonrigid gel media andinstability can restrict maximum usable bed height (24).
• To improve bed stability, stacked columns can be used so thatthe pressure difference across each section is reduced (25).
Bed stability (chemical)• Chemical bed instability can be caused by leaching of ligands
(affinity chromatography) or deterioration of reused matricesfrom harsh cleaning or regeneration conditions (silica packingsat high pH) or irreversible binding at the packing surface (24).
• Chemical bed stability becomes a critical issue in commercialmanufacturing because the media is typically reused 50–200 times.
Product loading• Beyond a point, increasing the product loading (mg product per
mg adsorbent) reduces resolution. • It is common to determine the maximum product loading for
which acceptable resolution is achievable at lab scale, andthen operate the large-scale column at 80–90% of thatmaximum.
Gradient slope• Gradient elution often provides higher efficiency, concentrated
products, and reduced process time and solvent consumption.• At large scale, forming accurate and reproducible gradients
can be challenging.
Flow distribution• In large columns, it is difficult to achieve uniform flow
distribution; failure to do so can lead to peak tailing.• The use of a flow distributor at the column inlet is the most
common solution for achieving uniform flow distribution (24).
Packing quality• In large columns, obtaining a homogeneously packed column
is very difficult.• Channeling in the column leads to peak broadening or peak
splitting.• Common solutions to this problem are packing with axial
compression and the use of self-packing columns (21).
System design• Considerable dead volume can arise out of piping, valves, flow
meters, air sensors, and other utilities in a large-scalechromatography system.
• Extra-column volume leads to dilution, higher pressure drops,and is a source of peak broadening.
• Bypassing air traps and filters during sample loading andchoosing tube diameters to achieve turbulent flow and reduceundesirable axial mixing can help (26).
• It is better to design the system so that all inlet sources are ator above column inlet and all outlet sinks are at or belowcolumn outlet, ensuring minimal hydrostatic head on thecolumn.
Fraction collection• Peak width and shape at large scale can fluctuate because of
lot-to-lot variations in media and in reused media, so the needfor fraction collecting should be reexamined.
• If fractions need to be collected, the detector must be keptclose to the fraction collector to make the collection accurate,and the collection scheme should be robust enough to suit themanufacturing environment.
Media availability• Other factors that must be considered when choosing the
media for large-scale operations include long-term availabilityof the required amounts of media, cost, lot-to-lot consistency,resin lifetime, and supporting documentation to aid theregulatory filing (27).
Costing• Cost analysis needs to be done when moving to large scale.• Key contributions to cost are raw materials (including resin
costs), facility costs, and capital costs.
Practical Scale-Up Guidelines

40 BioPharm International JANUARY 2003
to be done simultaneously. However, the bedheight must remain constant during scale-up, sothe best scouting approach is to perform the finaloptimization steps at the bed height that will beused later at pilot plant and commercial scale(See Figures 2 and 3).
These general considerations are frequentlyused in industry as the basis for scale-up. But suchsimple “volumetric” scale-up is not appropriate inall cases. The quantitative analysis we describe inthe “Scale-Up Calculations” box can be used toshow when volumetric scale-up can be used.
SCALE -UP CONS IDERAT IO NSThe basic idea behind scale-up is to preserve thequality of the separation achieved at small scale(14). Implicit in our approach to scale-up is theadmission that we are not yet able to determineoptimal operating conditions a priori for differentscales of operation. So we settle for determiningeffective, near-optimal operating conditions atbench scale. Effective scale-up rules should thenproduce comparable results at larger scales. Atypical scale-up from laboratory to pilot plant ison the order of 50- to 100-fold. And that increaseis frequently followed by another 10- to 50-foldscale-up from pilot plant to final commercialmanufacturing scale.
Many parameters affect the success of scale-up, including the resin stability (physical andchemical), the product, the equipment (flowdistributor, fraction collector, packing quality,system design), and the operating conditions(product loading, gradient slope). The “PracticalScale-Up Guidelines” sidebar summarizes thevarious issues that are associated with these para-
meters and points to the pitfalls that can beencountered during scale-up.
Although isocratic and gradient elution are themost common modes of operation (with displace-ment chromatography having a small but signifi-cant role), there are other modes that can be usedat a large scale. Frontal chromatography hasalways played an important role at large scales,under the guise of “adsorption steps” in a varietyof applications, especially in the chemical indus-try. Because feed introduction in isocratic, gradi-ent and displacement runs are nothing more thanfrontal chromatography — clearly an importantpart of a run. The “Comparison of EBA andSMB” box summarizes the key issues for twoother modes of chromatography: expanded bedadsorption (EBA) and simulated moving bed(SMB) chromatography. Although the basicscale-up rules we have outlined apply to bothEBA and SMB techniques, the additional consid-erations for these two modes of operation are dis-cussed in the sidebar.
Just as each mode of operation has its practicalconsiderations, there are many practical issues
Expanded-bed adsorption (EBA) and simulatedmoving bed (SMB) chromatography are twodifferent modes of operation that have someadditional considerations.
Expanded-Bed Adsorption Chromatography
• EBA consists of specially designed particlesfluidized in a column with controlled flowdistribution to provide large numbers ofplates with minimal back mixing (28).
• Stability of the expanded bed is a criticalelement for a successful scale-up of anEBA column and is affected by the flowdistribution, flow velocity, composition andproperties of the feed, particle sizedistribution of the packing, and feed–mediainteractions (28).
Simulated Moving Bed Chromatography
• Mobile phase and feed components areinjected into and withdrawn from a ring ofchromatography columns at points that arerotating between the columns during theprocess.
• SMB is emerging as the mode of choice forenantiomeric separations (29).
• Stability of the different zones depends onan accurate and precise control ofoperating flow rates and valve switchingtimes of the feed and eluent streams (29).
Figure 3. Scaling-up from pilot plant production to commercial production
ConstantLinear flow velocity
Stationary mobile phaseProtein loadingFeed conditions
GradientBed height
IncreaseColumn diameter
LimitationsColumn pressureFlow distributionUniform packing
Column B Column C
Comparison of EBA and SMB

Figure 4. Scale-up of an anion-exchange (AE) column fromlaboratory production to pilotplant scale; (a) purity of columnfractions by AE high performanceliquid chromatography (HPLC) atlab scale to (b) purity of columnfractions by AE-HPLC at pilotplant scale
100
80
60
40
20
0
100
80
60
40
20
0
2 6 10 14 18 22 26
1 6 11 16 21
Prepeak impurityProductPostpeak impurity
ProductImpurity
Column fraction
Column fraction
AE
–HP
LC P
urity
(%
)A
E–H
PLC
Pur
ity (
%)
(a)
(b)
Each mode of interaction has various practical considerationsduring scale up.
Ion-exchange chromatography (IEC)• IEC is commonly used for protein separation because of its
high dynamic capacities, low relative media costs, the ability touse simple buffers, high usable flow rates, robustness,scalability, and ease of operation.
• Scale-up is relatively easy to perform following the guidelinesmentioned in this article and in the literature (2).
Hydrophobic interaction chromatography (HIC)• Denaturation of the product can result from the use of high salt
concentrations.• High viscosity of the mobile phase can reduce the accuracy
and reproducibility of the gradient formation and limit themaximum bed height that can be used (30).
• HIC separations are typically sensitive to temperaturevariations in buffers or in the surrounding environment.
Size-exclusion chromatography (SEC)• In most cases, the maximum bed height and column diameter
that can be used are limited by the physical stability of themedium. This is commonly resolved by using a series ofsmaller columns.
• Although separation time increases linearly with bed height aswith other modes, the resolution only increases as a squareroot of bed height.
• Resolution depends on the feed volume (relative to the columnsize). It has been suggested that desirable cycle time andresolution can be obtained when scaling up an SEC column byselecting the bed height and linear flow velocity, then varyingthe feed volume to fine-tune the resolution. The columndiameter is changed to meet productivity requirements (31).
• Typically, to achieve an acceptable separation, feed volumeneeds to be 1–5% of column volume.
Reversed-phase chromatography (RPC)• RPC is popular for separating small molecules and is limited in
protein applications because of issues about the use oforganic or volatile solvents in purification processes (such asprotein denaturation and unfolding, waste handling, possibleneed for explosion-proof equipment, and environmentconcerns).
Affinity or metal (chelate) chromatography• These techniques offer short processing times and high
specificity and resolution and are particularly useful when thetarget is present in low concentrations in a complex mixture.
• Media are generally expensive and can be unstable undercertain operating conditions (ligand leaching).
• Resins are often compressible, so physical stability of the bedcan be an issue (32,33).
Comparison of Different Chromatography Interaction Modes
BioPharm International JANUARY 2003 41
peculiar to each mode of interaction. The generalfeatures of the various modes are presentedbriefly in the “Comparison of Different Chro-matography Interaction Modes” sidebar.
S C A L E -UP EXAMPLEFigure 4 shows an example of scale-up of ananion-exchange chromatography column. Boththe separations were performed, as suggested inFigure 2, with identical stationary and mobilephase conditions, linear flow velocity, proteinloading, feed conditions, and gradient slope. How-ever, the column volume increased 600-fold between lab scale (1.6 cm diameter, 5 cm height, 10-mL volume) and pilot scale (20 cm diameter,20 cm height, 6.3 L volume). Purity of the differ-ent column fractions, as measured by the analyti-cal anion-exchange chromatography assay, isplotted in Figures 4a and 4b. The scale-up wassuccessful because the elution patterns for boththe product and the impurities are identical. Purityfor the final column pools was estimated to be94% at lab scale and 99% at pilot scale. The stepyield for the column also compared favorably be-tween the two scales (51% at lab scale and 61% atpilot scale). This example underlines the impor-tance of following the above-mentioned guide-lines for scale-up of a chromatography column.
CHRO MATO G R A P H Y C O LU MN S C A LE -U PThis article provides an overview of the basicprinciples and practices of scale-up in preparativechromatography. Modes of interaction and modesof operation are defined to clarify the optionsavailable during scale-up. Because it is first nec-essary to optimize a bench-scale separation be-fore attempting to scale it up, attention is first fo-

42 BioPharm International JANUARY 2003
cused on method development at bench-scale.Thermodynamically driven separations are basedon finding an appropriate sequential stepwise elu-tion schedule and are trivial to scale up. Kineti-cally driven separations are exemplified by gradi-ent elution, with resin screening on a rationalfooting. Finally we presented a simple scale-upmethod and practical considerations that oftenarise during scale up of a column. BPI
REFERENCES(1) Guiochon, G., Golshan-Shirazi, S., and Katti, A.M.,
Fundamentals of Preparative and NonlinearChromatography (Academic Press, Boston,1994).
(2) Scale-Up and Optimization in PreparativeChromatography: Principles and BiopharmaceuticalApplications, A.S. Rathore and A. Velayudhan, Eds.(Marcel Dekker, New York, 2002).
(3) Handbook of Process Chromatography: A Guide toOptimization, Scale-Up and Validation, G. Sofer andL. Hagel, Eds. (Academic Press, New York, 1997),pp. 27–113.
(4) Lee, A., Velayudhan, A., and Horváth, Cs.,“Preparative HPLC,” Proc. 8th Int. BiotechnologySymp., G. Durand, M. Bobichon, and J. Florent, Eds.(Société Française de Microbiologie, Paris, 1, 1988),pp. 593–610.
(5) Jennissen, H.P., “Evidence for NegativeCooperativity in the Adsorption of Phosphorylase bon Hydrophobic Agaroses,” Biochemistry 15,5683–5692 (1976).
(6) Velayudhan, A. and Horváth, Cs., “PreparativeChromatography of Proteins: Analysis of theMultivalent Ion-Exchange Formalism,” J. Chromatogr. 443, 13–29 (1988).
(7) Rathore, A.S., “Resin Screening for Optimization ofChromatographic Separations,” LCGC N.A. 19(6),616 (2001).
(8) Janson, J.C. and Pettersson, T., “Large-ScaleChromatography of Proteins,” Preparative andProduction Scale Chromatography, G. Ganetsos andP.E. Barker, Eds. (Marcel Dekker, New York, 1993),pp. 559–590.
(9) Hedman, P. et al., “Large Scale Chromatography:Optimization of Preparative ChromatographicSeparations with Respect to Column PackingParticle Size, Mass Loading, and Flow Rate,” 8th Int. Biotechnol. Symp. Vol. 1, G. Durand, L.Bobichon, and J. Florent, Eds, 623–643 (1988).
(10) Wisniewski, R., Boschetti, E., and Jungbauer, A.,“Process Design Considerations for Large-ScaleChromatography of Biomolecules,” Biotechnologyand Biopharmaceutical Manufacturing, Processing,and Preservation, K.E. Avis and V.L. Wu, Eds.(Interpharm, Buffalo Grove, 1996), pp. 61–198.
(11) Rathore, A.S., “Case Study: Process Development ofa Chromatographic Step for Purification of aRecombinant E. Coli Expressed Protein,” Scale-Upand Optimization in Preparative Chromatography:Principles and Biopharmaceutical Applications,Chapter 12, A. S. Rathore and A. Velayudhan, Eds.(Marcel Dekker, New York, 2002).
(12) Felinger, A., “Optimization of PreparativeSeparations,” Scale-Up and Optimization inPreparative Chromatography: Principles andBiopharmaceutical Applications, Chapter 3, A.S. Rathore and A. Velayudhan, Eds. (Marcel Dekker, New York, 2002).
(13) Groundwater, E., “Guidelines for ChromatographyScale-Up,” Lab. Pract. 34, 17–18 (1985).
(14) Grushka, E.L., Snyder, L.R., and Knox, J.H.,“Advances in Band Spreading Theories,”
J. Chromatogr. Sci. 13, 25–33, 1975.(15) Quarry, M.A., Grob, R.L., and Snyder, L.R.,
“Prediction of Precise Isocratic Retention Data fromTwo or More Gradient Elution Runs: Analysis ofSome Associated Errors,” Anal. Chem. 58, 907–917(1986).
(16) Jandera, P., “Simultaneous Optimization of GradientTime, Gradient Shape, and Initial Composition ofthe Mobile Phase in the High-Performance LiquidChromatography of Homologous and OligomericSeries,” J. Chromatogr. A 845, 133–144 (1999).
(17) Rathore, A.S. and Velayudhan, A., “An Overview ofScale-Up in Preparative Chromatography,” Scale-Upand Optimization in Preparative Chromatography:Principles and Biopharmaceutical Applications,Chapter 1, A.S. Rathore and A. Velayudhan, Eds.(Marcel Dekker, New York, 2002).
(18) Heuer, C., et al., “Scale Up in PreparativeChromatography,” J. Chromatogr. A 752, 19–29(1996).
(19) Jones, K., “Process Scale High-Performance LiquidChromatography, Part 1: An Optimization Procedureto Maximise Column Efficiency,” Chromatographia25, 437–446 (1998).
(20) Jones, K., “A Review of Very Large ScaleChromatography,” Chromatographia 25, 547–559(1998).
(21) Colin, H., “Large-Scale High-PerformancePreparative Liquid Chromatography,” Preparativeand Production Scale Chromatography, G. Ganetsosand P.E. Barker, Eds. (Marcel Dekker, New York, 1993), pp. 11–46.
(22) Mohammad, A.W., Stevenson, D.G. and Wankat,P.C., “Pressure Drop Correlations and Scale-Up ofSize Exclusion Chromatography with CompressiblePackings,” Ind. Eng. Chem. Res. 31, 549–561(1992).
(23) Janson, J.C., “Large-Scale Chromatography,” GBFMonogr. Ser. 7, 13–20 (1984).
(24) Janson, G.F. and Dunhill, P., “Factors AffectingScale-Up of Chromatography,” Fed. Eur. Biochem.Soc. Meet. (Proc.), B Spencer, Ed., Ind. AspecsBiochem., Part 1, 30, 81–105 (1974).
(25) Janson, J.C. and Hedman, P., “Large-ScaleChromatography of Proteins. Adv. Biochem. Eng. 25,43–99 (1982).
(26) Zeilon, P., Stack, L., and Majors, R.E., “SystemDesign for Process-Scale Chromatography,” LCGC N.A. 10, 736–742 (1992).
(27) Levison, P.R., “Techniques in Process-Scale Ion-Exchange Chromatography,” Preparative andProduction Scale Chromatography, G. Ganetsos andP.E. Barker, Eds (Marcel Dekker, New York, 1993),pp. 617–626.
(28) Frej, A.B., “Expanded Bed Adsorption,”Encyclopedia of Bioprocess Technology:Fermentation, Biocatalysis, and Bioseparation, Vol. 1, M.C. Flickinger and S.W. Drew, Eds.(Wiley-Interscience, New York, 1999), pp. 20–31.
(29) Nicoud, R.M. and Majors, R.E., “Simulating MovingBed Chromatography for Preparative Separations,LCGC N.A. 18, 680–687 (2000).
(30) Grund, E., “Hydrophobic InteractionChromatography of Proteins,” Bioseparation andBioprocessing, Vol. 1, G. Subramanian, Ed. (VCH,New York, 1994), pp. 65–88.
(31) Janson, J.C., “Process Scale Size ExclusionChromatography,” Process Scale LiquidChromatography, G. Subramanian, Ed. (VCH, NewYork, 1995), pp. 81–98.
(32) Chase, H.A., “Optimisation and Scale-Up of AffinityChromatography,” Makromol. Chem., Macromol.Symp. 17, 467–482 (1988).
(33) Arnold, F.H. et al., “A Rational Approach to theScale-Up of Affinity Chromatography,” ACS Symp.Ser., Purif. Ferment. Prod. 271, 113–122 (1985).
Corresponding author AnuragRathore is at Pharmacia Corporation,700 Chesterfield Parkway North.Chesterfield, MO 63017,636.737.6790, fax [email protected],and Ajoy Velayudhan is in theDepartment of Bioengineering atOregon State University.