guidelines for irrigation water requirements in the poverty bay … · 2012-06-25 · guidelines...
TRANSCRIPT

Guidelines for Irrigation Water Requirements in the Poverty Bay Flats
EnviroLink Project: 1013-GSDC93
Prepared for Gisborne District Council and Irrigation User Group
Report H12000/3
May 2012

Disclaimer: This report has been prepared solely for the benefit of Gisborne District Council and Irrigation User Group. No liability is accepted by Aqualinc Research Ltd or any employee or sub-consultant of this Company with respect to its use by any other person. This disclaimer shall apply notwithstanding that the report may be made available to other persons for an application for permission or approval or to fulfil a legal requirement.
Quality Control
Client: Gisborne District Council
Report reference: Title: Guidelines for Irrigation Water Requirements in the Poverty Bay Flats No: H12000/3
Prepared by: Greg Barkle, Channa Rajanayaka, Peter Brown and Brad Monahan
Reviewed by: Greg Barkle Approved for issue by: Greg Barkle
Date issued: March 2012 Project No: H12000
Document History
Version: 1 Status: Draft for GDC review Author: CR,PB, BM
Reviewer:
GB (ARL)
(PM,YK) GDC
Date: 28-2-2012 Doc ID: Gisborne PBF Guidelines irrigation requirements Draft
Typist: Approver:
Version: 2 Status: Draft for GD Irrigation Group Author: CR,PB, BM
Reviewer:
GB (ARL)
(SD, IW, TL) IUG
Date: 15-3-2012 Doc ID: Gisborne PBF Guidelines irrigation requirements Draft
Typist: Approver:
Version: 3 Status: Draft for GD Irrigation Group Author: CR,PB, BM
Reviewer: GB
Date: 30-5-2012 Doc ID: Gisborne PBF Guidelines irrigation requirements Final
Typist: Approver: GB
© All rights reserved. This publication may not be reproduced or copied in any form, without the permission of the Client. Such permission is to be given only in accordance with the terms of the Client’s contract with Aqualinc Research Ltd. This copyright extends to all forms of copying and any storage of material in any kind of information retrieval system.
CHRISTCHURCH PO Box 20-462, Bishopdale 8543, Christchurch ♦ Phone: (03) 964 6521 ♦ Fax: (03) 964 6520
HAMILTON PO Box 14-041, Enderley 3252, Hamilton ♦ Phone: (07) 858 4851 ♦ w w w . a q u a l i n c . c o m

TABLE OF CONTENTS
Page
List of Abbreviations .............................................................................................................. iv
List of Acronyms..................................................................................................................... iv
Glossary ................................................................................................................................... iv
Acknowledgements .................................................................................................................. 1
Executive Summary................................................................................................................. 2
1 Overview.......................................................................................................................... 3
2 Climate ............................................................................................................................ 3
3 Soils .................................................................................................................................. 5
4 Crops................................................................................................................................ 7
5 Water Balance Modelling ............................................................................................ 10
6 Results............................................................................................................................ 12 6.1 Maximum Daily Irrigation Requirements............................................................. 12 6.2 Annual Irrigation Requirements............................................................................ 14 6.3 Percent Seasonal Demand for Small Vegetable.................................................... 17
7 Farm Water Requirements.......................................................................................... 21
8 References .....................................................................................................................23 List of Appendices: Appendix A: Climate data ....................................................................................................... 24 Appendix B: Soils data ............................................................................................................ 26 Appendix C: Grower information............................................................................................ 34 Appendix D: Crop maximum rooting depth ............................................................................ 38 Appendix E: 1-in-5 year drought and maximum yearly irrigation requirements .................... 40 Appendix F: Percent distribution of irrigation requirements by season for continuously
cropped Vegetables – Small Green..................................................................... 43 List of Tables:
Table 1: Soil profile available water (PrAW) summary ............................................................ 7 Table 2: A summary of crops modelled..................................................................................... 8 Table 3: Estimated maximum daily irrigation requirements for Vegetables – Small Green...13
Guidelines for Irrigation Water Requirements in the Poverty Bay Flats © Aqualinc Research Ltd Prepared for Gisborne District Council and Irrigation User Group (Report H12000/3, February 2012) Page i

Table 4: Estimated maximum daily irrigation requirements for Vegetables - Cucurbits family and Tomatoes .......................................................................................................... 13
Table 5: Estimated maximum daily irrigation requirements for Horticulture, Arable and Pasture ..................................................................................................................... 13
Table 6: Estimated average annual irrigation requirements for Vegetables – Small Green.... 14 Table 7: Estimated average annual irrigation requirements for Vegetables - Cucurbits family
and Tomatoes .......................................................................................................... 15 Table 8: Estimated average annual irrigation requirements for Horticulture, Arable and
Pasture ..................................................................................................................... 15 Table 9: Estimated 1-in-10 year drought irrigation requirements for Vegetables – Small
Green ....................................................................................................................... 16 Table 10: Estimated 1-in-10 year drought irrigation requirements for Vegetables - Cucurbits
family and Tomatoes ............................................................................................... 16 Table 11: Estimated 1-in-10 year drought irrigation requirements for Horticulture, Arable and
Pasture ..................................................................................................................... 17 Table 12: Estimated seasonal irrigation requirements for Citrus............................................. 17 Table 13: 1-in-10 year annual water requirement for a vegetable farm .................................. 19 Table 14: Example calculation of 1-in-10 year water requirement for a 30 ha farm............... 22 Table A1: Total monthly rainfall recorded at Gisborne Airport.............................................. 24 Table A2: Total monthly ETo recorded at Gisborne Airport .................................................. 25 Table B1: Soil profile available water (PrAW) data................................................................ 26 Table C1: Typical vegetable irrigation practices ..................................................................... 35 Table C2: Typical irrigation practices for other crops............................................................. 36 Table C3: Typical irrigation..................................................................................................... 37 Table C4: Growing information for Vegetable - small green crops ...................................... 37 Table D1: Crop maximum rooting depth................................................................................. 38 Table E1: Estimated 1-in-5 year irrigation requirements for Vegetables – Small Green........ 40 Table E2: Estimated 1-in-5 year irrigation requirements for Vegetables - Cucurbits family
and Tomatoes .......................................................................................................... 40 Table E3: Estimated 1-in-5 year irrigation requirements for Horticulture, Arable and Pasture41 Table E4: Estimated maximum irrigation requirements for Vegetables – Small Green ......... 41 Table E5: Estimated maximum irrigation requirements for Vegetables - Cucurbits family and
Tomatoes ................................................................................................................. 41 Table E6: Estimated maximum irrigation requirements for Horticulture, Arable and Pasture42 Table F1: Percent distribution of irrigation requirements for Lettuce by season .................... 43 Table F2: Percent distribution of irrigation requirements for Baby Leaf by season ............... 44 Table F3: Percent distribution of irrigation requirements for Broccoli by season .................. 45 Table F4: Percent distribution of irrigation requirements for Cabbage by season .................. 46
Guidelines for Irrigation Water Requirements in the Poverty Bay Flats © Aqualinc Research Ltd Prepared for Gisborne District Council and Irrigation User Group (Report H12000/3, February 2012) Page ii

List of Figures:
Figure 1: Poverty Bay Flats rainfall...........................................................................................4 Figure 2: Average rainfall and reference evapotranspiration by month .................................... 4 Figure 3: Available soil water (from DairyNZ 2011)................................................................ 6 Figure B1: Soils map of Ormond area (from DSIR, 1962)...................................................... 30 Figure B2: Soils map of the Ormond Area (from DSIR, 1962)............................................... 31 Figure B3: Soils map of the Patutahi area (from DSIR, 1962)................................................ 32 Figure B4: Soils map of the Patutahi and Te Arai area (from DSIR, 1962)............................ 33
Guidelines for Irrigation Water Requirements in the Poverty Bay Flats © Aqualinc Research Ltd Prepared for Gisborne District Council and Irrigation User Group (Report H12000/3, February 2012) Page iii

LIST OF ABBREVIATIONS
ha hectare l/s litres per second mm millimetre m metre m³ cubic metre m³/s cubic metres per second Mm³ million cubic metres PAW plant available water PrAW profile available water PET potential evapotranspiration VCS virtual climate station
LIST OF ACRONYMS
DSIR Department of Scientific and Industrial Research GDC Gisborne District Council GIS Geographic Information System NIWA National Institute of Water and Atmosphere NZFSL New Zealand Fundamental Soils Layer
GLOSSARY
Crop coefficient (kc) Relates the amount of water lost to evapotranspiration by the crop being studied to the reference evapotranspiration. The coefficient is determined from the ratio of the evapotranspiration for the crop being studied divided by the evapotranspiration for the reference crop, under the same conditions; i.e., evapotranspiration for the well watered studied crop ÷ reference evapotranspiration. (dimensionless).
Water stress reduction factor (ks)
The water stress reduction factor is a function of the soil water status. ks equalled 1.0 when the soil water content is equal to the readily available water, and then ks reduces linearly down to a value of zero at wilting point (dimensionless).
Evapotranspiration (ET)
Water lost by soil evaporation and crop transpiration (mm/day).
Guidelines for Irrigation Water Requirements in the Poverty Bay Flats © Aqualinc Research Ltd Prepared for Gisborne District Council and Irrigation User Group (Report H12000/3, February 2012) Page iv

Guidelines for Irrigation Water Requirements in the Poverty Bay Flats © Aqualinc Research Ltd Prepared for Gisborne District Council and Irrigation User Group (Report H12000/3, February 2012) Page v
Irrigation application efficiency
Average daily depth of applied water during a single irrigation event ÷ average depth of water retained within the root zone, after, run-off, and deep drainage losses (dimensionless).
Irrigation system capacity
Application depth ÷ minimum return period (mm/day).
Potential evapotranspiration (PET)
PET is the environmental demand for water met by evapotranspiration. The reference value (ETo) is the evapotranspiration rate of a short green crop, completely shading the ground, of uniform height and with adequate water available in the soil profile (mm/day).
Plant Available Water (PAW)
Plant available water for a given soil profile is the profile available water adjusted for the rooting depth of the relevant crop and stage of crop being grown (mm).
Profile Available Water (PrAW)
Profile available water reflects the soil's capacity to hold plant available water in the soil profile to a depth of 0.9 metres and expressed as millimetres of water (mm).
Return period Minimum time between the same area or zone being irrigated (days).

Guidelines for Irrigation Water Requirements in the Poverty Bay Flats ©Aqualinc Research Prepared for Gisborne District Council and Irrigation User Group (Report H12000/3, February 2012) 1
ACKNOWLEDGEMENTS
This project was made possible as a result of funding from the EnviroLink (Grant No. 1013-GSDC93). Aqualinc Research would like to acknowledge the extremely valuable assistance and input from local experts on soils and crop rooting depths, crop tolerances information, irrigation management practices and system capacities used in the Poverty Bay. This input is essential in being able to tailor these guidelines to the local irrigation practices used on the Poverty Bay Flats. This includes;
Stuart Davis, Leader Brand Ian Howatson, AgFirst Engineering Trevor Lupton, Lewis Wright Valuation & Consultancy.
We would also like to acknowledge the input from;
Will Faulks, Cox Co. Ltd Ron Prebble Bill Thorpe, First Fresh.
Who attended the workshop and supported the development of these Irrigation Guidelines. Finally, the support from Gisborne District Council staff is acknowledged;
Paul Murphy Yvette Kinsella Dennis Crone.
Thanks for their input to this project and facilitating the process of the development of these guidelines, which is appreciated.

Guidelines for Irrigation Water Requirements in the Poverty Bay Flats ©Aqualinc Research Prepared for Gisborne District Council and Irrigation User Group (Report H12000/3, February 2012) 2
EXECUTIVE SUMMARY
This document provides a guideline to how much irrigation water is required, for a specific level of reliability, to keep crops well watered. It provides this information for the range of crops that potentially can be irrigated on the Poverty Bay Flats in the Gisborne region. The volume of irrigation water required by a crop, in a particular season, is a function of:
The crop and the rooting depth it can achieve; The soil and how much water it can store; The rainfall and evapotranspiration demand for the season; The soil water targets that the irrigation is managed to; and The irrigation system used, i.e. how much water is applied and when. A daily soil water balance model taking into account the above factors, and assuming that good irrigation management practices are followed, has been used to determine how much water is required for each season over 39 years. This data is then translated into probability information, so that the water required (mm/season) to meet a given level of drought, such as 1-in-10 year drought or 1-in-5 years has been ascertained. The system design capacity (mm/day), which is the maximum design rate at which the irrigation system should be designed to achieve the required system performance, is also specified. This document does not address the question of reliability of supply or allocation issues, the irrigation demand calculated assumes that the required water is available at the flow rates and quantities necessary to meet the crop requirements. The values presented in this document should be considered as Guideline values only based on a regional level analysis. If an applicant for a consent has more specific soils data prepared by a competent soil scientist, and/or proposes to manage their irrigation system in a manner than can be proven to be as efficient, or is going to use an irrigation system with a different modus operandi than included in this document, then GDC should carefully review their information and required volumes that the applicant proposes and ascertain if these meet with their objectives for efficient irrigation.

Guidelines for Irrigation Water Requirements in the Poverty Bay Flats ©Aqualinc Research Prepared for Gisborne District Council and Irrigation User Group (Report H12000/3, February 2012) 3
1 OVERVIEW
Irrigation is the major consumptive water use in the Gisborne District (Aqualinc, 2010). The efficient use of water is a key objective of the Resource Management Act, and achieving this outcome is a responsibility of administrative authorities such as Gisborne District Council (GDC). Efficient use, and allocating water in accordance with actual requirements, is important to ensure water allocation is on an equitable basis. In order to define whether irrigation water use is efficient, reasonable water requirements need to be defined. In this report we estimated reasonable water requirements for the crops grown on the Poverty Bay Flats using a daily time step water balance model. This methodology is an accepted method for estimating reasonable irrigation requirements, and is the method of choice for the majority of other regional and unitary authorities in New Zealand. These guidelines cover the Poverty Bay Flats (area of approximately 20,000 ha) since most irrigation in the Gisborne area occurs on this region. These guidelines are not applicable outside of this region due to the different climates and soil types. This work is funded through a grant from the EnviroLink (Grant No. 1013-GSDC93).
2 CLIMATE
Climate data used in this modelling exercise was measured at the Gisborne Airport (NIWA network number D87692 at or near the map reference NZMG Y18:2943888-6271762). Both rainfall and reference evapotranspiration (ETo) data has been recorded at Gisborne Airport since 1972. We used NIWA’s estimate of ETo, calculated from Penman method (Penman, 1948) based on measured radiation, temperature, wind and vapour pressure climate data. This data is considered representative of the study area. The average rainfall is relatively consistent across the Flats as shown in Figure 1, so the airport data can be used to be representative of the study area. Climate data is summarised in Figure 2 and Appendix A.

Gisborne Airport climate station
Figure 1: Poverty Bay Flats rainfall
Figure 2: Average rainfall and reference evapotranspiration by month
Guidelines for Irrigation Water Requirements in the Poverty Bay Flats ©Aqualinc Research Prepared for Gisborne District Council and Irrigation User Group (Report H12000/3, February 2012) 4

Guidelines for Irrigation Water Requirements in the Poverty Bay Flats ©Aqualinc Research Prepared for Gisborne District Council and Irrigation User Group (Report H12000/3, February 2012) 5
3 SOILS
Soils on the flats are predominately clay and silt loams. Drainage in some areas is imperfect, with a high water table limiting crop rooting depths. Other limitations to crop rooting depth include clay confining layers, poor soil structure and poor aeration. Landcare Research recently developed a web based GIS system called S-Map (http://smap.landcareresearch.co.nz/home). At the time of undertaking this project these S-Maps were not available for use. At the time modelling work commenced the most reliable and available data were the soils maps and tables produced by Department of Scientific and Industrial Research in 1962 (DSIR, 1962). These are at a 1:15,840 scale and are held by GDC. The S-Map uses the same soil names and soil map units as used by DSIR (1962). Therefore, GDC will be able to use the soil information provided in this report with the web based S-Maps if required. Three terms are commonly used to describe the amount of soil water available to plants: Profile available water (PrAW), plant available water (PAW) and available water. Available water is the difference between field capacity and wilting point, as illustrated in Figure 3. Profile available water (PrAW) is the amount of available water, down to a specified depth (generally 0.9 m). Profile available water depends only on the characteristics of the soil type, not on the crop. Plant available water (PAW) is the amount of available water for the specific crop rooting zone of the crop being grown. Plant available water depends on the soil type, type of crop, and the stage of crop development. In this document we have abbreviated plant available water as PAW.

Available water
Figure 3: Available soil water (from DairyNZ 2011)
Generally soil reports contains information on profile available water (PrAW), which depends on the soil type only. However, from an irrigation perspective, it is the plant available water (PAW) that determines irrigation water requirements. DSIR (1962) provides the PrAW for the soils of the Poverty Bay Flats; this has been converted into PAW as required for estimating the irrigation requirements in this work. Eight soil groups have been identified from the PrAW properties for top and sub soil data, and the potential maximum rooting depth. A summary of these soil groups is presented in Table 1. Appendix B gives the locations and soil names of the soils within each of these soil groups, along with the individual PrAW values.
Guidelines for Irrigation Water Requirements in the Poverty Bay Flats ©Aqualinc Research Prepared for Gisborne District Council and Irrigation User Group (Report H12000/3, February 2012) 6

Guidelines for Irrigation Water Requirements in the Poverty Bay Flats ©Aqualinc Research Prepared for Gisborne District Council and Irrigation User Group (Report H12000/3, February 2012) 7
Table 1: Soil profile available water (PrAW) summary
PrAW (mm AW/cm soil depth)
Soil group
Maximum rooting depth
(cm) Topsoil
(top 20 cm) Subsoil
A 20 2.0 0.0
B 30 1.1 1.1
C 30 2.0 2.0
D 45 1.9 0.6
E 60 1.9 0.8
F 70 1.9 0.8
G 90 2.0 1.5
H 120 2.0 1.6
4 CROPS
A wide variety of crops is currently irrigated and can potentially be irrigated in the Poverty Bay Flats, including vegetables, fruit, pasture and cereals. For a given parcel of land, with a particular soil and climate, crop irrigation requirements vary depending on three main factors:
i. The crop coefficient (kc). This determines the amount of water lost to evapotranspiration. Crops with higher kc values have higher irrigation requirements.
ii. The rooting depth. This determines the depth of the soil profile from which the plant can abstract water. Crops with shallower rooting depth have less soil water available and hence higher irrigation requirements.
iii. The water stress tolerance of the crop. This determines how sensitive crop yields are to soil moisture deficits. Crops with low water stress tolerance have higher irrigation requirements because they are maintained at a higher soil water level to prevent them being stressed from low soil water conditions and production being limited.
Irrigation properties of common crops grown on the Poverty Bay Flats are given in Table 2. Crop information was provided from consultation with growers following a workshop held in Gisborne on 31 October 2011 (refer Appendix C). Crop coefficient information was predominately from Allen et al. (1998).

Guidelines for Irrigation Water Requirements in the Poverty Bay Flats ©Aqualinc Research Prepared for Gisborne District Council and Irrigation User Group (Report H12000/3, February 2012) 8
Table 2: A summary of crops modelled
Crop kc
Maximum rooting depth
(mm)
Target minimum soil moisture (% of PAW)
Critical PAW
Crops per year
Irrigation season
Vegetables - Small Green
Lettuce 0.4 – 1.1 350 60% 50% Continuous Year round
Baby Leaf 0.4 – 1.1 250 75% 60% Continuous Year round
Broccoli 0.7 – 1.05 500 60% 35% Continuous Year round
Cabbage 0.7 – 1.05 500 60% 35% Continuous Year round
Onions 0.7 – 1.05 250 60% 35% 1 Jul - Feb
Vegetables – Cucurbits family
Melons 0.4 – 1.00 600 60% 40% 1 Sept – Apr
Squash (grown in open field) 0.5 – 0.95 600 60% 35% 1 Aug – Apr
Tomatoes
Tomatoes 0.6 – 1.05 1,000 60% 35% 1 Sept – Apr
Horticulture
Citrus 0.7 700 50% 40% Perennial Year round
Kiwifruit 0.4 – 1.1 500 60% 50% Perennial Nov – Apr
Arable
Sweet Corn 0.3 – 1.15 1,000 50% 35% 1 Oct – Jan
Maize 0.3 – 1.20 800 50% 35% 1 Oct - Jan
Pasture
Pasture 1.0 600 50% 25% Perennial Sept – Apr

Guidelines for Irrigation Water Requirements in the Poverty Bay Flats ©Aqualinc Research Prepared for Gisborne District Council and Irrigation User Group (Report H12000/3, February 2012) 9

Guidelines for Irrigation Water Requirements in the Poverty Bay Flats ©Aqualinc Research Prepared for Gisborne District Council and Irrigation User Group (Report H12000/3, February 2012) 10
5 WATER BALANCE MODELLING
We estimated reasonable irrigation water requirements using a daily time step water balance model. This methodology is an accepted method for estimating irrigation requirements, and is consistent with how the majority of other regional and unitary authorities estimate reasonable irrigation water requirements. We used the relationship between crop and reference evapotranspiration given by Allen et al. (1998): Crop evapotranspiration = ks×kc×Reference evapotranspiration Eqn 1. Where: ks is the water stress reduction factor and
kc is the crop coefficient. The water stress reduction factor is a function of soil moisture. Each day the soil moisture level is calculated from: ASMday i= ASMday i-1 + (rain + effective irrigation - crop evapotranspiration)day I
Eqn 2. Where: ASM = available soil moisture. We assumed an irrigation efficiency value of 80% is achieved, this means that of the applied irrigation water 80% is effective and used by the evapotranspiration processes. To achieve this 80% values requires best management irrigation practices and a well-designed irrigation system. The model assumes any soil water in excess of field capacity drains away beyond the bottom of the root zone and is not available for the crop. Both rooting depth and the crop coefficient values vary over time and between crop types. Consequently, we have modelled variable rooting depth for short rotation crops such as vegetables and variable kc values for each soil-crop combination. This allows the seasonal irrigation depths to be based on the daily demands for the different growing state of the crop for different soil-crop combinations Rooting depth information and soil profile limitations were based on data supplied by local growers and consultants (refer Appendix C). Rooting depth for continuous and single season crops was estimated assuming a continuous growth rate over time, until the maximum rooting depth was reached. For perennial crops and pasture a fixed rooting depth was used. In some cases crops may not be able to grow to the maximum rooting depth due to limitations in the soil profile. For example, rooting depth of broccoli can reach up to 500 mm where soil profile has no restricted pans or high water tables (refer Table 2). However, as shown in Table 1, the maximum potential rooting depth would be limited to 300 mm, if grown on Group C soils. The maximum crop rooting depths modelled for each soil group are listed in Appendix D. For simplicity, the rate at which the root develops will remain unchanged across all soil groups. However, for soils where rooting depth is restricted, the maximum rooting

Guidelines for Irrigation Water Requirements in the Poverty Bay Flats ©Aqualinc Research Prepared for Gisborne District Council and Irrigation User Group (Report H12000/3, February 2012) 11
depth is reached sooner in these soils compared with soils with deeper potential rooting depths. In the case of perennial crops and pasture, the maximum rooting depth was limited to the greater of the maximum potential rooting depth of the soil or the crops requirement.
kc was estimated using a linear function to increase with time in the short rotation crops such as vegetables. The value increases from planting (low) until it reaches a maximum value a few days prior to harvesting. Kiwifruit are a deciduous crop, therefore, the kc is also considered to vary with time. Continuously grown small green crops (e.g. lettuce, baby leaf, broccoli and cabbage) were modelled as “end on end” crops i.e. cultivation and planting occurring directly after harvesting. It is assumed that these crops are irrigated throughout the year whenever they require irrigation. While it is recognised that the crop will not be physically planted in the same location with end on end rotations, it is the most realistic way of representing a continuously grown short rotation crop. As Citrus is an evergreen crop, there are only minor changes over time in the kc value; therefore, a fixed kc value appropriate for mature Citrus has been used. Citrus have been modelled for year round irrigation demand, however it is recognised that only seasonal demands are required dependant on the various citrus varieties grown. To allow for the use of this annual data, the irrigation requirements for Citrus have been presented by season (i.e., Summer, Autumn, Winter and Spring), so that GDC can allocate water based on the seasonal irrigation demand appropriate for the Citrus variety grown. Kiwifruit irrigation season was assumed to be from November to April period and Pasture from September to April. Irrigation application was modelled with differing application depths and frequencies that reflect the changing demand of the crop. Water demand is less when the crop is small compared for a mature crop; this varying demand should also be reflected in the irrigation management used. This allows for the efficient use of water and reduces the level of wastage via deep drainage so that the application depths match the plants ability to extract water. It is also important that when irrigation is applied, soil-water levels are not replenished to field capacity (refer to Figure 3). Good irrigation management requires that spare capacity within the soil profile is allowed for. This practice allows for some advantage to be gained from rainfall events that occur subsequent to irrigation. This not only reduces the irrigation water used but also reduces the drainage below the rooting depth. The strategy modelled was to refill the soil-water profile with irrigation up to maximum of 90% of PAW. We assumed that water can freely drain though the rooting zone down to the deeper soil layers. However, poorly drained soils and a high water table are a characteristic of soils across parts of the Poverty Bay Flats. Aqualinc has worked very closely with GDC and local stakeholders to obtain the best available local information and to identify rooting depth limitation for different soil types. In some soils, rooting depth can be limited due to a high water table condition. Where this occurs, water may be available to the plant via upward flux from the water table through capillary action.

Guidelines for Irrigation Water Requirements in the Poverty Bay Flats ©Aqualinc Research Prepared for Gisborne District Council and Irrigation User Group (Report H12000/3, February 2012) 12
This phenomenon can reduce the irrigation water demand; therefore, seasonal irrigation requirement estimates can be less than the modelled where the water table is high.
The model was run using climate data from 1 June 1972 to 31 May 2011, a total of 39 seasons.
6 RESULTS
Estimated irrigation water requirements for different soil-crop combinations are presented in following sections. The guidelines have been prepared based on unmodified soils and the soil properties are based on the DSIR data (DSIR, 1962). However, farmers modify soil layers by constructing drains for better drainage or levelling soils to reduce surface runoff and erosion. If soils have been modified, the irrigation allocations for such soils need to be calculated based on properties for the modified soil type. For example, if tomatoes are grown on a “Native Soil Group A” (water table is at 200 mm), however, the soil has been modified by introducing drains to lower the water table to 600 mm, water allocation should be based on Soil Group E where the rooting depth is considered to be 600 mm. If soils are modified then the resource consent applicant should work with a soil scientist in consultation with GDC to characterise the soil type that is currently present. Hence, water allocation should be based on the characteristics of the modified soils.
6.1 Maximum Daily Irrigation Requirements
Table 3 lists the maximum daily irrigation requirements for small green vegetables. The maximum daily requirements for cucurbits vegetable and tomatoes are specified in Table 4, and for horticultural, arable and pasture in Table 5. These tables show the irrigation requirements of each soil-crop combination modelled (refer to Appendix B, for details of the soil type). A blank cell indicates that the crop is not considered suitable to grow on that soil type or irrigation is not required due to high water table conditions. It should be noted that different irrigation management strategies can be employed by irrigators than what we have considered. Therefore, the daily irrigation depths listed in Table 3, 4 and 5 should be used as indicative guidelines values only. If an applicant can demonstrate different management, and hence different needs and/or more specific information on their soils or climate than the values presented in this report, the applicant should be given due consideration by GDC.

Table 3: Estimated maximum daily irrigation requirements for Vegetables – Small Green
Maximum daily requirement (mm/d)
Soil group Lettuce Baby Leaf Broccoli Cabbage Onions
A 4 4 4
B 4 4 4 4 4
C 4 4 4 4 4
D 4 4 4 4 4
E 4 4 4 4 4
F 4 4 4 4 4
G 4 4 4 4 4
H 4 4 4 4 4
Table 4: Estimated maximum daily irrigation requirements for Vegetables - Cucurbits family and Tomatoes
Guidelines for Irrigation Water Requirements in the Poverty Bay Flats ©Aqualinc Research Prepared for Gisborne District Council and Irrigation User Group (Report H12000/3, February 2012) 13
Table 5: Estimated maximum daily irrigation requirements for Horticulture, Arable and Pasture
Maximum daily requirement (mm/d)
Soil group Citrus Kiwifruit Sweet Corn Maize Pasture
A B C D 5 5 E 5 5 5 F 5 5 5 5 5
Maximum daily requirement (mm/d)
Soil group Melons Squash Tomatoes
A
B
C
D 4 4
E 4 4 4
F 4 4 4
G 4 4 4
H 4 4 4

Guidelines for Irrigation Water Requirements in the Poverty Bay Flats ©Aqualinc Research Prepared for Gisborne District Council and Irrigation User Group (Report H12000/3, February 2012) 14
G 5 5 5 5 5 H 5 5 5 5 5
6.2 Annual Irrigation Requirements
Average annual water requirements for different soil-crop combinations are listed in Table 6, 7 and 8. Estimated 1-in-10 year irrigation requirements are given in Table 9, 10 and 11. The 1-in-10 year irrigation demand would be sufficient to meet the annual water requirements in nine years out of 10 years; i.e. it is probable that one-in-10 years the full irrigation demand may not be able to be fully met. Appendix E details the estimated 1-in-5 year and maximum (approximately 1-in-40 years) irrigation requirements. As previously discussed, there are different varieties of Citrus grown and irrigated in Poverty Bay Flats. The months that different Citrus varieties require irrigation can vary. Therefore, we have listed the irrigation water demand for Citrus by season rather than on an annual volume. We recommend GDC utilise these seasonal volume guidelines to estimate the water requirements for Citrus for the variety grown. The estimated seasonal irrigation requirements are given in Table 12.
Table 6: Estimated average annual irrigation requirements for Vegetables – Small Green
Average annual water demand (mm/yr)
Soil group Lettuce Baby Leaf Broccoli Cabbage Onions
A 557 685 514
B 586 679 584 671 529
C 591 720 594 634 514
D 575 691 599 636 516
E 581 700 610 636 516
F 581 700 610 636 516
G 585 712 631 649 514
H 587 713 629 651 514

Guidelines for Irrigation Water Requirements in the Poverty Bay Flats ©Aqualinc Research Prepared for Gisborne District Council and Irrigation User Group (Report H12000/3, February 2012) 15
Table 7: Estimated average annual irrigation requirements for Vegetables - Cucurbits family and Tomatoes
Average annual water demand (mm/yr)
Soil group Melons Squash Tomatoes
A
B
C
D 448 481
E 446 478 522
F 446 478 521
G 449 481 536
H 450 479 543
Table 8: Estimated average annual irrigation requirements for Horticulture, Arable and Pasture
Average water demand (mm/yr)
Soil group Kiwifruit Sweet Corn Maize Pasture
A
B
C
D 310 638
E 305 611
F 305 261 268 611
G 307 287 286 570
H 307 290 286 562

Table 9: Estimated 1-in-10 year drought irrigation requirements for Vegetables – Small Green
1-in-10 year water demand (mm/yr)
Soil group Lettuce Baby Leaf Broccoli Cabbage Onions
A 661 751 595
B 693 765 672 780 601
C 702 799 698 744 609
D 675 768 696 739 594
E 682 779 715 749 597
F 682 779 715 749 597
G 698 791 722 770 605
H 694 791 725 790 605
Table 10: Estimated 1-in-10 year drought irrigation requirements for Vegetables - Cucurbits family and Tomatoes
1-in-10 year water demand (mm/yr)
Soil group Melons Squash Tomatoes
A
B
C
D 541 603
E 545 609 653
F 545 609 654
G 562 607 670
H 562 607 686
Guidelines for Irrigation Water Requirements in the Poverty Bay Flats ©Aqualinc Research Prepared for Gisborne District Council and Irrigation User Group (Report H12000/3, February 2012) 16

Table 11: Estimated 1-in-10 year drought irrigation requirements for Horticulture, Arable and Pasture
1-in-10 year water demand (mm/yr)
Soil group Kiwifruit Sweet Corn Maize Pasture
A
B
C
D 393 800
E 375 775
F 375 325 341 775
G 375 360 342 770
H 375 360 351 742
Table 12: Estimated seasonal irrigation requirements for Citrus
Seasonal water demand (mm/yr)*
Winter Spring Summer Autumn Winter Spring Summer Autumn
Soil Group D Soil Group E
Average 0 102 206 44 1 99 202 39
1-in-5 year 0 135 250 75 0 125 250 75
1-in-10 year 0 180 275 80 0 180 275 100
Maximum 0 250 375 150 25 250 375 150
Soil Group G Soil Group H
Average 1 74 183 33 0 73 179 32
1-in-5 year 0 105 245 70 0 105 245 70
1-in-10 year 0 147 252 77 0 147 252 105
Maximum 35 245 385 140 0 245 385 140 * These seasonal water demands represent the probabilistic demand for each season. Therefore, it is not
correct to sum up these seasonal demands for 1-in-5 year and 1-in-10 year to calculate the annual demand, if the crop is irrigated continuously throughout the year. However, as no Citrus variety is irrigated continuously throughout the year, the annual totals are not given.
6.3 Percent Seasonal Demand for Small Vegetable
The annual water requirements for vegetable - small green, that are grown throughout the year (i.e., Lettuce, Baby leaf, Broccoli and Cabbage) are given in Section 6.2. However, it is likely that growers choose not to grow vegetables continuously due to various reasons such as market demand, labour etc. To enable efficient water
Guidelines for Irrigation Water Requirements in the Poverty Bay Flats ©Aqualinc Research Prepared for Gisborne District Council and Irrigation User Group (Report H12000/3, February 2012) 17

Guidelines for Irrigation Water Requirements in the Poverty Bay Flats ©Aqualinc Research Prepared for Gisborne District Council and Irrigation User Group (Report H12000/3, February 2012) 18
allocation for growers that do not grow vegetable continuously, we have estimated water requirements by season, as presented in Appendix F. This is based on the percentage of the annual amount of irrigation used in that season, and calculated by dividing the water requirements for each season, by the annual amount. Where a grower needs water for only part of a season for a given crop, the annual water requirements (Section 6.2) can be used in combination with the seasonal percentage demands as given in Appendix F. As an example Table 13 illustrates how to calculate the 1-in-10 year irrigation water requirements for a 10 ha farm on soil type F that grows cabbage (on whole 10 ha) and then follows this by a baby leaf crop. Section 7 presents another example on how to utilise guideline information for reasonable water allocation for a farm that grows a number of crops (Vegetables and Citrus).

Guidelines for Irrigation Water Requirements in the Poverty Bay Flats ©Aqualinc Research Prepared for Gisborne District Council and Irrigation User Group (Report H12000/3, February 2012) 19
Table 13: 1-in-10 year annual water requirement for a vegetable farm
Example scenario: 10 ha farm is used from the 1st March to 20th June period in a given year to grow Cabbage. This is subsequently followed by six rotations of Baby Leaf from 21st June through to 28th February.
Fallow days
Winter Spring Summer Autumn
Crop
1-in-10 year water
demand (mm/yr) Days
Water not required
(mm/season) Days
Water not required
(mm/ season) Days
Water not required
(mm/ season) Days
Water not required
(mm/ season)
Annual water
requirement for 10 ha (m3/yr)
Cabbage#1 749 72 35.2 91 254.7 90 292.1 9 15.4 15,160
Baby Leaf#2 779 6 5.1 12 31.8 15 44.1 92 187.0 51,100
Total 66,650
Cabbage One-in-10 year irrigation demand in soil group F = 749 mm/year ( Table 9). Growing season includes whole Autumn and 20 days in Winter (1 March to
20 June).
Fallow day: Winter = 72 days Spring = 91 days Summer = 90 days Autumn = 9 days
Percent distribution of irrigation requirement by season: Winter = 6% Spring = 34% Summer = 39% Autumn = 21%
Water not required: Winter = 749 x 6% / 92 days * 72 days = 35.2 mm/season Spring = 749 x 34% = 254.7 mm/season (whole season) Summer = 749 x 39% = 292.1 mm/season (whole season) Autumn = 749 x 21% / 92 days * 9 days = 15.4 mm/season
Baby Leaf One-in-10 year irrigation demand in soil group F = 779 mm/year ( Table 9). Growing season includes whole 10 days in Winter, Spring and Summer 21
June to 28 February (six rotations).
Fallow day: Winter = 6 days Spring = 12 days Summer = 15 days Autumn = 92 days
Percent distribution of irrigation requirement by season: Winter = 10% Spring = 31% Summer = 34% Autumn = 24%
Water not required: Winter = 779 x 10% / 92 days * 6 days = 5.1 mm/season Spring = 779 x 31% / 91 days * 12 days = 31.8 mm/season Summer = 779 x 34% / 90 days * 15 days = 44.1 mm/season Autumn = 779 x 24% = 187 mm/season (whole season)

Guidelines for Irrigation Water Requirements in the Poverty Bay Flats ©Aqualinc Research Prepared for Gisborne District Council and Irrigation User Group (Report H12000/3, February 2012) 20
Annual demand = 749 – 35.2 – 254.7 – 292.1 – 15.4 = 151.6 mm/year Annual volume for 10 ha = 151.6/1,000 x 10 x 10,000 = 15,160 m3/year
Annual demand = 779 – 5.1 – 31.8 – 44.1 – 187 = 511 mm/year Annual volume for 10 ha = 511/1,000 x 10 x 10,000 = 51,100 m3/year

Guidelines for Irrigation Water Requirements in the Poverty Bay Flats ©Aqualinc Research Prepared for Gisborne District Council and Irrigation User Group (Report H12000/3, February 2012) 21
7 FARM WATER REQUIREMENTS
Vegetable growers will generally grow a range of crops on the same area. The irrigation requirements can be calculated from summing the water requirements for individual crops together, as shown in Table 14. The dominant soil type refers to the major soil of the location (refer Appendix B). The irrigation water that is not required on fallow days is based on the percentage of the seasonal water requirements of each crop type (refer Appendix F). The output of this analysis provides an estimation of the volume of water required during a 1-in-10 year drought to irrigate this 30 ha farm. The location of vegetables generally changes from year to year for disease management and fertility reasons. Therefore, it is generally not possible to allocate water for a particular crop using all of the soil types present within a farm. For this reason we recommend in most situations the calculation be based on the dominate farm soil type. For large farms, GDC may choose to account for different soil types at different parts of the farm by calculating water requirements for each of the major soil types along with their representative areas.

Guidelines for Irrigation Water Requirements in the Poverty Bay Flats ©Aqualinc Research Prepared for Gisborne District Council and Irrigation User Group (Report H12000/3, February 2012) 22
Table 14: Example calculation of 1-in-10 year water requirement for a 30 ha farm
Example scenario: In a given year this 30 ha farm grows a mixture of crops including Vegetables and Citrus. Lettuce and Broccoli are grown throughout the year. A single season of Squash is grown. Citrus is irrigated from 1st November to 31st January.
Fallow days
Winter Spring Summer Autumn
Crop Area (ha)
Dominant soil group
1-in-10 year
water demand (mm/yr) Days
Water not required
(mm/season) Days
Water not required
(mm/ season) Days
Water not required
(mm/ season) Days
Water not required
(mm/ season)
Annual water
requirement (m3/yr)
Lettuce 10 A 661 50 18#1 0 0 0 0 0 0 64,300
Broccoli 5 C 698 0 0 0 0 15 43#2 0 0 32,750
Squash#3 5 F 609 0 0 0 0 0 0 0 0 30,450
Citrus (irrigated from 1 Nov to 31 Jan) #4 10 H 222 0 0 0 0 0 0 0 0 22,200
Total 30 149,700
#1 One-in-10 year irrigation demand for Lettuce in soil group A = 661 mm/year. As shown in Appendix F, percent use of the annual volume in Winter = 5%. Therefore, the total 1-in-10 year demand in Winter = 661*5% = 33 mm. Number of fallow days = 50 days. Total number of days in Winter = 92 days. Therefore, amount of water not used due to fallow = 33/92*50 = 18 mm.
#2 One-in-10 year irrigation demand for Broccoli in soil group C = 698 mm/year. As shown in Appendix F, percent use of the annual volume in Summer = 37%. Therefore, the total 1-in-10 year demand in Summer = 698*37% = 258 mm. Number of fallow days = 15 days. Total number of days in Summer = 90 days. Therefore, amount of water not used due to fallow = 258/90*15 = 43 mm.
#3 Seasonal crops with a single crop per year, thus no fallow days within the irrigation season #4 This Citrus variety is irrigated from November through to January. Thus the irrigation season spread over two seasons: Spring and Summer. Therefore, water requirement
for each season has been calculated using the values given in Table 12. Number of days for Spring and Summer are 91 and 90 days, respectively. Demand for November (Spring for soil group H) = 147/91*30 = 48.5 mm. Demand from December to January (Summer) = 252/90*62 = 173.6 mm. Therefore, total demand for Citrus = 48.5 + 173.6 = 222 mm.

Guidelines for Irrigation Water Requirements in the Poverty Bay Flats ©Aqualinc Research Prepared for Gisborne District Council and Irrigation User Group (Report H12000/3, February 2012) 23
8 REFERENCES
Allen, R. G., Pereira, L. S., Raes, D. and Smith, M. (1998). “Crop evapotranspiration: Guidelines for computing crop water requirements”. FAO Irrig. and Drain. Paper No. 56. Rome.
Aqualinc (2010). “Update of water allocation data and estimate of actual water use of
consented takes: 2009-10”. Report prepared for the Ministry for the Environment by Aqualinc Research Ltd. Report No. H10002/3.
DairyNZ (2011). “Guide to Good Irrigation: Part 1: good irrigation practices on-farm”.
Report prepared by DairyNZ. September 2011. DSIR (1962). “Soil map of the Poverty Bay Flats”. NZ Soil Bureau Bulletin 20 incl.
soil maps 32/1-7. Held by Manaaki Whenua Press, Landcare Research, Lincoln.
Landcare (2000). “New Zealand Land Resource Inventory version 2”. GIS spatial data
produced by Landcare Research New Zealand Ltd. NZ Government (2010). “Resource Management (Measurement and Reporting of
Water Takes) Regulations 2010”. New Zealand Government Order in Council dated 23 August 2010.
Penman, H.L. (1948). Natural evaporation from open water, bare soil and grass.
Proceedings of Royal Society, London A193, 120-146.

Guidelines for Irrigation Water Requirements in the Poverty Bay Flats ©Aqualinc Research Prepared for Gisborne District Council and Irrigation User Group (Report H12000/3, February 2012) 24
Appendix A: Climate data Table A1: Total monthly rainfall recorded at Gisborne Airport
Season (Jun-May) Jan Feb Mar Apr May Jun Jul Aug Sep Oct Nov Dec Year
72-73 38 71 47 80 20 115 66 41 11 25 18 102 634 73-74 87 45 148 108 62 140 118 219 112 72 38 43 1,193 74-75 93 46 72 35 122 212 70 129 168 98 21 75 1,140 75-76 105 113 31 180 74 144 55 40 122 48 72 125 1,111 76-77 85 50 67 135 37 67 97 81 212 82 92 86 1,091 77-78 10 192 30 86 71 328 131 174 174 39 42 114 1,390 78-79 49 54 212 29 109 125 191 47 82 78 23 36 1,034 79-80 103 53 106 110 46 65 129 110 100 55 57 132 1,064 80-81 23 63 114 134 108 184 51 122 53 27 62 179 1,119 81-82 41 98 84 232 51 160 151 167 37 92 60 9 1,182 82-83 12 4 11 179 38 111 57 24 100 85 36 11 668 83-84 67 74 102 35 51 160 113 49 19 73 52 68 863 84-85 30 48 115 85 155 129 77 82 160 57 62 52 1,051 85-86 28 62 52 14 61 133 323 48 61 43 64 22 911 86-87 26 63 167 118 55 38 135 75 113 55 67 37 949 87-88 83 135 322 107 46 87 224 51 23 37 119 61 1,294 88-89 93 22 8 4 306 83 158 44 76 16 33 17 859 89-90 33 28 125 37 21 70 50 148 246 49 120 81 1,009 90-91 35 49 113 156 168 145 149 140 34 161 63 35 1,249 91-92 70 68 25 71 259 36 60 23 29 80 127 27 875 92-93 31 233 89 112 70 111 83 29 123 146 141 69 1,238 93-94 40 48 40 108 92 53 30 104 53 7 67 22 665 94-95 51 122 34 159 104 71 118 8 40 108 28 2 844 95-96 109 151 154 146 114 80 105 48 44 48 51 22 1,071 96-97 64 37 233 31 84 67 152 58 30 27 24 147 956 97-98 17 35 32 85 22 167 198 128 71 66 35 16 873 98-99 82 7 94 117 38 53 180 71 9 14 65 55 786 99-00 65 30 159 167 34 109 87 62 64 38 71 162 1,047 00-01 92 131 77 60 84 29 91 40 54 6 146 21 830 01-02 80 69 6 41 35 50 100 60 71 120 58 169 859 02-03 35 76 150 43 100 83 193 125 27 60 35 67 994 03-04 83 92 68 67 154 42 89 190 182 60 80 101 1,207 04-05 30 54 109 80 130 114 195 93 49 62 59 59 1,033 05-06 60 46 169 102 102 113 127 81 26 225 134 57 1,242 06-07 50 41 18 41 10 165 152 78 89 49 19 79 792 07-08 52 41 90 132 199 113 151 66 120 86 13 120 1,182 08-09 96 30 74 55 137 69 130 40 12 28 11 37 718 09-10 129 64 21 75 180 198 210 78 66 153 13 44 1,232 10-11 143 86 159 149 122 122 185 81 60 197 41 24 1,369
Average 62 70 96 95 94 111 128 83 80 71 59 66 1,016

Guidelines for Irrigation Water Requirements in the Poverty Bay Flats ©Aqualinc Research Prepared for Gisborne District Council and Irrigation User Group (Report H12000/3, February 2012) 25
Table A2: Total monthly ETo recorded at Gisborne Airport Season (Jun-May) Jan Feb Mar Apr May Jun Jul Aug Sep Oct Nov Dec Year
72-73 160 121 90 70 57 32 36 53 96 125 160 152 1,152 73-74 142 116 85 58 36 26 27 39 66 115 150 148 1,008 74-75 143 128 99 59 46 30 38 38 60 103 127 142 1,012 75-76 140 113 88 57 44 26 42 53 70 90 126 181 1,029 76-77 155 125 106 68 48 39 38 48 63 87 115 155 1,047 77-78 160 113 103 55 36 27 27 37 73 109 141 151 1,032 78-79 188 126 87 62 39 22 38 47 63 96 143 166 1,075 79-80 146 136 83 54 40 23 28 41 73 102 126 161 1,012 80-81 153 118 92 61 32 20 29 52 87 110 139 125 1,017 81-82 181 113 91 48 44 24 31 40 75 113 132 152 1,044 82-83 174 125 136 62 53 22 31 47 61 97 169 171 1,148 83-84 157 107 86 67 43 30 26 41 78 86 119 146 985 84-85 169 125 87 51 35 30 28 48 58 115 149 155 1,051 85-86 174 119 104 74 41 23 28 45 68 93 136 171 1,076 86-87 181 131 91 63 40 30 35 37 63 99 135 155 1,060 87-88 166 116 97 56 47 28 29 41 80 114 122 174 1,069 88-89 134 118 110 71 37 33 36 51 82 150 142 165 1,131 89-90 150 139 114 78 57 37 28 42 60 111 127 168 1,110 90-91 160 150 88 69 36 27 33 53 68 105 134 186 1,108 91-92 147 136 120 59 38 37 34 66 72 118 128 160 1,115 92-93 158 87 87 54 38 29 39 56 58 88 113 124 930 93-94 178 108 95 62 47 33 26 38 63 116 108 143 1,017 94-95 174 111 113 52 39 30 35 51 77 94 160 171 1,106 95-96 137 108 101 61 42 31 40 51 82 93 129 177 1,053 96-97 144 122 84 66 38 34 29 51 76 111 149 151 1,055 97-98 182 155 116 69 39 27 31 52 56 117 161 184 1,187 98-99 147 123 99 62 45 28 31 48 77 146 115 170 1,090 99-00 130 127 82 55 39 30 34 44 73 109 128 138 989 00-01 147 92 81 53 39 29 31 45 73 121 109 154 972 01-02 151 104 113 57 55 25 29 48 68 106 124 138 1,019 02-03 157 132 82 55 40 40 32 53 91 112 145 163 1,101 03-04 164 120 100 58 39 30 31 39 73 103 133 159 1,049 04-05 172 119 99 61 34 36 28 52 79 113 141 143 1,076 05-06 168 113 89 68 34 28 30 43 72 99 126 146 1,015 06-07 148 113 118 61 46 29 29 49 77 116 156 146 1,085 07-08 157 120 90 55 32 37 32 54 68 136 130 137 1,049 08-09 172 129 100 60 40 33 33 51 75 115 141 163 1,111 09-10 145 114 107 65 30 20 26 47 68 97 142 159 1,018 10-11 165 123 91 54 45 22 24 38 90 103 126 146 1,028
Average 158 120 98 61 41 29 31 47 72 109 135 156 1,057
Calculated from Penman equations (Penman, 1948) using from radiation, temperature, wind and vapour pressure climate data recorded at Gisborne Airport.

Guidelines for Irrigation Water Requirements in the Poverty Bay Flats ©Aqualinc Research Prepared for Gisborne District Council and Irrigation User Group (Report H12000/3, February 2012) 26
Appendix B: Soils data Table B1 lists a summary of soil properties as given in DSIR (1962) database. The profile available water (PrAW) for soils has a range. In order to differentiate the soils based on their PrAW, soil names have been modified by appending “shallow” and “deep”, where necessary. As an example, Makauri clay loam presents in Te Arai area where PrAW varies from 40 through to 200 mm for potential rooting depths of 20 to 120 cm, respectively. Therefore, for soils where the rooting depth is 20 cm (Group A) the soil name is given as “Makauri clay loam (shallow)”, and for deeper soils in Group H with 120 cm rooting depth it is classified as “Makauri clay loam (deep)”.
Table B1: Soil profile available water (PrAW) data
Soil name Soil map unit Location Soil type Top soil PrAW
(mm AW/cm soil depth) Subsoil PrAW
(mm AW/cm soil depth)
Group A: 20cm Rooting depth
Makauri clay loam (shallow) 9 5 10 Te Arai
area 11 silty clay loam 12 2 13 0
Makauri clay loam friable subsoil (shallow)
15 5a 16 Te Arai
area 17 silty clay loam 18 2 19 0
Kaiti silt loam (shallow) 6 Te Arai area silty clay loam 2 0
Kaiti heavy silt loam (shallow) 6b Te Arai area silty clay loam 2 0
Kaiti clay loam (shallow) 6c Te Arai area silty clay loam 2 0
Estimated average value 2.0 0
Group B: 30cm Rooting Depth
Waihirere clay loam (shallow) 3f Patutahi area silty clay loam 1 1.0
Makauri clay loam (shallow) 5 Patutahi area silty clay loam 1.2 1.2
Waipaoa silt loam (shallow) 1 Ormond area silty clay loam 1.2 1.1
Estimated average value 1.1 1.1
Group C: 30cm Rooting depth
Waihirere clay loam (shallow) 3f Te Arai area silty clay loam 1.9 2.2
Waihirere heavy silt loam mottled phase 3e Te Arai area heavy silt loam 1.95 2.1

Guidelines for Irrigation Water Requirements in the Poverty Bay Flats ©Aqualinc Research Prepared for Gisborne District Council and Irrigation User Group (Report H12000/3, February 2012) 27
Soil name Soil map unit Location Soil type Top soil PrAW
(mm AW/cm soil depth) Subsoil PrAW
(mm AW/cm soil depth)
(shallow)
Waihirere silt loam mottled phase (shallow) 3b Te Arai area silt loam 2 2
Waihirere silt loam mottled phase (shallow) 3b Patutahi area silt loam 2 1.3
Estimated average value 2 2
Group D: 45cm Rooting depth
Kaiti silt loam (shallow) 6 Patutahi area silty clay loam 1.9 0.5
Kaiti clay loam (shallow) 6c Patutahi area silty clay loam 1.9 0.5
Waihirere heavy silt loam mottled phase (shallow)
3c Patutahi area silty clay loam 1.9 0.7
Makaraka clay loam (shallow) 4a Ormond area silty clay loam 1.9 0.7
Makauri clay loam (shallow) 5 Ormond area silty clay loam 1.9 0.7
Estimated average value 1.9 0.6
Group E: 60cm Rooting depth
Waihirere heavy silt loam mottled subsoil (shallow)
3e Ormond area silt loam 2 1.3
Waihirere clay loam (deep) 3f Patutahi area silty clay loam 1.9 0.8
Makauri clay loam (shallow) 5 Patutahi area silty clay loam 1.9 0.8
Kaiti silt loam (deep) 6 Patutahi area silty clay loam 1.9 0.8
Kaiti heavy silt loam (shallow) 6b Patutahi area silty clay loam 1.9 0.5
Kaiti heavy silt loam (deep) 6b Patutahi area silty clay loam 1.9 0.8
Kaiti clay loam (deep) 6c Patutahi area silty clay loam 1.9 0.8
Kaiti clay loam shallow topsoil (Shallow) 6d Patutahi area silty clay loam 1.9 0.8
Estimated average value 1.9 0.8

Guidelines for Irrigation Water Requirements in the Poverty Bay Flats ©Aqualinc Research Prepared for Gisborne District Council and Irrigation User Group (Report H12000/3, February 2012) 28
Soil name Soil map
unit Location Soil type
Top soil PrAW (mm AW/cm soil depth)
Subsoil PrAW (mm AW/cm soil depth)
Group F: 70cm Rooting Depth
Kaiti clay loam shallow topsoil (deep) 6d Patutahi area silty clay loam 1.9 0.8
Makaraka clay loam (deep) 4a Ormond area silty clay loam 1.9 0.8
Makauri clay loam (deep) 5 Ormond area silty clay loam 1.9 0.8
Waipaoa silt loam (deep) 1 Ormond area silty clay loam 1.9 0.8
Estimated average value 1.9 0.8
Group G: 90cm Rooting depth
Waihirere heavy silt loam mottled phase (deep)
3e Patutahi area silty clay loam 1.9 1.0
Waihirere heavy silt loam mottled subsoil (deep)
3e Ormond area silt loam 2 1.5
Waihirere silt loam (shallow) 3 Patutahi area silt loam 2 1.6
Waihirere silt loam mottled phase (deep) 3b Patutahi area silt loam 2 1.6
Estimated average value 2 1.5
Group H: 120cm Rooting depth
Waihirere clay loam (deep) 3f Te Arai area silty clay loam 1.9 1.6
Waihirere heavy silt loam (shallow) 3c Te Arai area heavy silt loam 1.95 1.3
Waihirere heavy silt loam (deep) 3c Te Arai area heavy silt loam 1.95 1.6
Waihirere heavy silt loam mottled phase (deep)
3e Te Arai area heavy silt loam 1.95 1.6
Waihirere silt loam (deep) 3 Patutahi area silt loam 2 1.6
Waihirere heavy silt loam (shallow) 3c Patutahi area silt loam 2 1.6
Waihirere silt loam (shallow) 3 Te Arai area silt loam 2 1.3
Waihirere silt loam (deep) 3 Te Arai area silt loam 2 1.6
Waihirere silt loam mottled phase (deep) 3b Te Arai area silt loam 2 1.6

Guidelines for Irrigation Water Requirements in the Poverty Bay Flats ©Aqualinc Research Prepared for Gisborne District Council and Irrigation User Group (Report H12000/3, February 2012) 29
Soil name Soil map
unit Location Soil type
Top soil PrAW (mm AW/cm soil depth)
Subsoil PrAW (mm AW/cm soil depth)
Makauri clay loam (deep) 5 Te Arai area silty clay loam 2 1.6
Makauri clay loam friable subsoil (deep) 5a Te Arai area silty clay loam 2 1.6
Kaiti silt loam (deep) 6 Te Arai area silty clay loam 2 1.6
Kaiti heavy silt loam (deep) 6b Te Arai area silty clay loam 2 1.6
Kaiti clay loam (deep) 6c Te Arai area silty clay loam 2 1.6
Estimated average value 2 1.6

Figure B1: Soils map of Ormond area (from DSIR, 1962)
Guidelines for Irrigation Water Requirements in the Poverty Bay Flats ©Aqualinc Research Prepared for Gisborne District Council and Irrigation User Group (Report H12000/3, February 2012) 30

Figure B2: Soils map of the Ormond Area (from DSIR, 1962)
Guidelines for Irrigation Water Requirements in the Poverty Bay Flats ©Aqualinc Research Prepared for Gisborne District Council and Irrigation User Group (Report H12000/3, February 2012) 31

Figure B3: Soils map of the Patutahi area (from DSIR, 1962)
Guidelines for Irrigation Water Requirements in the Poverty Bay Flats ©Aqualinc Research Prepared for Gisborne District Council and Irrigation User Group (Report H12000/3, February 2012) 32

Figure B4: Soils map of the Patutahi and Te Arai area (from DSIR, 1962)
Guidelines for Irrigation Water Requirements in the Poverty Bay Flats ©Aqualinc Research Prepared for Gisborne District Council and Irrigation User Group (Report H12000/3, February 2012) 33

Guidelines for Irrigation Water Requirements in the Poverty Bay Flats ©Aqualinc Research Prepared for Gisborne District Council and Irrigation User Group (Report H12000/3, February 2012) 34
Appendix C: Grower information Typical crop management and irrigation practices provided by growers following a workshop held in Gisborne on October 31 2011.

Table C1: Typical vegetable irrigation practices
Crops Season
App. Depth (mm)
Return period (days)
Irrigation methods
Maximum rooting depth*
(cm)
Target minimum soil
moisture (% PAW)**
% of time allowed to
exceed Target PAW
Critical PAW
ie. never below this
PAW Notes
20 2-3 Sprinkler Lettuce Grown all year
around 1.5 7 Trickle# 35 60% 10% 50%
Baby Leaf
Grown all year around 7 1 Sprinkler 25 75% 10% 60%
Initial applications day 1 and 2, 20 and 15 mm – then miss a day and irrigated on need
Melons Sept to April
12 3 Trickle 60 60% 15% 40% Only grown under mulch
Squash Aug to Jan
12 3 Trickle 60 60% 15% 40% Mulch
Travelling Boom Squash
Aug to April
25 14 Big Gun
60 60% 20% 35% Open field
Travelling boom Broccoli Grown all year
round 30 28 Big Gun
50 60% 10% 35% Open field
Travelling boom
Big Gun Cabbage Grown all year round 30 28
Sprinkler
50 60% 10% 35% Open field has a 25 mm initial wetting up
Travelling boom Tomatoes Sept to April 25 28
Big Gun 100 60% 20% 35%
Travelling boom Onions Jul-Feb 30 10
Big Gun 25 60% 20% 35%
Guidelines for Irrigation Water Requirements in the Poverty Bay Flats ©Aqualinc Research Prepared for Gisborne District Council and Irrigation User Group (Report H12000/3, February 2012) 35

# Winter nutrient-feed only * High groundwater levels will limit rooting depths in some areas so this will be modified based on soil type ** PAW = plant available water at field capacity.
Table C2: Typical irrigation practices for other crops
Type of agricultural
system Crops irrigated
Typical irrigation
equipment used
App. depth (mm)
Return period (days)
Maximum rooting depth*
Target minimum
soil moisture (% PAW)**
Time allowed to
exceed target PAW
Critical PAW Notes
Citrus 6 1 70 50% 20% 40% Horticultural
Kiwifruit Drippers, Mini
sprinklers. 6 1 50 60% 10% 50%
Sweet Corn Travelling boom 30 As reqd. 100 50% 20% 35% Under Mulch
Sweet Corn Travelling boom 30 As reqd. 100 50% 20% 35% Arable
Seed Maize Travelling boom 30
As reqd. 80 50% 20% 35%
10 2
35 7 Pastoral Rye grass and clover pasture
Centre Pivot Lateral booms
K-line 35 7
70 50% 10% 25
* High groundwater levels will limit rooting depths in some areas so this will be modified based on soil type ** PAW = plant available water at field capacity.
Guidelines for Irrigation Water Requirements in the Poverty Bay Flats ©Aqualinc Research Prepared for Gisborne District Council and Irrigation User Group (Report H12000/3, February 2012) 36

Model parameters for continuously cropped vegetables The year has been divided up into four seasons as shown in Table C3. Table C3: Typical irrigation
Guidelines for Irrigation Water Requirements in the Poverty Bay Flats ©Aqualinc Research Prepared for Gisborne District Council and Irrigation User Group (Report H12000/3, February 2012) 37
The length of the growing period will vary over the year and the same crop is not planted back in the same area within the same year, except for baby leaf lettuce which has a 2 in 3 year rotation. Given the change in the growing period, the number of crops per season based on an end on end rotation, has been modelled as shown in Table C4. Table C4: Growing information for Vegetable - small green crops
Baby leaf Lettuce Broccoli Cabbage
Season
Growing length
(days)
Crops
per season
Growing length
(days)
Crops
per season
Growing length
(days)
Crops
per season
Growing length
(days)
Crops
per season
Summer 25 4 44 2 64 1 85 1
Autumn 35 2 66 1 90 1 100 1
Winter 50 2 105 1 112 1 140 1
Spring 35 3 60 2 80 1 90 1
Season Months modelled
Summer December – February
Autumn March – May
Winter June – August
Spring September - November

Appendix D: Crop maximum rooting depth
The modelled maximum rooting depths for different soils groups are listed in Table D1.
Table D1: Crop maximum rooting depth
Maximum rooting depth (mm)
Soil group Lettuce Baby Leaf Broccoli Cabbage Onions Melons Squash Tomatoes Citrus Kiwifruit
Sweet Corn Maize Pasture
A 200 200 200
B 300 250 300 300 250
C 300 250 300 300 250
D 350 250 450 450 250 450 450 450 450
E 350 250 500 500 250 600 600 600 600 500 600
F 350 250 500 500 250 600 600 700 700 500 700 700 600
G 350 250 500 500 250 600 600 900 700 500 900 800 600
H 350 250 500 500 250 600 600 1,000 700 500 1,000 800 600
Guidelines for Irrigation Water Requirements in the Poverty Bay Flats ©Aqualinc Research Prepared for Gisborne District Council and Irrigation User Group (Report H12000/3, February 2012) 38

Guidelines for Irrigation Water Requirements in the Poverty Bay Flats ©Aqualinc Research Prepared for Gisborne District Council and Irrigation User Group (Report H12000/3, February 2012) 39

Guidelines for Irrigation Water Requirements in the Poverty Bay Flats ©Aqualinc Research Prepared for Gisborne District Council and Irrigation User Group (Report H12000/3, February 2012) 40
Appendix E: 1-in-5 year drought and maximum yearly
irrigation requirements Table E1: Estimated 1-in-5 year irrigation requirements for Vegetables – Small Green
1-in-5 year water demand (mm/yr)
Soil group Lettuce Baby Leaf Broccoli Cabbage Onions
A 610 731 572
B 625 709 623 729 567
C 658 767 654 704 564
D 641 724 647 706 572
E 643 744 662 688 572
F 643 744 662 688 572
G 642 759 702 706 572
H 642 762 702 713 572
Table E2: Estimated 1-in-5 year irrigation requirements for Vegetables - Cucurbits family and Tomatoes
1-in-5 year water demand (mm/yr)
Soil group Melons Squash Tomatoes
A
B
C
D 506 550
E 507 550 599
F 507 550 589
G 509 554 617
H 514 550 625

Guidelines for Irrigation Water Requirements in the Poverty Bay Flats ©Aqualinc Research Prepared for Gisborne District Council and Irrigation User Group (Report H12000/3, February 2012) 41
Table E3: Estimated 1-in-5 year irrigation requirements for Horticulture, Arable and Pasture
1-in-5 year water demand (mm/yr)
Soil group Kiwifruit Sweet Corn Maize Pasture
A
B
C
D 360 716
E 360 710
F 360 310 312 710
G 350 335 332 679
H 360 334 335 679
Table E4: Estimated maximum irrigation requirements for Vegetables – Small Green Maximum water demand
(mm/yr)
Soil group Lettuce Baby Leaf Broccoli Cabbage Onions
A 728 834 636
B 701 805 762 876 632
C 740 858 776 856 632
D 732 812 780 864 640
E 736 842 788 864 636
F 736 842 788 864 636
G 732 842 780 852 636
H 732 850 780 852 636
Table E5: Estimated maximum irrigation requirements for Vegetables - Cucurbits family and Tomatoes
Maximum water demand (mm/yr)
Soil group Melons Squash Tomatoes
A
B
C
D 660 724
E 668 732 800
F 668 732 796
G 676 760 848

Guidelines for Irrigation Water Requirements in the Poverty Bay Flats ©Aqualinc Research Prepared for Gisborne District Council and Irrigation User Group (Report H12000/3, February 2012) 42
H 680 760 848
Table E6: Estimated maximum irrigation requirements for Horticulture, Arable and Pasture
Maximum water demand (mm/yr)
Soil group Kiwifruit Sweet Corn Maize Pasture
A
B
C
D 495 940
E 495 925
F 495 380 380 925
G 525 405 385 945
H 525 405 385 910
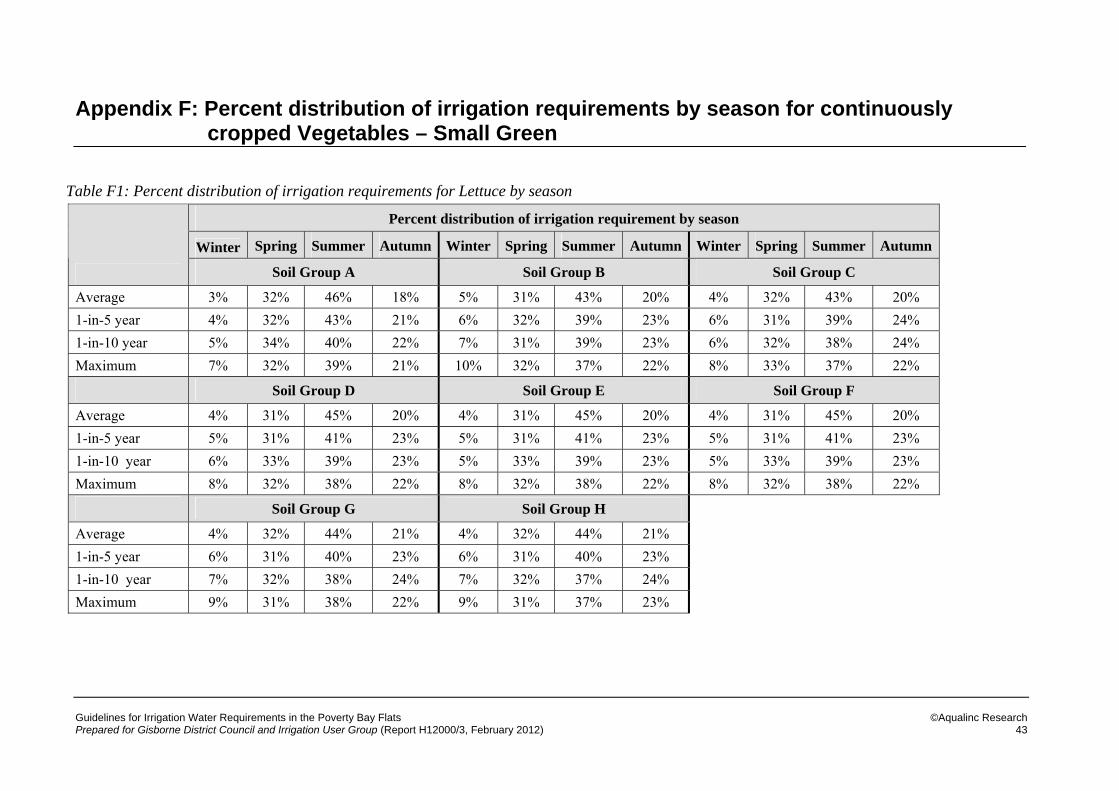
Appendix F: Percent distribution of irrigation requirements by season for continuously cropped Vegetables – Small Green
Table F1: Percent distribution of irrigation requirements for Lettuce by season
Percent distribution of irrigation requirement by season
Winter Spring Summer Autumn Winter Spring Summer Autumn Winter Spring Summer Autumn
Soil Group A Soil Group B Soil Group C
Average 3% 32% 46% 18% 5% 31% 43% 20% 4% 32% 43% 20%
1-in-5 year 4% 32% 43% 21% 6% 32% 39% 23% 6% 31% 39% 24%
1-in-10 year 5% 34% 40% 22% 7% 31% 39% 23% 6% 32% 38% 24%
Maximum 7% 32% 39% 21% 10% 32% 37% 22% 8% 33% 37% 22%
Soil Group D Soil Group E Soil Group F
Average 4% 31% 45% 20% 4% 31% 45% 20% 4% 31% 45% 20%
1-in-5 year 5% 31% 41% 23% 5% 31% 41% 23% 5% 31% 41% 23%
1-in-10 year 6% 33% 39% 23% 5% 33% 39% 23% 5% 33% 39% 23%
Maximum 8% 32% 38% 22% 8% 32% 38% 22% 8% 32% 38% 22%
Soil Group G Soil Group H
Average 4% 32% 44% 21% 4% 32% 44% 21%
1-in-5 year 6% 31% 40% 23% 6% 31% 40% 23%
1-in-10 year 7% 32% 38% 24% 7% 32% 37% 24%
Maximum 9% 31% 38% 22% 9% 31% 37% 23%
Guidelines for Irrigation Water Requirements in the Poverty Bay Flats ©Aqualinc Research Prepared for Gisborne District Council and Irrigation User Group (Report H12000/3, February 2012) 43

Table F2: Percent distribution of irrigation requirements for Baby Leaf by season
Percent distribution of irrigation requirement by season
Winter Spring Summer Autumn Winter Spring Summer Autumn Winter Spring Summer Autumn
Soil Group A Soil Group B Soil Group C
Average 8% 31% 38% 23% 9% 31% 38% 22% 9% 31% 37% 23%
1-in-5 year 9% 32% 35% 24% 11% 31% 36% 23% 11% 31% 34% 24%
1-in-10 year 10% 32% 35% 24% 10% 32% 35% 23% 11% 30% 34% 25%
Maximum 12% 31% 33% 23% 11% 31% 34% 23% 13% 30% 32% 24%
Soil Group D Soil Group E Soil Group F
Average 9% 31% 37% 23% 9% 31% 37% 23% 9% 31% 37% 23%
1-in-5 year 10% 31% 35% 24% 10% 31% 34% 24% 10% 31% 34% 24%
1-in-10 year 10% 31% 34% 25% 10% 31% 34% 24% 10% 31% 34% 24%
Maximum 13% 31% 33% 23% 12% 31% 33% 24% 12% 31% 33% 24%
Soil Group G Soil Group H
Average 9% 31% 37% 23% 9% 31% 37% 23%
1-in-5 year 10% 31% 35% 24% 11% 31% 34% 24%
1-in-10 year 11% 31% 34% 25% 11% 31% 34% 25%
Maximum 13% 30% 32% 24% 13% 30% 32% 24%
Guidelines for Irrigation Water Requirements in the Poverty Bay Flats ©Aqualinc Research Prepared for Gisborne District Council and Irrigation User Group (Report H12000/3, February 2012) 44

Table F3: Percent distribution of irrigation requirements for Broccoli by season
Percent distribution of irrigation requirement by season
Winter Spring Summer Autumn Winter Spring Summer Autumn Winter Spring Summer Autumn
Soil Group A Soil Group B Soil Group C
Average 6% 34% 41% 20% 4% 34% 43% 20%
1-in-5 year 7% 33% 38% 22% 6% 32% 39% 23%
1-in-10 year 7% 34% 37% 22% 7% 33% 37% 23%
Maximum 9% 33% 35% 22% 8% 33% 35% 23%
Soil Group D Soil Group E Soil Group F
Average 5% 34% 42% 20% 5% 33% 42% 20% 5% 33% 42% 20%
1-in-5 year 6% 33% 39% 22% 7% 32% 38% 23% 7% 32% 38% 23%
1-in-10 year 7% 32% 38% 22% 7% 32% 36% 24% 7% 32% 36% 24%
Maximum 10% 32% 35% 23% 10% 31% 35% 24% 10% 31% 35% 24%
Soil Group G Soil Group H
Average 5% 34% 41% 21% 5% 34% 40% 21%
1-in-5 year 7% 32% 37% 23% 7% 32% 37% 23%
1-in-10 year 8% 33% 35% 24% 8% 33% 35% 24%
Maximum 10% 33% 34% 23% 10% 33% 33% 24%
Guidelines for Irrigation Water Requirements in the Poverty Bay Flats ©Aqualinc Research Prepared for Gisborne District Council and Irrigation User Group (Report H12000/3, February 2012) 45

Guidelines for Irrigation Water Requirements in the Poverty Bay Flats ©Aqualinc Research Prepared for Gisborne District Council and Irrigation User Group (Report H12000/3, February 2012) 46
Percent distribution of irrigation requirement by season
Winter Spring Summer Autumn Winter Spring Summer Autumn Winter Spring Summer Autumn
Soil Group A Soil Group B Soil Group C
Average 5% 32% 43% 20% 5% 32% 45% 19%
1-in-5 year 7% 32% 41% 21% 6% 32% 42% 21%
1-in-10 year 7% 32% 39% 23% 6% 32% 39% 23%
Maximum 8% 33% 37% 23% 9% 32% 37% 22%
Soil Group D Soil Group E Soil Group F
Average 4% 32% 45% 19% 4% 33% 44% 19% 4% 33% 44% 19%
1-in-5 year 5% 32% 41% 22% 5% 32% 42% 21% 5% 32% 42% 21%
1-in-10 year 6% 32% 40% 22% 6% 34% 39% 21% 6% 34% 39% 21%
Maximum 8% 32% 37% 23% 7% 33% 36% 23% 7% 33% 36% 23%
Soil Group G Soil Group H
Average 4% 32% 44% 20% 5% 32% 44% 20%
1-in-5 year 6% 32% 41% 21% 6% 31% 41% 22%
1-in-10 year 6% 31% 39% 23% 6% 31% 40% 23%
Maximum 8% 33% 36% 23% 8% 33% 36% 23%
Table F4: Percent distribution of irrigation requirements for Cabbage by season