irrigation, food security and povertypubs.iied.org/pdfs/17610iied.pdf · irrigation, food security...
TRANSCRIPT

Howard G. Bu�ett Foundation
A Partnership Funded by the
Frédéric Bazin, Ibrahima Hathie, Jamie Skinner and Jérôme Koundouno (ed.)
IRRIGATION, FOOD SECURITY AND POVERTY Lessons from three large dams in West Africa

Global Water Initiative (GWI) – The Global Water Initiative in West Africa is part of a global action-research and advocacy programme funded by the Howard G. Buffett Foundation. It is implemented by the International Institute for Environment and Development (IIED) and the International Union for Conservation of Nature (IUCN) in Mali, Guinea, Niger, Burkina Faso and Senegal. We focus on agricultural production linked to large scale irrigation schemes and dams, from local to regional level. Our multi-stakeholder approach seeks to empower smallholder farmers – both men and women – to put them at the centre of policies for efficient water management, food security and secure livelihoods.
IIED – The International Institute for Environment and Development is a policy and action research organisation. We promote sustainable development to improve livelihoods and protect the environments on which these livelihoods are built. We specialise in linking local priorities to global challenges. IIED is based in London and works in Africa, Asia, Latin America, the Middle East and the Pacific, with some of the world’s most vulnerable people. We work with them to strengthen their voice in the decision-making arenas that affect them – from village councils to international conventions. IUCN – The International Union for Conservation of Nature, helps the world find pragmatic solutions to our most pressing environment and development challenges. IUCN’s work focuses on valuing and conserving nature, ensuring effective and equitable governance of its use, and deploying nature-based solutions to global challenges in climate, food and development. IUCN supports scientific research, manages field projects all over the world, and brings governments, NGOs, the UN and companies together to develop policy, laws and best practice.

IRRIGATION, FOOD SECURITY AND POVERTY
Lessons from three large dams in West Africa
Frédéric Bazin, Ibrahima Hathie, Jamie Skinner and Jérôme Koundouno (ed.)
September 2017

First edition: International Institute for Environment and Development (United Kingdom) and the International Union for Conservation of Nature (IUCN), Ouagadougou. 2017.
ISBN: 978-1-78431-527-6 IIED product code: 17610IIED
Citation: Bazin F., Hathie I., Skinner J. and Koundouno J. (Ed.) (2017) Irrigation, food security and poverty – Lessons from three large dams in West Africa. International Institute for Environment and Development, London, UK and the International Union for Conservation of Nature, Ouagadougou, Burkina Faso.
This report can be downloaded from the IIED website: pubs.iied.org/17610IIED
To contact GWI, please write to: Jamie Skinner, International Institute for Environment and Development, 80-86 Gray’s Inn Road, London WC1X 8NH, United Kingdom. Tel: +44 13 1300 0163Fax: +44 20 3514 9055E-mail: [email protected]
The views expressed in this report are those of the authors and do not necessarily represent those of the organisations participating in the Global Water Initiative at a national, regional or global level, or those of the Howard G. Buffett Foundation.

i
CONTENTSAbbreviations and acronymsAcknowledgementsPrefaceExecutive Summary
1 The review studies 1.1 Introduction 1.2 Macro and micro economic studies around three dams 1.3 Government objectives for the construction of dams and irrigated agriculture schemes
2 Revisiting the justification of large dam projects 2.1 Basing decisions on realistic hypotheses 2.2 The importance of multiple uses for economic returns to dam projects 2.3 Are NPV and IRR adequate indicators of the returns to dam building projects?
3 The quality of project infrastructure, its management and upkeep: a key issue
4 Persistent poverty in the irrigation schemes 4.1 Taking the diversity and performance of farmers into account when establishing
a typology 4.2 A successful minority – and a majority below the poverty threshold 4.3 Main causes of persistent poverty in irrigated agriculture schemes 4.4 Consequences of persistent poverty in irrigated agriculture schemes
5 Rethinking irrigation schemes to reduce poverty and contribute to national food security 5.1 Establishing anti-poverty strategies in existing projects 5.2 Establishing viable and successful family farms in new developments
6 Conclusions 6.1 The profitability of irrigated agriculture schemes 6.2 The persistence of poverty in irrigated agriculture schemes 6.3 Towards a new paradigm?
Bibliography
Appendix 1: Methodology of production system analysis Sampling methods Economic analysis Analysis of household consumption
Appendix 2: Typology of production systems Sélingué Bagré Anambé
vviviiviii
1138
11112326
27
3333
343947
515167
73737680
81
83838485
86868890

ii
List of figuresFigure 1: GWI intervention strategyFigure 2: The stages of comparative study for the current value of projectsFigure 3: Original timeline of proposed developments at Bagré dam (feasibility study)Figure 4: Rice harvest performance for different types of farmers at SélinguéFigure 5: Theoretical model of increasing income from rice production in existing irrigation schemesFigure 6: Poverty trap for farmers without animal traction, SélinguéFigure 7: Raising rice production incomes by increasing the cultivated area Figure 8: Improving rice farming incomes through raising value added per hectareFigure 9: Raising irrigation scheme incomes through diversification of cropsFigure 10: Examples of possible routes out of poverty for farmers at SélinguéFigure 11: Trajectories of a farmer affected by a development with simple compensation or compensation plus poverty reduction (Bagré)Figure 12: Conditions for a virtuous circle in irrigated schemesFigure 13: Different sampling methods
List of graphsGraph 1: Cultivable and cultivated areas, AnambéGraph 2: Evolution of cultivable areas showing the planned rate of development on the left bank (SOGREAH 1980) and the area actually under cultivation (1994-2010), BagréGraph 3: Rice cultivation areas forecast and actual, Sélingué (1977-2013)Graph 4: GVA per hectare of irrigated rice (1997-2010) compared with initial hypotheses of CIEH (1993), BagréGraph 5: GVA per hectare of irrigated rice and forecast of feasibility studies, AnambéGraph 6: Forecast (1993) and actual yield levels of rice per season, Bagré (1997-2010)Graph 7: Comparison of yields with feasibility study forecasts, AnambéGraph 8: Hypothesised rice prices (FCFA) in feasibility studies, compared to prices observed in the period 1985-2013, AnambéGraph 9: Hypothesised rice prices (FCFA) in feasibility studies, compared to prices observed in the period 1997-2001, BagréGraph 10: Movement in the contribution of electricity, farm and fish production to the annual generation of wealth at Sélingué (1980-2013)Graph 11: Average shares of GVA for electricity, farming and fish production at Sélingué, 1980-2013 (FCFA 2008)Graph 12: Total annual income for the main types of farmers, and percentage of each type of farmer, Sélingué, 2014Graph 13: Total annual income in 2014, in a good and in a bad year, for the different types of farmers, and percentage of each type of farmer, BagréGraph 14: Total annual income of different types of farmers and percentage of each type in the study area, 2014Graph 15: Different types of farmers at Sélingué Graph 16: Importance of the area (in hectares) of rain-fed crops for different types of farmers, BagréGraph 17: Relative contribution of different kinds of production to agricultural incomes at Bagré and Sélingué by farmer typeGraph 18: Defining the area of irrigated rice needed to meet the annual needs of a family at Bagré
25
134952
535356626732707983
1718
1920
20212122
23
25
25
35
36
36
3839
40
41

iii
Graph 19: Average areas of irrigated rice, modes of access and areas needed to reach poverty and food security thresholds at Bagré (10-person families)Graph 20: GVA and costs of production per hectare for irrigated rice farming at BagréGraph 21: Ownership of equipment by different types of farmer, SélinguéGraph 22: Impact of chemical fertiliser on rice yields, BagréGraph 23: Areas cultivated and added value of different types of irrigation scheme, for farmers without their own animal traction, SélinguéGraph 24: Contribution of different forms of production and non-agricultural income to total income for different types of farmers
List of tablesTable 1: Objectives for the dams and irrigated agriculture schemes at Bagré, Sélingué and AnambéTable 2: Irrigable areas and areas actually developed, Bagré, Sélingué and AnambéTable 3: Forecast and actual costs of agricultural development, Bagré, Sélingué and AnambéTable 4: Balance sheet of Anambé basin development, phase 1Table 5: Balance sheet of Anambé basin development, phases 2 and 3Table 6: Cultivation rate of development schemes, Bagré, Sélingué and AnambéTable 7: Economic evaluation of the Bagré, Sélingué and Anambé (Niandouba) projectsTable 8: Water fees in 2014, Bagré, Sélingué and AnambéTable 9: Water fee recovery rate, SélinguéTable 10: Water fee recovery rate, BagréTable 11: Annual food security and poverty thresholds, Bagré, Sélingué and AnambéTable 12: Poverty levels of farmers cultivating in the irrigation scheme, Sélingué, Bagré and AnambéTable 13: Percentage of agricultural GVA of family farms derived from the irrigation scheme, Sélingué, Bagré and AnambéTable 14: Theoretical area of irrigated plots needed to reach food security and poverty thresholds at Sélingué, Bagré and Anambé (family of 10 persons; rice cultivation only)Table 15: Average added value and cost of production per season at Sélingué, Bagré and Anambé, in FCFA/haTable 16: Equipment rates at Sélingué, Bagré and AnambéTable 17: Economic situation, annual rice production and share of produce sold, SélinguéTable 18: Relative importance of fees and charges in terms of production costs and annual incomes for different types of farmers, SélinguéTable 19: Impact of rise in water fees on farmer incomes, Bagré and NiandoubaTable 20: Techniques available to improve the performance of irrigated rice farmingTable 21: Priority needs and access strategies for agricultural equipment by type of farmer, BagréTable 22: Areas cultivated and value added for different types of production in the irrigation scheme, for farmers without their own animal traction, SélinguéTable 23: Advantages and constraints for different types of family farms, SélinguéTable 24: Priority development strategies for different groups of farmers, SélinguéTable 25: Comparison of compensation ratio based on output and income, Bagré and Sélingué
41
45474863
64
9
1314
151516242930303438
39
42
44
4649
50
505659
63
656669

iv
List of boxesBox 1: Definitions of indicators used in the studyBox 2: Brief presentation of the study sitesBox 3: Policy objectives to justify developments at Anambé, Sélingué and BagréBox 4: Development objectives in the Anambé basinBox 5: Cultivation of land developed for irrigation, Anambé, SénégalBox 6: Initial difficulties in bringing improved land into production, Sélingué, MaliBox 7: Sélingué: a multi-purpose dam and its funding constraintsBox 8: Upkeep failure and deterioration of the irrigation network at SélinguéBox 9: Diagnosis of Sector G at AnambéBox 10: Theoretical estimate of developed land holding required to reach the poverty threshold at BagréBox 11: Difficulties in cultivating developed land at AnambéBox 12: Theoretical model of improved incomes from rice production in existing irrigation schemesBox 13: Renting plots at BagréBox 14: Difficulties in the commercialisation of rice at Bagré and AnambéBox 15: Agricultural mechanisation policies in Burkina FasoBox 16: Estimate of income from irrigated rice farming and compensation for land affected by new developments at Bagré
Unless otherwise stated, the figures, graphs, tables and boxes are taken from GWI studies on productive systems and the economic evaluations of the dams – or have been compiled by the authors based on the data from these studies. A complete list of references can be found in the Bibliography.
47
1012171826293141
4352
55576070

v
ABBREVIATIONS AND ACRONYMSADF African Development FundAfDB African Development BankBCEOM Bureau central d’études pour les équipements d’outre-mer (Central Design Office for Overseas Equipment)CACG Compagnie d’aménagement des côteaux de Gascogne (Gascogne Hill Development Authority)CIEH Comité interafricain d’études hydrauliques (Inter-African Committee for Hydraulic Studies)CNCAS Caisse nationale de crédit agricole du Sénégal (National Agricultural Credit Bank of Senegal)COGEMA Comité de gestion du matériel agricole du bassin de l’Anambé (Committee for the Management of Agricultural Equipment of the Anambé basin)ECOWAS Economic Community of West African StatesEWI Electrowatt Ingénieurs-Conseils (Electrowatt Consulting Engineers)FCFA Franc de la communauté financière africaine (African Financial Community Franc)FEPROBA Fédération des producteurs du bassin de l’Anambé (Federation of Farmers of the Anambé Basin)GVA Gross value addedGWI Global Water InitiativeHa HectareIAS Irrigated agriculture schemeIIED International Institute for Environment and DevelopmentIRAM Institut de recherches et d’applications des méthodes de développement (Institute for Research and Applications of the Methods of Development)IRR Internal rate of returnIUCN International Union for the Conservation of NatureMOB Bagré Development Authority (1986-2011; Maîtrise d’Ouvrage de Bagré)NPV Net present valueO and M Operation and maintenanceODRS Office de développement rural de Sélingué (Sélingué Rural Development Office) PAP People affected by the projectPAPCB Projet d’appui au pôle de croissance de Bagré (Support project for the Bagré growth pole)PRESA-DCI Projet de renforcement de la sécurité alimentaire par le développement des cultures irriguées (Project to Strengthen Food Security Through the Development of Irrigated Crops)SAGI Société d’aménagement et de gestion de l’irrigation (Irrigation Development and Management Authority)SNDR Stratégie nationale de développement de la riziculture (National Rice Farming Development Strategy, Burkina Faso)SODAGRI Société de développement agricole et industriel (Agricultural and Industrial Development Authority, Senegal)SONAGESS Société nationale de gestion du stock de sécurité alimentaire (National Food Security Stock Authority, Burkina Faso)SONED Société internationale d’ingénierie et d’études de développement en Afrique (International Society for Engineering and Development Studies in Africa)
Note about the currency used in the text:Rate of the CFA franc at the time of going to press:EUR 1 = FCFA 655.957 (the CFA franc has a fixed exchange rate to the Euro)USD 1 = FCFA 551,533

vi
ACKNOWLEDGEMENTSThe authors would like to thank the Howard G. Buffett Foundation for its financial support to this work through the Global Water Initiative.
The work presented in this report has required the mobilisation and contribution of a wide range of actors. The authors would like therefore to thank all of the teams in Senegal, Mali and Burkina Faso (listed below) for their contributions to the local research and consultation processes that have generated the results presented here. They also thank all the administrative staff for their support during fieldwork. In particular we wish to thank Aliou Faye, the country programmes coordinator (IUCN-PACO), Jean-Marc Garreau, regional programme coordinator (IUCN-PACO), and Awaiss Aboubacar, coor-dinator of the regional Water and Humid Zones programme (IUCN-PACO) for their advice and their technical support.
The authors would also like to thank all the local people in each of the project areas who contributed their time and energy to share their experiences, the local govern-ment actors, and the managers of the irrigation schemes who have all collaborated to contribute information and participated actively in the local and national workshops.
Lastly, many thanks to Camilla Toulmin (IIED) and Bara Guèye (IED Afrique) for their helpful comments on a draft of this report.
The multi-disciplinary teams in each country were made up as followsBurkina FasoMoumini Savadogo – Programme manager, IUCN Serge Sedogo – Consultant Edmond Kabore – Consultant (economic evaluation) Frédéric Bazin – Iram
MaliBamadou Cessouma – GWI project coordinator, IUCNAbdoulaye Kouriba – GWI technical assistant, IUCNIbrahima Hathie – Initiative Prospective Agricole et Rurale (IPAR) (economic evaluation) Centre d’études et de renforcement des capacités d’analyse et de plaidoyer (CERCAP) – National consultant (economic evaluation) Frédéric Bazin – Iram
SénégalModou Diouf – GWI project coordinator, IUCN Ibrahima Hathie – IPAR (economic evaluation)Idrissa Wade – IPAR (farmer livelihoods)Frédéric Bazin – Iram

vii
PREFACE Large scale irrigation is a key national and donor response to food security challenges and the management of risks associated with unpredictable rainfall patterns in the Sahel and beyond. In 2013, Sahelian countries signed up to spending $7 billion on expanding irrigation by 600,000 ha, among other things through the development of large scale, publicly-financed schemes that are often associated with large dams. The contribution of such large-scale rice irrigation to local and national economies, and the food security and poverty reduction benefits remain largely unevaluated. And the evidence base to justify continued investment in these expensive systems, where a single hectare can cost up to $20,000 to build, is weak. In many cases it seems like an act of faith, politically attractive to donors and governments alike. But what has been the real performance of those projects in terms of economic rates of return and improved farmer incomes? Who has benefited most from these schemes and how have the real costs of their construction and management been financed?
This report presents field evidence from three major schemes in Mali, Senegal, and Burkina Faso that can help decision makers to understand project outcomes and optimize the returns on State investment, both for the taxpayer and for individual farmers. In all cases, it is the governance of the scheme and the agricultural system (not the physical design of the infrastructure) that is at issue. It shows that answers to questions like “what type of farmers get the best results?”, “how big should plot sizes be and with what tenure conditions?” and “what credit and marketing systems would support farmers effectively?” are needed if production is to be sustainably improved.Under future rainfall scenarios, West Africa is likely to see more unpredictability which is also driving a push for dam construction and control of fluctuating river flows. While the project documents for large schemes show their theoretical potential to meet food demand, this report outlines the improvements to governance and farmer support mechanisms that will be required to make the most of these expensive investments for the benefit of all.
Jamie SkinnerDirector, Global Water Initiative West Africa

viii
EXECUTIVE SUMMARY Development of irrigation is one of the leading strategies for combating poverty and food insecurity in the countries of the Sahel. In the Dakar Declaration of 31 October 2013, six West African governments have recently reaffirmed their commitment to this policy. At a time when governments are once again declaring their intention to increase the area under irrigation, it seems an opportune moment, as recommended by the ECOWAS guidelines (ECOWAS 2012), to analyse the socio-economic results delivered by some of the region’s existing irrigated schemes fed by large dams, and to learn the lessons from them for future projects.
The Global Water Initiative (GWI), in partnership with the irrigation development and management authorities (sociétés d’aménagement et de gestion de l’irrigation, SAGI), began a series of retrospective studies in 2013 at 3 sites in West Africa where dams and irrigation schemes were constructed between the late 1970s and the late 1990s: Sélingué in Mali, Anambé (Niandouba and Confluent dams) in Senegal, and Bagré in Burkina Faso1. The aim of these studies was to analyse the conditions for financial and economic viability of such water management projects, and the possibilities for improving the living conditions of farming families following the construction of dams. These studies should enable existing projects to be better managed and cultivated, and future projects to be better designed.
Our findings show that multiple-use dams offer a better return on their massive initial investment than dams with a purely agricultural purpose. Energy production enables a dam to become profitable by providing an immediate and regular revenue stream; the same is true to a lesser extent for fish production. Agricultural production takes longer to get going and is subject to more uncertainty in economic and climatic terms, and so makes only a low level of contribution to a positive return on investment in a dam and its associated infrastructure. Nevertheless, agriculture is very important for the compensation it offers to populations affected by the project (PAP); and in addition it justifies the additional costs involved in developing irrigation potential, such as canals, drains, field preparation, hydraulic infrastructure etc.
Our analyses also show that decisions to invest in large dams and irrigation schemes are not always based on realistic hypotheses. It is not unusual for initial design studies to rely on over-estimated assessments of irrigable potential or of the future agronomic and economic performance of irrigation projects, or to under-estimate their cost and the time needed to realise them, in order to make the economic case for a project. Widely used economic indicators such as internal rates of return (IRR) are not relevant unless they can be used to compare several alternative investments; but despite this, they are still often advanced to justify a project’s economic viability. This calculation should be based instead on other indicators of economic performance, such as the incomes of different types of farmers and their resulting capacity to finance the costs of maintaining and managing the infrastructure. The issue of cost-sharing between different users (electricity companies, fishers, livestock keepers and farmers….) and more generally between the State and the users, must be more transparently set out and negotiated between all the stakeholders in the project.
1. The partner SAGIs are: Bagrépôle (Burkina Faso), ODRS (Mali) and SODAGRI (Sénégal).

ix
Experience in irrigated agriculture projects shows that the capacity of farmers to pay the costs of upkeep and management of water control structures is limited by the low levels of income that the majority are able to derive from the plot of land allocated to them. Persistent poverty and even food insecurity among farmers on the irrigation schemes we studied, which were developed at such high cost by governments, tells us that the return on these projects requires serious re-evaluation - all the more so because their ultimate aim is precisely to contribute to reducing poverty and food insecurity. Analysis of farming systems reveals a number of causes that contribute to this persistence of poverty.
n The land areas allocated to families are too small to enable them to make a living solely from irrigated rice farming. Only farmers who have significant other sources of income – from rain-fed crops, livestock, or off-farm incomes – or those who manage to cultivate larger areas than their allocated plots by means of loans or rentals of land (which are not permitted but are tolerated in reality) can achieve income levels above the poverty threshold.
n The support offered to farmers is inadequate to encourage a transition towards intensive irrigation practices and at the same time to enable satisfactory levels of culti-vation and agronomic results to be achieved. Although major sums have been spent on these dam-fed irrigated farming developments (10 million FCFA/ha or even more), there has been little investment in equipping farmers with animal traction, despite its technical and economic advantages. Furthermore, farmer support policies (including agricultural advice, access to seasonal credit, strengthening of producer organisations and development of market outlets) remain minimal, and are not up to the challenges of the intensification which the projects make technically possible.
The persistence of poverty in the irrigation schemes – at Sélingué, for example, where 75% of farmers who have plots in the scheme are living below the poverty threshold – has some serious and major consequences. Firstly, it limits the capacity of farmers in the agricultural sector to cultivate the developed land and to invest, which in turn has negative impacts on their yields and leads to a vicious circle. Secondly, this restricted productivity weakens the contribution of hydro-agricultural development projects to the local economy and also to national food security. Finally, this situation reduces the capacity of farmers to bear a significant share of the cost of managing and maintaining project infrastructures, thus obliging the state to fund their rehabilitation periodically when they deteriorate.
This outcome is not inevitable. Some types of family farmers achieve satisfactory agronomic and economic performances on the irrigation schemes, enabling them to secure a decent standard of living and to invest in their means of production as well as in the upstream and downstream components of the agricultural production sector. Our studies recommend that in existing schemes, policies should be adapted to the different types of farmers and should target as a priority those farmers below the poverty threshold, by combining easy and secure access to developed land with policies specifically aimed at supporting them to cultivate their allocated plots of land properly (better access to equipment and seasonal credit etc.). In addition, development activity should focus on the rice marketing chain, on diversifying production, and on improving soil fertility management. All of these actions would benefit farmers as a whole in the schemes we have analysed.

x
The analyses also highlight the importance of land tenure. This needs to be fully taken into account in advance, and regulations must be properly considered and worked out when plot allocation takes place, because it is difficult to modify later on. For new irrigated agriculture schemes (IAS), this means that where irrigated plots are allocated to farmers without access to other land (such as migrants, or people displaced by the project who have lost all or most of their land holdings), they must be provided with an area large enough to guarantee them an income above the poverty threshold. To do this, data are required on the overall economic situation of the different types of farmers involved and on all their sources of income, and there must be a realistic estimate of the incomes these diverse types of producers will be able to earn from their rice fields in the short and medium term. On the Sélingué scheme, for example, this implies a minimum allocation of 4 ha per family of 10 people with animal traction, or at Bagré a minimum of 2 ha; these are markedly larger areas than the averages being cultivated at present (around 1 ha per family, with major variations depending on the type of farmer).
Finally, ensuring that the people affected by the project (PAP) are provided with sufficient improved land is a necessary condition but is not sufficient to secure satisfactory levels of income and farming performance. Allocating land to farmers who lack the means to cultivate it properly does not provide them with a route out of poverty or maximise the agronomic and economic performance of irrigation schemes. It is therefore essential, at the time when the development project itself is financed, to also designate funds for equipment (such as animal traction and rototillers) and for agricultural advice for these farmers. In view of the costs of irrigation schemes – from 7 to 15 million FCFA/ha – it is paradoxical that development projects do not plan for investment of the relatively modest sums required for equipment that significantly increases yields – 500,000 to 600,000 FCFA per farmer, or on average 5% of the cost of developing a hectare of land.
Our studies of farming systems show that achieving the objectives assigned to irrigated agriculture in terms of food self-sufficiency and combating poverty requires much more than the current focus on constructing and maintaining water control and manage-ment infrastructure. It also needs public policy that works to provide agricultural advice, rural credit, arrangements for accessing equipment, functioning market channels, all capable of being adapted to the local specificities of irrigated agriculture and the needs of different types of farmers.
Finally, hydro-agricultural development projects must be integrated into the agrarian logic of the regions they help to transform, instead of being considered as systems which bring about a clean break with existing farming practices. In this sense, IAS strategies have to take account of the current evolutions of agrarian systems, and of farmer strategies and the constraints they face, by involving producers directly in devel-opment decisions. This is rarely the case today. This approach will promote irrigated farming systems which are adapted to the real needs of farmers, and which comple-ment rain-fed cropping systems, making an effective contribution to raising production and reducing poverty.

1
1
THE REVIEW STUDIES
1.1 INTRODUCTION With the Dakar Declaration of 31 October 2013, irrigation has regained its place at the core of development policy in West Africa. In the Declaration, the governments of six Sahelian countries (Burkina Faso, Mali, Mauritania, Niger, Senegal and Chad) issued a call to upgrade the role of irrigated agriculture in economic growth, the reduction of rural poverty, food and nutritional security and balanced national development. They announced an aspiration to make a significant increase in investment in agricultural water management “to move from 400,000 irrigated hectares (ha) today to 1,000,000 ha by 2020, at a total estimated cost of over seven billion US dollars”2.
At the same time, however, there are fewer opportunities than in the past for increasing the area under irrigation by developing major agricultural projects supplied from large dams to enable a fully controlled irrigation area to be farmed during the dry season. Several factors combine to create this constraint on ambitious new projects. In the first place, there is a shortage of sites suitable for the construction of infrastructure on this scale. In addition, their projected impacts are greater than in the past, mainly because of the significant increase in population densities over the past 30 years. And, lastly, policies to compensate for the environmental and social impacts of major water management works have developed significantly since the early 2000s, under the influence of the multilateral banks and the World Commission on Dams. Accounting for the real costs of these impacts has a major effect on the calculation of the economic returns for such large-scale investment projects.
The Dakar Declaration calls for the implementation of diversified investment strategies and programmes to cultivate the wide range of possible systems of hydro-agricultural management, but also for revitalising and expanding existing large-scale public irrigation schemes, in particular those intended for rice cultivation. Indeed, these large dams and their irrigation schemes are often far from producing agronomic and economic results at the levels initially suggested by the feasibility studies which prepared the way for their
2. www.icid.org/decl_dakar.html

2
construction3. Improving the performance of the existing schemes – and where possible, extending them – is therefore a priority in current strategy.
In line with the Economic Community of West African States (ECOWAS) guidelines on development of water management infrastructure in West Africa (ECOWAS 2012), and with the directive on the same subject recently adopted4, the Global Water Initiative (GWI) in West Africa has analysed the lessons to be learned from the experiences of existing dams and hydro-agricultural schemes, with the aim of informing better future cultivation of the current projects, and improving the design of new ones (Figure 1).
3. On this subject see World Commission on Dams (2000). There are many reports calling into question the economic profitability of large dams. For hydro-electric dams, see for example Ansar et al. (2014). For West Africa, the case of the Kandadji dam in Niger raises doubts about the possibility of achieving the stated objectives, in particular in terms of irrigation development. See for example International Rivers (2016). 4. https://www.gwiwestafrica.org/en/new-ecowas-directive-announced-construction-large-dams-west-africa
Regional evidence ondams and irrigation
Economics
Land tenure
Livelihoods
Governance
Capacity building
Advocacy framework
Existing schemes & dams
Improved enabling
environnement
• Anambe (Senega)l• Bagré (Burkina Faso) • Sélingué (Mali)
Learning process
New projects Improved plans & practice
• Kandadji (Niger) • Fomi (Guinea) • National and regional
policies
Communication
Participatory approach
Multi stakeholder dialogues
Experience sharing
Empowerment of civil society
ECOWAS large water infrastructure Dialogue
CILSS/Sahel irrigation strategy
National policies
River basin organisation strategies
FIGURE 1
GWI intervention strategy

3
1.2 MACRO AND MICRO ECONOMIC STUDIES AROUND THREE DAMS Studies carried out by GWI in 2013 (Kergna et al. 2013; Ouedraogo et Sedogo 2014; Hathie 2013) showed that there tends to be a divergence between government objectives (high-yielding production to ensure national food security) and those of rural farmers (ensuring the food security of their families, guaranteeing an adequate income, limiting risks), and that this can be a brake on the success of irrigation projects. These studies also highlighted the wide range of situations within a single project, with some farmers enjoying successful economic results and others struggling to escape from poverty. These differences between farmers must be better considered by governments.
Starting in 2013, GWI undertook two types of complementary studies focused on the older irrigation schemes at the Bagré (Burkina Faso), Sélingué (Mali) and Anambé (Niandouba and Confluent, Senegal) dams. These studies set out to achieve a better understanding of how to marry the interests of farmers cultivating irrigated fields with the aims of public policy, in accordance with the measures in the ECOWAS policy directive and the recommendations of the ECOWAS guidelines (4.1) on analysis of the conditions for financial viability of water management projects and (2.1) on improving the living conditions of local people following the building of a dam.
1.2.1 Research studies on the outcomes of large dam projects, evaluating the national economic return on these major investments ObjectivesThe overall objective of the research studies (Kaboré and Bazin 2014; Hathie 2015; Hathie et al. 2017) was to carry out an ex-post evaluation of the wealth produced by the dam projects under examination, comparing this with the hypotheses on which the original decisions to build these dams and their associated schemes were based; and to draw up a financial balance sheet from the perspective of the investor government. The findings of the research studies provide an opportunity to identify and highlight the main factors influencing the profitability of large-scale water management installations over the course of their useful lifespan, and to learn the lessons for improving how infrastructure of this kind is designed and constructed in the future, from the prelimi-nary study stage through to cultivation.
The specific objectives of the studies can be summarised as follows:
n To quantify the financial and economic gains derived from the various project compo-nents, for users and for the local and national economy;
n To quantify the financial importance of the project at the scale of the national economy, by drawing up a balance sheet of financial contributions by the different fundingpartners and the debt repayments made;
n To compare the results, in terms of returns on investment, with the initial forecastsmade before the construction of the dam.

4
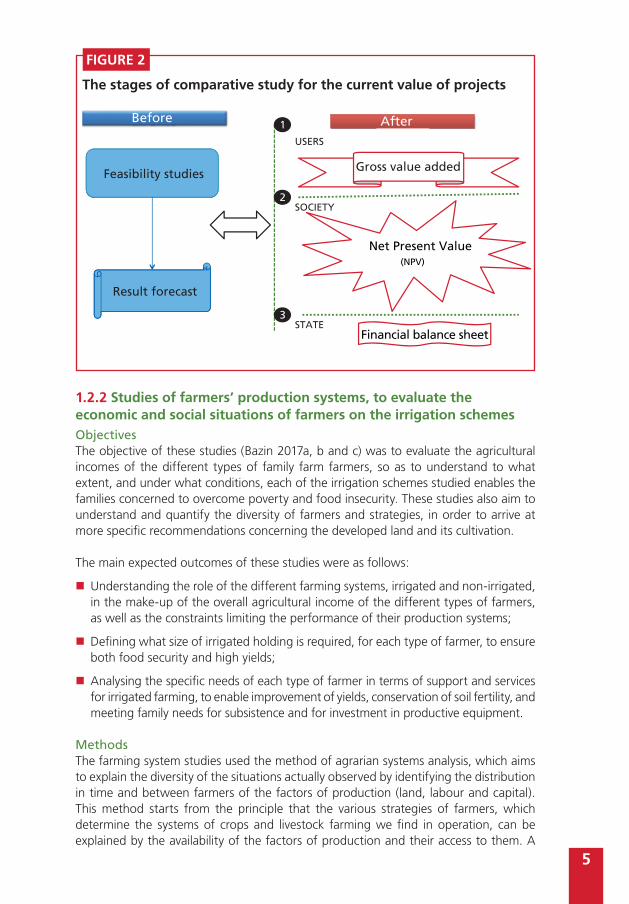
MethodsThe methodology (see Figure 2) was based on a “before and after”, rather than a “with/without” evaluation. This is not so much an attempt to evaluate and quantify the direct, indirect and intangible effects of the developments, or to evaluate the overall value added of the dam and how this is shared between economic actors. Instead the aim is to revisit all the feasibility studies for the different components (agriculture, energy, livestock, fishing, tourism, environment….) which were involved in making the initial decision to invest, so as to compare the forecast outcomes in terms of financial and economic returns with the actual results obtained. To quantify the performance of the dams in terms of financial and economic outcomes, this report makes use of three main indicators: gross value added (GVA), net present value (NPV) and internal rate of return (IRR), as defined in Box 1.
GVA is the measure used to quantify the wealth produced by the dam and to compare it with the returns estimated by the feasibility studies. This value can be calculated for each form of production, integrating all the investments made within their particular sector by those capitalising on the development (agricultural equipment for farmers, boats and nets for fishers etc.). It does not take into account structural investments such as the dam or the irrigation infrastructure. However, the two other indicators used here (NPV and IRR), bring together these two variables (dam plus developments) to arrive at a statement of overall returns. To measure these three indicators, the studies first carried out a reconstitution of the investment costs, the recurrent costs and the costs of production. Secondly, they used figures collected from the project to calculate the GVA which was generated by each component of the project.
BOX 1
Definitions of indicators used in the studyGVA: gross value added. This corresponds to the value of what is produced, less the cost of intermediate consumption (the goods and services consumed during the production process). It measures the new wealth produced during a production cycle.
NPV: net present value. This measure enables a calculation to be made of the value created over the lifetime of the project, allowing for the fact that a sum of money received or expended at a particular time has more value for an investor than the same amount some years later. NPV represents the total value produced by an investment, actualised at a chosen date by converting all future income values using an interest rate known as a discount rate. Projects whose NPV is positive after discounting with reference to the opportunity cost of capital5 are considered acceptable investments.
IRR: internal rate of return. This is the interest a project can produce with the resources invested, to enable the project to recoup the initial investment and operational costs and remain in balance (IRR = 0). In evaluating projects using the IRR, which is the classic criterion for selection of projects, projects presenting an IRR superior to the opportunity cost of capital are acceptable.
5. The opportunity cost of capital is the interest rate that the government could obtain on investment in other projects or other sectors of the economy with a similar risk profile.
5
Net Present Value(NPV)
Feasibility studies
Result forecast
Before AfterUSERS
SOCIETY
Gross value added
Financial balance sheetSTATE
1
3
2
FIGURE 2
The stages of comparative study for the current value of projects
1.2.2 Studies of farmers’ production systems, to evaluate the economic and social situations of farmers on the irrigation schemesObjectivesThe objective of these studies (Bazin 2017a, b and c) was to evaluate the agricultural incomes of the different types of family farm farmers, so as to understand to what extent, and under what conditions, each of the irrigation schemes studied enables the families concerned to overcome poverty and food insecurity. These studies also aim to understand and quantify the diversity of farmers and strategies, in order to arrive at more specific recommendations concerning the developed land and its cultivation.
The main expected outcomes of these studies were as follows:
n Understanding the role of the different farming systems, irrigated and non-irrigated, in the make-up of the overall agricultural income of the different types of farmers, as well as the constraints limiting the performance of their production systems;
n Defining what size of irrigated holding is required, for each type of farmer, to ensure both food security and high yields;
n Analysing the specific needs of each type of farmer in terms of support and services for irrigated farming, to enable improvement of yields, conservation of soil fertility, and meeting family needs for subsistence and for investment in productive equipment.
MethodsThe farming system studies used the method of agrarian systems analysis, which aims to explain the diversity of the situations actually observed by identifying the distribution in time and between farmers of the factors of production (land, labour and capital). This method starts from the principle that the various strategies of farmers, which determine the systems of crops and livestock farming we find in operation, can be explained by the availability of the factors of production and their access to them. A

6
typology of farmers can be built up (dividing the entire set into homogeneous groups), based on the evolution over time of the systems of production and on their current diversity. Next, the specific economic features of each group of farmers are studied, and how these groups have arrived at their present state6.
The studies were carried out in several phases:
n An initial qualitative study was done to acquire an understanding of agriculturalchange, and to characterise the different types of farmers. This gave rise to apreliminary typology based on a limited number (from 5 to 8) of types of farmer,defined by their access to land and equipment and by the importance of agriculturein their overall incomes.
n A quantitative study of systems of production: this was an in-depth study of thestructure of the farm (equipment and labour), the costs of production, and theoverall outputs of the agricultural and livestock enterprise. This study enabled usto develop models of production costs and incomes for each category of farmers.The research for this study covered a purposive sample of +/- 10 farm surveys percategory of farmers.
The data collected refer to the 2014 agricultural year. The data were entered into a database so that each farmer type could be checked for consistency, and models of agricultural income developed for each type. Agricultural income, defined as the value of final production less the total of goods and services consumed, was estimated for each system of production (for details see Appendix 1).
Additionally, in order to know whether this income is sufficient to ensure food security or to enable families to escape from poverty, income had to be compared to family consumption needs. Existing data from different national-level surveys do not adequately take into account the particular characteristics of the cost of living in an area near a large-scale dam. A complementary quantitative study was therefore needed to estimate the totals for the different components of family consumption. This survey was done in 2015 using a purposive sample of about 30 families belonging to the different types of farmers. The headings of consumption taken into account were food, household expenditure, social expenses, education and health (see Appendix 1).
Finally, we had to estimate the relative proportions of the different types of farmers our study villages. A simple questionnaire to identify the type of farmer was applied to a random sample whose size was determined as a function of the estimated total number of farmers in the study area.
1.2.3 The choice of projects analysedStarting in 2008, GWI has worked on case study sites which are of sufficiently long standing to make it possible to learn lessons from them. A regional approach was adopted so as to be able to transcend national characteristics and make comparisons, and to share and capitalise learning from across the different sites. The cases analysed during these studies are not intended to be representative of a single particular situation: all the dams have in common is the fact that they are large enough to
6. For more information on the method, see Dufumier (1996) and Ferraton and Touzard (2009).

7
be considered “large-scale dams”7, and were constructed, along with their irrigation schemes, in the 1980s and 1990s in the Sahel-Sudanian climatic zone. Apart from this, they display a wide diversity in terms of uses, comprising a complex of dams which are essentially agricultural in purpose (Niandouba/Confluent) and dams with multiple uses (Bagré, Sélingué), where irrigation is more or less important. At all the three sites, the irrigation schemes are mainly intended for rice cultivation.
BOX 2
Brief presentation of the study sitesThe Bagré dam was built with a multi-purpose function (for hydro-electricity, irrigated agriculture, fishing, pastoralism and tourism). It is 30 m high; the dam was finished in 1993 and the 4.3 km long reservoir was commissioned in July 1994. Two irrigation offtakes were constructed: one on the right bank with a potential flow of 10m3/s and one on the left bank with a potential flow of 28m3/s. The project was originally designed to irrigate up to a total of 30,000 ha, using a combination of gravity and pumped irrigation.
Of a potential 7,320 ha theoretically irrigable using gravity-fed irrigation, just under half (3,380 ha) have been developed to date (2017) since the dam was built. To cultivate the development on the right bank and the 680 ha of the first phase of the left bank, 1,662 farmers were settled in 16 new villages (6 on the left bank farming 680 ha and 10 on the right bank farming 1,200 ha). Each farmer was supposed to receive an allocation of 0.1 ha for a house, 0.4 ha for house fields, 1 ha of land developed for rice farming and 1.5 ha of undeveloped land for other rainfed crops. For the second phase of development on the left bank, the government decided to reserve 900 of the 1,500 ha for commercial farming. This area was finally allocated to family farmers in 2012-13 following a very conflictual process. New developments are now under way as part of the project Pôle de croissance de Bagré. At the outset, in 1986, the development work was carried out and managed by a governmental structure, the Maîtrise d’Ouvrage de Bagré (MOB). This was replaced in 2010 by a public/private authority, Bagrépôle.
At Sélingué, the preliminary studies for the construction of a dam, carried out in the mid-1970s, identified an irrigable potential of 18,500 ha of which 10,600 were upstream and 7,900 downstream of the dam. Only two irrigation schemes have been developed to date downstream of the dam: the Sélingué scheme in 1980-82 (1,350 ha) and the Maninkoura scheme in the early 2000s (1,094 ha). On the Sélingué scheme, irrigation is supplied through total water control and is gravity-fed. Maninkoura is pumped. The irrigation network is supplied by a water offtake from the dam and is made up of a set of canals constructed in concrete and compacted earth8.
The scheme was cultivated for the first time during the dry season of 1983, and then by farmers in the wet season of the same year. Initially land was allocated to local and displaced families. The plots varied between 0.25 and 5 ha depending on the size of the family and its level of animal traction equipment. At the end of the 1980s the scheme area was still being cultivated at a low rate; the Sélingué Rural Development Office (Office de développement rural de Sélingué, ODRS) then withdrew some plots
7. A dam with a height of over 15 metres, from the deepest foundations to the crest, or a dam whose height is between 5 and 15 metres and which retains over 3 million cubic metres of water. See http://www.icold-cigb.net/GB/dams/definition_of_a_large_dam.asp 8. The detailed studies concern only the Sélingué scheme, because this is where there is the greatest potential for lesson learning.

8
9. In the text that follows, we refer to the Anambé scheme to mean the areas where development has been made possible by the construction of the Confluent and Niandouba dams. 10. www.gwiwestafrica.org 11. Funded by the World Bank and the African Development Bank (AfDB). For more information on the Bagré growth pole, see Inter-réseaux (2017).
from farmers who were not using them and opened up access to irrigated plots, including to some indviduals who had little equipment or capital and some who were not family farmers.
The Confluent and Niandouba dams were built in 1984 and 1997 respectively in the Kayanga and Anambé basins, on the upper reaches of the Kayanga river in the Kolda region in the south of Senegal. They are made up of a series of reservoirs, with the Niandouba reservoir (85 million m3) furthest upstream and lower down the Confluent reservoir (34 million m3) and finally the Lac Waima reservoir at the Kounkané bridge (25 million m3). This volume of water has enabled irrigated agriculture to be developed on a total area of 5,000 ha at Anambé9, where 5,000 ha can be cultivated in the wet season and 3,000 ha in the dry season, out of a total irrigable potential estimated to be 16,000 ha.
But dry season farming was practised only between 1985 and 1991, and then from 2003 to 2007, because of problems of irrigation organisation and operation. Areas of wet season rice planted rose from 500 ha in 1985 to 2,500 ha in 2009, with major variations throughout the period, and supplementary irrigation was not available in the wet season, resulting in large fluctuations in yields. The overall rate of cultivation within the scheme remains low, and the scheme has deteriorated to the point where the authorities have been forced to consider rehabilitating it. The Agricultural and Industrial Development Authority (Société de développement agricole et industriel du Sénégal, SODAGRI, created in 1974), is responsible for the development and management of the hydro-agricultural installations in the Anambé basin.
Studies carried out in 2011 on benefit sharing, which focused partly on these three sites (Bazin, F., Skinner, J. et Koundouno, J. (dir.) 2011), present the characteristics and the history of these projects. Other information is available in the detailed reports of the studies cited in the notes above, which can be downloaded from the GWI-West Africa website10.
1.3 GOVERNMENT OBJECTIVES FOR THE CONSTRUCTION OF DAMS AND IRRIGATED AGRICULTURE SCHEMESTo determine whether – and under what conditions – these costly developments contribute to the achievement of the aims assigned to them in national policies, it is important to look back at the wider policy objectives which were initially put forward to justify the construction of large-scale dams and their associated IAS.
These national policies have evolved during the period since the feasibility studies, construction of the IAS, and then their cultivation, rehabilitation or extension. Box 3 summarises the major policy objectives assigned to each dam and their main evolutions, so far as these can be re-traced through the documents collected as part of our studies. Although this is often a difficult exercise, because the irrigation schemes may be merely one component of much larger projects (as is the case with the Projet d’appui au pôle de croissance de Bagré11, or the Tiers Sud project in Senegal – see CACG, SONAD and IRAM 2016), we can see that in terms of the irrigation projects the dominant objectives were as follows (see Table 1):

9
TABLE 1
Objectives for the dams and irrigated agriculture schemes at Bagré, Sélingué and Anambé
Site Justifications at the time of dam construction
Justifications for current or planned developments
Bagré Combating povertyImproving food securityCombating climatic variability
Encouraging sustainable growthEncouraging private investmentIncreasing production and employment
Sélingué Meeting national energy needsCompensating the PAPDeveloping irrigated crop production to ensure food security and nutritional status in the medium term
Strengthening national food securityImproving nutritional status and reducing poverty at Sélingué
Anambé (Niandouba/Confluent)
Contributing to national self-sufficiency in foodIncreasing farmer incomes
Strengthening the resilience of the populationImproving living standards
n Food and nutritional security of populations in the project area, and national foodsovereignty: these objectives are strongly related to the food crises that affected theSahel in the 1970s and 1980s, and to the increases in the price of cereals during thecrisis of 2008/09;
n Combating poverty and improving living standards: this objective is clearly linkedto policies which were dominant from the 1990s onwards, but also to the need tostrengthen employment opportunities in the rural areas where population continuesto grow;
n Mitigating climatic variability and improving the resilience of the population: theseobjectives relate both to the droughts affecting the Sahel in the 1970s and 1980sand to a growing awareness of climate change; but at the same time, they wereinfluenced by the economic disruption following the liberalisation of the agriculturalsector in the 1990s.

10
BOX 3
Policy objectives to justify developments at Anambé, Sélingué and BagréAt Bagré, the principal motivating reason for building the dam was to farm land on which to re-settle people from the centre of the country who had been affected by the droughts of the 1970s. The aim of the development was to combat poverty and encourage food security (in particular by limiting the effects of climatic variation), to contribute to national food self-sufficiency and to create rural employment.
Originally, the project was to be entirely agricultural (rice farming), with a capacity to irrigate 30,000 ha. But in view of the economic and topographic constraints, it became necessary to develop the project further by raising the height of the dam in order to maximise the area capable of being irrigated by gravity, and (in view of the large surplus water discharges in 9 years out of 10, with a fall of over 25m), by adding on a hydro-electric power station with an annual generating capacity of 44 GWh (Kaboré et Sédogo 2014).
These objectives changed with the launch of the Pôle de croissance de Bagré project in 2011. Now the aim became to create the conditions for sustainable growth in the Bagré area through increases in private investment, which was intended to drive job creation and increases in agricultural production. The IAS were to be part of the essential infrastructure developed by the State to enable entrepreneurs to invest. These new developments were aimed at 1) family farms, accounting for about one quarter of the area (irrigable by gravity) and intended mainly to compensate PAP, and 2) private investors, who were to invest in the remaining 75% of the land suitable for development.
At Sélingué, the principal objective was electricity production to meet a large proportion of the country’s energy needs, dependent in the 1980s on thermal power generation. The IAS carried out upstream of the dam aimed essentially to compensate PAP. At the same time, the dam was originally designed to be multi-purpose, combining electricity generation, agriculture, fishing and river navigation. In terms of agriculture, the purpose of the dam was to enable 5,000 ha to be irrigated and for double cropping to be developed on the Office du Niger. The 2017-2019 contract agreed between the ODRS, the farmers and the Government of Mali set the objective of contributing to poverty reduction and achieving food and nutritional security, with a view to securing the well-being of the population in the development area of the ODRS, adopting a sustainable development perspective.
The new interventions involving rehabilitation and extension of the scheme, intended to strengthen food security through the development of irrigated crops (Projet de renforcement de la sécurité alimentaire par le développement des cultures irriguées, PRESA-DCI) and the Programme to Develop Irrigation (PDI) projects, were also justified in terms of national food self-sufficiency, improvement of food and nutritional security, and poverty reduction.
At Anambé, the Projet d’aménagement du Bassin de l’Anambé plays a part in the strategic objectives of the government, contributing to its aim of reducing the dependence of Senegal on cereal imports, especially of rice, and to develop the rural economy (Hathie 2015). The irrigated farm plots were intended to contribute to the country’s food security by producing 40,000 tonnes of rice, 25,000 tonnes of maize and 15,000 tonnes of sorghum per year. In the 2000s, the Support Project for Rural Development in the Anambé Basin (Projet d’appui au développement rural dans le bassin de l’Anambé, PADERBA) added to this the objective of sustainable increases in income for local farmers.
The same objectives re-appear as justifications for the rehabilitation work currently in progress or being planned for these irrigation schemes. So, the Tiers Sud project, which includes in its strategy the rehabilitation of sector G of the scheme, states as its overall objective the strengthening of the resilience of rural populations and the improvement of their living standards.

11
2
REVISITING THE JUSTIFICATION OF LARGE DAM PROJECTS
2.1 BASING DECISIONS ON REALISTIC HYPOTHESESFeasibility studies, which provide the essential elements in decisions to invest in large scale dams, are costly and complex. The data required for these studies include information which is technical (hydrological data, the amount of land that can be developed, the possible types of production), economic (the potential added value created) and social (the changes to the traditional systems of production and lives of local people that will be brought about by the development). This makes the data extensive, multidisciplinary and complex to collect. In some cases, the information does not exist: for example, how is it possible to determine the yield of rice on an irrigation scheme where this crop has not been grown before, or only under very different technical conditions? So those tasked with these studies have to develop hypotheses, usually based on data from other more or less similar experiences.
Another difficulty has to do with the long lifespan of hydro-agricultural investments, which are intended to last for many decades. It is very unlikely that the whole set of technical, climatic, economic and social parameters will remain constant over such a long period of time. So, the hypotheses have to take account of the probable changes which will take place over the lifetime of the dam.
In practice, feasibility studies are usually done in stages, beginning with general preliminary studies whose different parts are later expanded progressively: for example, an overall study of a dam and the different types of production, followed by specific studies on the various other components (agricultural, hydro-electrical, fishing, tourism etc.) as the funding becomes available. In the same way, some costs are initially estimated as general totals, and are later established more precisely by means of targeted research. This is the case, for example, for the figures for population displacement, arrived at initially through environmental and social studies and later by inventory and development of detailed resettlement plans. The array of hypotheses

12
concerning costs and benefits is thus constantly and progressively refined in the light of successive studies; and it is not unusual for certain hypotheses on which initial decisions were based to be significantly revisited and revised later (Box 4).
BOX 4
Development objectives in the Anambé basinFor the Anambé basin development, the feasibility studies by Electrowatt in 1980 envisaged the development of 16,265 ha in 5 phases. In 1991, studies carried out in preparing the Anambé Basin Development Plan showed that annual rainfall had declined from 1,100 mm in 1943 to 1967 to 816 mm in 1968 to 1991. The decline in the runoff coefficient was even more marked, with the result that the annually available volume had changed from 350 million m3 (1945-1967) to 105 million m3 (1968-1991) and was therefore insufficient to irrigate the area initially planned.
Major investments are required for large dam projects, and mobilising the funding for them involves bringing many donors together. These projects are usually carried out in several phases, which enables the initial investment to be lower, and production to start before the entire financial commitment has been assembled. In the case of Bagré for example, the initial investment concerned the hydro-electric component (the dam and power station), built between 1989 and 1993. The agricultural components of the project were financed in successive stages starting in 1995 (1,200 ha), and in 2002 (600 ha) and 2006 (1,500 ha). Each agricultural component was the subject of an additional feasibility study, which analysed separately the cost-benefit of that particular additional investment. As Kaboré and Bazin (2014) emphasise: “The first study, which confirms the economic viability of the scheme as a whole, is extremely important, because the subsequent studies of the different developments then limit themselves to analysing the viability of each investment separately. These projects have more chance of being economically justified in so far as they increase the return on one or more of the invest-ments already made (the dam, the main canals, etc.)”
Retrospective analysis of the economic outcomes of the three study sites shows that some of the hypotheses used to justify investment decisions were over-optimistic, and did not fully account for the difficulties which this type of project routinely encounters. The hypotheses analysed here concern:
n The area suitable for development, and the rate of its development
n The cost of the developments
n The cultivation intensity (for example, the rate of double cropping)
n Farm performance (yields, added value produced)
An analysis of the differences between initial hypotheses and actual achievements offers useful lessons for future irrigation development projects.
2.1.1 The area suitable for development and the rate of developmentThe area with potential for development for irrigated agriculture is a key element high-lighted in the justification of the economic returns to a dam project. The larger the area, the greater the potential increase in overall agricultural production. From an economic point of view, if the dam is considered as a fixed cost, a larger irrigable area makes it

13
easier to obtain a return on it. First estimates often suggest a large irrigable potential, whereas the areas actually developed are in fact relatively limited, and are developed at a slow rate (100 to 200 ha per year on average, see Table 2).
As an illustration, the feasibility study for the Bagré dam forecast that the construc-tion of the dam and the development of 5,000 ha of irrigable land would be completed in just 6 years (Figure 3), whereas it actually took 19 years to build the dam and develop 3,300 ha.
TABLE 2
Irrigable areas and areas actually developed, Bagré, Sélingué and Anambé
Dams Date Potential irrigable area
Irrigated area developed since reservoir commissioned
Ratio potential/developed area
Total time taken to develop
Rate of development
Bagré 1992 31,100 ha total 7,500 ha gravity-fed
3,330 ha 11% of total potential 45% of gravity-fed potential
15 years (1995-2009)
225 ha/year
Sélingué 1981 18,500 ha 2,217 ha 12% 25 years (1981-2006)
89 ha/year
Anambé (Niandouba & Confluent)
1984 1997
16,265 ha 4,325 ha 27% 28 years (1982-2009)
154 ha/year
FIGURE 3
Original timeline of proposed developments at Bagré dam (feasibility study)
Year 1 2 3 4 5 6
Call for dam construction tenders
Construction of the dam
Call for tenders for irrigation and drainage works
Construction of irrigation and drainage works
Area developed annually (ha) 1000 1100 1100 1800
Cumulative area developed (ha) 1000 2100 3200 5000
At Anambé, 1,420 ha were planned to be developed in 3 years during the first phase; but it actually took 12 years, from 1982 to 1993, to develop 1,320 ha. Among the reasons put forward by the Ministry of Agriculture mission in 1994 were “over-optimistic baseline studies”. In fact, there are many problems which commonly complicate the implementa-tion of plans for development works: difficulties in raising funding, the time needed for baseline studies, engineering works which are more complex than initially foreseen, etc.

14
TABLE 3
Forecast and actual costs of agricultural development, Bagré, Sélingué and Anambé
Sites
Bagré Sélingué Anambé
Forecast Actual diff. (%)
Forecast Actual diff. (%)
Forecast Actual diff. (%)
Dam + power station (2008 CFA Francs – FCFA – billions)
47,9 51,2 7% 83,9 83,4 -1%
Irrigation scheme 9,3 8,6 -7% 3,0 6,9 127%
(2008 FCFA, millions per hectare)
447 3 213 618%Displacement of population (2008 FCFA, millions)
8,9 15,4 72%
Irrigation scheme + dams, Niandouba and Confluent (2008 FCFA, millions per hectare)
For comparison, the average investment costs of large- and medium-scale irrigation schemes12 in the public sector in West Africa are currently estimated at between 5 and 10 million FCFA per hectare (BRL ingénierie 2015).
These differences between forecast and actual costs are not always a matter of poor initial estimation at the feasibility study stage. In the case of Niandouba and Confluent the exorbitant cost of the project (15.4 million FCFA per hectare on average!) is explained by the difficulties encountered during the first phase of development, when the costs were almost 4 times higher than forecast (Table 4). For phases 2 and 3, the estimated development cost was much higher than the estimate for phase 1 (9.7 million instead
12. Fully controlled irrigation schemes, funded by governments (with donor aid), 100 ha minimum. (BRL Ingénierie 2015).
2.1.2 Development project costsComparison of planned and actual investment costs (Table 3) shows that the costs of dams and power stations seem to be relatively well managed and controlled, and that the differences between planned and actual costs are minor. It is another matter for hydro-agricultural improvements, where actual costs per hectare are sometimes far from the estimates used as the basis of the feasibility analysis. In the same way, the costs involved in displacement and compensation of populations affected by the project (where these have even been taken into account) were often seriously under-estimated. The case of Sélingué is a good example of these situations; here the dam and hydro-elec-tric installations were accurately costed, while the implementation of the agricultural development works cost twice the forecast investment, and the cost of displacing the population was under-estimated by a factor of 7.

15
of 6.7 million, or 50% higher), but the cost of implementation exceeded the estimate by 20%, with a development cost per hectare of over 10 million FCFA (Table 5).13
Such high levels of costs – which are also often related to major delays in implementation – jeopardise the return on these types of projects measured in terms of NPV and IRR.
13. For details of costs and explanations, see Hathie (2015).
TABLE 4
Balance sheet of Anambé basin development, phase 1
Headings Forecast(EWI study 1980a)
Actual
Irrigated area developed (ha) 1420 1320
Investment costs (FCFA current) 3 648 000 000 16 475 000 000
Investment costs (FCFA 2008) 9 519 959 596 34 065 000 000
Development cost/ha (FCFA 2008) 6 704 197 25 806 818
TABLE 5
Balance sheet of Anambé basin development, phases 2 and 3
Headings Forecast(BCEOM study 1994)
Actual
Irrigated area developed (ha) 3635 635
Investment costs (FCFA current) 18 858 000 000 35 366 000 000
Investment costs (FCFA 2008) 35 540 738 298 42 117 000 000
Development cost/ha (FCFA 2008) 9 777 370 11 586 520
At Anambé, a number of different factors combined to raise development costs to a much higher level than had been forecast. Some of the problems were related to the project design, such as under-estimating the time needed for procurement procedures and for project implementation, and the costs of some operations. Others were due to inefficient implementation (poor organisation by the developer; work carried out to a poor quality and having to be re-done). Finally, external constraints such as exchange rate movements may also have played an important role (e.g. the devaluation of the FCFA).
2.1.3 The rate of development Hypotheses relating to the output of irrigation projects are also often lacking in realism. The yields and cultivation rates forecast in feasibility studies are frequently too high, or are reached many years later than planned. For the 3 dams studied here, the forecast cultivation rate was 2, implying double annual cropping on the entire developed area. In the case of Anambé, this figure was revised downwards to 1.6 ten years later, when the studies for the basin development plan showed that the water resources for dry season irrigation were insufficient.

16
TABLE 6
Cultivation rate of development schemes, Bagré, Sélingué and Anambé
Dams Cultivation rateForecast Actual
Bagré 2 1,8
Sélingué * 2 1,9
Anambé 1,6 0,3
* Cultivation rate for areas suitable for rice cultivation
At Bagré and Sélingué, the rate is close to 2 because double cropping is practically universal. The cultivation rate never reaches the theoretical maximum because there are always plots where the land improvement work does not permit double cropping, or which are poorly drained and are flooded in the rainy season, or badly supplied by the irrigation network and unable to support dry season crops. At Sélingué for example, only 870 ha out of the total of 985 ha that have been developed for rice cultivation are suitable for rice at all seasons; 5 ha are able to be cultivated only in the rainy season; and 110 ha cannot be cultivated for rice because they are too freely draining.
The cultivation rate does not depend only on the land development and on suitability for rice farming, but also on the capacities of the farmer to cultivate the plot effectively and efficiently. A number of factors which are not linked to the quality of the development limit farmers’ cultivation of their plots:
n Low profitability of the crop: this is often the case during the first few years when farmers, and often also extension services, have to adapt themselves to a new crop, to the cultivation techniques required, and to the collective organisation needed etc. (see the case of Sélingué, Mali, in Box 6).
n Capacity to bring the plot into production: irrigated rice is a crop requiring intensive cultivation, which entails significant human and material demands and a major capacity for self-financing or appropriate credit systems (Bazin 2016). Without these necessary means, some farmers may decide not to cultivate their plots, or cultivate only part of them (see Box 5).
n Poor marketing organisation, in particular difficult conditions for the sale of produce, impose severe limitations on the potential for double cropping (see on this subject Box 14).

17
BOX 5
Cultivation of land developed for irrigation, Anambé, SénégalThe Anambé case is typical of the difficulties farmers have in bringing the irrigation scheme into production. The areas suitable for cultivation represent 100% of the developed area in the wet season and 60% of the developed area in the dry season (corresponding to the forecast cultivation rate of 160%). As Graph 1 shows, the areas actually cultivated have been much smaller than the cultivable area, especially in the early 2000s. Among the reasons for this low level of cultivation – the average rate being no higher than 50% – are the following:n The areas cultivated during the wet season correspond, on average, to about one
third of the developed (i.e. cultivable) area, with high annual variations. The actualdegree of effective cultivation is strongly determined by competition with rain fedcrops elsewhere, and by the availability of equipment to work the land and of creditto finance the irrigated farming season.
n Areas cultivated in the dry season are very limited – 14% of the cultivable area onaverage, and only half that percentage in the last 5 years. Dry season farming suffersfrom the same difficulties as wet season farming, with the addition of difficulties incollective organisation – to make water-pumping operations economically viable,a large number of farmers capable of mobilising the funds required for a farmingseason needs to be involved. There is also the additional cost of irrigation, and thefact that the functioning of the irrigation network is becoming increasingly unreliablewith the passage of time, because of lack of maintenance.
.
0
1,000
2,000
3,000
4,000
5,000
6,000
7,000
8,000
1991 1992 1993 1994 1995 1996 1997 1998 1999 2000 2001 2002 2003 2004 2005 2006 2007 2008 2009 2010 2011 2012
Cultivable area/year Areas cropped
Are
a (h
a)
Cultivable areas are calculated on the basis of an exploitation rate of 160%
GRAPH 1 Cultivable and cultivated areas, Anambé

18
0
1000
2000
3000
4000
5000
6000
7000
1994 1995 1996 1997 1998 1999 2000 2001 2002 2003 2004 2005 2006 2007 2008 2009 2010
Are
a (h
a)
Forecast area cultivated Area cultivated
GRAPH 2
Evolution of cultivable areas showing the planned rate of development on the left bank (SOGREAH 1980) and the area actually under cultivation (1994-2010), Bagré
BOX 6
Initial difficulties in bringing improved land into production, Sélingué, MaliAt Sélingué, the scheme was first farmed under management by the authority in the dry season of 1983, and then in farmer-managed cultivation in the wet season of the same year. In the first years, the ODRS did all the ploughing using its tractors, and provided farmers with the required seed and fertiliser. But farmers had only limited experience in rice farming, and there were many technical problems – in particular, weed control on large areas. Faced with poor yields of around 1 t/ha on average per season, instead of the 3 tonnes predicted, many farmers preferred to concentrate on rain-fed crops or to abandon their rice fields altogether. The Office reacted to low levels of farming and poor yields by imposing obligatory transplanting of rice in 1989. This technical change was accompanied by a complete restructuring of land tenure in the scheme, involving allocation of smaller plots of 1.25 to 1 ha, in order to allow for the major labour input entailed in transplanting, and to avoid under-use of the developed areas. In addition, many families who had found this cultivation technique extremely arduous did not apply for a new plot, which led the Office to open up access to an allocated plot to other families. In this way large numbers of migrants, and also people from elsewhere who were already on the scene, such as fishers and people who had come to work on the dam construction site, also got access to plots in the irrigation scheme.
Cultivable areas are calculated assuming 200% exploitation rate.
These slower rates of development than forecast, and the difficulties of bringing developed land into production, have had a cumulative impact on the areas cultivated which can be very substantial. In the case of Bagré, if we consider the period 1994-2010, a cumulative total of 40,000 ha were farmed for rice, whereas this figure should have been 80,000 according to the hypotheses of the feasibility study (Graph 2). In terms of production, this represents a “production gap” which can be estimated at

19
0
500
1000
1500
2000
1977
19
78
1979
19
80
1981
19
82
1983
19
84
1985
19
86
1987
19
88
1989
19
90
1991
19
92
1993
19
94
1995
19
96
1997
19
98
1999
20
00
2001
20
02
2003
20
04
2005
20
06
2007
20
08
2009
20
10
2011
20
12
2013
Are
a (h
a)
Areas actually cultivated Forecast areas of rice cultivation
Cultivable areas are calculated assuming 200% exploitation rate
2.1.4 Farm performanceAnalysis of GVA per irrigated hectare provides an estimate of the capacity of the land development investment to deliver returns that repay the cost of the development work and enable farmers to cultivate it profitably. The graphs that follow compare the added value produced by the development schemes (calculated on the basis of the data available for prices and for production14) with the values estimated in the feasibility studies, corrected for inflation over the period of the analysis.
The graphs show that the feasibility studies tended to heavily over-estimate the added value produced by these IAS (with the exception of the BCEOM study in Senegal in 1994, carried out to take into account the effects of the devaluation of the FCFA on the project). The actual values approach those of the feasibility studies only at the time of the 2008 crisis, when cereal prices rose sharply. At Bagré, the yearly mean added value is of the order of 250,000 to 300,000 FCFA/ha, whereas the feasibility studies had suggested mean added values of between 500,000 and 600,000 FCFA/ha. At Anambé, the added value varies between 200,000 and 300,000 FCFA/ha, when the rainfall is favourable – because irrigation is not used during the rainy season, yields vary with rainfall and the added value may even be negative – whereas the initial studies (EWI 1980, BCEOM 1993 – see Hathie 2015 for the references) forecast added value figures of around 600,000 FCFA per hectare.
14. There are no data series for the costs of production. These have been reconstructed based on the statements of farm economic performance that are available, but the data are insufficient to allow a detailed comparison with the feasibility study figures.
GRAPH 3
Rice cultivation areas forecast and actual, Sélingué (1977-2013)
160,000 tonnes of rice (4 t/ha X 40,000 ha) over 16 years, or an average of 10,000 tonnes per year. At Sélingué, where land was developed with shorter delays, it was the initial difficulties of production that limited the area under cultivation, which amounted to 41,000 ha cumulatively over the period between 1977 and 2013, as against 64,000 ha according to the feasibility studies (or -36%, see Graph 3).

20
0
100000
200000
300000
400000
500000
600000
700000
800000
900000
1997 1998 1999 2000 2001 2002 2003 2004 2005 2006 2007 2008 2009 2010
Add
ed v
alue
per
hec
tare
, in
FCFA
Actual added value calculated Mean AV forecast (CIEH 1993) Mean AV forecast (CIEH 1993
-200,000
0
200,000
400,000
600,000
800,000
1,000,000
1985
19
86
1987
19
88
1989
19
90
1991
19
92
1993
19
94
1995
19
96
1997
19
98
1999
20
00
2001
20
02
2003
20
04
2005
20
06
2007
20
08
2009
20
10
2011
20
12
2013
Add
ed v
alue
per
hec
tare
an
d p
er y
ear,
in F
CFA
Actual added value calculated AV EWI study 1980 AV BCEOM study 1993 AV BCEOM study 1994
GRAPH 4
GVA per hectare of irrigated rice (1997-2010) compared with initial hypotheses of CIEH (1993), Bagré
GRAPH 5
GVA per hectare of irrigated rice and forecast of feasibility studies, Anambé
Yield hypotheses At Bagré, rice yields have been between 4 and 5 tonnes per hectare per season since 1997, with a mean yield of 4.4 t/ha. These figures correspond in overall terms to the yield hypotheses adopted by the Inter-African Committee for Hydraulic Studies (Comité interafricain d’études hydrauliques, CIEH) feasibility study of 1993 – 4 t/ha in the medium hypothesis and 4.5 t/ha in the high hypothesis – but are well below the forecasts put forward in the STUDI (1998) feasibility studies referring to the 1,500-ha potential and based on a yield of 6 t/ha per farming season.

21
2.5
3
3.5
4
4.5
5
5.5
6
6.5
1997 1998 1999 2000 2001 2002 2003 2004 2005 2006 2007 2008 2009 2010
Yie
ld p
er s
easo
n in
T/h
a
Observed Medium forecast (CIEH 1993) High forecast (CIEH 1993) STUDI (1998)
Line of best fit
GRAPH 6
Forecast (1993) and actual yield levels of rice per season, Bagré (1997-2010)
The striking feature at Anambé is the wide variability in yields, which results from the fact that the rice is not irrigated during the rainy season – the principal farming season in terms of area. On average, the yields obtained correspond fairly well to the range of yields forecast in the EWI study of 1980 (between 2.6 and 4.5 T/ha), but the yields forecast in the 1993 BCEOM study (between 4.7 and 5.5 T/ha) are rarely attained.
0
1
2
3
4
5
6
7
8
Yie
lds
per
sea
son
in T
/ha
Yields (T/ha) EWI min EWI max BCEOM min BCEOM max
1985 1986 1987 1988 1989 1990 1991 1992 1993 1994 1995 1996 1997 1998 1999 2000 2001 2002 2003 2004 2005 2006 2007 2008 2009 2010 2011 2012 2013
Line of best fit
GRAPH 7
Comparison of yields obtained with feasibility study forecasts, Anambé

22
In overall terms we can conclude that:n More conservative yield hypotheses are generally closer to the reality;n The minimum and maximum values in the yield forecasts correspond fairly well to
the directions of the yield trends;n Improvements in yields are relatively slow (+35 to +50 kg/ha/year on average).
Price hypothesesThe hypotheses adopted in the feasibility studies concerning future prices are often based on the available historic data series. These studies tend not to take much account of the future evolution of prices over the course of the project lifetime, as the prices paid by farmers for inputs and services and the prices they receive for their crops are assumed to move in similar ways (which is debatable). The graphs of prices below have thus been produced taking into account the inflation rate in the country, in order to make it possible to compare them with the data on recorded prices. In Senegal the price forecasts used by the EWI study of 1980 (as well as by the BCEOM study of 1994, which takes into account the impacts of the devaluation of the FCFA), are fairly realistic and have been close to the prices actually observed. The price forecasts of BCEOM in their 1993 study are higher than the observed prices up to 2008, when the food crisis caused a steep rise in cereal prices in general and in the price of rice in particular (see Graph 8).
Observed prices Corrected EWI price (1980) Corrected BCEOM price (1993)
0
20
40
60
80
100
120
140
160
180
200
1985
1986
1987
1988
1989
1990
1991
1992
1993
1994
1995
1996
1997
19
98
1999
2000
2001
2002
2003
2004
2005
2006
2007
2008
2009
2010
2011
2012
2013
Pric
es o
f ri
ce p
aid
to
far
mer
s in
FC
FA/k
g
GRAPH 8
Hypothesised rice prices (FCFA) in feasibility studies, compared to prices observed in the period 1985-2013, Anambé
At Bagré, the studies used three price levels: 65 FCFA/kg in the preliminary studies (in 1980), 85 FCFA/kg at the time of the first phase study for 2,100 ha (in 1993), and 160 FCFA/kg at the time of the second phase of 1,500 ha (in 1998). Graph 9 shows that the hypotheses on future prices adopted for the studies were optimistic, and that the prices actually observed since 1997 are lower than forecast. In the period 1998-2007, the differ-ence was significant, with an average gap of 33.3 FCFA/kg (-23%). This over-estimation of farmer prices has had a significant effect on the valuation of production and consequently

23
on the value-added figure of the agricultural component of the Bagré scheme. If we take the corrected CIEH forecast price (the closest to the observed price), the over-estimate of the added value in the period 1998-2007 is on average 133,000 FCFA/ha/year, or 40% of the value actually created.
The liberalisation of agricultural markets carried out by governments in the period after the studies (or even after the project’s completion) did, of course, have the effect of completely altering the conditions in which agricultural produce was commercialised. This created major volatility in cereal prices, and in particular in the price of rice, as has been seen since 2008. More robust hypotheses concerning agricultural prices are needed, as well as sensitivity analyses to price variations; this is especially true in the case of development schemes which are based on monocultures and which do not allow for diversification of production in response to market signals.
0
50
100
150
200
250
Pric
e o
f ri
ce p
aid
to
far
mer
in F
CFA
/kg
CIEH prices, 1993, corrected Observed prices
Sogreah prices, 1980, corrected Studi prices, 1998, corrected
1997 1998 1999 2000 2001 2002 2003 2004 2005 2006 2007 2008 2009 2010 2011
GRAPH 9
Hypothesised rice prices (FCFA) in feasibility studies, compared to prices observed in the period 1997-2001, Bagré
To compare prices in feasibility studies (estimated for a given date) with currently observed prices, estimates in the studies have been corrected for annual inflation. Source of observed prices: SONAGESS and FAO.
2.2 THE IMPORTANCE OF MULTIPLE USES FOR ECONOMIC RETURNS TO DAM PROJECTSEconomic analysis of the 3 dams yields contrasting results (Table 7):
n The Anambé (Niandouba) project shows a cost/benefit ratio higher than 1. The NPV is therefore negative no matter what discount rate is selected (-26 billion FCFA at a discount rate of 4%). This is not a surprising finding, given that this is a purely agricultural scheme (although there is a small amount of fishing in the dams, contrib-uting about 10% of the added value produced), and that this agricultural activity has experienced, and is still experiencing, major difficulties. The long delays and the poor quality of the project’s infrastructural work, the low rate of cultivation, the poor

24
functioning of the irrigation network and the production system (with no irrigation in the rainy season) have combined to generate levels of production much too low to deliver a return on the investments made by the Government of Senegal.
n At Sélingué, the project shows a positive NPV (+68 billion FCFA) and an IRR of 9.2%, which is close to the 11.5% forecast in the feasibility study. A simulation of the dam with the hydroelectric power station but without the agricultural development project shows that the dam pays for itself through the production of electricity alone.
n It is difficult to reach a firm conclusion in the case of the Bagré project, because there are no available data concerning electricity production. Simulations show a slightly negative NPV (-7.8 billion FCFA) excluding the income from electricity production and fishing, and notwithstanding the delays in implementing the development. So, it is most probable that the NPV would be positive if these other forms of production were included. In addition, the analysis of the IAS on its own, without considering the cost of the dam and the power station, gives a positive NPV result (+4.9 billion FCFA) and an IRR of 7.8, comparable to the values predicted in the feasibility studies.15
Multi-purpose dams have a better chance of being profitable than those whose sole or essential purpose is agricultural. The production of energy in particular enables a dam construction project to produce a return by means of regular and immediate revenues, while agricultural production, which takes longer to establish and is subject to more technical and economic variation, makes only a weak contribution to the economic return to investment in a dam (Graph 10).
15. The Bagré developments were seriously delayed compared to the initial planning, because they were divided into phases each of which required time to mobilise donors and carry out ad hoc studies. These delays had an impact on the overall IRR (dam plus development projects), but not the IRR of each project, because the starting date of each is taken to be the moment of the first disbursement (and so does not include the studies or the time taken to raise the funding).
TABLE 7
Economic evaluation of the Bagré, Sélingué and Anambé projects
Dams Developments evaluated
Discount rate
NPV (billions FCFA)
IRR calculated (%)
IRR forecast (studies) (%)
Bagré Dam +hydro-electrical and irrigated agriculture schemes
Hydro-agricultural projects alone
5%
-7.8 *
4.9
2.9**
7.8
15.2
5 à 7.4
Sélingué Dam + hydro-electrical and irrigated agriculture schemes
Dam + hydro-electricity
IAS alone
4%
68
36
-0.89
9.2
7.6
3%
11.5
12.6
?
Anambé Dams + IAS 4% -26 ** ?
*Because of lack of data, calculation does not include the returns generated by the production of electricity ** Benefits lower than costs, so not possible to calculate an IRR

25
-20%
0%
20%
40%
60%
80%
100%
1980
19
81
1982
19
83
1984
19
85
1986
19
87
1988
19
89
1990
19
91
1992
19
93
1994
19
95
1996
19
97
1998
19
99
2000
20
01
2002
20
03
2004
20
05
2006
20
07
2008
20
09
2010
20
11
2012
20
13
Shar
e o
f o
vera
ll G
VA
FC
FA 2
008
Years
GVA FCFA 2008 electricity GVA FCFA 2008 crop production VAB FCFA 2008 fishing
GRAPH 10 Movement in the contribution of electricity, farm and fish production to the annual generation of wealth at Sélingué (1980-2013)
In addition, funding constraints are often a brake on multi-sector interventions (see Box 7). Given that energy production by itself justifies the building of the dam at Sélingué, this means that the development of other forms of production may be projected on the basis of their additional costs alone – for example, agricultural production simply on the basis of the costs of developing irrigation schemes. This is all the more significant because some productive components tend to be under-estimated in feasibility studies and thereafter to receive little support, when they are capable of making a major contribution to the total added value produced. This is the case, for example, with fish production at Sélingué, which represents almost a quarter of the wealth produced (Graph 11) despite receiving only 5% of the funds invested.16
16. Feasibility studies of the development of fish resources were initiated only in 1995/96, and the project (Projet dedéveloppement des ressources halieutiques du lac de Sélingué) started only in 2003 – 15 and 23 years respectively after the commissioning of the dam (Hathie et al. 2017).
GVA FCFA 2008 electricity
67%
GVA FCFA 2008 crop
production 7%
GVA FCFA 2008 fishing26%
GRAPH 11 Average shares of GVA for electricity, farming and fish production at Sélingué, 1980-2013 (FCFA 2008)

26
2.3 ARE NPV AND IRR ADEQUATE INDICATORS OF THE RETURNS TO DAM BUILDING PROJECTS?The classic measures of NPV and IRR, used in the economic evaluation of projects, have been the subject of critiques when used as the sole criteria for deciding whether to invest in a project with a restructuring impact, such as a large dam (Tiffen 1986). As has been emphasised in the previous section, the risks inherent in the hypotheses adopted are often very high, and may have severe impacts on the actual outcomes. Even if sensitivity analyses can theoretically be carried out, this is rarely done, and such analyses generally cover only a small number of non-critical hypotheses.
Two other elements are needed for a more complete view of the economic results of a project. The first is analysis of the costs of management and maintenance and their funding. Feasibility studies frequently predict that these costs will be covered by the farmers, whereas this is rarely the case, as we shall see in section 3. The second is analysis of the incomes which the farmers will be able to derive from the development, and which condition both their interest in making it productive (with obvious impacts on the economic outputs of dams) and their capacity to pay the management and maintenance costs. The analysis of farmer incomes will be dealt with in section 4.
BOX 7
Sélingué: a multi-purpose dam and its funding constraintsWhen the project was identified, it contained multiple components with sectoral objectives: increasing electricity production in the energy sector; increasing irrigation scheme land; and developing fishing, all in the agricultural and fishing sectors; and finally, improvement of navigation on the Niger river in the transport sector. Later on, when it was evaluated, the project retained only one component, in the energy sector, because of financing constraints (….) The objective of the project had been reduced to the single aim of increasing energy production, but the technical design of the dam was still that of a multi-purpose dam involving both electricity production and irrigation (AfDB 1988b).
The Sélingué rural development project was added later; it was the logical follow-up to the Sélingué dam project, which entailed displacing the local population and re-settling them around an irrigation schemeto ensure their food security (AfDB 1988a).

27
3
THE QUALITY OF PROJECT INFRASTRUCTURE, ITS MANAGEMENT AND UPKEEP: A KEY ISSUE Some development works are carried out badly, or are not completed. This is the case in particular for Sector 5 at Anambé, where 600 ha out of the 820 ha of Phase 3 have not been developed correctly, so that they cannot be flooded properly (Hathie 2015). The drainage is dysfunctional and the levelling has not been done correctly, so that flooding is difficult, especially since the plots are large (AfDB 2000). Furthermore, the poor-quality roads and tracks cannot be used by vehicles in the wet season, making machines hard to move around and inputs difficult to deliver.
The schemes often have quality defects, at least in part. At Sélingué, Sissoko (1986) notes that out of 900 ha in the rice farming area of the scheme, only 520 ha or about 60% can be farmed for rice at all seasons of the year, while 200 ha can be farmed only in the rainy season, and 190 ha are not fit for rice growing. This poor quality becomes apparent when the scheme areas are farmed for the first time. “Irrigation is very problematic because of unequal levelling, lateral infiltration and poor water flows”. (Sissoko 1986, page 38).
Apart from these problems of levelling and drainage, which prevent farmers from applying water to their rice effectively, another common problem is that the devel-opment of the scheme area has removed the fertile top layer of soil or mixed it with the lower infertile layers during the levelling of the plot. This happens in almost all the schemes, to differing degrees depending on the slope that has to be corrected and the technique used. At Sélingué, for example “one should also mention the poverty of the soils following the scraping off of the higher areas towards the lower parts, with a consequent transfer of fertile matter in the same direction” (Sissoko 1986, page 38).
These problems associated with the development work have a number of conse-quences. The cultivable area is actually smaller than the area nominally developed for cultivation; but also the yields obtained may be very poor on some plots which are badly levelled or whose fertility has been degraded by levelling. This has a marked

28
impact on the economic performance of the farmers, who may sometimes abandon farming on the developed plots if they consider them unprofitable or too risky (see the case of Sélingué in Box 7).
After the development work has been carried out, the next questions concern the management of the scheme and its maintenance and renewal. The roles and respon-sibilities of the various actors such as the SAGI, which are in charge of water and scheme management, the electricity companies managing the dam, the farmers and others are theoretically defined in the specifications and terms of reference. But these serve mainly to determine the duties of the farmers and do not have much to say about the obligations of the other actors such as the irrigation managers. Furthermore, the farmers have few means at their disposal to put pressure on the SAGI when they fail to fulfil their obligations in terms of water management services. Knowledge of the terms of reference is usually minimal and observance of them is scanty (Adamczewski 2016), which creates dysfunction in governance and manage-ment, especially as concerns the upkeep of the irrigation network.
As an example of the problems of management, the exceptionally high level of the Confluent (Anambé) dam in 1999 caused the partial flooding of neighbouring sectors, but no action was taken by SODAGRI to limit the damage by manipulating the dam’s outflow gate (AfDB 2000). The same report finds that the maintenance operations supposed to be done by SODAGRI were not always carried out, or were carried out too late, and that the farmers were not ensuring the upkeep of the terminal networks closest to their farms (the tertiary canals and drainage channels). Lack of upkeep of irrigation networks and failure to repair the parts degraded over time lead to many dysfunctions which can have a serious effect on the output of more or less key parts of the network (Box 8).
The quality of upkeep of project infrastructure clearly depends on the overall amounts of human and financial resources being mobilised. For maintenance purposes, the means available depend on:
n The sharing of the maintenance burden between farmers and Government. The model of burden sharing in operation at Sélingué (as in Box 7) is quite common. Definition of the infrastructure works whose maintenance falls entirely or partially on the Government usually includes the biggest and most important structures and equipment (water intakes, main canals, drainage points etc.) The lack of public funds, or their use by the SAGI for other purposes, is sometimes the root cause of deficiencies in upkeep.
n The cultivation rate of the development; when this is low, the total amounts paid in water fees are insufficient to correctly finance the maintainance of the infrastructure.
n The rate of charge per hectare paid by farmers, and how the proceeds are used: the amounts charged vary greatly from one dam to another (Table 8), and are often far from what is really needed to cover the O and M (operation and maintenance) costs.
In our study, the highest water fee is paid at Sélingué, at 35,000 FCFA per hectare per cropping season, or 70,000 FCFA per year, whereas it is 3 times lower than this at Bagré and is zero at Anambé (where farmers pay only for the fuel required to run the pumps).

29
BOX 8
Upkeep failure and deterioration of the irrigation network at SélinguéAt Sélingué, upkeep of the primary network of the dam and the main canals and basins is carried out by ODRS, but is financed in part by the Government and in part by the farmers through payment of water charges. Upkeep of the secondary network on the other hand is done by ODRS with the help of the joint maintenance fund management committees (CPGFE or comités paritaires de gestion des fonds d’entretien), but the funding depends entirely on the water fees paid by the farmers. The tertiary network is the sole responsibility of the farmers themselves, organised into groups to maintain it (the OERT or organisations d’entretien du réseau tertiaire).
The observed state of affairs is that the primary irrigation and drainage network is in an advanced state of dilapidation and that water management at the secondary and tertiary network level has become uncontrollable. Rehabilitating the primary network and its additional components (the floodgates and pumping and drainage stations) requires material and human resources which are beyond the current capacity of the ODRS to mobilise. In practice, the funds collected through water fees are insufficient to maintain the primary and secondary networks, which are now in a very degraded condition.
The current degraded state of the scheme area means that good technical and financial management of land and water resources is impossible. Plots are poorly irrigated and are also poorly drained, so they are often flooded. In years of normal or high rainfall, bad drainage causes plots to be submerged. In years of low rainfall and in the dry season, the inefficiency of the irrigation network (because of loss of water) results in insufficient irrigation, causing major shortfalls in production.
Furthermore, while the recovery rate of the water fees is satisfactory at Sélingué (Table 9), this is not the case for Bagré (Table 10), where the rate of recovery varies widely from one year and one village to another. In 2009-2012, recovery was barely above 25%, despite the low level of the fee.
The amounts raised from fees are insufficient to cover the O and M costs. The study of water fee rates at Bagré (Bagrépôle 2013) estimates these costs, to be around 100,000 FCFA per ha per year. Taking as a basis of calculation the maintenance contract signed by Bagrépôle in 2012 for the management and upkeep of the primary and secondary
TABLE 8
Water fees in 2014, Bagré, Sélingué and Anambé
Site Water fees per hectare and per season, FCFA
Bagré 12 500
Sélingué 35 000
Anambé –
Source: AfDB 2013

30
networks (with the tertiary networks being the responsibility of the farmers), the O and M cost would be of the order of 45,000 FCFA/ha, or about twice the fees currently paid (set at 25,000 FCFA/year).17
At Sélingué, the income from water fees is used as follows:
n 68,5% for maintenance work on the secondary water network;
n 1,5% for the salaries of the contractual personnel in charge of water management and the running of the joint committee;
n 30% for payment of bonuses and allowances of ODRS staff.
So only 70% of the water fee is allocated to O and M costs, or about 50,000 FCFA/ha per year. This amount is insufficient to fund the total of O and M costs, so the govern-ment has to make a financial contribution to the upkeep of the primary network (Box 7). The degradation of the network means that major rehabilitation work now needs to be done, estimated at more than 1.5 billion FCFA, or 17% of the value of the initial investment18, and this is to be funded by the Government of Mali through an AfDB loan (ADF 2013, AfDB 2013).
TABLE 10
Water fee recovery rate, Bagré
Year Budgeted (FCFA) Recovered (FCFA) Recovery rate (%)
2009 41 587 500 21 549 750 52%
2010 41 625 000 10 941 000 26%
2011 41 625 000 4 090 750 10%
2012 42 825 000 8 220 000 19%
Average 41 915 625 11 200 375 27%
Source: Bagrépôle 2013
17. Initially, the farmers at Bagré had to pay a charge of 100,000 FCFA/ha/year. These conditions in the contract specification were respected by the first to be allocated land, but difficulties began in 1998 with a bad season which led to some of the plot holders refusing to pay the charge. Faced with mounting unpaid charges, the MOB introduced a first reduction to bring the annual charge down to 80,000 FCFA, and then subsequently to 50,000 CFA and finally to 25,000 CFA, but the rate of payment did not increase. See Initiatives Conseil International (2010). 18.The total initial investment in the upstream scheme of Sélingué, 3,681 billion FCFA in 1981, has been adjusted for inflation to 2013 values.
TABLE 9
Water fee recovery rate, Sélingué
Year Budgeted (FCFA) Recovered (FCFA) Recovery rate (%)
2014 85 000 000 44 974 840 53%
2015 85 000 000 61 928 521 73%
Average 85 000 000 53 451 681 63%Source: ODRS 2016

31
At Anambé, SODAGRI is responsible for the maintenance of the key infrastructure (dams, channels, main and secondary canals, main and service roads) as well as equipment subject to depreciation (pumps, drive motors etc.). Maintenance of terminal networks directly adjoining farm plots (such as tertiary canals and drainage channels) is the responsibility of farmers. However, it has been observed (AfDB 2000) that this mainte-nance work has not been done correctly by the farmers and that SODAGRI is using only a minor percentage (averaging 40% for 1998-99) of the budget allocated to it by the government of Senegal for the upkeep of the network and infrastructure (amounting to 24,000 FCFA/ha/year).
A vicious circle has thus progressively established itself: low levels of use of the irrigation system (see Box 5) limit the investment in maintenance, leading to deterioration of the system, which in turn restricts the GVA of the scheme and therefore the possibility of increasing the water fee. A diagnosis made of Sector G in 2016, but one which is valid for the projects in general, notes “a general state of severe deterioration of the system, which makes its optimal cultivation impossible” (Box 9).
BOX 9
Diagnosis of Sector G at AnambéVegetation in the form of shrubs or even trees has re-established on many plots. The secondary and tertiary canals are dilapidated. Most of the tertiary drainage is blocked and very overgrown. The secondary drainage is partially obstructed and silted up. Many road-crossing structures are blocked by sedimentation or have collapsed. The result is that water management in the scheme is very difficult, both for irrigation and drainage of plots. The supply canal seems to still be fully functional. The pumping station is dilapidated but functioning. The main canal and the secondary intake structures are generally in a good state despite some leaks being reported. The tertiary intake and regulation structures are also in a good state of repair. The farm roads are in good condition and for the most part need only additional layers of laterite. Access roads are degraded or very degraded, mainly because of drainage and water-flow problems.
Source: CACG et al. 2016
The sustainability of these IAS therefore clearly depends on the funding of their upkeep. Three points are worth emphasising:
n In every case, although the total amount of the water charge is low, payment of it ispoorly justified and negatively perceived in the view of farmers whose areas are dilap-idated and who experience ineffective or unreliable water provision. Furthermore,there is still a lack of transparency in the use made of the money raised in charges,despite the setting up of joint committees.
n There is no confirmation of a link between low levels of charges and willingness topay (see the Bagré situation). Instead, the key factor appears to be the determinationof the management to ensure that rules agreed in advance with farmer organisationsare complied with. In practice, the charge rates are often calculated by specialistresearch teams who take little or no account of the capacity of farmers to pay aparticular level of charge. In the same way, the poor upkeep of the tertiary networks,which is usually the responsibility of the farmer organisations, is due above all tothe absence of any arrangement for joint monitoring and enforcement between a

32
scheme authority and farmers, capable of establishing what has or has not been done and applying the agreed sanctions for non-performance.
n Farmers’ ability to pay depends on the level of income they obtain from thedeveloped land in the scheme. But as we will analyse in Part D, these incomes areoften insufficient and vary from one category of farmers to another. The sharing ofO and M costs between Government and farmers needs to be defined with regardto this ability to pay.

33
4
PERSISTENT POVERTY IN THE IRRIGATION SCHEMES4.1 TAKING THE DIVERSITY AND PERFORMANCE OF FARMERS INTO ACCOUNT WHEN ESTABLISHING A TYPOLOGY Feasibility studies analyse the viability of an irrigation development scheme for the farmers who will cultivate the land by calculating the income they will be able to earn once the land is irrigated, and comparing this with their current income. These analyses are generally carried out for an “average” or “typical” farmer without taking into account the diversity at play – size of family, level of equipment, access to land rights, other sources of income, family labour force. But the farmers who live and work in the developed areas of Bagré, Anambé or Sélingué are not homogeneous groups. There are significant structural differences between farmers, caused by differential access to the means of production, in particular to land and the capital needed to farm it profitably. Among the farmers within a single scheme, a range of different but relatively homogeneous types can be defined, each having a common set of constraints and productive strategies in relation to their systems of crop and livestock farming. The definitions of types of farmers in a given land area are based on analysis of their production systems, defined as combinations of factors of production (land, labour and equipment) used in animal and crop production, and common to a set of agricultural households.
Establishing a typology, in other words characterising the set of farmers in a small agricultural region – in our case, in the villages situated close to the irrigation scheme, where its farmers live – using a small number of characteristic types, is a way of overcoming the weakness of working with a single ‘average’ model of production that very often does not exist in reality, or is not representative because it conceals profound differences between families.
This method enables us:
n To identify and put in order of importance, for each group of farmers, the main technicaland economic problems facing them, so as to propose appropriate solutions;
n To better target government interventions according to the particular characteristics andneeds of each category;

34
n To propose land allocations within the schemes which are consistent with the economic situation of the different types of farmer and with their capacity to work the land effectively.
Appendix 2 presents in summary form the typology established for each of the irriga-tion schemes studied here.
4.2 A SUCCESSFUL MINORITY – AND A MAJORITY BELOW THE POVERTY THRESHOLDIn the three development schemes studied here, when we compare the incomes of the different types of farmers with the food security and poverty thresholds that have been calculated (Table 11), we find that the economic performances of the different types of farmers vary widely. Some have incomes above the minimum required to support their family, and can invest in their agricultural activity, while others have difficulty in meeting their food needs.
TABLE 11
Annual food security and poverty thresholds, Bagré, Sélingué and Anambé
Site Food security threshold (FCFA/person/year)
Poverty threshold (FCFA/person/year)
Bagré 62 000 123 000
Sélingué 110 000 227 000
Anambé 78 000 139 000
Thus, at Sélingué, the analysis of total annual incomes of different types of farmers (Graph 12) shows three distinct economic situations:19
n 2 types of farmers – those who specialise in irrigated crops and diversified farmers – have incomes above the poverty threshold; taken together, these represent 18% of farmers in the area.
n 2 other types – farmers of rain-fed cereal crops and farmers of rain-fed and irrigated cereal crops, who have an income close to the food security threshold; together these two types represent 40% of farmers.
n A final group, farmers without their own animal traction, estimated to be 27%, whose incomes are very much below the food security threshold.
19. These 5 types of farmers represent 85% of the farmers in the Sélingué study area. The remaining 15% are made up of 10% of farmers who are not farmers and whose economic situation has not been analysed because they do not form a homogeneous group, and 5% of farmers who have livestock raising or fishing as their principal activity, generating an income above the poverty threshold. For more details on the typology see Appendix 2.

35
0
50000
100000
150000
200000
250000
300000
Farmer without own animal
traction
Farmer specialising in irrigated crops
Farmer of rain-fed cereals
Farmer of rain-fed and irrigated cereals
Diversifiedfarmer
In F
CFA
/per
son
/yea
r
Net agricultural income Other income
Poverty threshold
Food security threshold
27% 5% 12% 28% 13%
GRAPH 12
Total annual income for the main types of farmers, and percentage of each type of farmer, Sélingué, 2014
NB: only 85% of local farmers are represented in the graph (see note 19). The year 2014 was an average year for rice production and slightly below average for rain-fed crops.
At Bagré, analysis of the total annual incomes of different types of farmers20 indicates that there are 3 major economic situations (Graph 13):
1. Farmers who lie above the poverty threshold: three types – “diversified” farmersand those with more than 1 ha of rice (with or without rain-fed crops) – exceed thepoverty threshold every year. In good years and bad, their farming income is abovethe poverty threshold, and their non-farming income can be devoted to productiveinvestments. In bad years, non-farming incomes complement their farming incomeand enable them to reach the poverty threshold.
2. Farmers just reaching the poverty threshold: these are farmers of rain-fedand irrigated crops who have less than 1 ha of rice fields in the scheme. Theirfarming income reaches the poverty threshold only in good years. In average years,non-farming incomes complement farming income and enable them to just reachthe poverty threshold. In bad years their income is below the threshold but abovethe food security threshold.21
3. Farmers not reaching the poverty threshold: this final group is made up offarmers who depend entirely on a rice field of less than 1 ha, and who do not reachthe poverty threshold even in good years and including non-farm income. In badyears, their farm income just reaches the food security level.
20. See Appendix 2 for the description of different types of farmers. 21. The questionnaires attempted to situate the yields obtained in the year of the survey (2014) by comparing them to those obtained in “good” and “bad” years. The concept of good and bad years was not defined a priori, but is particular to each farmer depending on his conditions of production.

36
0
50000
100000
150000
200000
250000
In F
CFA
/per
son
/yea
r
Agricultural income in bad year Agricultural income in 2014 Agricultural income in good year
Food security threshold
13% 33% 3% 45% 7%
Other income
Diversified Farmer rain-fed Farmer rain-fed Irrigation scheme Irrigation scheme crops and rice crops and rice rice farmer > 1 ha rice farmer < 1 ha > 1 ha < 1 ha
Poverty threshold
GRAPH 13
Total annual income in 2014, in a good and in a bad year, for the different types of farmers, and percentage of each type of farmer, Bagré
Traditional Traditional Traditional Traditional Moving towards Specialising in Specialising in manual with animal manual + rice with rice farming rice farming market traction equipment specialisation gardening + rice
0
50000
100000
150000
200000
250000
300000
350000
In F
CFA
/per
son
/yea
r
Farm income in bad year Farm income in 2014 Farm income in good year
11% 21% 30% 2%18% 12% 7%
Food security threshold
Poverty threshold
GRAPH 14
Total annual income of different types of farmers and percentage of each type, Anambé

37
At Anambé, analysis of annual farm incomes of the different types of farmers is made difficult by high inter-annual variability, linked to the absence of irrigation in the plots. 2014 was rather a bad year, so it is important to consider the results of good years in analysing the rationale of the different types of farmers.
The analysis of total annual incomes of the different types of farmers (Graph 14) shows 4 differentiated economic situations:
1. Farmers between the poverty and the food security thresholds. These arefarmers who specialise in market gardening, who are farming limited areas with highvalue-added crops. They exceed the poverty threshold in good years. These farmershave families of a mean size of 7 persons per family, which is small compared withthe regional average, and this explains how they can obtain an adequate income perhead with limited farm areas.22 They represent 7% of the farmers in the study area.
2. Farmers who are above the poverty level in good years, but are below thefood security threshold in bad years: these are farmers who specialise, or arein the process of specialising, in rice farming. In years when rice production inthe scheme is good, these farmers attain levels of income which make up for lowincomes in the other years, and this enables them to stay above the poverty lineoverall, or just to reach it, but with major annual fluctuations. This group is estimatedto comprise about 32% of all the farmers in the area.
3. Farmers whose income reaches the food security threshold only in goodyears: these are traditional producers who have animal traction, whether they arecultivating rice in the scheme or not. On average, these farmers find themselvesbetween the food security and the poverty thresholds, but with some years – suchas 2014 – when they are below the food security level. This group is estimated toaccount for 29% of farmers in the study area.
4. Farmers who never reach the food security threshold: this final group iscomposed of farmers who do not have animal traction of their own and who usuallyfarm manually, which restricts the size of the area they can cultivate. This group ofproducers who are structurally below the food security level is estimated to comprise32% of local farmers.
Farmers whose income is above the food security level are in a minority in the irriga-tion scheme areas, representing only about one quarter of all producers (Table 12). At Bagré, where all the farmers have a plot in the project scheme, a third of farmers at the time of our survey were on the limit of the poverty threshold, and just under half were below it. At Sélingué, nearly 75% of farmers have incomes below the poverty threshold (Graph 15). If we look only at those farmers who have plots in the scheme (13% of farmers in the sample villages do not have access to these developed plots), 70% of them have incomes below the poverty threshold, compared with 30% who are above it. At Anambé, considering only years of good production, 44% of farmers are below the poverty threshold and 25% are on the limit of the poverty level. Taking only those producers cultivating in the scheme (about two thirds of farmers in our study area), 45% have incomes above and 46% below the poverty threshold in a good year.
22. Note that in the case of market gardening, there was no diagnosis of the difference between a good and a bad year, which explains why the income is practically the same, given that the other types of production whose incomes vary between years are of only marginal importance in the overall income of this type of farmer.

38
TABLE 12
Poverty levels of farmers cultivating in the irrigation scheme, Sélingué, Bagré and Anambé
(a) All farmers in study area including some not farming in the irrigation scheme (b) Situation in a good year
SitePercentage of farmers
Above poverty threshold
At or around poverty threshold
Below poverty threshold
Bagré 22% 33% 45%
Sélingué (a) 26.5% 73.5%
Anambé (a) ; (b) 32% 25% 44%
Farmers without animal traction
30%
Farmers of rain-fed cereals
13% Farmers of rain-fed
and irrigated cereals 31%
Diversified farmers
15%
Farmers specialising in rain-fed crops 5%
Others 6%
Farmers above poverty threshold
Farmers below poverty threshold
GRAPH 15
Different types of farmers at Sélingué
This high proportion of farmers who are below the poverty threshold invites questions, considering that one of the main objectives of an IAS is to contribute to poverty reduction. And how is it that some farmers obtain a satisfactory level of income and others do not?

39
4.3 MAIN CAUSES OF PERSISTENT POVERTY IN IRRIGATED AGRICULTURE SCHEMES
4.3.1 Irrigated agriculture schemes contribute in a major way to the agricultural incomes of farmers… IAS make significant contributions to farmer incomes. At Bagré, where access to rain-fed farm land is restricted (Graph 16), IAS are responsible for between 50% and 90% of agricultural income. At Sélingué, excluding farmers who have no access to the irrigation scheme, this proportion is lower (35% to 60%) but remains very significant (Table 13).
0
1
2
3
4
5
6
7
8
9
Diversified Farmer rain-fed + rice > 1 ha
Farmer rain-fed + rice < 1 ha
Rice farmer irrigationscheme > 1 ha
Rice farmer irrigation
Maize Rice Peanuts/cowpeas Millet/sorghum Other
13% 33% 3% 45% 7%
scheme < 1 ha
GRAPH 16
Importance of the area (in hectares) of rain-fed crops for different types of farmers, Bagré
TABLE 13
Percentage of agricultural GVA of family farms derived from the irrigation scheme, Sélingué, Bagré and Anambé
* Good year
AHAContribution of irrigation scheme to added value of farms
All types Types farming in scheme
Bagré 47% to 91% 47% to 91%
Sélingué 0% to 63% 35% to 63%
Anambé * 0% to 83% 6% to 83%
Thus, some farmers depend much more than others on incomes from the irrigation scheme. At Sélingué, this dependency applies to farmers without their own animal traction and farmers who specialise in irrigated crops. Both of these categories are mainly composed of migrants who have limited access to non-irrigated land (Graph 17). At Bagré, there is also a strong dependency among migrants, in particular those from the right bank who previously had no access to rain-fed farmland. At Anambé there is a wide variation, but irrigated rice farming is critically important only for a small group of specialised farmers. With that exception, it contributes less than a quarter of total farmer incomes.

40
Rice cultivation represents practically all the income from the IAS at Bagré. At Sélingué, the irrigation scheme includes plots for market gardening and also plots where rice farming is not practicable. So, rice represents 70 to 100% of the incomes from the irrigation scheme, depending on the type of farmer.
GRAPH 17
Relative contribution of different kinds of production to agricultural incomes at Bagré and Sélingué by farmer type
0%
10%
20%
30%
40%
50%
60%
70%
80%
90%
100%
Diversified Farmer rain-fed + rice > 1 ha
Farmer rain-fed + rice 1 ha
Rice farmer irrigation scheme
> 1 ha
Rice farmer irrigation scheme
< 1 ha
Net
val
ue
add
ed in
FC
FA/p
erso
n
Irrigation scheme rice Rain-fed crops Market gardening Livestock
0%
10%
20%
30%
40%
50%
60%
70%
80%
90%
100%
Farmer without own animal traction
Farmer specialising in irrigated
crops
Farmer of rain-fed cereals
Farmer of rain-fed and
irrigated cereals
Diversified farmer
Net
val
ue
add
ed, %
Irrigation scheme crops Rain-fed crops Market gardening Livestock
4.3.2 … but the areas allocated are insufficientAccess to developed land is clearly a key factor in explaining economic performance, but the total amount of land cultivated has to be sufficient.
The area needed to meet the annual needs of a family that makes its living solely from irrigated rice may be defined theoretically on the basis of the costs of production and the average yield, as measured by the research study (see the Bagré example in Box 10).
a)
b)

41
BOX 10
Theoretical estimate of developed land holding required to reach the poverty threshold at BagréTaking the situation of a 10-person family at Bagré, about 1.2 ha would be required for the family to meet its food needs (an annual income of 620,000 FCFA) and 2.2 ha for it to exceed the poverty threshold (1,230,000 FCFA annual income – see Graph 18), on the basis of an average yield of 4.4t/ha/season and a GVA of 320,000 FCFA/ha/season. Taking depreciation of equipment into account, the areas allocated, of about 1 ha per farmer, enable about 500,000 FCFA to be generated, and are therefore insufficient even for the food needs of a family of 10.
-400000
-200000
0
200000
400000
600000
800000
1000000
1200000
1400000
1600000
0 0.5 1 1.5 2 2.5
An
nu
al in
com
e fr
om
ric
e fa
rmin
g in
FC
FAo
n t
he
bas
is o
f tw
o c
amp
aig
ns
per
yea
r
Area of rice cultivated, in ha
Food security threshold: 620,000 FCFA for a family of ten
Poverty threshold: 1,230,000 for a family of ten
GRAPH 18 Defining the area of irrigated rice needed to meet the annual needs of a family at Bagré
The areas cultivated by the different types of farmers can be compared with the areas required to meet the poverty threshold. Graph 19 shows that only two types of farmers reach this level on the basis of the areas they cultivate in the irrigation scheme. In reality, the initial limited land holding can be increased through (illegal) renting of additional plots.
0.00
0.50
1.00
1.50
2.00
2.50
3.00
3.50
Are
as o
f ri
ce c
ult
ivat
ed in
ha
Initial allocation Loan Rent Reserve area
Diversified Farmer rain-fed + rice > 1 ha
Farmer rain-fed + rice < 1 ha
Rice farmer irrigationscheme > 1 ha
Rice farmer irrigation scheme < 1 ha
Area of rice needed to reach poverty threshold
Area of rice needed to reach food security threshold
GRAPH 19 Average areas of irrigated rice, modes of access and areas needed to reach poverty and food security thresholds at Bagré (10-person families)
NB: the reserve areas are areas sited inside the irrigation scheme but not developed for rice farming
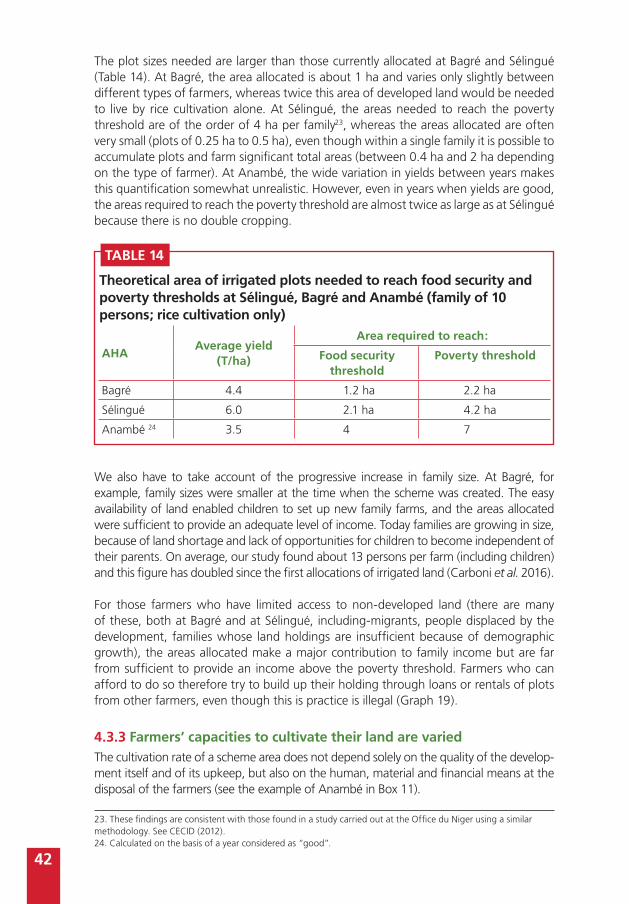
42
The plot sizes needed are larger than those currently allocated at Bagré and Sélingué (Table 14). At Bagré, the area allocated is about 1 ha and varies only slightly between different types of farmers, whereas twice this area of developed land would be needed to live by rice cultivation alone. At Sélingué, the areas needed to reach the poverty threshold are of the order of 4 ha per family23, whereas the areas allocated are often very small (plots of 0.25 ha to 0.5 ha), even though within a single family it is possible to accumulate plots and farm significant total areas (between 0.4 ha and 2 ha depending on the type of farmer). At Anambé, the wide variation in yields between years makes this quantification somewhat unrealistic. However, even in years when yields are good, the areas required to reach the poverty threshold are almost twice as large as at Sélingué because there is no double cropping.
23. These findings are consistent with those found in a study carried out at the Office du Niger using a similar methodology. See CECID (2012). 24. Calculated on the basis of a year considered as “good”.
TABLE 14
Theoretical area of irrigated plots needed to reach food security and poverty thresholds at Sélingué, Bagré and Anambé (family of 10 persons; rice cultivation only)
AHAAverage yield
(T/ha)
Area required to reach:
Food security threshold
Poverty threshold
Bagré 4.4 1.2 ha 2.2 ha
Sélingué 6.0 2.1 ha 4.2 ha
Anambé 24 3.5 4 7
We also have to take account of the progressive increase in family size. At Bagré, for example, family sizes were smaller at the time when the scheme was created. The easy availability of land enabled children to set up new family farms, and the areas allocated were sufficient to provide an adequate level of income. Today families are growing in size, because of land shortage and lack of opportunities for children to become independent of their parents. On average, our study found about 13 persons per farm (including children) and this figure has doubled since the first allocations of irrigated land (Carboni et al. 2016).
For those farmers who have limited access to non-developed land (there are many of these, both at Bagré and at Sélingué, including-migrants, people displaced by the development, families whose land holdings are insufficient because of demographic growth), the areas allocated make a major contribution to family income but are far from sufficient to provide an income above the poverty threshold. Farmers who can afford to do so therefore try to build up their holding through loans or rentals of plots from other farmers, even though this is practice is illegal (Graph 19).
4.3.3 Farmers’ capacities to cultivate their land are variedThe cultivation rate of a scheme area does not depend solely on the quality of the develop-ment itself and of its upkeep, but also on the human, material and financial means at the disposal of the farmers (see the example of Anambé in Box 11).

43
BOX 11
Difficulties in cultivating developed land at Anambé In 2016, out of about 5,000 ha of developed land in the Anambé basin, 3,646 ha or 73% were considered cultivable, but only 1,855 ha were in fact cultivated in the rainy season, or barely 37% of the developed area. The constraints imposed by the current state of the IAS, involving technical difficulties in water management and control, are partly responsible for this low rate of farming, and particularly the lack of dry season irrigation. But the small size of the area cultivated during the wet season, when rainfall enables rice to be farmed without using irrigation, is also due to causes other than the degraded state of the IAS:n High production costs and difficulties in accessing farming credit to meet them
– delays in advancing credit, withdrawal of the National Agricultural Credit Bankof Senegal (Caisse nationale de crédit agricole du Sénégal, CNCAS) because ofnon-reimbursement;
n Lack of availability of the tractors and harvesting and threshing machinery neededfor land preparation and harvest (insufficient and poorly managed equipment);
n Agronomic risks (rainfall in the wet season, graminivorous birds in the dry season),and technical problems (pump breakdowns in the dry season) or economicdifficulties (marketing problems) affecting rice cultivation and marketing;
n Difficulties in managing the agricultural calendar so as to produce two cropsannually: delays in allocating plots, problems of the load bearing capacity ofthe soil to enable machinery to function due to rainfall, delays in advancing orrepayment of credit;
n Poor levels of training and information for farmers and their organisations, especiallyafter the withdrawal of SODAGRI from all productive activities.
Sources: CACG et al. 2016 and AfDB 2000
Capacity to meet the costs of productionIrrigated rice farming is highly demanding in terms of financial capital. “Improved” seeds introduced by the “Green Revolution” require the use of high doses of inputs to produce good results – fertilisers, herbicides etc. To this must be added the payment of charges for water distribution (pumping, upkeep and management of infrastruc-ture), and the cost of services for farmers who do not possess all the machinery and equipment needed (for soil preparation, rice threshing, transport), plus the costs of day labour at times of peak labour demand such as transplanting and harvest (Bazin 2016).
Table 15 shows that the costs of a rice farming season are very high (over 300,000 FCFA) and are equivalent or even superior to the average income derived from the previous season (Average added value in Table 15 below). This means that in order to finance the cost of a new season out of the profits of the preceding one a farmer would have to invest all the money earned. Farmers pay part of the costs in kind (for harvest and threshing services), so that this does not need to be pre-financed (this is the amount labelled “Cost payable at harvest” in Table 15 below). It is a different matter for inputs such as fertilisers, herbicides and pesticides, as well as for most services such as trans-planting, or – for those who do not have enough equipment of their own - ploughing and harrowing, that have to be financed by farmers. The costs of pre-financing inputs and services is over 200,000 FCFA per season at each of the three sites.

44
TABLE 15
Average added value and cost of production per season at Sélingué, Bagré and Anambé, in FCFA/ha
Site Mean added value
Mean cost Costs payable at harvest
Costs to be pre-financed
Bagré* 323 000 324 000 66 000 258 000
Sélingué* 278 000 382 000 155 000 227 000
Anambé** 103 000 230 000 0 230 000
NB The mean added value per season is the difference between receipts from and costs of production. It is roughly the same as the income earned by the farmer from one season * Mean of wet season and dry season** Wet season only
But an average cost may mask major variations, which are mainly due to the availability of labour and equipment as well as to the amounts of inputs used. Graph 20 shows that at Bagré, the costs of production may vary from 200,000 to 450,000 FCFA, and that services are the budget item which varies the most. Farmers who have their own equipment and who have access to a large amount of family labour have lower costs, while those who have to resort to hiring in services for many parts of the technical cycle (labour, harrowing, transplanting, harvesting and threshing…) have higher costs. Pre-financing needs are particularly high for farmers who do not have their own animal traction for soil preparation, and for those whose family labour force is limited or occupied with other activities (for example, competing rain-fed crops during the wet season, or non-agricultural activities). At Anambé, the entire cost of production has to be pre-financed, because harvesting and threshing are done by machines and cannot be paid for in kind in sacks of rice (unlike what happens in the other countries).
It is possible for an individual farmer who has sufficient (and sufficiently diversified) sources of income from outside rice cultivation to finance the farming season. Livestock play a particularly important role as a source of savings which can be mobilised when the farming season starts. Non-agricultural incomes (from trading, or remittances from migrants) or earnings from providing agricultural services to others may also play a part in financing irrigated rice farming. These kinds of incomes are extremely variable from one type of farmer to another. But it is clearly apparent that the types of farmers who have the highest agricultural incomes are also those who have the highest non-agricul-tural incomes.
There is therefore a wide heterogeneity between different types of farmers, in terms of the costs of production and the capacity to pre-finance rice farming seasons from their own resources. Farmers who have an agricultural income above the poverty threshold clearly have more freedom of manoeuvre in financing a rice farming season in the irrigation scheme than those who have to devote their financial resources to meeting the basic needs of their family.
Mechanisms for accessing farm credit vary between the regions studied here, depending on the policies governing the securing of credit, and the involvement of SAGIs and farmer organisations. In any case, obtaining individual credit from financial institutions depends on the farmer’s capacity to provide collateral guarantees and to fulfil the

45
172900 132000
257000
151500
51000
179000
323100
12500
12500
12500
0
50000
100000
150000
200000
250000
300000
350000
400000
450000
500000
GVA/ha Average cost Min cost Max cost Co
st o
f p
rod
uct
ion
per
hec
tare
an
d p
er s
easo
n (
FCFA
/ha)
Cost of products Cost of services Charges and dues
GRAPH 20
GVA and costs of production per hectare for irrigated rice farming at Bagré
requirements of the banks (personal contribution, costs of credit). This kind of credit appears to be used mainly by farmers who are already relatively well off financially but who have cash flow difficulties. This is particularly the case for farmers who have incomes from sources other than irrigated rice farming, which they can mobilise when the time comes to repay the debt.
The majority of farmers do not have the means to finance a farming season using their own resources, and so the lack of farm credit adapted to their situation leads them to reduce the area they cultivate, or to use smaller quantities of inputs, often to the detriment of the yield. What is more, it is not unusual for difficulties in obtaining the financial and other means required for a rice farming season to result in delays in starting to plant the crop, another cause of inferior yields.
Severely inadequate access to equipment There is a low rate of access to animal and mechanical traction; between 35% and 58% of farmers are equipped with animal traction, and fewer than 2% with mechan-ical traction (tractors or motorised cultivators). There is a high rate of recourse to hiring of services for soil preparation.
n At Bagré, about two thirds of farmers have to hire ploughing and harrowingservices on their rice fields, for part or all of the area cultivated, generally becausethe family workforce or equipment is insufficient or gives poorer results. Theseservices are provided by manual workers (30%), plough oxen (25%) and tractors orcultivators (45%)25. The persistently high proportions of manual labour are a sign ofthe difficulty in obtaining the use of animal or mechanical traction, given that thecost is similar whatever form of power is used.
25. The scale of mechanical ploughing compared to the small numbers of farmers who own plough equipment is explained bythe fact that a rototiller or a tractor can plough large areas (and need to do so to pay for themselves) but above all by the fact that the service is mainly offered by private entrepreneurs rather than by farmers

46
n At Anambé, almost all ploughing is done mechanically, because of the nature of the soils, which are high in clay content and difficult to cultivate over large areas using animal traction, and because of the competition from rain-fed crops in the wet season. Only a few farmers have the means to own equipment and so to avoid the danger of not being able to plough in a timely way. The rest are dependent on equipment for hire through the Committee for the Management of Agricultural Equipment of the Anambé basin (Comité de gestion du matériel agricole du bassin de l’Anambé, COGEMA) or the Federation of Farmers of the Anambé Basin (Fédération des producteurs du bassin de l’Anambé, FEPROBA). But about 20 medium-powered tractors would be needed to plough the 5,000 ha of the scheme area, and the COGEMA has only 2 tractors in good mechanical condition. Furthermore, a few days of rain are enough to make it impossible for tractors or harvesters to go into the fields. The inadequacy of equipment therefore heightens climatic risk and reduces farmers’ ability to keep to the farming calendar.
n At Sélingué, where the percentage of those with animal traction is the highest, at 58%, many farmers have animal traction acquired thanks to support for cotton farming in the 1980s and 1990s. But a high proportion still have to hire services for ploughing (49%), and particularly for harrowing (75%). The provision of equipment is still inadequate, especially in the rainy season, despite the recent introduction of rototillers by the ODRS. The distribution of equipment among the different types of farmers, shown in Graph 21, is very uneven. Farmers without animal traction are the worst equipped, while the other types of producers have a bare average of 2 pairs of oxen per farmer, which enables them to manage the constraints of rain-fed and irrigated crops somewhat better. Only diversified farmers own 3 full sets of ox traction equipment. Some farmers who specialise in irrigated crops also own mechanical cultivators, which they use to make money by providing services to others. Their rate of equipment with ox traction is slightly lower.
In a context of limited availability of mechanised farming services, it is an advantage to have one’s own equipment so that critical stages such as ploughing and flooding can be completed in a timely and careful way, and also to be in a position to carry out services under contract to others. The result is better timing of farming operations, higher yields and less difficulty in making a second cropping cycle follow on.
n It is difficult for farmers to get access to ownership of a rototiller (or still more a tractor), given the cost of the investment (3 million FCFA for a rototiller). In addition, the areas cultivated per family are small (with the exception of some farmers at Anambé and Sélingué), so that making such an investment productive implies using the machine to do work for other farmers, and this requires a good level of organi-sation in terms of upkeep and maintenance of the equipment. This is often a difficult challenge given the absence of spare parts on the local market.
TABLE 16
Equipment rates at Sélingué, Bagré and Anambé
SitePercentage of farmers using equipment
animal traction mechanical traction
Bagré 50% 2%
Sélingué 58% 2%
Anambé 35% 1%

47
n Ownership of animal traction and equipment is less onerous financially (about600,000 FCFA), although it remains difficult for most farmers to access this levelof investment without credit programmes or specific subsidies. But the investmentpays for itself in economic terms even on small farm areas, because the extra costof depreciation and upkeep of animal traction equipment (about 50,000 FCFA peryear) is balanced by lower expenditure on buying ploughing and harrowing services(about 50,000 FCFA per season). Some farmers also hire out their animals to perform these services once they have finished cultivating their own fields.
The scarce factor is the initial financial resource needed to acquire animal traction equipment. Farmers who struggle to meet their family needs and finance their rice-farming season do not have access to these kinds of sums, and those without collateral guarantees find it hard to get equipment credit.
0
0.5
1
1.5
2
2.5
3
3.5
4
Farmer without own animal traction
Farmers specialising in irrigated crops
Farmer of rain-fed cereals
Farmer of rain-fed and irrigated cereals
Diversified farmer
Nu
mb
er o
f it
ems
of
equ
ipm
ent
per
far
mer
Rototiller Pair of oxen Plough Motor pump
GRAPH 21
Ownership of equipment by different types of farmer, Sélingué
4.4 CONSEQUENCES OF PERSISTENT POVERTY IN IRRIGATED AGRICULTURE SCHEMES The negative consequences of persistently high rates of poverty in the IAS appear at many levels: firstly, in their effects on the achievement of national poverty reduction policies objectives (for which the IAS are supposed to be one of the key strategies), and secondly in terms of the objectives assigned to the IAS themselves, such as local development, and contribution to national food security. Finally, there are the risks that poverty implies for the sustainability of the investments themselves.
4.4.1 Poverty and the performance of the development projectGroups of farmers whose total incomes are below the poverty threshold devote all their resources to meeting family needs as a priority, and so have little cash to invest in their productive asset base. This has consequences for the agronomic performance of their systems of production.

48
0
1
2
3
4
5
6
7
8
0 2 4 6 8 10 12
Quantity of chemical fertiliser used (NPK + urea) in sacks/ha
Yie
lds
in T
/ha
and
per
sea
son
GRAPH 22
Impact of chemical fertiliser on irrigated rice yields, Bagré
n Difficulties in financing the farming season translate into lower rates of cultivation (such as at Anambé) or lower use of inputs (use of own seeds rather than certified seeds, reduced use of fertiliser etc.), which have an impact on yields (Graph 22).
n In the absence of public policies aimed at encouraging investment, farmers below the poverty threshold have more difficulty in getting access to equipment. They also find it more difficult to access soil preparation services. As a consequence, they struggle to keep up with the agricultural calendar. Furthermore, having one’s own equipment makes it possible to ensure that the soil preparation work is done properly, which is essential for good water management and weed control.
The agronomic and economic results of farmers below the poverty threshold are therefore less good (Figure 4): given their numerical importance, this has obvious impacts on the performance of the irrigation scheme as a whole.
4.4.2 Poverty and contribution to national food security Farmers living in poverty devote the main part of their production to ensuring their own food security (on-farm consumption) and to paying part of the costs of rice production (through payments in kind). The proportion actually marketed is therefore relatively low, unlike farmers above the poverty threshold who sell a large proportion of their produc-tion and so contribute to national food security objectives (Table 17).
The more poor farmers there are in an irrigation scheme, the lower the proportion of production entering the market. This is of course contrary to the stated objective concerning the part irrigated farming should play in meeting national food needs outside the immediate area of production.

49
Yield of rice (sacks/ha): 60 Gross value added of rice (FCFA/ha): 280,000
Yield of rice (sacks/ha): 63 Gross value added of rice(FCFA/ha): 380.000
Specialised
Diversified
Yield of rice (sacks/ha): 54 Gross value added of rice(FCFA/ha): 140.000
Without animal traction Ag
ricu
ltu
ral i
nco
me
per
per
son
Yield of rice (sacks/ha): 53 Gross value added of rice(FCFA/ha): 160.000
Traditionally equipped
Poverty threshold
FIGURE 4
Rice harvest performance for different types of farmers at Sélingué
TABLE 17
Economic situation, annual rice production and share of produce sold, Sélingué
Type of farmer Economic Situation Annual production in the irrigation scheme (in tonnes)
Share of produce sold (%)
Farmer without own animal traction
Below poverty threshold 2.6 6%
Farmer of rain-fed and irrigated cereals
Below poverty threshold 5.0 30%
Farmer specialising in irrigated crops
Above poverty threshold 12.5 49%
Diversified farmer Above poverty threshold 13.3 42%
4.4.3 Poverty and development of income generating activitiesFarmers above the poverty threshold are able to invest in and develop their agricultural production, but also to invest in non-agricultural activities to generate income, which complements their income from farming and contributes to funding activities such as rice farming. In a context of sustained growth in the active rural population, but limited possibilities for agricultural development – the “closing of the agricultural expansion frontier”26, and low levels of investment in former agricultural areas – it is clear that the agricultural sector alone will not be able to absorb all the labour entering the market. Ensuring that farms generate sufficient incomes to be able to invest is therefore a vital challenge, not just for agricultural development but for rural development more widely.
26. In most countries, there used to be agricultural land which was not cultivated, to which people from densely populatedregions could migrate to find work or to settle. Over time, uncultivated land has become increasingly rare, limiting the possibilities of moving to find land further away (closure of the agricultural frontier and the end of the pioneer advance).

50
TABLE 18
Relative importance of fees and charges in terms of production costs and annual incomes for different types of farmers, Sélingué
Types of farmers GVA/ha/year
Cost/ha/year
Amount Current dues%GVA % Cost
Farmer without own animal traction
309 400 810 600 70 000 23% 9%
Farmer specialising in irrigated crops
694 500 809 500 70 000 10% 9%
Farmer of rain-fed and irrigated cereals
427 880 759 320 70 000 16% 9%
Diversified farmer 546 600 773 400 70 000 13% 9%
TABLE 19
Impact of rise in water fees on farmer incomes, Bagré, Anambé and SélinguéSite Current fee Proposed fee *
Amount %GVA % Cost Amount %GVA % Cost
Bagré 25 000 4 % 4 % 113 000 20 % 15 %
Anambé ** 0 0 % 0 % 83 000 80 % 25 %
Sélingué 70 000 13 % 9 % n/d n/d n/d
* Sources: Bagrépôle (2013) and CACG et al. (2016)** Wet season only
4.4.4 Poverty and upkeep of development projectsFinally, the presence in an irrigation scheme of a large number of farmers who are below the poverty threshold results in difficulties in collecting a level of fees and charges that is adequate to cover the entire O and M cost of the scheme. In other words, if farmers are in poverty, as the economic returns are insufficient to support their families adequately, their capacity to pay will be reduced, and the sharing of O and M costs between government and farmers will weigh more heavily on the government side
Table 18 shows that for the same cost in fees, the impact of rice farming on incomes differs widely depending on the type of farmer, from 10% of income for farmers with the best economic outcomes to almost a quarter of income for farmers in poverty. At Bagré, the final point of the increases outlined in the study of water charges (Bagrépôle 2013) is expected to amount to an average cost representing almost 20% of rice farming income, compared with only about 4% today (Table 19). At Anambé, the proposed water fees do not appear to be affordable, given the current outputs of rice farming.
The high levels of poverty found in the irrigation schemes we have studied, as well as the seriousness of their consequences, should lead politicians to rethink the way in which IAS are designed and managed, so as to attain a minimum level of income for all the farmers involved. Some ways of doing this are set out in section 5.

51
5
RETHINKING IRRIGATION SCHEMES TO REDUCE POVERTY AND CONTRIBUTE TO NATIONAL FOOD SECURITY5.1 ESTABLISHING ANTI-POVERTY STRATEGIES IN EXISTING PROJECTSPersistent poverty in the irrigation schemes undermines their capacity to achieve the main aims of public policy for irrigated agriculture, namely: 1) combating poverty; 2) contributing to national food sovereignty; 3) sustainability of the schemes and recovery of management and maintenance costs. For governments this lack of success means that these costly development projects are still a major financial burden, on top of the initial investment and repayment of loans, because government has to contribute to the operation of the SAGI, to the costs of maintenance and rehabilitation of the projects and, in some cases, to subsidies granted to farmers27. The fact that large numbers of farmers are still living in poverty in the existing IAS has to be recognised and comprehended, if they are to reach the levels of development which governments aspired to when they made the decision to invest. What possibilities are there for combating poverty in the IAS?
There is a range of different opportunities (which are not mutually exclusive) to increase the incomes of poor farmers (see Box 12): 1) increase the area they farm in the irrigation scheme; 2) improve rice production, to increase income per hectare; 3) diversify crop production in the irrigation scheme, focusing on per-hectare highvalue-added crops such as fruit and vegetables; 4) improve incomes from sourcesoutside the irrigation scheme, with an emphasis on crop and livestock systems whichcomplement irrigated farming in terms of the management of farm equipment, soilfertility, cash flow and labour requirements. The conditions and constraints shapingthese options are discussed in the following four sections.
27. At Bagré and Sélingué, the price of fertiliser used for rice farming is partly government-subsidised.

52
BOX 12
Theoretical model of improved incomes from rice production in existing irrigation schemes Imagine a rice farmer with an area S1, providing an income R1, insufficient to exceed the poverty threshold (Figure 5). There are two ways to change things so as to raise his income above the threshold:n A: The farmer changes his production techniques to increase yield or lower the cost
of production per hectare; income per hectare rises and total income moves from R1to R3.
n B: The farmer increases the area under rice cultivation from S1 to S2. Income perhectare remains the same but total income rises from R1 to R2.
Area cultivated
Poverty threshold
B
S1 S2
R1
R3
R2
Inco
me
fro
m r
ice
pro
du
ctio
n
A
5.1.1 Easier and more secure access to improved land for poor farmers The findings of our farming systems studies show that the size of the plot plays an important part in the economic output of the farm. Farmers who have very small holdings of irrigated land have lower incomes than the minimum required to enable a family to meet all its needs, unless they also have some access to non-irrigated land. This is especially the case for migrant farmers, or locally born farmers who have lost their land to the building of a dam and IAS.
Poor farmers whose income depends essentially on the IAS are caught in a poverty trap when the areas allocated to them are insufficient, as is the case at Sélingué for farmers without their own animal traction. These farmers are cultivating less than 0.5 ha on average in the irrigation scheme and lack the means to fully work their plot (Figure 6).
To escape from this situation, farmers need to be able to cultivate a larger area in the irrigation scheme (Figure 7).
FIGURE 5 Theoretical model of increasing income from riceproduction in existing irrigation schemes

53
Limited land
Low income
Reduced material and financial means
Poor performance
No new allocations in the irrigation scheme
FIGURE 6
Poverty trap for farmers without animal traction, Sélingué
Ric
e p
rod
uct
ion
inco
mes
Areacultivated
Poverty threshold
S1 S2
R1
R2
B
FIGURE 7
Raising rice production incomes by increasing the cultivated area
Allocating larger plots to poor farmers The SAGI often prefer to allocate available plots to farmers who do not need them to earn a sufficient income, but who have a proven capacity to cultivate improved land, rather than to farmers in poverty. This strategy reinforces the polarisation of farmers and restricts the overall output of the irrigation scheme. It should be reversed, to target farmers living in poverty when allocating new plots, on condition that they are in a position to farm them (or that they are supported specifically to be able to do so).
In the older developments, the possibilities for increasing the areas farmed by the poorest farmers are limited to the relatively small number of plots which are re-allocated annually when a farmer moves away, or when a plot is withdrawn because of failure to respect the conditions of the contract. Except at Anambé, where the rate of cultivation is low, the demand for plots is higher than the level of supply under the control of the SAGI.

54
This is a severe limitation on the potential of the strategy to reduce poverty by allo-cating larger areas, except in cases where new land is developed under new investment programmes, as is currently the case at Sélingué and Bagré28.
A number of mechanisms for allocating plots can be envisaged:
n At Sélingué, it would be possible for some farmers to release their plots in the scheme in exchange for allocations in a new development area; this would allow the plots that became free to be re-allocated to farmers who need to increase their areas in the existing scheme;
n At Bagré, the new developments could enable young farmers, from families who hold plots in older developed areas, to be settled on rice farming land, thus reducing pressure on land in the older schemes and installing farmers who are already experi-enced in irrigated rice farming.
Giving security to holders of developed plots Farmers who have been allocated plots do not generally have documents establishing their right to cultivate them. At the Sélingué scheme the ODRS regularly notifies farmers of withdrawals of plots, while at Anambé some farmers have different plots allocated in different years by the Communauté Rurale. At Bagré, we found no record of a developed plot being withdrawn, but farmers have lost rain-fed farmland which had been allocated to them and, without documents to confirm their rights, have found themselves in an insecure tenure position, aggravated by the claims of the local population and by the new developments implemented by Bagrépôle.
As well as lacking enforceable documentation, tenure insecurity in the perimeter also rests on contracts linking farmers and the water management authority, which stipulate that farmers must respect a whole series of obligations – with, in return, quite limited rights. Failure to fulfil these can lead rapidly to withdrawal of the plot. At Sélingué, cases have been noted of withdrawal of plots for failure to pay fees for a single campaign. Few farmers have actually signed these contracts or possess a copy of them, and the majority do not even know the main terms (Adamczewski-Hertzog 2016).
This tenure situation has major consequences for the output performance of the scheme. Lack of tenure security reduces farmers’ inclination to invest in their plot (for example to apply lime or organic soil improvement, still less to improve the levelling of the plot). Indeed, it should be recognised that above and beyond the lack of the objective features which could support tenure security (such as formalised rights, transparency in allocation and withdrawal of plots, etc.), it is the perception farmers have of the precariousness of their rights which determines their decisions to invest or not to invest. The poorest farmers, who are likely to have difficulty in paying their fees, or who may find it difficult to farm the whole of their plot, are the most insecure.
Formalising rental of developed land Faced with the difficulty of obtaining allocations of further plots at Bagré and Sélingué, farmers wishing to cultivate larger areas resort to renting plots from those who do not
28. New schemes developed by Bagrépôle with funding from the World Bank and AfDB; extension of schemes at Sélingué and Maninkoura by ODRS with funding from the AfDB. At the same time, the areas actually available to increase access to developed land for farmers who already have allocated land are limited by the mechanisms for compensation of rights holders and by agri-business development policies.

55
have the capacity or the means to work them (see the case of Bagré Box 13 and Graph 19). At present this is completely unofficial, because renting is prohibited in the contrac-tual requirements, which allow only for direct occupancy. This means that only farmers with significant financial means can afford the costs of renting, as well as paying the fees due and buying inputs and services to farm the land they have rented.
Official authorisation of short term plot rental, according to rules agreed between the SAGI and farmer organisations, would result in:
n Encouraging rental of land to local farmers who need to increase their cultivated area,rather than to people who have no links with local villages;
n Facilitating inclusion of rented land in seasonal credit provision;
n Clarifying responsibilities for upkeep of the scheme;
n Guaranteeing optimum cultivation of the scheme;
n Limiting risks of loss of rights for farmers who have temporary difficulties in cultivatingtheir plots.
Rental as proposed here is a mechanism which provides farmers with flexibility, but it does not resolve the problems of the shortage of plots allocated to farmers, especially to the poorest. Furthermore, the low availability of developed land holdings, and the high cost of new development, shows clearly that land allocation policy alone cannot be sufficient to lift farmers out of poverty.
5.1.2 Improving the performance of poor farmersThere are significant opportunities for improving value added per hectare, particularly for the poorest farmers whose agronomic and economic performance is lower than that of farmers above the poverty threshold (see Figure 4 for the Sélingué case).
BOX 13
Renting plots at BagréRental of plots is a phenomenon which has grown (in one village we surveyed, we calculated that 10% of the total area was rented), and which is found throughout the study area. Some farmers let their plot to avoid having it withdrawn for non-cultivation or failure to pay fees. Temporary letting of a plot is a way of limiting the risks of losing access to irrigated land altogether. So, a farmer can use this as a way of coping with a poor harvest which will not cover payments of dues or credit, or with an illness which restricts capacity to farm a plot.
For farmers who rent a plot, this enables them to overcome land constraints and optimise the use of their productive capacity (available labour and equipment, financial capacity to farm bigger areas). Rental of plots therefore offers a certain flexibility in access to irrigated landholdings, which encourages good use of the development, raises overall productivity and facilitates payment of fees. Temporary rental of plots is clearly a farmer strategy. It enables landholding constraints to be eased, and results in better access to plots which their current holders cannot manage to farm properly for farmers who have the means to cultivate them profitably.

56
Ric
e p
rod
uct
ion
inco
mes
Area cultivated
Poverty threshold A
S1
R1
R3
FIGURE 8
Improving rice farming incomes through raising value added per hectare
TABLE 20
Techniques available to improve the performance of irrigated rice farmingTechniques aiming to improve the performance of farmers as a whole
Techniques specifically targeting the poorest farmers
Improving the functioning of the rice market Encouraging local transformation through parboiling
Improving advice on fertiliser application Facilitating seasonal credit
Promoting agricultural advice adapted to different types of farmers
Improving access to equipment
Improving the functioning of rice marketingIrrigation developments have chosen to promote rice as a crop because of its produc-tion potential under intensive irrigation and its adaptation to the type of low lying soils, often high in clay content, within the IAS. Whereas rain-fed crops were, and still are, grown to meet the food needs of families – with only surpluses being sold – the rice cultivated in the IAS is often sold or used to cover part of the costs of its production. Several decades after the development schemes were established, the issue of market outlets for rice production has still not been clearly resolved, following the
Among the technical solutions available to improve rice farming performance in the schemes (Figure 8), some are generic and apply to all farmers, while others are specifi-cally targeted at poorer farmers (Table 20).

57
disengagement of governments from economic functions within the schemes. At Bagré as at Anambé, the lack of outlets is a source of economic vulnerability for farmers and for their capacity to repay seasonal credit (Box 14).
A number of options could enable the price paid to the farmer, and hence incomes, to be improved. Firstly, mechanisms for storage and warrantage have the potential to enable the differentials between prices at harvest time and in later months to be turned to advantage. Another possibility is improvement in the overall quality of the rice, which can be undertaken only at interprofessional scale because it covers parboiling (carried out by farmers) to milling (done by mini rice factories), on condition that the added value gained is equitably distributed between farmers and processors.
Finally, the development of parboiling is all the more important because it provides incomes for women, and particularly women from poor households, many of whom practise this activity, and because there is a specific market for this quality of rice. Improving the quality of parboiled rice, its outlets, and the material and financial capac-ities of the parboiling associations, is therefore a priority for improving the commercial network of rice production.
BOX 14
Difficulties in the commercialisation of rice at Bagré and AnambéThe fact that the National Food Security Stock Authority (Société nationale de gestion du stock de sécurité alimentaire, SONAGESS) is the main buyer of rice from Bagré shows that Bagré’s rice production has not yet found its own outlets in the Burkina Faso market in the face of competition from imported rice. Since 2014 the Bagré scheme has been experiencing a structural crisis of commercialisation of its production, linked to lower purchases and delays in payment by SONAGESS. These difficulties in marketing have a major impact on seasonal farm finances. In any system of farm finance, the farmer depends on the quick sale of the production of one season, within a short time frame, to fund the following one. In the short term, working with SONAGESS to reduce payment delays is essential. In the medium term, thought also needs to be given to ways of developing markets for Bagré’s rice, so as not to be so entirely dependent on public food security policy and on government funds.
At Anambé, efforts to sell rice on the internal Senegalese market face the disorganisation of the commercial networks and their lack of competitiveness on the Dakar market, which is 600 km from the IAS. In addition, the market in Dakar requires the rice to be milled, which is not straightforward these days because only one small-scale rice mill remains in operation (the industrial rice mill which was privatised by SODAGRI has closed down, probably because of lack of supply of rice). Until recently, farmers sold their excess rice production as paddy on the market at Diaobé, a commercial cross-road frequented by traders from neighbouring countries (Gambia, Guinea, Guinea Bissau and even Mali and Mauritania). Most of the rice went abroad, in particular to Guinea Conakry. But the demand from neighbouring countries has weakened in recent years, and is not sufficient to absorb all the production. In 2014 part of the production (200 T) was bought by the World Food Programme (WFP). The biggest farmers are trying to re-orient their production towards seeds, so as to benefit from more attractive prices and a guaranteed market.

58
Better management of soil fertilityIn many schemes, fertiliser recommendations are generic, and do not take account of local soil fertility conditions, nor of how they have changed under intensive farming of the land over long periods of time. Soil analyses should be done systematically in the schemes in order to target fertilisation advice, especially in relation to the length of time the different areas have been farmed. Fertiliser doses could then be modified, as could the formulation of artificial fertilisers, provided alternatives are commercially available and affordable.
Regular use of high doses of fertiliser leads to acidification of the soils, which is damaging not just for healthy crop development but also the effectiveness of the fertiliser applied. But there is still no recommendation concerning the use of lime. Trials of lime additives were carried out for the first time in 2016 at Sélingué and seem to have had good results. Systematic use of lime will depend on its availability on the market, its cost price and effectiveness, and the savings it enables farmers to make in mineral fertilisers.
Finally, improved management of organic matter in soil should be a priority, given that this enables cropping performance to be improved and production costs to be limited simultaneously. Dissemination of the use of organic additives which improve soil structure as well as fertility should be planned as part of a complete review of fertility management of rice fields.
Defining and setting up an experimental protocol with farmers, based on soil analyses, would be a way to develop new fertilisation advice (using chemical, organic and lime materials), adapted to the diversity of soil conditions in the scheme and also to the different types of farmers. This protocol should involve plots farmed by the different types of farmers, to make it possible to discuss the constraints on each of them in adopting the recommended fertilisation practices. All these actions could result in increased rice yields, but would certainly also reduce the costs of production, and so improve the economic performance of farms.
Promoting access to soil preparation tools and machinery for farmers lacking all or some equipmentLack of equipment to work the soil is an important factor in maintaining farmers in poverty. Inadequate supply of equipment (whether owned or for hire) is a negative influence on rice system performance, leading to delays in carrying out critical stages for good rice production. It can also compromise the execution of double annual cropping.
Improving farmers’ access to soil preparation and tillage equipment can be done in two ways: either by making it easier for them to buy their own animal traction equipment, or by promoting the development of mechanical services using tractors and cultivators for hire. The advantages of one or the other of these forms of access to equipment depend on the conditions of each IAS, such as the type of soil or the size of the irrigated plot. At Sélingué and Bagré, access to their own animal traction equipment is prefer-able for farmers because this has advantages both agronomically (better saturation making water management easier, and more use of manure as an organic fertiliser) and economically, for those who have over 0.5 ha of rice field. At Anambé, agricultural equipment for soil preparation and harvesting/threshing is scarce and very old, which is a major constraint on the cultivation of the IAS. Here private individuals who have their own equipment only offer services for hire by other farmers once their own plots have been ploughed or harvested; and they do not offer services on credit, which limits

59
the ability of many farmers to access them. The COGEMA is responsible for managing the agricultural equipment provided by SODAGRI or made available by government via different projects, but it still does not have the management capacity needed to carry out effective maintenance of equipment and to provide services within the time frame required for good quality farming operations throughout the IAS.
With no public policy specifically aimed at facilitating development of mechanised farming (see Box 15), some farmers are still working the soil manually (about ¼ of farmers at Bagré). A policy of this kind needs to offer a range of means of access, adapted to the diverse types of farmers. Table 21 sets out the needs of the different types of farmers at Bagré in terms of mechanisation, and the strategies that could be adopted depending on their economic capacities
TABLE 21
Priority needs and access strategies for agricultural equipment by type of farmer, Bagré
Type of farmer Priority needs Strategies for access to equipment
Rice farmer in irrigation scheme ≤ 1 ha
Ox traction equipment set Partial subsidy of equipment cost
Rice farmer in irrigation scheme > 1 ha
Mechanised equipment (cultivators, threshers and mills)
Bank guaranteeLocal access to parts and repairs
Farmer rain-fed + rice ≤ 1 ha
Ox traction equipment set Subsidised creditBank guarantee
Farmer rain-fed + rice > 1 ha
Mechanised equipment (cultivators, threshers and mills)
Bank guaranteeLocal access to parts and repairs
Diversified Irrigation equipment Subsidised creditBank guarantee
Improving access to seasonal farming finance for poor rice farmers Seasonal credit for rice farming must include poor farmers who lack their own means to pre-finance part of the costs of production. The main barriers to access to credit highlighted by farmers at Sélingué are as follows:
n Fear of not being able to repay the credit;
n Financial constraints on receiving credit (personal contribution of 10% of the credit,insurance and commission fees);
n Low levels of economic and social capital preventing them from providing thenecessary guarantees (material guarantees may be replaced by joint surety);
n The cost of the credit itself (24,000 FCFA for a loan of 200,000 FCFA, which is theaverage value of seasonal credit from the microfinance institution Kafo Jiginew).
In the absence of fully functioning public policies, there are a number of solutions to overcome these difficulties. They depend essentially on the organisational capacities of farmers and the support of the SAGI in facilitating dialogue between farmers and financial institutions:

60
BOX 15
Agricultural mechanisation policies in Burkina FasoThe rural development strategy document dating from 2004 states that intensification of agricultural production requires the use of suitable equipment. To this end it proposes to promote the acquisition of equipment to improve farm productivity, using funding mechanisms which bring together subsidies and use of credit, with a regionally based approach to needs (Burkina Faso 2004). The Action Plan on Agricultural Mechanisation (Plan d’action sur la mécanisation agricole, PAMA) of 2002 is still the reference document for the implementation of a mechanisation policy in Burkina Faso. In terms of animal-drawn cultivation, the 2002 action plan forecast an equipment rate of 50% by 2005, representing a 17% increase in national terms (Ministère de l’Agriculture, de l’Hydraulique et des Ressources halieutiques, Burkina Faso 2002). By 2006, the rate of equipment in ploughs and draught animals was still only 40% (Side 2013).
The National Rice Farming Development Strategy (Stratégie nationale de développement du riz, SNDR) of 2011 proposed an increase in mechanisation of rice cultivation via, among other things, the setting up of a government credit programme to facilitate access to equipment for rice farmers and private operators. In concrete terms, this credit programme was to enable the acquisition of equipment, with a particular emphasis on:
n Intensification of mechanised working of the soil, farming operations (levelling, sowing, weeding etc.) and harvest and post-harvest operations etc.;
n Emergence of service providers for soil preparation and post-harvest operations.
At the same time, the document notes that in terms of the subsidies necessary for mechanisation, the needs of the SNDR are not funded by any current project or programme (Burkina Faso 2011, appendix 5).
Activities aimed at developing mechanisation are limited to occasional operations to buy agricultural equipment (tractors and ploughs), without any connection to mechanisation strategies, and, in particular, without precise criteria for selecting beneficiaries. As for animal traction, an operation named “100,000 ploughs” was set up in 2011 by the Ministry of Agriculture, along the same lines as the one previously carried out in 1989 (“30,000 ploughs”). This new equipment (CH9 and CH6 ploughs, 5 and 3 tooth manga hoes, platform and tipper carts and ridgers) is aimed at the poorest farmers, particularly women. The state subsidy of the cost of the equipment is 90% for women and 85% for men. Since 2013, traction animals have also been funded by the programme. The targeting is not clearly defined, apart from the objective of 5% women beneficiaries (Side 2013, p. 65).
Considering the number of farming households needing equipment, estimated in 2006 to be 750,000, it is clear that these operations, which are costly for the state29, are capable of satisfying only a fraction of the needs of farmers without equipment. They would have to be accompanied by credit policies (such as subsidies and bank guarantees) to facilitate the access to equipment for farmers who are integrated into cash crop networks such as irrigated rice and cotton.
29.The 100,000 ploughs operation has a budget of 23 billion FCFA.

61
n Organising farmers to facilitate access to inputs or credit: at Bagré the farmer organ-isation Union des producteurs de riz de Bagré has made an agreement with a bank,the SONAGESS, a rice mill and a fertiliser company so that fertiliser can be suppliedto farmers without the union or the farmers needing to manage money. However,this system depends on smooth running of all the contractual relationships, and inparticular on prompt payment by SONAGESS to the bank so that the credit neededfor the next harvest can be released. Furthermore, this agreement only partiallycovers the farmers’ funding needs (for inputs). At Anambé the farmer organisationsplace requests for credit with the CNCAS and are responsible for collecting repay-ments from their members.
n Use of titles to house plots to serve as credit guarantees; however, this is onlypossible where such documents exist, and there is a risk to families in case of diffi-culties with repayment.
n In Mali, a national agriculture support fund, the Fonds national d’appui à l’agri-culture, created in 2010, is supposed to fund support to agricultural activities, inparticular by guaranteeing loans taken out by farmers and granting interest rebatesto organisations targeted through a collateral funds provision. This mechanismshould facilitate access to credit for poor farmers; however, it is not yet operational,and the mechanisms of coordination with financial institutions are not yet defined.
The problems of fertility management or of access to seasonal farm credit and equipment are not unique or specific to irrigated rice farming, and therefore do not require specific policies to remedy them. But it may be useful to list here a series of proposals for improving performance in irrigated rice farming, given the importance of these measures for the incomes of farmers and the profitability of the irrigation projects, even though the proposals themselves are hardly original. They are discussed here to recall the importance of grassroots agricultural policy for the success of an irrigation project. The forecasts of the feasibility studies often fail to consider the deficiencies of the support structures for agricultural production, and so they base themselves on projections of agronomic and economic outcomes which are beyond the reach of farmers under real production conditions. Estimates of the potential for improving the performance of irrigated rice farming need to be founded on an analysis of the conditions under which the farmers currently working in the irrigation schemes obtain good results.
5.1.3 Diversifying production in the schemeDiversification of production in the irrigation scheme has the advantage of reducing agronomic and economic risk for farmers, in particular for those who have only limited access to rain-fed farmland. In a situation where the market outlet for rice is not assured, such as we find at Anambé and Bagré, diversification also reduces market and credit risks, which generally go together.
A wide range of crops can be grown in the irrigation schemes. At Sélingué, where rice cultivation is not possible everywhere, we find alternatives including maize, okra, bananas, and other fruit and vegetables. Possibilities for diversification depend on the agronomic conditions (the type of soil, the risk of flooding) but also on economic opportunities. Given that availability of developed land is the limiting factor, crops with a high value added per hectare should ideally be preferred. But a number of constraints reduce the real possibilities for diversification:

62
n Technical constraints linked to water management organisation (the water rota) andthe need for homogeneous crops within a single hydraulic sector;
n The need for knowledge and skills in the technical management of these crops or, intheir absence, for appropriate advice;
n Costs of production of these crops, which may be very high;
n Commercialisation facilities (market, transport, conservation and storage).
Area cultivated
C
S1
R1
R3
Rice fa
rming
Sr
Rr
Poverty threshold
Inco
me
fro
m
irri
gat
ion
sch
eme
Mar
ket
gard
enin
g
FIGURE 9
Raising irrigation scheme incomes through diversification of crops
Figure 9 shows the theoretical impact on the income of a farmer who uses part of the developed area for growing market garden crops. This can be done by means of separate plots (as at Sélingué, where some small plots have been developed for market gardening) or by using the plot for rice in the wet season and for market gardening in the dry season. This second option has some advantages, particularly for adapting the water requirements of crops to the amount of water available (with plenty of water in the rainy season but less in the dry season).
At Sélingué, farmers of the “without own animal traction” type, whose agricultural income is below the poverty threshold, cultivate small vegetable plots in the irigation scheme, which make a significant contribution to their incomes (28% of income from the irrigation scheme for 7% of the area, see Table 22 and Graph 23). Development of these areas for market gardening, which maximises the value of the labour available, is a promising path out of poverty for these farmers.
Diversifying production in an irrigation scheme does not mean changing the overall production objective – for example, changing from a scheme intended to grow rice for

63
TABLE 22
Areas cultivated and value added for different types of production in the irrigation scheme, for farmers without their own animal traction, Sélingué
Area (ha) Added value (FCFA)
Rice farming 0.40 123 760
Market gardening 0.03 48 600
Total irrigation scheme 0.43 172 360
Area 93%
Area 7%
Added value 72%
Added value 28%
Rice farming Market gardening
GRAPH 23
Areas cultivated and added value of different types of irrigation scheme production for farmers without their own animal traction, Sélingué
food security to one growing high value-added crops for export. But given the complexity of water management in rice growing areas, diversification has to be thought through from the start of the development, so that the way the water network functions can enable water to be managed for all the different types of crops.
5.1.4 Taking into account the complexity and diversity of production systemsDrawing up a typology of farmers, based on an analysis of the different systems of production in a given region, allows irrigation scheme production to take its place in a wider context which includes both other forms of production (rain-fed crops, livestock, irrigated crops outside the irrigation scheme), and also non-agricultural activities. These forms of production can provide most of the income of some types of farmers, and often have important interactions with irrigated crops – competition for the use of labour and equipment, transfers of organic matter, complementarity in cash flows etc.

64
Livestock raising, for example, plays an important role in production systems which have good global economic results and good performances in rice growing. At Sélingué, it represents between 25% and 35% of the added value produced by agriculture, whatever the type of farmer, with the exception of farmers without animal traction who have practically no livestock. Cattle herding, which is the largest form of livestock farming in the area, also facilitates access to ox traction. Animals provide manure which is an essential element in maintaining the fertility of the cultivated plots, especially for rain-fed maize, but which is also used, more rarely, on irrigated rice. For some farmers, livestock fulfils the role of a savings fund which can be mobilised to finance a rice growing season.
At Bagré, livestock represents a lower proportion of the added value produced by agri-culture, for all types of farmer (between 20 and 25%, except for rice farmers with over 1 ha in the irrigation scheme, for whom the proportion is only 10%). This lower level of importance of livestock is due to land tenure constraints (little access to rain-fed land or to pasture for animals), as well as to limits imposed in the irrigation project area. Unfortunately, public policy continues to consider that a farmer is either an agriculturalist or a livestock farmer, and to separate agricultural and livestock areas30. This is a severe limitation on the possibilities for integrated livestock and crop farming, even though integration would be beneficial for the development of ox traction, and also necessary for proper treatment of the soil for rice growing and for fertilising crops using organic manure.
The same is true of rain-fed crops. Although these are often criticised by the SAGI because of their competition with irrigation scheme crops for access to labour and equipment, they are strongly complementary in economic terms because they provide the basis of family cereal needs and thus allow more of the rice grown to be marketed. At Bagré for example, cereals (especially maize but also lowland rice, sorghum and millet) occupy about 70% of the rain-fed cropping areas. They have an important role to play in family food security, being mostly farm-consumed except for farmers who have large areas of rain-fed crops. 60% of farmers, with an average holding of 1.3 ha of rain-fed land, do not sell their grain, while the 20% of farmers who cultivate an average of 3.8 ha of rain-fed land sell 90% of their production.
Access to rain-fed land is particularly crucial for farmers who have limited areas under rice. At Bagré, for those farming 1 ha or less of irrigated rice (80% of all farmers in the area), rain-fed crops make the difference between farmers who are below the poverty line (pure rice farmers with 1 ha of rice or less) and those who are above the it (farmers of rain-fed crops and rice ≤ 1ha) (see Graph 24).
In addition, the typology of production systems helps us to understand the specific conditions – access to factors of production – which enable some farmers to obtain incomes above the poverty threshold whereas others cannot do so.
As an illustration, Table 23 shows the typology of farmers at Sélingué, and a synthesis of their economic situation and the constraints they face; and Table 24 presents a reflection on the strategies which could be adopted by the different types of farmers depending on their structural constraints, and the conditions in which these strategies could be implemented.
30. In the “zone de concentration” at Bagré, two pastoral areas have been developed upstream of the dam, with Doubégué-Tcherbo covering 7,000 ha on the left bank and Niassa 6,382 ha on the right bank, designed to accommodate Peul herders. The Bagré land tenure framework of 2015 takes this into account and still defines separately agriculturalists who are allocated farm land and livestock herders who benefit from pastoral land. On this subject, see Robert (2010).

65
TABLE 23
Advantages and constraints for different types of family farms, Sélingué
Type of farmer Economic situation of farmers
Constraints Advantages
Farmers without own animal traction
n Caught in apoverty trap.n Productionoriented towardssatisfaction of foodneeds
n Limited and insecureaccess to landn Little equipmentn Difficulties infinancing rice farmingseasonn Little diversificationn Poor irrigated ricefarming performance
n Expertise in marketgardening
Farmers specialising in irrigated crops
n Above povertythresholdn Productionoriented to themarketn Capable of payinghigher fees
n Limited access toundeveloped landn Finance forequipment
nGood access todeveloped landn Seasonal finance forrice farmingn Very good level ofequipmentn Sale of servicesn Very goodperformance inirrigated rice
Farmers of rain-fed cereals
n Below foodsecurity thresholdn Productionoriented tosatisfaction of foodneeds
n No access toschemen No diversificationn Limited rain-fed land
n Equipped withanimal traction
Farmers of rain-fed and irrigated crops
n Reach foodsecurity thresholdbut under povertythresholdn Production aimedat food needs andcommercialisation
n Competition withrain-fed fields in rainyseason for labour andequipmentn Low diversificationn Limited rain-fed landn Poor performance inirrigated rice
n Equipped withanimal tractionn Partial self-financeof rice productionn Knowledge ofirrigated rice farmingn Sales to market
Diversified farmers
n Above povertythresholdn Productionoriented to foodneeds and marketn Capable of payinghigher fees
n Finance forinvestmentsn Availability ofirrigable land
nWide availability oflandn Diversification ofproduction systemsn Very high level ofequipmentn Can finance theirown productionn Good performance inirrigated rice farming

66
0
50000
100000
150000
200000
Farmer of rain-fed +rice > 1 ha
Farmer of rain-fed +rice < 1 ha
Irrigation schemerice farmer < 1 ha
Net
val
ue
add
ed o
f p
rod
uct
ion
an
d n
on
-ag
ricu
ltu
ral i
nco
me,
p
er p
erso
n (
FCFA
)
Scheme rice Rain-fed crops Market garden and fruit Livestock Non-agricultural income
Poverty threshold
Food security threshold
Diversified Irrigation schemerice farmer > 1 ha
GRAPH 24
Contribution of different forms of production and non-agricultural income to total income for different types of farmers, Bagré
TABLE 24
Priority development strategies for different groups of farmers, Sélingué
Type of farmer Priority development strategy Conditions
Farmer without own animal traction
n Development of marketgardening and rice farming in theirrigation schemen Development of small scalelivestock farming
n Access to developed landn Access to animal tractionequipmentn Finance for small scalelivestock and irrigated crops
Farmer specialising in irrigated crops
n Development of rice farming inthe PAn Upstream and downstreaminvestment in rice marketing
n Access to developed landn Financial means for investment(cultivator, threshing machine,mill)
Farmer of rain-fed crops
n Access to irrigated rice farmingn Development of irrigationoutside the irrigation scheme(market gardening and fruit trees)n Development of livestock raising
n Access to developed plotsn Availability of irrigable landoutside the irrigation schemen Animal traction and/orirrigation equipmentn Finance for livestock raising
Farmer of rain-fed and irrigated cereals
n Development of irrigated ricefarmingn Development of irrigationoutside irrigation scheme (marketgardening and fruit trees)n Development of livestock raising
n Access to developed plotsn Availability of irrigable landoutside the schemen Animal traction and/orirrigation equipmentn Finance for livestock raising
Diversified farmer
n Investment in irrigation outsidethe scheme (market gardening,fruit growing)
n Financial means available toinvest

67
Understanding the conditions, particularly the access to land and to the means of produc-tion, which enable some types of farmers to earn a satisfactory income, opens the way to imagining routes out of poverty. Figure 10 presents these routes schematically, with the conditions which would make them possible, based on the following hypotheses: 1) that access to non-irrigated land tenure is a basic given, which public policy does notfind it easy to modify: 2) that there are possibilities for allocating rights to developedland (through implementing new development initiatives); 3) that constraints in termsof credit and access to equipment can be overcome through appropriate public policies.
Area cultivated in the scheme (ha)
Diversified
Specialised
Without animal traction
With equipment rain-fed
With equipment rain-fed + irrigated
Ag
ricu
ltu
ral i
nco
me
Poverty threshold
Sufficient equipmentAccess to seasonal credit
Possibility of irrigation outside developed land – land + equipment
Development of livestock raising
0.5 1.0 1.5 2.0
Access to equipment and seasonal credit
FIGURE 10
Examples of possible routes out of poverty for farmers at Sélingué
5.2 ESTABLISHING VIABLE AND SUCCESSFUL FAMILY FARMS IN NEW DEVELOPMENTS5.2.1 Improve compensation procedures for those affected by the projectCompensation policy and procedures for PAP were relatively undeveloped at the time when the Niandouba/Confluent, Bagré or Sélingué dams were built and when the schemes were developed. Compensation mechanisms for lost land were non-existent, partial or inadequate.
At Niandouba/Confluent in Senegal, the studies underestimated the population that would be displaced, and only one village received compensation; in addition to this, there was no compensation for loss of cultivable land.
At Sélingué in Mali, the affected population was given access to plots of irrigated land, but found it difficult to use it to advantage because of the lack of technical and financial support. Many of the PAP eventually abandoned their plots, or the ODRS withdrew them because of failure to cultivate them, or to pay the water fees.
At Bagré in Burkina Faso, the declaration of public interest notice of 1998 concerning the land in the Bagré project area authorised the state to expropriate the local population,

68
in view of its intention to develop the land. However, to fully exercise its rights over this area, the state would have had to purge all existing formal and informal land rights by compensating the rights holders in the development area, and this was not done during the first phases of the development (Bazin, F., Skinner, J. et Koundouno, J. (dir.) 2011).
National legal frameworks have evolved in the intervening period, as have the proce-dures of the funding partners which finance the IAS. Compensation is currently the norm, but the mechanisms and procedures still have difficulty in taking correctly into account the whole set of rights enjoyed by the people affected (PAP):
n Compensation mechanisms prioritise land owners whether they have formal rightsor not. The other PAP – those who are farming land of which they are not theowners – are mostly neglected, even though loss of access to crop land and of theiruser rights may represent a severe economic risk for them.
n Estimates of incomes to be compensated are based essentially on an inventory ofrain-fed fields, and are limited in their classification of farmers to two categories,owners and users, which fails to account for collective rights or for superimposedrights to the same land. The inventory of fields for compensation also has weaknesses in its agronomic analysis, failing to note fallows, intercropping or under-sowing(Inter-réseaux 2017).
n Livestock is frequently an essential component of the production systems existingbefore a development scheme, because the lowland areas which are suitable forirrigation development are often important livestock pasture areas. Studies ofcompensation have difficulty in proposing appropriate compensation because of alack of method (for the estimate of lost pasture) but also because livestock keepinghas not been properly accounted for in studies preceding the development. Forthese reasons the compensation proposed tends to be limited to infrastructure forvaccination or veterinary medicine and for agro-industrial by-product supply, whichdoes not deal with the losses of pasture.
n The same problem arises with losses of forestry resources. Some compensationstudies estimate the monetary value of the tree stock (solely in terms of the valueof the wood) but not the annual production consumed or sold by the farmers, thuseffectively neglecting the productive character of these resources. The mechanismsfor compensation which have been proposed (for example planting rapid growthtrees for firewood) do not allow for replacing the whole range of services andincomes provided by the forest ecosystem, for example the harvest of shea butter.
n In global terms resources which are managed collectively, such as forests or pasture,are poorly or not at all accounted for, although for the poorest farmers they are animportant element of their incomes.
5.2.2 Allocating developed plots which are sufficiently large for farmers to escape from povertyThe “land for land” approach consists in replacing expropriated land with other land, to compensate for lost rights and to enable an expropriated farmer to recover the assets that can enable him to resume his productive activities and to live at least as well in a new setting. In the case of IAS, the most common solution to land constraints is to allocate plots developed for irrigation in compensation for traditional farmland that has been expropriated. There are two approaches which can be used to calculate the area to be allocated in

69
compensation. Either the production or the income of the plots concerned can be used as a basis. As Table 25 shows, compensation on the basis of income generated takes into account the differences in the costs and outputs of production; this method results in allo-cating respectively 29% (Bagré) and 40% (Sélingué) more developed land than using the production as a basis. This is both more just and more true to the objectives of compensa-tion for lost income31.
TABLE 25
Comparison of compensation ratio based on output and income, Bagré and Sélingué
Bagré Sélingué
Annual output (T/ha/an)
Irrigated rice 8.8 9
Rain-fed crops 1.2 1.3
Ratio of rainfed/irrigated compensation based on output 0.14 0.14
Gross income (in FCFA/ha/year)
Irrigated rice 646 200 555 000
Rain-fed crops 115 546 110 000
Ratio of rain-fed/irrigated compensation based on income 0.18 0.20 ha
NB: the ratio is the area allocated in the scheme to compensate for 1 ha of rain-fed land
31. As well as the quantity of land allocated, the quality is equally essential, since this determines the income the farmer will be able to obtain from it. Plots with lower than average fertility should be larger in area in compensation..
Compensation based on incomes presupposes knowledge of the incomes generated by the different crops. This process of estimation needs to be done for all the crops affected by the plans to re-settle PAP, so as to estimate the monetary compensation due to farmers between the moment when their field is taken and the moment when they receive developed land suitable for production. It also implies having a realistic estimate of the incomes that can be earned on developed fields under the different productive systems that are planned (rice farming or other irrigated systems, see section 2.1 and Box 16 below).
Compensation or development? Land compensations carried out during construction of an IAS may aim to compensate simply the lost means of production, to avoid the impoverishment of the PAP. But they can also be an opportunity to improve the living conditions of local people, in particular of the poorest, or to respond to medium term needs linked to demographic changes.
To achieve this, a resettlement programme should allot a plot of developed land whose size should be calculated not on the basis of the land lost but on the basis of the land needed to escape from poverty (see Figure 11).
This more ambitious aim, using the implementation of the project to combat poverty directly, demands a prior and detailed knowledge of the situation of each family of farmers, and in particular of the land holding remaining to them after the development, and the incomes they can earn from it, so that the optimal allocation of land can be

70
1 ha rain-fed 1.8 ha irrigated
Compensation and poverty reduction
5 ha rain-fed of which 4 ha are affected A
gri
cult
ura
l in
com
e
Poverty threshold
Before development
1 ha rain-fed 1 ha irrigated
Simple compensation
After development
FIGURE 11
Trajectories of a farmer affected by a development with simple compensation or compensation plus poverty reduction (Bagré)
Legend: the farmer who has 5 ha of rain-fed cropland is below the poverty threshold. He loses 4 ha to the development. If the compensation is done on the basis of 1:4 he receives compensation of 1 ha of irrigated land. For him to exceed the poverty threshold, he needs to receive 1.8 ha.
BOX 16
Estimate of income from irrigated rice farming and compensation for land affected by new developments at BagréFor the new developments under way at Bagré, compensation due is based on a census of the PAP. The compensation is systematised in a resettlement action plan which estimates the incomes to be compensated and proposes compensation modalities. These plans have been completed for two schemes under development, the “1,000 ha scheme” and the “1,130 ha scheme”.32
For irrigated rice farming, the master plan for the development and cultivation of the expropriated land at Bagré, which is cited as an appendix to the resettlement plan, gives 1 ha as the minimum area for a family farm on an irrigation scheme to ensure the subsistence of the family. This minimum area is calculated on the basis of a net profit of 1,150,000 FCFA per hectare, and subsistence needs are estimated at 1,100,000 FCFA for a family of 8. These figures under-estimate family sizes33 and over-estimate the incomes from rice farming34.
The figures used in the resettlement plans are more realistic. Incomes from irrigated rice farming are estimated at 660,000 FCFA/ha. On this basis, an average of 1 ha of rain-fed land can be calculated as compensated by 0.19 ha of irrigated land. These estimates are consistent with the data from our study, which suggests a ratio of about 1/5.
32. « Plan de recasement et de réinstallation des populations affectées par l’aménagement de 1 130 ha à Bagré », 2012 actualisé en 2014 ; « Plan d’action de réinstallation des personnes affectées par le projet d’aménagement du périmètre des 1 000 ha de terres irrigables par système gravitaire en rive gauche du Nakambé », 2014. 33. The resettlement plan for the 1,000 ha quotes 4,640 persons and 343 households, or a mean of 13 persons per household. 34. The appendix does not give details of the calculation, particularly the yield hypotheses used.

71
determined. The PAP identification exercise has to take into account information on all the assets which are sources of income, whether affected by the project or not, as well as the functioning of family structures for the cultivation of these collective resources.
Security of tenure on compensation landIt is also important to provide security of their rights to land for farmers who are compensated, by granting them documents guaranteeing, as a minimum, a user right which is transmissible to their descendants. Apart from the type of document, the contents of the contract that links the land user to the SAGI will determine the level of tenure security. At Bagré, Bagrépôle plans to allocate private property titles in the new developments, but the clauses of the contract between family farmers and Bagrépôle are very restrictive, in practice limiting the right to property and so providing only a relative degree of security of tenure. It is important for the contracts 1) to set out a range of proportionate and progressive sanctions where farmers have not met the obligations in the contract and specifications; 2) to specify that withdrawal of the plot should be a last resort and should be subject to recourse on the part of the farmer; 3) that in the case of new occupants who do not have a complete knowledge of irrigatedcrop farming, reasonable time should be given to farmers to learn the appropriate tech-niques before the clauses concerning cultivation and failure to do so are invoked.
Finally, it should not be forgotten that security of tenure is a factor in farm perfor-mance, but that farm performance is also a factor in security of tenure. The conditions under which land is allocated and the conditions of its cultivation are as important in determining the security of tenure of farmers as the legal status of the land allocated to them.
5.2.3 Provide farmers with the equipment needed to cultivate their plotsMaking sure that the PAP have sufficient areas of land is a necessary but not a suffi-cient condition for good levels of incomes and farm performance. Allocating land to farmers who do not have the means to cultivate it properly will not enable them to escape from poverty, nor will it improve the agronomic and economic performance of the irrigation schemes. The farmers settled on the schemes must also have the means to farm them successfully. This can be done by means of seasonal credit, and by provision of agricultural advice which is adapted to their needs, but also and espe-cially by access to animal traction equipment enabling them to prepare the soil and to transport manure and their harvest.
In fact, many PAP do not have sufficient equipment to be able to cultivate the plots they are allocated. This situation, which has existed since the construction of the first irrigation schemes35, is still a current reality. At Bagré, 38% of PAP do not have a pair of oxen, and 35% have no ox plough.36
35. See for example Sissoko (1986), page 38: « The lack of equipment in the area is apparent through the comparison between the various pieces of equipment and the number of concessions, or even the number of staff. » For example, at Kangaré, there were 63 ploughs and 80 oxen for 124 households and 564 active farmers. 36. « Plan d’action de réinstallation des personnes affectées par le projet d’aménagement du périmètre des 1 000 ha de terres irrigables par système gravitaire en rive gauche du Nakambé », 2014.

72
So, it appears to be essential to include funds for equipment and support for these farmers in the budget of the project itself. Given the costs of irrigation schemes (from 7 to 15 MCFA/ha, see Table 337) it seems perverse for a development project of this scale not to plan to invest sums as modest as 500,000 to 600,000 FCFA (an average of 5% of the cost of a hectare of developed land) in equipment to enable the developed land to be properly farmed.
37. For the new developments at Bagré, the costs are estimated to be 13-15 million FCFA, including social infrastructure and payments of compensation to the PAP (Inter-réseaux 2017, page 20).

73
6
CONCLUSIONS6.1 THE PROFITABILITY OF IRRIGATED AGRICULTURE SCHEMESLarge dams and their IAS are costly investments. It is difficult to make a return on them through irrigated agricultural production alone. As the ECOWAS Guidelines for the development of water management infrastructure in West Africa point out “multiple productive use of water management installations, cultivating their full range of compo-nents (for energy, agriculture, fishing etc.), increases the profitability of these projects” (ECOWAS 2012, page 18). Production of electricity makes a major contribution to the economic profitability of multi-purpose dams, as shown by the findings from Sélingué, where electricity generation represents 2/3 of the added value produced, compared with less than 10% for agriculture. Fishing is also often under-estimated, and receives little support to encourage sustainable management of the resource.
However, research has not been able to provide governments with an exhaustive financial statement of profit and loss. The balance sheet is complex to draw up; this is not only because of the multitude of donors assembled to complete the funding of these investments, each with their own specific conditions, but also and especially because of the processes of government debt management which are difficult to reconstruct precisely. In some cases, difficulties in repayment have made it necessary to re-finance part of the debt, while in others rebates on debts have been granted which have the effect of reducing the totals governments have to repay. Finally, electricity companies are sometimes involved in loan reimbursements as part of the financial arrangements by which states make dams available for generating electricity.
As for IAS in the strict sense, excluding the dams, or in other words the whole set of investments to enable plots to be developed and water distributed and drained, studies show that the costs per hectare are very variable and may have an effect on the profitability of the development if they are particularly high. Furthermore, the associated risks are often overlooked, poorly evaluated or poorly controlled, whether these are related to infrastructure construction (delays, cost over-runs, inadequate studies) or scheme cultivation (low farming intensities, shortfalls in yields etc.)

74
One of the important lessons from our analyses is that the baseline studies that inform decisions to invest are often based on ideal scenarios which have little to do with the real conditions in which projects are carried out. Today, with increased popula-tion densities and more and more intensive exploitation of different ecosystems, the environmental and social risks of development are increasingly serious, whereas in the initiatives we analyse here they represented only minor costs. This is the case in particular for compensation of the PAP, which was poorly (or not at all) covered in national legislation up to the 2000s (Bazin et al. 2011). Today, accounting fully for environmental and social impacts of dam and irrigation projects implies significant delays and costs, especially in cases where a low relief topography results in a very large reservoir area, in areas which are already densely populated and heavily exploited (as is the case with lowland areas supporting high value-added crops). At Bagré for example, the new developments now being implemented are taking place in a legal and social context which is very different from that of the earlier projects, and are giving rise to a resurgence of tension around land tenure, especially since the land rights linked to the first developments have not been dealt with, and where those inward migrants who received land allocations have no documentation to provide them with security.
Unfortunately, recent feasibility studies do not appear to display any more realism than those we analysed for our case studies. Evidence of this can be found in the yield hypotheses adopted for the rehabilitation of sectors 2,3 and 5 at Anambé, which are based on an average yield of rice of 5.5 T/ha/season and a cropping intensity of 1.638, those considered for Sélingué under the PRESA-DCI project (raising yields from 4 to 7T/ha/season) (AfDB 2013), or the case of the Projet d’appui au pôle de croissance de Bagré (PAPCB), funded by the AfDB, which forecasts rice yields of 6T/ha (ADF 2015). In all these cases the IRR is estimated to be very high (24%, 23% and 18.6% respectively), but sensitivity tests have not been applied to the yield hypotheses. Estimates of farmer incomes, when these are produced39, are also not realistic. At Bagré, farmer incomes are supposed to be multiplied by 2.3, thanks to the PAPCB, rising from 676,900 FCFA to 1,560,000 FCFA per year, whereas the PRESA-DCI forecasts that yearly incomes per hectare will be multiplied by 3.7 and rise from 213,500 to 794,000 FCFA/ha.
There is also no systematic exposition of technical alternatives, so that the decision is usually reduced to a choice of whether to implement the project or not – a difficult choice considering the high financial stakes involved in HAD projects. The develop-ments analysed here all plan for total water control to enable double cropping. This model implies high investment costs which can only be recouped through intensive agriculture, a difficult technical challenge for local farmers in the short term, especially in the absence of a favourable environment. At Anambé an alternative model of simple development of low lying land using partial water control, implying a technical and economic leap forward which is less demanding for farmers and involves much lower development and management costs, is currently being implemented by SODAGRI.40 At Sélingué, the development work planned downstream of the Fanzan dam runs the risk of being compromised by very high costs of production and pumping (as is already the case in the scheme at Maninkoura), while at the same time small-scale agriculture
38. « Projet de développement agricole en réponse à la crise alimentaire mondiale », SODAGRI, November 2012. 39. There are no income data in the SODAGRI document on the rehabilitation of 3,180 ha. 40. The rehabilitation of sector G costs 8.2 billion FCFA for an area of 1,186 ha, or an estimated cost of 7 million FCFA/ha. Development of lowland areas comes at a cost of about 1.5 million FCFA/ha (CACG et al. 2016).

75
with irrigation using direct pumping from the river whose flow is regulated by the dam is already developing. The most profitable schemes are not necessarily those that enable the biggest production. Alternative solutions can be found through progres-sive intensification of existing systems, minimising impacts and needs for adaptation, rather than through complete transformation.
As for the costs of these development schemes, what is surprising is that despite the scale of the initial investments, states still have to continue to finance long periods of management and upkeep41. This aspect does not figure strongly in the economic analyses, which are based, for lack of real data, on theoretical costs for maintenance and management. But it emerges starkly through observation of the problems of insufficient maintenance, and in the analysis of recovery rates of fees and charges42. Put simply, these schemes do not produce enough wealth to fund all the costs of their management and maintenance, let alone to finance major rehabilitations and extensions. The question of the viability of IAS therefore has to be posed more in terms of the long-term costs for governments vs the economic and social benefits for the country, rather than as a calculation of IRR.
Our production systems studies for their part provide an interesting hypothesis to explain this apparent contradiction. The high level of poverty persisting in the scheme areas is responsible for the fact that farmers are unable to pay fees at a level high enough to finance the costs of O and M. This issue of poverty, its causes and conse-quences, is referred to again in the second section of this conclusion. In addition, we must point to a lack of transparency in the management of fee incomes, and the mediocrity of the service provided, especially in cases where the infrastructure is poorly maintained, all of which inhibit farmers’ willingness to pay.
Difficulty in covering O and M costs is not a feature peculiar to the schemes studied here, nor even specific to West Africa. The literature on cost recovery in irrigation is abundant (Molle and Berkoff 2007), with case studies from many countries. This is a particularly pressing question for food crops, which generate lower incomes than high value-added crops such as market gardening or fruit crops, and so are less likely to enable costs to be recovered. The three schemes studied here are essentially rice-growing projects, which means that the technical options chosen involve a form of production that plays a role in the food security and sovereignty of the country. It would not be unreasonable to imagine that in order to guarantee its food security, a state might decide to subsidise irrigated production by paying a share of the infrastruc-tural O and M costs. In the case of multi-purpose dams, whose profitability is secured by non-agricultural production and especially by electricity generation, part of the overall profits made by the dam could be used to bridge the gap between the O and M costs and the contributory capacities of the farmers. A further justification is that farmers who are allocated developed plots of land are often those who have suffered the greatest loss as a result of the building of the dam (Skinner et al. 2009).
On the other hand, what is often lacking is a clear vision of cost sharing between farmers and the state from the feasibility study stage onwards, so that recurrent costs
41. For example, for Sélingué, the planning contract for 2017-19 between the state, the ODRS and farmers plans to spend 4.5 billion FCFA, about half of which on operations. The operating budget is covered up to 83% by the State budget and only up to 17% by the ODRS’s own revenues (mainly irrigation service fees). 42. See section 3 of this report.

76
can be effectively taken into account in decision making. Instead, many studies simply assume that the whole O and M cost will be paid by the farmers, even when it should be clear that this level of commitment is completely beyond their reach.43 In fact the GWI studies show that these costs are hard to afford for a majority of farmers; they would mean a significant loss of income, when this is already insufficient to free them from poverty and enable them to cover their costs of production.44
Finally, the studies demonstrate the cumulative effect of the concentration of invest-ments on small areas and on a small number of farmers. The initial investments, for example in the construction of the dam, are usually very large, and appear to attract a flow of new public investments aimed at enabling better cultivation of the potential that has been developed. From an economic point of view, these new investments are justified by analyses which take into account only the opportunity cost of a new develop-ment, not the overall profitability of all the investments taken together. Rehabilitations of IAS are financed by states and international funding partners without the causes that have led to deficient maintenance or cultivation being correctly understood.
6.2 THE PERSISTENCE OF POVERTY IN IRRIGATED AGRICULTURE SCHEMES The persistence of poverty and of food insecurity in the IAS is all the more disturbing because improved living standards and nutritional status were among the strategic objectives initially promoted to justify state investment in IAS (see section 1.3). Plot holders are not managing to achieve a sufficient level of output to meet their own consumption needs, cover their direct production costs, fund the renewal and increase of their productive equipment as well as contributing to the costs of maintenance and management of water management infrastructure and equipment. For governments this means at best a lower level of contribution by the schemes to the food sovereignty of the country, but also a greater liability in terms of financing the recurrent costs and the eventual rehabilitation of the schemes.
Poverty and poor performance of irrigation projects seem to be two elements of a vicious circle: poor agronomic performance produces poor economic results, which in turn limit the capacity for production and hence the outputs of succeeding seasons (see Figure 6). In the end it is the low level of the initial provision of the means of production (land, equipment) which is the determining factor in the economic outputs achieved.
Our studies bring to light the crucial role of access to equipment – at Sélingué and Bagré particularly access to animal traction for soil preparation – in the economic and agronomic outputs of farmers. The poor levels of equipment we found in the IAS we studied show that, without targeted public policies, the number of farmers benefiting from a plot of developed land who manage to acquire equipment over the years is very low. Hence the importance, in new development projects, of financing grants of equipment for all those farmers who have none or do not have enough. In view of the costs of irrigation schemes (from 7 to 15 MCFA/ha, not including the compensation of the PAP), these additional investments are relatively modest
43.For example, the study of rehabilitation of sector G at Anambé concludes that the farmer can pay the equivalent of 1 tonne of paddy per season for the fee, when the yield is between 2 and 4 tonnes/ha. 44. The same set of problems is found in other countries. See for example Perret et al. (2013) on the production of irrigated rice in Thailand.

77
– 500,000 to 600,000 FCFA for each animal traction set of equipment – and are not a high order financial commitment.45
The other essential element is access to land and security of tenure. Our studies show that except for the types of farmer with significant access to non-developed land, the size of plot cultivated in the scheme ultimately determines the income. Initial allocations of land are particularly important, in the sense that there are only limited possibilities for supplementary allocations of developed land holdings once the scheme is working.46 Informal arrangements between farmers through loans or rentals, even though these are officially prohibited, remain the only opportunities for extending the cultivated area.
Insufficient allocations of land, in quantity and quality, put farmers into a poverty trap which is difficult to escape from unless they have significant other sources of income. This is often the fate of migrants, who as a rule do not have other active family members outside the scheme, but is also true of PAP who have not been correctly compensated for the production and the rights they have lost.
Governments are often tempted to allocate developed plots of land which are small in size, so that they can satisfy a larger number of applicants. Some decision makers justify this practice by referring to the public nature of the investment, arguing that this means that it should benefit the largest number possible. This argument implies that the scheme has a social rather than an economic objective, and that while it may not resolve the problem of poverty for those who are allocated land, it at least contrib-utes to alleviating it. Others advance the more pragmatic argument that the practice of allocating small plots makes it easier to compensate the PAP at a lower cost. This is a short-term policy which actually contributes to perpetuating dependency on public funds, and harms the intended purpose of the investment. The contrary view is that farmers who farm sufficiently large areas in the scheme – from 1 to 5 ha per family depending on the scheme and the system of production – have more capacity to invest, both in agriculture and elsewhere, and so to contribute to the O and M costs of the scheme. It is interesting to note that in a context in which agricultural development is limited both by the shrinking amount of available land and by the low level of resources devoted to its intensification, it is families generating higher levels of agricultural income who also have the highest non-agricultural incomes. There is no contradiction here: agricultural incomes are re-invested both in productive capital and in other economic sectors which in turn provide revenues to finance agricultural activities. Investing in viable farms is therefore also encouraging investment in a diversified rural economy which can generate employment and non-agricultural incomes.
Tenure security also has to be further strengthened, so as to encourage investment by farmers in their productive asset base and in the fertility of their irrigated plots. This process of securing tenure is dependent on the legal nature of the tenure rights (title to property, leases in perpetuity, use agreements…) but also on the contract and spec-ification of rights and duties between the farmer and the SAGI, and the way in which these rules are defined and applied (the roles of the various actors, criteria and processes for decision making in cases of allocation or withdrawal of a developed plot, possible
45. The question is more complex for mechanised equipment, which cannot be economic when used on the average area cultivated by a single farmer. The economic model of this kind of machinery depends 46. In our studies the exception is the Anambé irrigation scheme, in terms both of cultivation rate and modalities for allocating land.

78
recourse). Apart from the type of document and the governance of tenure arrange-ments, the economic conditions for cultivation of plots also plays an important role in providing security for farmers, as is shown by the cases of farmers who have lost their access to a developed plot, temporarily or definitively, because of poor economic results making them unable to pay fees and charges or invest in farming the land correctly.
Analysis of the diversity of systems of production and of the incomes they produce shows that two principal types of productive strategy yield satisfactory agronomic and economic results, allowing farmers to live properly and to invest in their productive assets. On one side are farmers specialising in rice farming, who are extremely dependent on access to large plots in the developed area; on the other are diversified farmers whose income depends on a range of types of production – livestock, rain-fed agriculture, and irrigated agriculture both within and outside the scheme. For the first of these two types, the key factor is access to developed land; in the second case, it is access to non-developed land. Both types of farmer enjoy good material conditions and resources, which enable high levels of performance to be achieved. These findings provide food for thought about the models of productive systems which could be established in new projects and schemes, to ensure that they really enable food security to be improved and poverty to be reduced for the farmers participating in them, while at the same time contributing to national food security objectives.
Achieving the objectives assigned to irrigated agriculture, in terms of food self-sufficiency and combating poverty, requires much more than the construction and maintenance of infrastructures to enable water to be controlled and managed. It also demands effective public policies in the areas of agricultural advice, rural credit, arrangements for access to equipment, and functioning of the market, which can be adapted locally depending on the specific features of irrigated agriculture and the needs of different types of farmers. But the various structures for discussion and decision-making which would enable local participation of farmers in the management of land, of water or of marketing of agricul-tural products are still barely functional, because farmer organisations usually do not have the capacity to carry any weight in these institutions in the face of the SAGI. Figure 12 illustrates the different conditions – political, economic, land tenure, governance – which enable IAS to achieve the objectives set for them in national policies.

79
FIG
UR
E 12
C
on
dit
ion
s fo
r a
virt
uo
us
circ
le in
irri
gat
ed s
chem
es
Paym
ent
of w
ater
cha
rge
CO
MBA
TIN
G P
OV
ERTY
AN
D C
ON
TRIB
UTI
NG
TO
FO
OD
SO
VER
EIG
NTY
Acc
ess
to n
on-d
evel
oped
land
Non
-agr
icul
tura
l in
com
esA
gric
ultu
ral
inco
mes
Non
-agr
icul
tura
l inv
estm
ent
Agr
icul
tura
l inv
estm
ent
Fun
ctio
nin
g
mar
keti
ng
ch
ann
els
Acc
ess
to e
quip
men
tA
cces
s to
irrig
ated
land
Ag
ricu
ltu
ral
cred
it
Ric
e p
rod
uct
ion
PERF
ORM
AN
CE
OF
THE
SCH
EME
Prepari
ng th
e ric
e fa
rmin
g se
ason
Rice farming
Com
mercialisation
Seas
onal
fi na
nce
Ag
ricu
ltu
ral a
dvi
sory
se
rvic
es a
nd
fu
nct
ion
al f
arm
er
org
anis
atio
ns
Managem
ent a
nd
maintenan
ce o
fthe
sch
eme

80
6.3 TOWARDS A NEW PARADIGM?Irrigation is often presented in public policy circles as the main response to food crises, climatic uncertainty and chronic poverty, especially in the countries of the Sahel.47 Among the modalities for development of irrigation, large dam policy has a major place, with very large estimates of the irrigable surface area: Kandadji (45,000 ha), Taoussa (139,000 ha), Samendéni (21,000 ha), Fomi (200,000 ha in Mali and 100,000 ha in Guinea), Adjaralla (40,000 ha)… Although GWI studies show that these figures should be treated with caution, it is still the case that policies for developing irrigation schemes, for land compensation and for developing irrigated agriculture would benefit greatly from taking account of the lessons to be learned from the dams at Sélingué, Bagré and Niandouba/Confluent, so that the major financial commitments entered into can have tangible outcomes for local populations and for the country concerned.
IAS need to be an integral part of the agrarian logic of the areas they play a part in transforming, rather than being considered as systems that break with existing agricultural practices or are disconnected from the land around them. In this sense, IAS development strategies must take into account the current evolution of agrarian systems, the strategies of farmers and the constraints they face, including them directly in decisions concerning the development schemes – which is rarely the case today. This will enable irrigation systems adapted to the conditions of farmers to be introduced, which can be effectively cultivated, complement rain-fed production systems and contribute effectively to raising production and fighting poverty.
At the same time there is a legitimate debate about whether it is apposite to concen-trate such considerable investments on the small areas where the IAS are situated, while in contrast there is no, or almost no, public funding support for vast areas of rainfed farmland elsewhere. Less costly schemes which can be implemented at a larger number of sites, spread out over larger areas and with environmental and social impacts which are less severe, might turn out to be easier to integrate into production systems, affecting a larger number of farmers. They might, in the end, make better outcomes possible in the struggle against poverty and improve progress towards national development.
47. See the Dakar Declaration www.icid.org/decl_dakar.html

81
BIBLIOGRAPHYAdamczewski-Hertzog, A. (2016) Sécuriser les producteurs des périmètres irrigués de
Sélingué et Maninkoura. IIED, London. GWI report. http://pubs.iied.org/G04131/ ADF (2015) Bagre Growth Pole Support Project(PAPCB) – Burkina Faso – Appraisal
Report. OSAN Department. http://tiny.cc/gwi_adf2015 ADF (2013) Mali – Project for Food Security Consolidation through Development of Irrigation
Farming (PRESA-DCI) – Appraisal Report. OSAN Department. http://tiny.cc/gwi_adf_2013 AfDB (2013) Projet de renforcement de la sécurité alimentaire par le développement
des cultures irriguées au Mali (PRESA-DCI) – Rapport d’évaluation. AfDB (2000) « Projet de développement du bassin de l’Anambé (phase III), Rapport
d’identification/préparation ». Cooperation FAO-AfDB, report 00/087 ADB-SEN.AfDB (1988a) Mali – Selingue Rural Development – Project Performance Evaluation
Report (PPER). http://tiny.cc/gwi_afdb AfDB (1988b) Mali – Selingue Dam Project – Project Performance Evaluation Report (PPER).
http://tiny.cc/gwi_afdb_pper Ansar, A. et al. (2014) Should we build more large dams? The actual costs of hydro-
power megaproject development. Energy Policy, 69, 43-56. http://tiny.cc/gwi_ansar Bagrépôle (2013) Étude de tarification de l’eau à Bagré. BGB/Méridien SARL.Bazin, F. (2017a) Analyse des systèmes de production du périmètre irrigué de Sélingué
(Mali). GWI report. IIED, London. http://tiny.cc/gwi_bazin2017a Bazin, F. (2017b) Analyse des systèmes de production du périmètre irrigué de Bagré
(Burkina Faso). GWI report. IIED, London. http://tiny.cc/gwi_bazin2017b Bazin, F. (2017c) Analyse des systèmes de production du périmètre irrigué de l’Anambé
(Sénégal). GWI report. IIED, London. http://tiny.cc/gwi_bazin2017c Bazin, F. (2016) Financing family rice farming to improve performance of large dams.
GWI briefing. IIED, London. http://pubs.iied.org/G04014 Bazin, F., Skinner, J. and Koundouno, J. (dir.) (2011) Sharing the water, sharing the
benefits: Lessons from six large dams in West Africa. GWI report. IIED, London. https://pubs.iied.org/17510IIED
BRL Ingénierie (2015). Initiative pour l’irrigation au Sahel – Gestion et entretien des infrastructures existantes. Rapport intermédiaire.
Burkina Faso (2011) Stratégie nationale de développement de la riziculture. http://hubrural.org/IMG/pdf/burkina_faso_fr.pdf Burkina Faso (2004) Document de stratégie de développement rural à l’horizon 2015.
http://www.inter-reseaux.org/IMG/pdf_DSDR_definitif.pdf CACG, SONED, IRAM (2016) Amélioration de la productivité agricole et de la sécurité
alimentaire dans le Tiers Sud du Sénégal. Études APS, EIES et APD/DCE du projet Tiers Sud – Avant-projet sommaire – Volume 1.1 : rapport principal.
Carboni, S. et al. (2016) Gérer la question foncière dans les aménagements hydro-agri-coles : Le cas de Bagré. Labo citoyenneté.
CECID (2012) Étude de faisabilité de la proposition du Sexagon – Paysans investisseurs – Première partie : la faisabilité économique de la proposition du Sexagon. Rapportfinal. Université Libre de Bruxelles. http://tiny.cc/gwi_cecid
Dufumier, M. (1996) Les projets de développement agricole – Manuel d’expertise. CTA-Karthala.
ECOWAS (2012) Guidelines for the development of water infrastructure in West Africa. http://tiny.cc/gwi_ecowas
Ferraton, N. and Touzard, I. (2009) Comprendre l’agriculture familiale – Diagnostic des systèmes de production. Quæ, CTA, Presses agronomiques de Gembloux. http://tiny.cc/gwi_quae

82
Hathie, I. (2015) Évaluation économique ex-post des barrages de Niandouba et Confluent au Sénégal. GWI report. IIED, London. http://pubs.iied.org/G04007
Hathie, I. Doucouré, O., Bagayoko, A., Syllan, A., Bocoum, N. and Macalou, B. (2017) Étude comparative de la valeur actuelle du barrage de Sélingué et de la situation du bilan financier de l’État. GWI report. IIED, London. http://tiny.cc/gwi_hathie_selingue
Hathie, I. et al. (2013) Les enjeux pour les petits producteurs dans l’irrigation à grande échelle – le cas des barrages de Niandouba et Confluent (Anambé) au Sénégal. GWI report. IIED, London. http://tiny.cc/gwi_hathie
Iniatives ConseiI International (2010) État des lieux autour du barrage de Bagré au Burkina Faso. GWI report. IIED, London. http://tiny.cc/gwi_bagre
International Rivers (2016) The World Bank and Dams – Part 3: Niger Dam Could Leave Thousands In The Dust. http://tiny.cc/gwi_international_rivers
Inter-réseaux (2017) Bulletin n° 316 – Pôles de croissance. 25 juillet 2017. Kaboré, E. et Bazin, F. (2014) Évaluation économique ex-post du barrage de Bagré au
Burkina Faso. IIED, London. GWI report. IIED, London. http://pubs.iied.org/G04006 Kaboré, E. et Sédogo, S.A. 2014. Économie politique autour des grands barrages –
Le cas du barrage de Bagré, Burkina Faso. GWI report. IIED, London. http://pubs.iied.org/14642IIED Kergna, A.O. et al. (2013) Les enjeux pour les petits producteurs dans l’irrigation à
grande échelle – Cas du barrage de Sélingué au Mali. GWI report. IIED, London. http://tiny.cc/gwi_kergna
Ministère de l’Agriculture, de l’Hydraulique et des Ressources halieutiques, Burkina Faso (2002) Stratégie de croissance durable du secteur de l’agriculture – Résumé du Plan d’actions pour la mécanisation agricole.
http://hubrural.org/IMG/pdf/burkina_pa_meca_agri_resume.pdf Molle, F. et Berkoff, J. (dir.) (2007) Irrigation Water Pricing: The Gap Between Theory
and Practice. CABI, Wallingford.Ouedraogo, O. et Sedogo, S.A. (2014) Les enjeux pour les petits producteurs dans
l’irrigation à grande échelle – Le cas du barrage de Bagré au Burkina Faso. GWI report. IIED, London. http://tiny.cc/gwi_ouedraogo
Perret S. R. et al. (2013) Can rice farmers pay irrigation costs? An investigation of irrigation supply costs and use value in a case study scheme in Thailand. Cahiers Agriculture 22(5), 385-92. http://agritrop.cirad.fr/570892/
Robert, É. (2010) « Les zones pastorales comme solution aux conflits agriculteurs / pasteurs au Burkina Faso : l’exemple de la zone pastorale de la Doubégué ». Les Cahiers d’Outre-Mer 249, 47-71. com.revues.org/5861
Side, C. S. (2013) Sstratégie de mécanisation de l’agriculture familiale en Afrique subsahar-ienne – Inclus Étude de cas du Burkina Faso. Mémoire de Master, Montpellier SupAgro, CIRAD, AFD. http://docplayer.fr/8754716-Strategie-de-mecanisation-de-l-agriculture-fa-miliale-en-afrique-subsaharienne.html
Sissoko, S. (1986) Politiques et formes d’aménagement dans la région de Sélingué. Mémoire de fin d’études, Institut panafricain pour le développement, Ouagadougou.
Skinner, J., Niasse, M. and Haas, L. (dir.) (2009) Sharing the benefits around large dams in West Africa. IIED, London. http://pubs.iied.org/12555IIED/
Tiffen, M. (1986) The dominance of the internal rate of return as a planning criterion and the treatment of O&M costs in feasibility studies. FAO, Rome. http://tiny.cc/gwi_tiffen
World Commission on Dams (2000) Dams and Development: A New Framework for Decision-Making. Earthscan, London. http://tiny.cc/gwi_wcd

83
APPENDIX 1 METHODOLOGY OF PRODUCTION SYSTEM ANALYSIS
SAMPLING METHODSTwo major methods of sampling are used in surveys: random sampling and purposive sampling (see Figure 13).
For research designed to analyse the performances of production systems, it is important to do justice to each of the systems being studied without giving more weight to one type of farmer rather than another. So, a purposive sample was used for this study: 10 detailed research enquiries were carried out for each type of farmer, or 80 in total, so as to obtain the same level of precise information for each type irrespective of its numerical representativity.
For the survey, our objective was to arrive at a numerical estimate of the relative numbers of each type of farmer. So here a random sample was chosen, with a short questionnaire to identify which type each farmer belonged to.
The whole set of farmers was counted on the basis of the data held by the SAGI, listing the plot holders in the different areas. A representative sample of the entire content of these lists of farmers was established with a confidence level of 95% and a confidence interval of 5%.
FIGURE 13
Different sampling methods
Source: Ferraton and Touzard 2009
Purposive sample enables each category identified to be studied without penalising any a priority
With random sampling, the cases best represented in reality will feature the most in the sample
Categories of fields or farms
Numbers

84
ECONOMIC ANALYSISFarm income is equal to the value of plant and animal production (sold or consumed on farm), less the value of expenditure on goods and services to produce them, which are of two types: intermediate consumption (seeds, fertilisers, veterinary fees, livestock feed and other inputs, payments to third parties for services, water charges…) and the annual depreciation and maintenance of farm buildings and equipment. The calculation of farm income is done in stages, starting with the added value of the farm.
Gross value added: The GVA of the farm is equal to the sum of the added values of its various component systems of crops and livestock. n n
GVA = ∑ GVAc + ∑ GVAe 1 1
where GVAe = Gross value added of a livestock systemand GVAc = Gross value added of a crop system
GVAc = PB – CI
where gross product GP = final annual production x unit priceand intermediate consumption IC = ∑ (quantities of goods x unit price of each)+ ∑ (quantities of goods x price of each)
In the same way, GVAe is calculated by calculating the GVA per animal and multiplying this figure by the average number of animals in the herd (in the case of breeding stock a matrix is used).
Net value added: Net value added is obtained by deducting from the GVA the annual cost of depreciation and maintenance of the buildings and equipment used
NVA=GVA-depreciation
Agricultural income of the farm (AI):This is calculated by deducting from the net value added the salaries of permanent staff, the rents, interest on capital borrowing and taxes and tariffs
AI=NVA – salaries – farm rent – interest – taxes

85
ANALYSIS OF HOUSEHOLD CONSUMPTIONThe research surveys were carried out on a purposive sample of 30 families chosen from among the types of farmers (4 families of each type), in order to capture the range of situations. The questionnaire was composed of several parts:
n A first section, completed with the help of the family head, consisted of a descrip-tion of the structure of the family and a checklist of the kinds of expenditure madeby the different members of the family. This enabled questionnaires concerning thevarious kinds of expenditure to be directed towards the family members directlyinvolved in them.
n A second section was made up of questionnaires on the different types of expendi-ture. There were six parts to these questionnaires:1. Farm-consumed food2. Purchased food3. Domestic expenditure including: clothes, travel and transport, housekeepingexpenses (utensils, equipment, consumables) and communication4. Health and education5. Social expenses (family and religious holidays and events, others)6. Other expenditure (including taxes and dues)
This second section of the questionnaire was administered to the different family members in line with the information collected in the first section. As families are often very extended, not all family members were interviewed. For example, in a family where the family head had several wives, only one or two of them were interviewed. The expenditure information collected in this way from one of the wives was then multi-plied by the number of wives. Family expenditure was reconstituted in this way on the basis of conversations with some of the members and of the composition of the family.
In order to compare it with the data on incomes, family expenditure per person was calculated by dividing the total family expenditure by the number of persons in the family. Note that when carrying out this research, persons considered as belonging to the family enterprise may be physically on the farm or away from it, because there are some people who depend on the farm for their consumption but are not living there (such as children who are at school in towns).
Next, the level of expenditure for each heading was estimated, based on the average consumption per person. The total expenditure per person corresponds to the sum of expenditures under each heading.
Total family expenditure per person = ∑ (Average expenditures per expenditure heading)1

86
APPENDIX 2 TYPOLOGY OF PRODUCTION SYSTEMS
SÉLINGUÉThe different types of farmers identified and their respective proportions in the villages studied are as follows:48
Farmers without their own animal traction (27% of all farmers, 14% of rice farming plots in the scheme)
These farmers are mostly migrants (70%). They have usually arrived in the area only recently, at a time when it had already become rarer for local residents to grant user rights to newcomers. They have little or no access to land that can be cultivated in the rainy season, and their tenure is often precarious (allocation of land on a year by year basis and changes of location). Many of these migrants arrived without families or with just a few people of working age, and without capital. But there is also a significant proportion of locally born farmers in this category (30%), most of whom lost their land because of the building of the dam.
These farmers characteristically have a very low level of farm equipment. Apart from manual farming tools (hoes, dabas and sickles), some of them have a donkey and cart.
They are consequently farming small areas – less than 2 ha of rainfed crops, mainly maize – and almost always have plots in the scheme for rice (one or two plots, or less than 0.5 ha) and market gardening (one or two plots, or 0.08 to 0.16 ha). They have no livestock, which severely limits their capacity to manure their fields and to acquire animal traction. To plough their rice fields, they have to hire services from others. Their whole farming operation except for ploughing, transplanting and harvesting is done with family labour. Their agronomic and economic performance is poor because of the multiple constraints they are working under.
Farmers specialising in irrigated crops (5% of farmers, 12% of rice fields in the scheme)
These farmers are migrants or displaced people who have limited access to land for rain-fed agriculture, but who have managed to build up capital and equip themselves with animal traction or even, in some cases, with motor cultivators. They invest in irrigated agriculture, generally farming over 2 ha in the scheme, mainly of rice, on plots allocated to them or rented from other farmers. Some of them also farm maize or bananas there, on plots which are unsuitable for rice and so are easier to access. Some of these farmers who have equipment are also diversifying towards hiring out services (ploughing with oxen or cultiva-tors, and threshing). These are farmers who display a certain level of effectiveness in terms of rice farming and who have the capacity to farm more land than they are allocated.
Farmers of rain-fed crops (12% of farmers, 0% of rice fields in the scheme)
These farmers are mostly locally born or displaced, and are farming only rain-fed crops on the higher ground or in lowlands. Many of them are farmers who had access to land in the scheme before 1989 but who have given up their holdings there after getting poor results, or because their rain-fed crop lands are very far away from the scheme area.
48. The number of farmers of each type and the areas cultivated in the scheme were evaluated from a survey of a representative sample.

87
Their production strategy targets self-sufficiency in cereals through rain-fed crops, particularly maize and lowland rice. They generally have two complete animal traction teams with equipment, enabling them to farm 6 to 10 ha of cereals. Their livestock is limited to a few cattle (<10) which cannot provide enough manure for all their fields. This group does not farm in the scheme but does have plough oxen which could be used for rice farming.
Farmers of rain-fed and irrigated cereals (28% of farmers, 33% of rice fields in the scheme)
These farmers are similar to the preceding group. They have the same level of equipment and farm similar areas. They farm rather small rain-fed areas but on the other hand they have rice fields of 0.5 to 2 ha in the scheme. They are generally locally born (64%) or, less often, are migrants who arrived early in the region, with large families, and were able to get access to sufficient new land to clear. This group is focused on diversification and risk reduction through investing in both rain-fed and irrigated farming. Support for the irrigated sector must take into account the existence of competition for fertiliser, ploughing and manure during the wet seasons between irrigated rice and rain-fed crops, but also of strong complementarities between the two cropping systems.
“Diversified” farmers (13% of farmers, 22% of rice fields in the scheme)
These are locally born farmers with large families who have accumulated major land holding capital and large herds (over 20 cattle and/or over 50 small ruminants). They are well equipped with animal traction (several plough teams) and so are able to cultivate and manure large fields of rain-fed cereals. In addition, they farm large areas of rice in the scheme (1 to 2 ha). They diversify their production by cultivating market garden crops such as bananas or maize in irrigated plots, sometimes in the scheme but more often outside, using motorised pumps to raise water from the drainage ditches, the river or from ponds fed by the dam reservoir. This makes them different from the previous group. In addition, some farmers in this group complement family labour by hiring permanent employees for their market gardening and fruit crops. This group’s aim is to diversify and reduce risk by investing in rain-fed and irrigated farming. Their financial means and established land holdings enable them to develop irrigation outside the scheme.
Other rural farmers (5% of farmers, 4% of rice fields in the scheme)
These other farmers altogether represent less than 5% of the farmers in the study area. Their main sources of income are outside agriculture in the strict sense (livestock for some and fishing for others). They are listed here for completeness but are not analysed in detail in the rest of the report.
n Agro-pastoralistsThese are farmers from very large families who traditionally practise livestock herdingalongside rain-fed crop farming. They have large livestock holdings (>50 cattle)which allow them to manure their cereal fields abundantly. They represent 3% of thefarmers of the area, and irrigated agriculture is marginal in their production system.
n Fisher-farmersThese are Bozo migrants who arrived when the dam reservoir was filled, to fishseasonally, and who have ended up settling close to the dam. They have numerousfamily members and aim to be self-sufficient in cereals through access to developedplots and to upland fields (loaned or bought). Their cash income derives from fishing

88
and enables them to buy animal traction or even to buy land to grow cereals. The women often produce market garden crops on small plots. They account for 2% of farmers in the area.
Non-rural farmers (10% of farmers, 15% of rice fields in the scheme)
These are farmers who have an activity and main source of income (as civil servants or traders) that they draw on to invest in agriculture. They represent about 10% of farmers in the area. Those who have settled here since the 1980s have often obtained plots in the scheme, whereas those who arrived more recently buy land, preferably in the irrigable areas in the valley. So, there is a wide diversity of production systems within this type, which is composed of farmers who have varied levels of equipment and diverse farming systems, but with all being relatively demanding in inputs, such as rice, maize and bananas. Most of them have too little family labour to farm their land and so use mainly or solely salaried labour.
BAGRÉAt Bagré, for historical reasons, land tenure plays the determining role in shaping the farming system. Some local farmers have little or no access to land outside the irrigation scheme, and even inside the scheme there are differences depending on the arrange-ment of plots within a single family, or on access to reserve land. The typology we have developed focuses on this land tenure factor and the associated farming systems; categories of farmers are identified in relation to their access to the scheme for farming rice (size of plot), access to irrigable land for other crops (market gardening, bananas), and finally access to rain-fed farmland for cereals and leguminous crops.
Pure rice farmers (48% of farmers)
These are farmers who do not farm rain-fed land or whose holdings of rain-fed farmland are at or lower than 0.5 ha (an area that generally comprises a house plot with a house field). These farmers are therefore in a very constrained land tenure position, and in practice have no other source of agricultural income. They represent almost half of the farmers in our sample. Almost 60% of farmers in this situation are migrants, and the great majority of them (87%) are on the right bank, because of the withdrawal by the local inhabitants of the rain-fed lands initially allocated by the MOB.
a. Rice farmers with less than 1 ha of rice in the scheme (45% of farmers, 35% of developed area)
These are farmers who have been allocated a rice farming plot (generally of 1 ha) but who do not have access to land on the higher ground to practise rain-fed agriculture. These farmers are generally to be found on the right bank, but with the progres-sive removal by Bagrépôle of rain-fed lands to carry out development, the left bank farmers are also finding themselves in the same position.
These farmers are in a particularly vulnerable situation, because they need to ensure their families’ food security from rice farming alone, but also to fund the other needs of their families as well as the following farm season, from the same proceeds. They generally have little livestock, which limits their capacity to meet family difficulties or to resolve production and commercialisation problems.

89
b. Rice farmers with more than 1 ha in the scheme (3% of farmers, 7% of thedeveloped area)These farmers make up for their lack of access to rain-fed farmland by increasing theareas they farm in the scheme (3.1 ha on average). A number of strategies – which arenot mutually exclusive – enable them to farm more than the plot initially allocated tothem: renting of plots from farmers who lack the means or the willingness to cultivatethem; loans of plots (between members of the same family, for example); finallybringing “reserve” land which is next to their rice field into cultivation. These farmershave significant means at their disposal to fund the cultivation of these larger areas,often derived from non-agricultural income generating activities (trading, transforma-tion of products). In this category we find farmers who are also approved seed farmers,who are legally obliged to cultivate a minimum of 5 ha.
Farmers of rice and rain-fed crops (40% of farmers)
These farmers differ from the preceding ones because of the system of rain-fed crops, which may be farmed manually or using animal traction. They mainly grow cereals (on 70% of the rain-fed areas) whose primary purpose is to contribute to family food security. Maize is the main crop, followed by rice, millet and sorghum. The other crops (peanuts, sesame, cowpeas), which occupy 30% of the remaining rain-fed area, are mostly grown for sale, and to contribute to the cash income of the family.
a. Farmers with 1 ha or less in the scheme and with rain-fed fields (33% offarmers, 28% of the developed area)These farmers are typically on the left bank (over 60% of this category), with a plotof 1 ha in the rice farming plain and 2 ha of rain-fed land allocated to them by theMOB. In fact, for a variety of reasons (such as poor quality of fields, withdrawal offields etc.), 2/3 of these farmers today have less than 2 ha of rain-fed land.
b. Producers farming over 1 ha of land in the scheme and also rain-fed fields(7% of farmers, 12% of developed area)These farmers are distinguished by having bigger areas of farmland, whether inrain-fed (average of 8 ha) or irrigated rice land (2.2 ha on average). Their irrigatedrice farming development strategy is similar to that of the pure rice farmers culti-vating more than 1 ha in the scheme, but the areas of rice are smaller.
Diversified farmers (13% of farmers)
These are farmers who try to escape the constraints of access to land in the scheme (cultivating 1.5 ha on average) or in the rain-fed farming area (1.9 ha on average) by producing vegetable or fruit crops on small plots. This kind of gardening is often carried out on limited areas of the reserve land. Some farmers are differentiated by their production of fruit in addition to rain-fed crops, rice and vegetable crops; they have established orchards of mangoes, citrus fruit and bananas if they have their own land. 70% of these farmers are locally born people. They are found in equal proportion on both river banks.

90
ANAMBÉ“Traditional” farmers (29% of farmers)The “traditional” farmers have production systems which cultivate the plateau land, where the men mainly cultivate cereals, peanuts and cotton, and the lowlands, where the women grow rice in the rainy season and often vegetable crops in the off season. The areas farmed in the lowlands are generally limited to less than 0.5 ha of rice, because of the labour needed. These farmers do not farm rice in the scheme. There are two sub-types:
a. Traditional farmers who do not have a complete set of equipment for animal traction (“traditional manual”, 11% of farmers)
Among these farmers there are two distinct situations:
n Farmers who cultivate exclusively by hand. The areas they farm are limited by the availability of family labour, especially for ploughing.
n Farmers who hire animals for ploughing. This requires financial resources to be available, because hiring a pair of oxen costs 40,000 to 50,000 FCFA for the rainy season, and in addition the animals have to be fed. These farmers often have part of the equipment needed for animal traction, which they complement by borrowing or hiring what they lack (30,000 FCFA for a seed drill…). The areas cultivated are limited by the lack of means.
These farmers have little livestock, which severely limits their ability to manure their fields. Sorghum is often cultivated rather than maize, because it is less demanding in terms of fertiliser and so can be farmed by those with more modest assets.
b. Traditional farmers equipped with animal traction (“traditional equipped”, 18% of farmers)
These are generally farmers who succeeded in getting hold of equipment many years ago through credit advanced by Sodefitex, at a time when the price of cotton enabled them to repay loans fairly easily. They are able to farm bigger areas of maize and cotton than the manual farmers because they have the necessary equipment and have access to inputs through Sofeditex. Apart from oxen, these farmers often have a small herd of small ruminants, which means that they can manure their maize fields.
“Traditional” farmers who cultivate limited areas in the irrigation scheme (33% of farmers, 25% of the area cultivated in the scheme)
These traditional farmers diversify by cultivating rice in the scheme, on areas of less than 2.5 ha. The total areas cultivated by these farmers are not much different from those farmed by traditional types of farmers, but the rice farmed in the scheme replaces part of the cereals cultivated on the plateau or in the lowlands, or even cotton as a cash crop.
In the absence of access to credit, the area of rice farming in the scheme is limited by the financial means at the disposal of these farmers.
In this category we again find a distinction between farmers with and without equipment, which is the main factor influencing the area cultivated on the plateau.
a. “Traditional” manual farmers who farm limited areas in the irrigation scheme (“traditional” manual + scheme rice, 21% of farmers, 15% of the area cultivated in the scheme)
Rice is farmed only in the wet season and is generally limited to a single plot, because of the financial means required and the high risk.

91
b. “Traditional” manual farmers who cultivate limited areas in the irrigationscheme (“traditional equipped + rice scheme”, 12% of farmers, 10% of thearea cultivated in the scheme)
Rice is cultivated only in the wet season and may be as much as two plots. The areasin rain-fed farming are larger than in the preceding type.
Farmers who specialise
These farmers are characterised by a crop which has a preponderant place in their production system.
a. Farmers in the process of specialising in rice farming (“in the process ofspecialising in rice farming” 30% of farmers, 52% of the area cultivated inthe scheme)
These farmers are traditional farmers who are well equipped and who have a highlevel of financial means, who are progressively abandoning cotton as a cash cropand replacing it with rice, on areas of 2.5 to 10 ha cultivated in the scheme.
On the plateau, they cultivate large areas in maize/peanut rotation, essentiallyintended to provide cereals for the family, and they may hire the services of tractorsfor ploughing. The other operations are done with animal traction, of which theyhave several teams. These farmers have herds of cattle and small ruminants whichenable them to manure their cereal fields well.
These are farmers who have incomes or savings enabling them to fund the costof rice farming seasons independently of the provision of seasonal credit. They areheavily dependent on the availability of motorised equipment in private ownershipor at COGEMA for ploughing for their rain-fed crops, but above all for rice farming(ploughing and harvest). Some are seed farmers. These are farmers who hire salariedlabour to supplement the family work force.
b. Farmers specialising in rice farming (“Specialising in rice farming”, 2% offarmers, 21% of the area cultivated in the scheme)
These farmers are few in number and are quite differentiated, as some have landon the plateau which they farm for rain-fed cereals, while others are migrants whofarm only rice. What they have in common is cultivating large areas of rice in thescheme (over 10 ha) and, for some of them, having mechanical traction (tractors andsometimes also harvester/threshers) which gives them a certain level of independ-ence in how they do their rice farming, even though they may have to hire someequipment in addition to their own. All have major sources of funding for rice farmingand use permanent salaried labour. There are several seed farmers in this group.
c. The gardeners (“Specialising in market gardening”, 7% of farmers, 1% ofthe area cultivated in the scheme)
These are usually migrants who have recently arrived, at a time when there was nomore land available on the plateau, and who have initially invested in rice farming.Most of them have no access to rain-fed farmland, or only to small areas. In the faceof difficulties in dry season rice farming, these farmers have found an alternative inmarket gardening. Without access to credit, they also tend to abandon rice farmingin the wet season and specialise in vegetable growing.


Design and layout: Eileen Higgins, [email protected]
Translation from French: Duncan Fulton
PhotographsCoverTwo farmers transplanting rice in the Sélingué irrigation scheme, Mali. Credit: Mike Goldwater / GWI / IIED
Title pageA woman selling dried okra at the market in Selingué, Mali. Credit: Mike Goldwater / GWI / IIED
Chapter 1A farmer watering his garden in the area irrigated by the Sélingué dam, Mali.Credit: Mike Goldwater / GWI / IIED
Chapter 2Dam and power plant in Sélingué, Mali. Credit: GWI / IIED
Chapter 3Rice fields and irrigation canal in the Bagré scheme, Burkina Faso. Credit: Barbara Adolph / GWI / IIED
Chapter 4Young boy guarding cows in Sélingué, Mali. Credit: Mike Goldwater / GWI / IIED
Chapter 5Bags of rice harvested in Bagré, Burkina Faso. Credit: Barbara Adolph / GWI / IIED
Chapter 6Irrigation canal in the Sélingué scheme, Mali. Crédit: Mike Goldwater / GWI / IIED
P. 92Paddy rice grains in Anambé, Senegal. Credit: Jérôme Koundouno / GWI / UICN

In recent years, the governments of the Sahel have committed to combat poverty and food insecurity through a significant increase in the development of irrigable areas. For GWI West Africa, this has presented a timely opportunity to analyse, alongside the relevant ECOWAS guidelines, the socio-economic results achieved on irrigated schemes associated with large dams in the West Africa region.
From 2013 onwards, GWI has carried out retrospective studies on three existing dam and rice field sites: Sélingué in Mali, Bagré in Burkina Faso and Anambé in Senegal. The aim of these micro and macro-economic studies was to analyse the financial and economic viability of water infrastructure projects and opportunities for improving the living conditions of smallholder farmers after the construction of dams.
This report summarises the results of four years of research and identifies parallels between the different sites that provide wider lessons for the West Africa region. Based on field data, policy dialogue and collective learning, the report concludes on the cost-effectiveness of the schemes, the quality of their management and the persistence of poverty and food insecurity. It also makes recommendations for action and for the better alignment of public policy objectives with the interests of a diverse set of smallholder farmers, from making better use of existing systems to improving the design of future projects.
pubs.iied.org/17610IIEDISBN: 978-1-78431-527-6