guidelines for developing robust and reliable pcr assays
TRANSCRIPT

Promega CorporationPromega Corporation©2013 Promega Corporation.
Guidelines for Developing Robust and
Reliable PCR Assays
Leta Steffen, PhD
Applications Scientist

©2013 Promega Corporation.
Promega CorporationPromega Corporation 2
Outline
1) PCR reaction components
What is in the reaction?
How does it affect assay performance?
Where should you start?
2) Analyzing qPCR performance
Things to know
Performance criteria
Setting up the experiment
3) qPCR products
4) Optimizing a qPCR assay

Promega CorporationPromega Corporation©2013 Promega Corporation.
PCR Reaction Components

©2013 Promega Corporation.
Promega CorporationPromega Corporation 4
Primers
Template
Fluorescent Detection
User-Defined
Components
Master Mix
Components
Cycling Conditions
MgCl2
PCR Buffer
dNTPs
Polymerase
Amplification-grade water
What Is in a PCR Reaction?

©2013 Promega Corporation.
Promega CorporationPromega Corporation 5
Primers
Template
Fluorescent Detection
User-Defined
Components
Master Mix
Components
Cycling Conditions
MgCl2
PCR Buffer
dNTPs
Polymerase
Amplification-grade water
What Is in a PCR Reaction?

©2013 Promega Corporation.
Promega CorporationPromega Corporation 6
Primers: Sequence Effects
Enter your primers
Choose your database
Choose your organism
Specificity
Target
DNA/RNA
Primer interactions
Cycling conditions
Annealing temperature
Match primer Tms
Check your primers
BLAST them!
NCBI Primer-BLAST
Primers

©2013 Promega Corporation.
Promega CorporationPromega Corporation 7
Primers: Sequence Effects
Primer Set #1Specificity ?
Repeatability
Linearity 0.998
Sensitivity 10pg
Efficiency 95%
Primers

©2013 Promega Corporation.
Promega CorporationPromega Corporation 8
Primers: Sequence EffectsPrimers
©2013 Promega Corporation.
Promega CorporationPromega Corporation 9
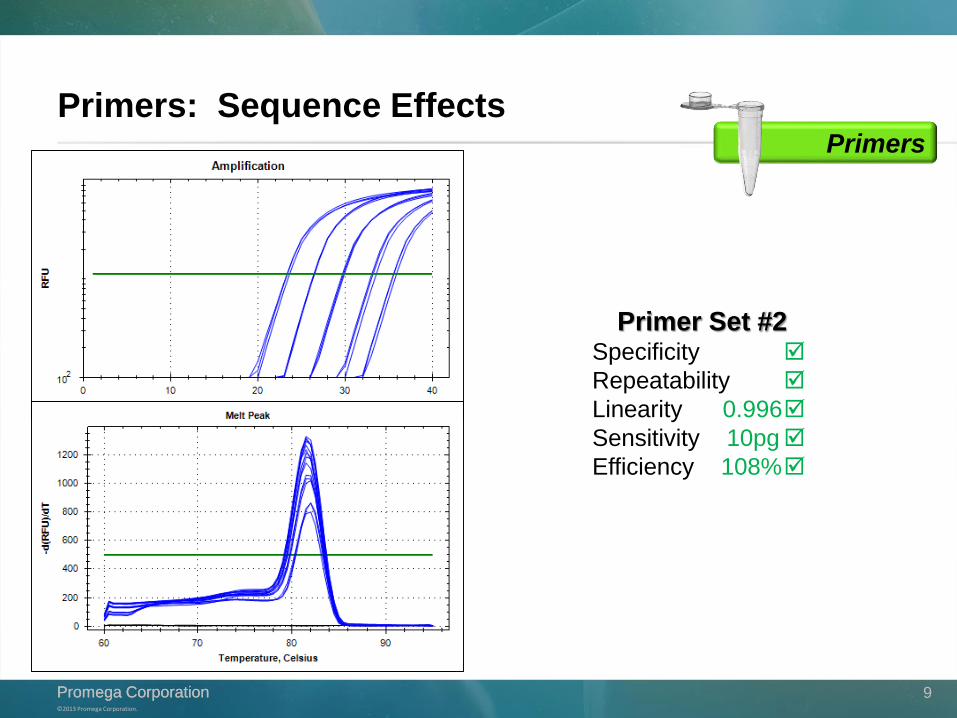
Primers: Sequence Effects
Primer Set #2Specificity
Repeatability
Linearity 0.996
Sensitivity 10pg
Efficiency 108%
Primers

©2013 Promega Corporation.
Promega CorporationPromega Corporation 10
Primers: Concentration Effects
Optimum varies between assays
Common range: 200nM – 1µM
Too low Low amplification efficiency
Too high Poor specificity, repeatability, or efficiency
10µM100nM 500nM
Linearity 0.991
Efficiency 68%
Linearity 0.988
Efficiency 102%
Linearity 0.812
Efficiency 156%
500nM each
Primers

©2013 Promega Corporation.
Promega CorporationPromega Corporation 11
Template
Concentration
What range of sensitivity & linearity do I need?
Fragmentation
What size amplicon can I reproducibly amplify?
Purity
Does the sample contain contaminating RNA or DNA?
Does the sample contain inhibitors?
10pg – 100ng
70-250bp
Template

©2013 Promega Corporation.
Promega CorporationPromega Corporation 12
Fluorescence Detection
dsDNA binding dye
Signal/noise threshold
Probes
Signal/noise threshold
Sequence effects
Analyze each assay separately!
Passive reference dye (ROX, CXR)
Use as required for your instrument
0.41
1.51
1X or 250nM
Fluorescence Detection

©2013 Promega Corporation.
Promega CorporationPromega Corporation 13
Cycling Program
Stage Temp
(°C)
Fast cycling
time
Standard
time
Cycles
Activation 95°C 2 min 1
Dissociation 95°C 3 sec 15 sec
40Annealing 60°C30 sec
30 sec
Extension 72°C 30 sec
Melt Curve 65-95°C Varies by instrument 1
Efficiency 81%
60.0°C
Efficiency 92%
55.1°C 66.2°C
Efficiency 92%
Cycling
Taq specific
Standard
Optimize here
Dye-based

©2013 Promega Corporation.
Promega CorporationPromega Corporation 14
Primers
Template
Fluorescent Detection
User-Defined
Components
Master Mix
Components
Cycling Conditions
MgCl2
Buffer
dNTPs
Polymerase
Amplification-grade water
What Is in a PCR Reaction?
(200nM ea.)

©2013 Promega Corporation.
Promega CorporationPromega Corporation 15
MgCl2
Multiple functions
Divalent cationic cofactor for polymerase
Sequestered with dNTPs 1:1
Stabilizes nucleic acid hybridization
[MgCl2]Lower efficiency Lower specificity
2mM 3mM 4mM 5mM + + - + + - + + - + + -
www.idtdna.com
1.5mM – 3mM
MgCl2

©2013 Promega Corporation.
Promega CorporationPromega Corporation 16
Polymerase
Concentration
Minimum required for efficient amplification
Increase may improve plateau but may not affect exponential phase
May require increased Taq for high level multiplexing
Plateau RFU
increases
Cq value
unchanged
1.0U - 1.5U
Taq

©2013 Promega Corporation.
Promega CorporationPromega Corporation 17
PCR Buffer
Buffers vary in salts, additives, detergents, pH
Specificity
Repeatability
Linearity 0.942 Sensitivity
Efficiency 127%
Specificity
Repeatability
Linearity 0.992 Sensitivity
Efficiency 100%
1X
PCR Buffer

©2013 Promega Corporation.
Promega CorporationPromega Corporation 18
Optimal for Each Component Depends on the Others
There may be many optimums, depending on where you start!

Promega CorporationPromega Corporation©2013 Promega Corporation.
Analyzing PCR Performance

©2013 Promega Corporation.
Promega CorporationPromega Corporation 20
Analyzing qPCR PerformanceThe case against using Cq values
Thresholds are somewhat arbitrary
Thresholds can be drawn anywhere in the exponential phase
Lower thresholds yield earlier Cq values
A single threshold should NOT be applied across different assays
Use independent analyses and auto-threshold when comparing assays
Compare based on assay performance metrics, not Cq
Cq 29.3 Cq 31.6

©2013 Promega Corporation.
Promega CorporationPromega Corporation 21
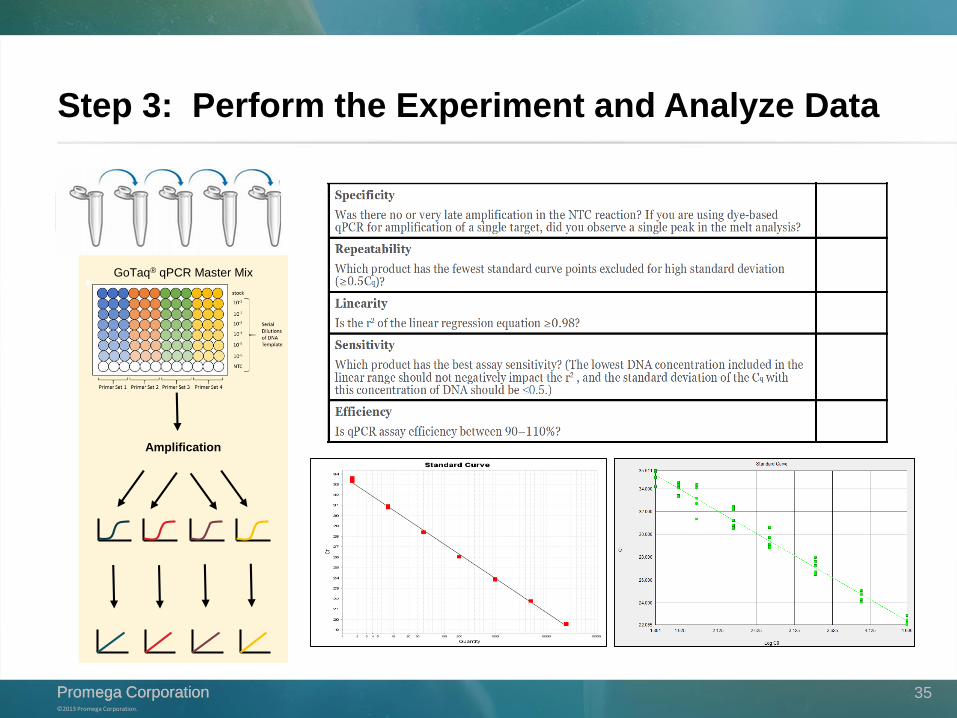
• NTC reactions should show no or late amplification
• Dye-based qPCR should show a single, sharp, symmetric melt peakSpecificity
• Standard deviations of technical replicate Cq values should be < 0.5
• Assess qualitatively if only two replicates are performedRepeatability
• A linear regression fitted to the standard curve data should have a coefficient of determination (r2) ≥0.98 for qPCRLinearity
• The lowest concentration at which a Cq can be reliably determined
• Specific LOD/LOQ testing can be performed as follow-up if neededSensitivity
• A linear regression fitted to the qPCR standard curve data should have a slope of -3.59 to -3.10, indicating 90-110% amplification efficiency
Efficiency
Analyzing qPCR Performance

©2013 Promega Corporation.
Promega CorporationPromega Corporation 22
How Do You Set Up the Experiment? Use a standard curve
Start with a positive control
≥10-fold more concentrated than samples
Typically purified or purchased DNA,
representative RNA, or pure target
Serially dilute in nuclease-free
water (1/4 – 1/10 dilutions)
Pipetting accuracy is important
Use same day (no freeze/thaw)
Consider plastics
Amplify in triplicate
Include NTC reactions
Can include representative samples
GoTaq® qPCR Master Mix
Amplification

©2013 Promega Corporation.
Promega CorporationPromega Corporation 23
Data Analysis
Analyze reactions for each assay separately
In some software, this is done automatically if assays are labeled uniquely
In others, you may need to set “well groups” or “omit” other reactions
Use automatic baseline and threshold settings
Perform a quality control check on the data
Use linear view to verify baselines
Flat and
overlapping
baselines
Use semi-log view to verify threshold
Crosses in
exponential
phase for all
reactions

©2013 Promega Corporation.
Promega CorporationPromega Corporation 24
Assay Performance: Specificity
✓ NTC reactions
No or very late amplification (≥ 3 cycles later)
Or primer artifact only (low Tm peak)
✓ Melt curves (dye-based only)
Single sharp, symmetric peak
✓ Exclude reactions with non-specific amplification
Specificity Specificity Specificity

©2013 Promega Corporation.
Promega CorporationPromega Corporation 25
Assay Performance: Repeatability
✓ Standard deviation <0.5 cycles for technical replicate reactions
Exclude points with standard deviation of the Cq ≥ 0.5
Repeatability Repeatability

©2013 Promega Corporation.
Promega CorporationPromega Corporation 26
✓ Fit a line to the plot of Cq value vs log10[DNA]
✓ r2 should be ≥ 0.980
✓ Exclude points that make r2 < 0.98.
Assay Performance: Linearity
Linearity 0.998 Linearity 0.921 Linearity 0.978

©2013 Promega Corporation.
Promega CorporationPromega Corporation 27
Assay Performance: Sensitivity
✓ The lowest template concentration for reliable quantification
Limit of quantification (LOQ) testing
✓ Inferred from lowest concentration included in the standard curve
Standard deviation of Cq < 0.5
Linear regression r2 ≥ 0.980
No substantial deflection from the
linear regression
Linearity 0.978
Linearity 0.997
Lowest
sensitivity

©2013 Promega Corporation.
Promega CorporationPromega Corporation 28
Assay Performance: Efficiency
✓ Efficiency calculated from the slope of the standard curve
𝐸𝑓𝑓𝑖𝑐𝑖𝑒𝑛𝑐𝑦 = 10(
−1
𝑠𝑙𝑜𝑝𝑒)− 1
Ideal = 100%
Acceptable = 90-110%
Efficiency 102% Efficiency 68%

©2013 Promega Corporation.
Promega CorporationPromega Corporation 29
Tool for Comparing qPCR Reagents
Teter, S. & Steffen, L. Real-time PCR: Guidelines for a Comparison of Reagent Performance
www.promega.com (2016).

Promega CorporationPromega Corporation©2013 Promega Corporation.
qPCR Reagents

©2013 Promega Corporation.
Promega CorporationPromega Corporation 31
Master Mix
Components
MgCl2
Buffer
dNTPs
Polymerase
Water
Promega’s qPCR Master Mix Offerings
Master Mix
GoTaq® qPCR Master Mix
GoTaq® Probe qPCR Master Mix
Custom Master Mix from individual components
PCR Optimization Kit
5X PCR Buffers A-H
MgCl2 Solution, 25mM
GoTaq® MDx Hot Start Polymerase
PCR Nucleotide Mix
Made-to-order 2X PCR Master Mix

Promega CorporationPromega Corporation©2013 Promega Corporation.
Optimizing a qPCR Assay

©2013 Promega Corporation.
Promega CorporationPromega Corporation 33
Step 1: Get to Know Your Assay
BLAST your primers• Are they sequence specific?• Are they RNA/DNA specific?• Are they located properly on the template?• Do they interact (self-prime)?• What are the predicted Tms?
Consider your template• Do you have a standard?• What concentration range?• Is the sample likely to be degraded?• Are inhibitors a concern?
Identify your detection method• Screening, or specificity information? DYE• Repeated assay or multiplexing? PROBE• Do you have the appropriate filter sets?
Primers
Template
Fluorescent Detection
User-Defined
Components
Cycling Conditions

©2013 Promega Corporation.
Promega CorporationPromega Corporation 34
Step 2: Determine Your Initial Cycling Program
• Fast for ≤ 20µL reactions, small ampliconsFast or standard
cycling?
• Consider 2-step if annealing is ≥ 60°C 2-step or 3-step
cycling?
• Existing: Start with current annealing temp
• New: Start at Tm - 5°C, usually ~60°CAnnealing temp?
Stage Temp
(°C)
Fast cycling
time
Standard
time
Cycles
Activation 95°C 2 min 1
Dissociation 95°C 3 sec 15 sec
40Annealing 60°C*30 sec
30 sec
Extension 72°C 30 sec
Melt Curve 65-95°C Varies by instrument 1
©2013 Promega Corporation.
Promega CorporationPromega Corporation 35
Step 3: Perform the Experiment and Analyze Data
GoTaq® qPCR Master Mix
Amplification

©2013 Promega Corporation.
Promega CorporationPromega Corporation 36
Step 4: Optimize
Check that primers, probe(s), and passive reference dye are within
the indicated concentration ranges
Optimize cycling conditions
Annealing temperature gradient
Non-specific amplification? Increase annealing temperature
Poor linearity or efficiency? Test ± 2-5°C annealing temperature, 3-step cycling
Optimize primer concentrations
Test with low (200nM), medium (500nM), and high (900nM) primer concentrations
Screen different primers to the same target

©2013 Promega Corporation.
Promega CorporationPromega Corporation 37
Optimize Cycling ConditionsHuman GAPDH DNA, dye-based qPCR
60.0° C55.2° C
Specificity
Repeatability
Linearity 0.984
Sensitivity
Efficiency 92%
Primer Tms: 61°C, 65°C
66.2° C
Specificity
Repeatability
Linearity 0.989
Sensitivity
Efficiency 92%
Specificity
Repeatability
Linearity 0.988
Sensitivity
Efficiency 81%

©2013 Promega Corporation.
Promega CorporationPromega Corporation 38
Optimize Primer ConcentrationHuman APP DNA, dye-based qPCR
Specificity
Reproducibility
Linearity 0.991
Sensitivity
Efficiency 68%
100nM
primers
Specificity
Reproducibility
Linearity 0.988
Sensitivity
Efficiency 102%
500nM
primers

©2013 Promega Corporation.
Promega CorporationPromega Corporation 39
What if Basic Optimization Doesn’t Work? Or what if you need long term reproducibility?
Customize your master mix
Increased flexibility: Buffer, MgCl2, Polymerase
Increased reproducibility: cGMP process control and QC
PCR Optimization Kit
Buffer A1 2 3 4 5 6 7 8 9 10 1112
A
B
C
D
E
F
G
H
Buffer BBuffer CBuffer DBuffer EBuffer FBuffer G
Buffer H
STEP 1
Survey to identify candidate
buffer formulations specific
to application.
Vary annealing temperature
Calculated
Tm
-2oC-4oC +2oC +4oC +6oC-6oC
Titrate MgCl2 (mM)
STEP 2
Perform assay optimization
with candidate buffers.
Buffer A Buffer D Buffer G
Titrate Enzyme (units)
FINAL
Optimized PCR
formulation
Buffer D
2mM MgCl22.5 units Taq

©2013 Promega Corporation.
Promega CorporationPromega Corporation 40
Beyond Basic Optimization78% GC-rich human RB gene, GoTaq® qPCR Master Mix
Step Cycles Temperature TimeGoTaq® activation 1 95°C 2 minDenaturation
4095°C 10 sec
Annealing/Extension 60°C-72°C 30 secDissociation/Melt 1 Instrument default
Initial gradient testing of annealing/extension temperatures
Ta = 72.0°C
Specificity
Repeatability
Linearity 0.921
Sensitivity 1ng
Efficiency 69%

©2013 Promega Corporation.
Promega CorporationPromega Corporation 41
Step 1: Survey PCR Buffers
Buffer A1 2 3 4 5 6 7 8 9 10 11 12
A
B
C
D
E
F
G
H
Buffer BBuffer CBuffer DBuffer EBuffer FBuffer GBuffer H
Choose a single MgCl2and Taq concentration
Serial dilution
of template
DNA in waterSpecificity
Repeatability
Linearity 0.999
Sensitivity 100pg
Efficiency 84%
Example: PCR Buffer A
PCR Buffers A, E, G

©2013 Promega Corporation.
Promega CorporationPromega Corporation 42
Step 2: Optimize Annealing Temperature
PCR Buffers A, E, G
1 2 3 4 5 6 7 8 9 10 11 12
A
B
C
D
E
F
G
H 66
.4°C
–7
2.0
°C
Example: PCR Buffer A
1ng template
Various Ta
Specificity Ta sensitive
Repeatability
Linearity > 0.99
Sensitivity 100pg
Efficiency <87%
Serial dilution
of template
DNA in water

©2013 Promega Corporation.
Promega CorporationPromega Corporation 43
Step 2: Optimize Annealing Temperature
Example: PCR Buffer G
Specificity all temps
Repeatability 67.6-71.1°C
Linearity ≥0.99 67.6-71.1°C
Sensitivity 10pg 67.6-70.0°C
Efficiency ≥89% 67.6-70.0°C
PCR Buffers A, E, G
1 2 3 4 5 6 7 8 9 10 11 12
A
B
C
D
E
F
G
H 66
.4°C
–7
2.0
°C
Serial dilution
of template
DNA in water
1ng template
Various Ta
PCR Buffer G, 68.6°C
©2013 Promega Corporation.
Promega CorporationPromega Corporation 44
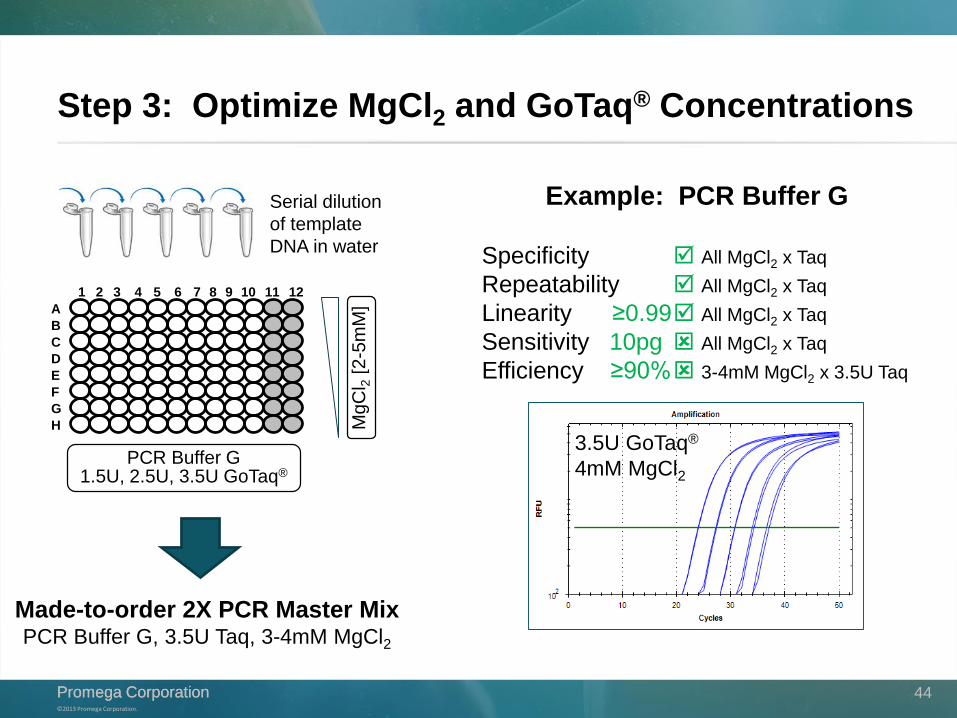
Step 3: Optimize MgCl2 and GoTaq® Concentrations
1 2 3 4 5 6 7 8 9 10 11 12
A
B
C
D
E
F
G
H
Serial dilution
of template
DNA in water
Mg
Cl 2
[2-5
mM
]
Example: PCR Buffer G
3.5U GoTaq®
4mM MgCl2
Specificity All MgCl2 x Taq
Repeatability All MgCl2 x Taq
Linearity ≥0.99 All MgCl2 x Taq
Sensitivity 10pg All MgCl2 x Taq
Efficiency ≥90% 3-4mM MgCl2 x 3.5U Taq
PCR Buffer G1.5U, 2.5U, 3.5U GoTaq®
Made-to-order 2X PCR Master MixPCR Buffer G, 3.5U Taq, 3-4mM MgCl2

©2013 Promega Corporation.
Promega CorporationPromega Corporation 45
Real-Time PCR Resources On-line
qPCR Introduction:
Webinar: Introduction to Real-Time PCR: Basic Principles and Chemistries
qPCR Assay Performance:
MIQE Guidelines: Bustin SA et al. The MIQE guidelines: minimum information for publication
of quantitative real-time PCR experiments. Clin Chem (2009); 55(4):611.
Analysis Guidelines: Considerations for Comparing Reagent Performance (www.promega.com)
Guidelines for a Comparison of Reagent Performance (www.promega.com)
Primer design software & Information:NCBI - Primer-BLAST
How to: Design PCR primers and check them for specificity
Ye J. et al. Primer-BLAST: A tool to design target-specific primers for polymerase chain reaction. BMC Bioinformatics (2012); 13:134.
IDT - PrimerQuest
Decoded: PCR and qPCR

©2013 Promega Corporation.
Promega CorporationPromega Corporation 46
Catalog master mixes
qPCR and RT-qPCR
PCR and RT-PCR
Flexible components and custom master mixes
PCR Optimization Kit
Made-to-Order 2X PCR Master Mixes
Real-Time PCR Product Resources

©2013 Promega Corporation.
Promega CorporationPromega Corporation 47
Technical Services Scientists Ready to Help

Promega CorporationPromega Corporation©2013 Promega Corporation.
Questions Welcome