guide to preparing a housing finance strategy: human settlements financing tools and best practices
DESCRIPTION
This guide sets out the key elements of a housing finance strategy and the process of developing a housing finance strategy, including the study of housing demand, identifying available resources, market forces and strategies to accomplishing housing finance goals and objectives. It provides assistance for member states on how to prepare successful housing finance strategies and action plans. It guides member states in their future housing finance planning and better positions themselves to meet market potentials and address the gap between demand and supply in housing finance.TRANSCRIPT

HS/ ISBN: (series)ISBN: UNITED NATIONS HUMAN SETTLEMENTS PROGRMMEP.O. Box 30030, GPO Nairobi 00100, KENYATelephone: 254-20-7623120; Fax: 254-20-7624266/7 (Central Office)E-mail: [email protected]:http//www.unhabitat.org
Printed in Nairobi
A G
UID
E TO PR
EPAR
ING
A H
OU
SING
FINA
NC
E STRA
TEGY
GUIDE TO PREPARING AHOUSING FINANCE STRATEGY
A Housing Finance Strategy is a plan for deploying the resources available (and if needed increasing them) to finance the demand for housing by different segments of society. A Housing Finance Strategy is influenced by national, regional and sub-regional agendas and is linked to a wide range of other strategies and factors.
This guide sets out the key elements of a housing finance strategy and the process of developing a housing finance strategy, including the study of housing demand, identifying available resources, market forces and strategies to accomplishing housing finance goals and objectives. It provides assistance for member states on how to prepare successful housing finance strategies and action plans. It guides member states in their future housing finance planning and better positions themselves to meet market potentials and address the gap between demand and supply in housing finance.
THE HUMAN SETTLEMENTS FINANCING TOOLS AND BEST PRACTICES SERIES

GUIDE TO PREPARING A HOUSING FINANCE STRATEGY
Nairobi, 2009

The Human Settlements Financing Tools and Best Practices Series
Guide to Preparing a Housing Finance Strategy
First published in Nairobi in 2009 by UN-HABITAT
Copyright © United Nations Human Settlements Programme Nairobi, 2008
HS/ 1070/08E
ISBN: 978-92-1-132022-0 (series)
ISBN: 978-92-1-132064-0
Disclamer
The designations employed and the presentation of the material in this publication do not imply the expression of any opinion whatsoever on the part of the Secretariat of the United Nations concerning the legal status of any country, territory, city or area or of its authorities, or concerning the delimitation of its frontiers of boundaries.
Views expressed in this publication do not necessarily reflect the views of the United Nations Human Settlements Programme, the United Nations, or its Member States.
Excerpts may be reproduced without authorization, on condition that the source is indicated.
Cover photo: Xing Zhang/UN-HABITAT
Acknowledgements
Director: Oyebanji OyeyinkaPrincipal Editor and Manager: Xing Quan Zhang Principal Author: Raymond StruykContributors: Tyler Yang, Marisol Ravicz, Nadezhda Kosareva, Stig
Jensson and John Webber English Editor: Ingrid Uys Design and Layout: Anne Musotsi

�
And for this, we need innovative governance, and local thinking and reporting if we are to bring hope to the urban poor. Equally impor-tantly, we need to support our towns and cities, indeed our countries, to adopt pro-poor policies and strategies that will obviate the need for further slum creation.
It is against this background, that the Human Settlements Financing Tools and Best Practices series focuses on the development of know-how, knowledge and tools in human settlements financing, from which Member States can learn in delivering affordable hous-ing to the poor.
Dr. Anna TibaijukaUnder-Secretary-General andExecutive DirectorUN-HABITAT, Nairobi, 2008
The global housing crisis, especially in the developing world, is getting worse by the day making the right to adequate shelter a quest that is becoming more and more difficult to meet, despite the targets set by the Millennium Development Goals.
Such is the rate of urbanization – the influx of people into towns and cities, and their natural growth – that the world has now reached a point where for the first time now, half the global population lives in towns and cities.
By the year 2050, six billion people – two-thirds of humanity – will be living in towns and cities. And as urban centres grow, the locus of global poverty is moving into towns and cities, especially into the burgeoning informal settlements and slums, of the developing world. In the developing world, this is hap-pening so fast that slums are mushrooming in what is termed the urbanization of poverty.
This makes it imperative that we use every means at our disposal to ensure that we at UN-HABITAT, and our partners, keep ap-plying ourselves to Target 11 of the Goals – to achieve significant improvement in the lives of at least 100 million slum dwellers, by 2020.
FOREWORD

��
TablE OF COnTEnTs
FOREWORD I
LIST OF TABLES, FIGURES AND BOXES IV
PART I – CONCEPT AND CONTENT 1
CHAPTER 1 WHY A STRATEGY? 3
Variation in the Depth of Housing Finance Development 3
What Does a low Volume of Housing Finance Mean? 6
Organizing a Housing strategy 6
The strategy Must be Comprehensive 7
How Will the strategy be Fulfilled? 9
Prior Conditions for Preparing a strategy 11
These Guidelines 12
CHAPTER 2 WHAT A STRATEGY DOES 13
an Illustration 13
lessons 16
CHAPTER 3 STRATEGY OVERVIEW 17
Technical Elements 17
The “Political Process” 18
���
PART II – TECHNICAL ANALYSIS 19
CHAPTER 4 THE DEMAND FOR HOUSING FINANCE 21
Preparing Demand Estimates 21
Construction Period Finance 22
access to Housing Finance 25
CHAPTER 5 HOUSING FINANCE SUPPLY 29
The big Picture 29
What to learn about Each Type of lending 31
addressing lender Efficiency and Risk Management 34
Funding sources for lenders 39
Government Programs and Initiatives 44
CHAPTER 6 OPTIONS FOR ADDRESSING THE GAP 55
Increasing the Volume of Housing lending 56
Increasing the Funds available for Housing lending 59
PART III – ORGANIZING AND IMPLEMENTING A STRATEGY DEVELOPMENT 61
CHAPTER 7 INSTITUTIONAL FRAMEWORK – WHO DOES WHAT 63
Who should lead the strategy’s Preparation? 63
Who should Participate? 64
How should the Technical analysis be Organized? 65
Who should Pay for the strategy Development? 66
How to Determine the Recommendations? 67
Defining the strategy 68
�v
CHAPTER 8 THE ACTION PLAN 71
The Plan Completed 71
Managing Implementation 72
CHAPTER 9 MONITORING RESULTS 75
Demand or Household side 75
supply side 77
Who Prepares the analysis and Reports 78
Reviewing Results 79
REFERENCES 81
ANNEXES 85
a. supplemental Exhibits 85
b. Estimating the Demand for Housing Finance 103
LIST OF TABLES
1.1 Examples of Mortgage Finance Inhibitors and Possible
Government steps to Resolve Them
2.1 House acquisition in Dar es salaam in 1990
2.2 sources of Funds for Dwelling Construction
4.1 share of Households Using borrowing Funds in the Past 12 Months
5.1 Possible alternative Financing sources by Housing Investment Type
5.2 Illustrative Types of Information to Collect on lender Requirements for Housing loans to Individuals
5.3 net Interest Margins in International Comparison
5.4 selected Risk Management Options
5.5 Options for attracting Funds from Capital Markets
for Mortgage lending
v
5.6 Ratings of Government Interventions to Increase Homeownership
and attainment of Good Quality Housing
5.7 Possible Government Housing Finance Market Development actions
6.1 Characterization of Housing Finance Gaps in Egypt by Tenure-location Group and source of Finance
6.2 selected Challenges to Increasing Housing lending
Volume and Possible Responses
6.3 Ideas for attracting Wholesale sources of Finance
6.4 Example of actions in a Housing Finance strategy
7.1 Example of actions in a Housing Finance strategy
8.1 action Plan Example
9.1 Key Information Items for a Household survey
a.1 2007 Government Update of selected Elements of
the 2003 Tanzania-Un Habitat Plan of action
a.2 summary of Russian Federation affordable Housing Market Initiative status of legislative Proposals, January 2005
b.1 Illustrative Presentation of annual Housing Finance Demand in Cairo, 2006
lIsT OF FIGUREs
1.1 Ratio of Outstanding Mortgage Debt to GDP for selected Countries
1.2 Mortgage Depth vs. Total Credit Depth
1.3 Mortgage Depth vs. lending Efficiency
1.4 The Process of strategy Development
5.1 alternatives for Commercial banks to Work in the Microfinance Market

v�
lIsT OF bOXEs
2.1 Outline of the Tanzania Housing Finance strategy
4.1 Knowledge of the Mortgage loan in Cairo
4.2 Mobile banking Reinvented
5.1 lending Interest Rate Make-up of latin american MFIs
5.2 Principal Risks in Dwelling Purchase or Progressive Construction Finance
5.3 The Chilean approach to Housing subsidies
b.1 assessing Demand for Housing and Housing Finance: an Example for Indonesia, by Marja Hoek-smit
b.2 assessing Demand for Housing and Housing Finance: an Example for Moscow and budapest, by József Hegedüs et al.
lIsT OF abbREVIaTIOns
ba bankers’ association
Cb Credit bureau
CGaP The Consultative Group to assist the Poorest [a Microfinance Program]
EsFE European Fund for southeastern Europe
GOT Government of Tanzania
MFI Micro Finance Institution
nGO non Governmental Organization
PTY payment-to-income ratio
sME small and medium enterprise
VRM Variable interest rate mortgage

PaRT I
COnCEPT anD COnTEnT

�

�
WHY a sTRaTEGY?
The cold reality is that in many countries families who want to construct, purchase, or improve their housing situation, are inhibited because they cannot borrow funds. Loans that are available are channeled to middle- and higher-income families. In these countries most families, especially the poor, improve their housing only as their savings will permit as they are unable to leverage their incomes through loans.
The effect of this situation, combined with extremely low income levels, are families in cities and in the countryside who live in extremely difficult conditions characterised by poor quality dwellings and an absence of water and sewerage services that much of the world takes for granted. The rapid growth of cities and the increasing urbanisation in the developing world are well documented, and it makes clear this situation can only become worse in the years ahead unless it is addressed (Okpala et al. 2005). In the following few pages, the current global housing finance situ-ation is briefly highlighted and a case is made for the use of a housing finance strategy to overcome this severe problem.
VaRIaTIOns In THE DEPTH OF HOUsInG FInanCE DEVElOPMEnT
How restricted is the availability of housing finance in some countries? Characterising dif-ferences among countries in the development of their housing finance systems is a challenge because of the limitations on data and market fragmentation and segmentation. As discussed further below, lending for housing in some transition countries and many developing countries is segmented primarily between for-mal lending - mortgage lending similar to that in industrialised countries - and micro lending that supports the incremental construction and improvement of dwellings for occupancy by households who either cannot qualify for or cannot access formal mortgage loans.
Unfortunately, comprehensive data on national housing finance development are completely lacking in many countries. The comparative data available are for formal lending, particularly the ratio of the outstand-ing volume of mortgage loans to a country’s GDP.
01

�
The ratio is reported for an array of countries in Figure 1.1, using data generally around 2004. It is a rough but serviceable indicator. It is rough because it excludes: micro finance for all kinds of housing;1 a good deal of the financing for rental housing which is often equity financed; and, government finance for housing unless it takes the form of low interest rate mortgage loans.
The broad pattern shown in Figure 1.1 is instructive, with expected dramatically higher values for industrialised countries. Malaysia’s ratio tops 20 percent in large part due to such lending being a long-term government prior-ity manifest in the operation of its secondary facility, Cagamas, and other actions.
While many countries have ratios in the 10-15 percent range, there is a rough negative relationship between per capita income and mortgage market depth.
Surprisingly, the depth of mortgage lending is not closely related to either a country’s financial depth or to its financial efficiency. This is important because it reflects the reality that mortgage market development does not simply follow broad financial market develop-ment. This point is explored further in the following paragraphs.
Figure 1.2 details mortgage lending and total lending as a share of GDP for 11 countries on four continents. Four of the countries that have mortgage lending equal to 3 to 5 percent
� The distortion from exclusion of this source may be modest. For example,
data for South Africa, which has a vibrant microfinance sector, show
that micro lenders in 2006 accounted for only about 2 percent of
outstanding credits. Separate data for housing loan are not available
but micro lenders are unlikely to have no more than a 2 percent share
of such loans. Honohan, P., and Beck, T. (2007). Making Finance Work
for Africa. Washington, DC: World Bank.
of GDP have approximately the same total credit to GDP ratio as four countries for whom mortgage lending is equal to 10 to 14 percent of GDP. Further, in Brazil, where mortgage lending is equal to 5 percent of GDP, total credit equals almost 100 percent of GDP. By contrast, in Jordan the mortgage to GDP ratio is more than double that of Brazil - 11 percent in Jordan, but total credit to GDP is slightly below Brazil’s level - 92 percent in Jordan.
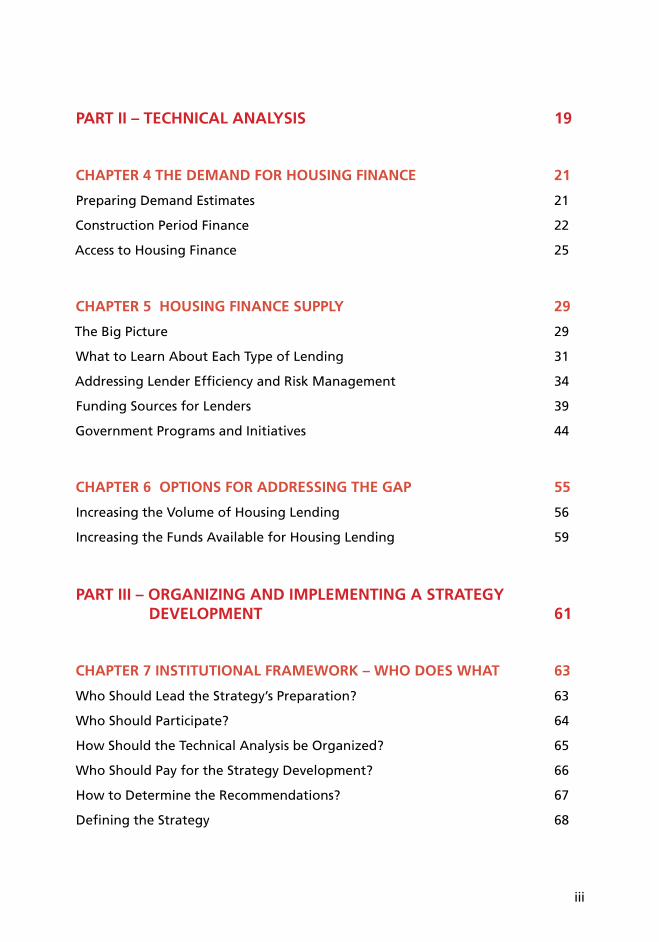
Similarly, Figure 1.3 shows that the depth of a country’s mortgage market is not strongly related to its financial market efficiency (as measured by the spread between the bank-ing system’s lending and borrowing rates). The three countries with an approximately 4 percent mortgage to GDP ratio have almost the same lending rate spread as four countries with a 10 to 14 percent mortgage to GDP ratio. Further, Croatia and China have almost the same mortgage to GDP ratio but China’s lending spread is less than 4 percentage points whereas Croatia’s is 10 points.
Finally, Croatia and Columbia have almost double the mortgage to GDP ratio as Slovenia, the Slovak Republic and Poland but also have much higher lending rate spreads.
Why is this? Mortgage depth can be much more strongly influenced by government housing and housing finance policies than by general financial development. As discussed below, well intentioned but erroneous policies such as government imposition of interest rate controls on mortgage lending by private as well as public lenders to make loans “afford-able” can have the effect stunting mortgage market development even while overall finan-cial markets mature and deepen.

�
FIGURE 1.2 MORTGaGE DEPTH Vs. TOTal CREDIT DEPTH
Sources: Chiquier (2006) and World Bank World Development Indicators.
0
20
40
60
80
�00
�20
�40
Mortgage % GDP
Tota
l Cr
edit
% G
DP
Brazil
China
Colombia
Croatia
India
Jordan
Latvia
Mexico
Poland
Slovak Republic
Slovenia0 2 4 6 8 �0 �2 �4
FIGURE 1.1 RaTIO OF OUTsTanDInG MORTGaGE DEbT TO GDP In sElECTED COUnTRIEs
Source: Chiquier (2006)
Depth Residential Mortgage Markets
0%
10%
20%
30%
40%
50%
60%
70%
Usa
EU -
15
Canad
a
Hong-K
ong
Mal
aysia
Esto
nia
Thai
land
Chile
latv
ia
Colom
bia
China
Mex
ico
Jord
an
Croat
ia
bolivi
a
Hungar
y
Mor
occo
Tuni
sia
Czech
Rep
.
brazil
Indi
a
Pola
nd
slova
kia
slove
nia
bangl
ades
hIra
nPe
ru
alger
ia
saud
i ara
bia
Paki
stan
Ghana
De
bt
As
% G
DP
�
FIGURE 1.3 MORTGaGE DEPTH Vs. lEnDInG EFFICIEnCY
Sources: Chiquier (2006) and World Bank World Development Indicators.
-
2.0
4.0
6.0
8.0
�0.0
- �.0 6.0 9.0 �2.0 �5.0
Mortgage % GDP
len
din
g R
ate
spre
ad (
%)
China
Colombia
Croatia
Jordan
Latvia
Mexico
Poland
Slovak Republic
Slovenia
is the better-off families. Incremental housing development carried out on a cash-only basis is not only slow; it tends to be quite inefficient
- the tendency is to begin with poor quality materials that need repeated replacing and possibly to demolish when the next stage of construction is carried out (UN-Habitat, 2005; 159). In sum, a low volume of finance means unnecessarily poor living conditions and extra housing costs to the poorest seg-ments of a country’s population.
ORGanIsInG a HOUsInG FInanCE sTRaTEGY
A housing strategy is a plan for deploying available resources (and if needs be, increas-ing them) to finance the demand for housing by different segments of society. The purpose of a strategy is to get the most from available resources. Preparing and implementing a strat-
WHaT DOEs a lOW VOlUME OF HOUsInG FInanCE MEan?
Loans for housing permit families to leverage the funds to spend each month on housing so that they can purchase a unit sooner or reach the next level of incremental development of their dwelling. The same monthly payments can go to loan repayments or they can be saved for years until the family can purchase the housing unit. In economists’ jargon, loans pre-empt housing demand.
Where finance is limited, housing construction is slow, thereby driving up the price of housing services - both rentals and units for purchase
- and this makes it even more difficult for most families to save to obtain good quality hous-ing. Critically, when housing finance is scarce there is a definite pattern of who receives most of the loan funds that are available: it

�
egy is a task that requires broad stakeholder involvement, a good deal of technical analysis, and strong political leadership.
The emphasis on stakeholder involvement and getting the process correct is clearly evident in the steps in the strategy development proc-ess shown in Figure 1.4. The process starts by identifying the relevant stakeholders and ensuring their active involvement, beginning with defining the strategic objectives.
The primary technical steps in strategy formu-lation are, in a simplified form, the following:
Understand the broad housing situation in the country, including basic housing qual-ity and related infrastructure conditions, the extent of preference for home owner-ship versus renting
Determine effective housing demand by income class and location (urban, rural) to identify and define market segments and the volume of finance required by each segment in the planning period (note that because loan terms differ across households with different incomes, there is no simple ratio to apply to income to reach a housing finance demand estimate).
Inventory housing finance currently available - products and volumes, market coverage and lending policies (for example, treatment of different sources of income in underwriting standards, physical access, registration requirements) by market seg-ment. This must include all sources - private, both formal and micro, and government. Find out where lenders obtain their funds, and the elasticity of these sources
Determine the gap between potential de-mand and current supply for each market segment
Prepare a plan for closing the gap that is informed by the information developed in the prior steps.
Sounds simple? As the following chapters document, it is not simple but it clearly is doable. The best technical analysis will be unproductive if the financial community, broadly defined, and the relevant government agencies are not fore square behind it.
Naturally, a primary question is how can the “gap be closed” or the plan be fulfilled.
THE sTRaTEGY MUsT bE COMPREHEnsIVE
Too often housing finance strategies address only the requirements of formal finance and then only in a country’s principal cities. Such strategies will often omit a major share of all households. This is a clear mistake.
Consider the following observations over the past decade of developing nations:
In Mexico, self-built housing accounts for roughly half of all new buildings.
In nine Asian countries, between 40 and 95 percent of all households have no pos-sibility of acquiring a unit built by the formal sector, and therefore little chance of obtaining finance.
An estimated 70 percent of housing in-vestment in developing countries occur through progressive building and therefore with little finance beyond household savings (UN-Habitat (2005), pp.70, 99, 110).
Room- and unit-renters account for the principal tenure form for lower income families in the urban areas of a number of African countries.

�
FIGURE 1.4 OVERVIEW OF THE HOUsInG FInanCE sTRaTEGY DEVElOPMEnT PROCEss
PREPaRaTIOn
Identify leaders of the process
Identify stakeholders and include them in all aspects of the process
Define work objectives and outputs
Define the analytic program and oversee it
AnalysisIdentify housing demand segments and estimate current and expected demand in each segment
Document the current supply of housing finance, the segments of the market each services and impedi-ments to expansion in volume and market coverage
Identify gaps between demand and supply by segment
Strategy Formulation
Identify options for closing the demand-supply gaps
Increasing the volume of lending
Increasing the funds available for housing lending
Determine the most feasible and effective options
Develop the action plan to implement the selected options
Implementation Monitoring and Evaluation
Establish monitoring arrangementsMonitoring the household side: who is receiving formal and informal loansMonitoring the supply side
Loan and borrower profilesDelinquencies and defaultsTerm distribution of liabilities
Define feedback mechanism

�
The situation is problematic in some transi-tion countries:
In Kyrgyzstan, in the years following the collapse of the Soviet Union, over 200,000 people migrated from the countryside to the capital, Bishkek, in search of work. They are living in basic dwellings mostly without infrastructure services but within communities with formal layouts thanks to prompt action by the local government. Little finance is available for upgrading.
In some of the countries of Southeastern Europe, the Caucuses, and Central Asia a large share of rural households live with-out piped water or indoor toilets. Again, financing for housing improvement is scarce.
These examples highlight the need for a na-tional housing strategy to address all market segments, where segments are defined by household purchasing power, location, and tenure form. To do this micro finance requires a full role as a source for housing lending where needed.
Micro housing lending can and has allowed families to accelerate the rate at which they consolidate their dwellings. Microfinance Institutions make a succession of loans to families constructing their homes incremen-tally, beginning with small loans for short pe-riods and gradually increasing the size and the loan period as borrowers demonstrate their ability to pay. Loan agreements are typically simple and the emphasis is on ability to pay rather than on pledged collateral.
Techniques are available to reduce further the credit risks associated with such loans.
(For further discussion, see Ferguson and Navarrete (2003).) 2
One sometimes hears that few Microfinance Institutions make loans for housing. In fact, estimates suggest that around 30 percent of Microfinance Institutions’ loans for business purposes are diverted to incremental housing improvements (e.g., Cain, 2007). In part the task is to formalse a type of lending that is already occurring.
HOW WIll THE sTRaTEGY bE FUlFIllED?
Establish conditions so that private sector lenders, formal and micro finance, can extend credit to most market segments without tak-ing undue risk.
Over the past twenty years there has been a gradual but fairly pervasive shift toward market provision of housing. In some cases this is due to the poor performance of public institutions charged with constructing hous-ing or acting as lenders (see Chapter 5 for more on this). But probably more important is that in many countries governments have helped set the necessary conditions that per-mit private lenders to prosper and serve most of the market.
2 In this Guide no distinction is made between licensed and unlicensed
MFIs. In part this is because of the variation in these organizations—
ranging from small, highly localized NGOs to commercial bank
subsidiaries—the diversity across countries in the legal environments
in which MFIs operate, and differences in the degree of supervision to
which different classes of MFIs within a country are subject.
10
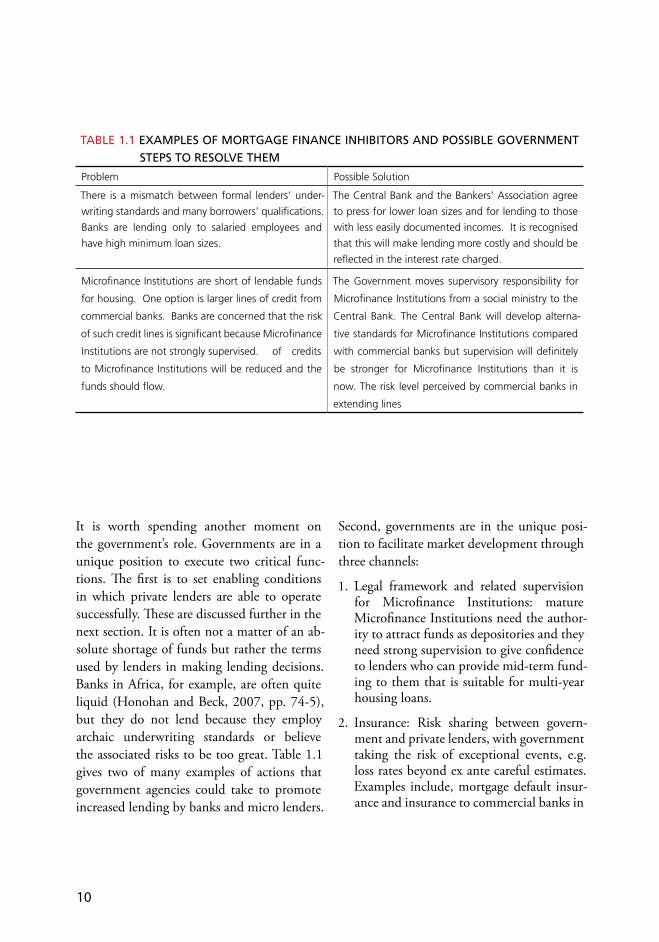
TablE 1.1 EXaMPlEs OF MORTGaGE FInanCE InHIbITORs anD POssIblE GOVERnMEnT sTEPs TO REsOlVE THEM
Problem Possible Solution
There is a mismatch between formal lenders’ under-
writing standards and many borrowers’ qualifications.
Banks are lending only to salaried employees and
have high minimum loan sizes.
The Central Bank and the Bankers’ Association agree
to press for lower loan sizes and for lending to those
with less easily documented incomes. It is recognised
that this will make lending more costly and should be
reflected in the interest rate charged.
Microfinance Institutions are short of lendable funds
for housing. One option is larger lines of credit from
commercial banks. Banks are concerned that the risk
of such credit lines is significant because Microfinance
Institutions are not strongly supervised. of credits
to Microfinance Institutions will be reduced and the
funds should flow.
The Government moves supervisory responsibility for
Microfinance Institutions from a social ministry to the
Central Bank. The Central Bank will develop alterna-
tive standards for Microfinance Institutions compared
with commercial banks but supervision will definitely
be stronger for Microfinance Institutions than it is
now. The risk level perceived by commercial banks in
extending lines
It is worth spending another moment on the government’s role. Governments are in a unique position to execute two critical func-tions. The first is to set enabling conditions in which private lenders are able to operate successfully. These are discussed further in the next section. It is often not a matter of an ab-solute shortage of funds but rather the terms used by lenders in making lending decisions. Banks in Africa, for example, are often quite liquid (Honohan and Beck, 2007, pp. 74-5), but they do not lend because they employ archaic underwriting standards or believe the associated risks to be too great. Table 1.1 gives two of many examples of actions that government agencies could take to promote increased lending by banks and micro lenders.
Second, governments are in the unique posi-tion to facilitate market development through three channels:
Legal framework and related supervision for Microfinance Institutions: mature Microfinance Institutions need the author-ity to attract funds as depositories and they need strong supervision to give confidence to lenders who can provide mid-term fund-ing to them that is suitable for multi-year housing loans.
Insurance: Risk sharing between govern-ment and private lenders, with government taking the risk of exceptional events, e.g. loss rates beyond ex ante careful estimates. Examples include, mortgage default insur-ance and insurance to commercial banks in
1.
2.

11
extending lines of credit for housing loans to micro lenders.
Creation of facilities critical to mortgage market development, which are too risky for the private sector to undertake in the current stage of market development. These might include a secondary mortgage facility or a credit rating agency. They are risky in the short-run because of the large up-front investment required and the rela-tively low volume of initial activity. When such organisations are more mature, they can be privatised.
Concrete examples of these actions are pre-sented in later chapters.
In summary, a housing finance strategy requires a clear statement of objectives, an understanding of local conditions, a sense of how policy and programme features are linked to outcomes, and a plan for generating and applying the resources needed to imple-ment the strategy (Mayo et al., 1986, p.198). Defining objectives at the start of the plan-ning process is necessary to help guide it, but the final objectives will be informed by the results of the analysis undertaken in strategy preparation. In short, objectives setting will be an iterative process.
PRIOR COnDITIOns FOR PREPaRInG a sTRaTEGY
The process detailed below for developing a realistic and actionable national housing finance strategy presumes that some funda-mental conditions exist. Simply stated, mar-ket conditions must be reasonably conducive to long term housing lending to make such an exercise worthwhile. If basic conditions
3.
are not in place, improvements to the housing finance system will be nearly impossible.
Conditions that should be in place to facilitate micro and formal lending include: 3
Support for both micro and formal lending
reasonable macroeconomic stability - high or volatile inflation produces large interest rate risks; stagnate growth restricts the abil-ity of borrowers to make payments
no interest rate controls on mortgage lend-ing; they typically make lending unprofit-able
well-defined and protected property rights through a functioning registration system.
Support for micro lendingLegal support and supervision for Microfinance Institution operations, in-cluding multi-level licensing based on ca-pabilities and mission of the Microfinance Institutions; at the highest level they can be depositories and very strong financial stability. The supervisory authority must have the same competence as the central bank (and indeed could be this agency).
sUPPORT FOR FORMal lEnDInG
no directed credit requirements from the Central Bank to commercial banks for housing lending; banks will lend if such lending is profitable; forced lending is typically ineffective
� The necessity for the various conditions in this list has been stated
by Buckley (�994), Jaffee and Renaud (�997), Tomlinson (2007), UN
Habitat (2005), p.55.

1�
no large government lending programs that make long-term housing finance avail-able at below-market interest rates because lenders will not want to try to compete with the cheap money and poor repayment collection rates
the basic legal system for lending in place including a serviceable mortgage law and a functioning, and at least moderately ef-ficient, foreclosure system to increase the certainty and reduce the cost to lenders.
In the absence of these conditions, develop-ment of a full housing finance strategy is not advisable. Rather, a strategic exercise focused squarely on these problems should be pre-pared. When these impediments are in the process of being resolved, a full strategy can be developed.
THEsE GUIDElInEs
The following presentation is focused squarely on increasing the volume of finance available to all market segments in an economically sustainable way. This focus is maintained by not explicitly covering several closely related topics, particularly
the “real side” of the housing market, i.e. provision of sufficiently serviced land for housing, presence of reasonable housing construction standards, or an efficient housing construction sector
broadly reviewing the current state of housing finance development or identify-ing which type of lender may be the most efficient or effective in a given circumstance, i.e. savings association or commercial bank (more information on this topic can be found in UN-HABITAT (2002) Chapter 1 and UNHABITAT (2005)
examining subsidies that operate outside the financial system for low income house-holds to improve their housing conditions, e.g. the direct construction of rental hous-ing for this group.
Overall, the presentation consists of three parts.There are two more chapters to this first part that give an overview of a national housing finance strategy. Part II’s four chap-ters detail how such a strategy is prepared on a step-by-step basis. And Part III discusses the development and implementation of the Action Plan.

1�
02WHaT a sTRaTEGY DOEs
A housing finance strategy is important as a device for organising and formalising think-ing about how to more efficiently employ a country’s housing finance resources and to expand them. It provides a focal point for such thinking and results in a realistic action plan that can be implemented over the years.
Few strategies have been published. This is be-cause there are working documents for single countries, and not a generic document that is formally published. It does reflect the reality that not many have been prepared, presum-ably because this is a substantial undertaking. By contrast, numerous examples have been published about broad advice on mortgage sector development and strategy statements for improving the volume and access to hous-ing finance for a particular market segment (for example, Chan et al. (2003), Ikejiofor (1998), Mayo, Malpessi, and Gross (1986), Pugh (1994), Ferguson and Navarrete (2003), Siembieda and Moreno (1997), and Mints (2004)).
an IllUsTRaTIOn
A good way to understand a strategy’s util-ity is to examine one. Tanzania prepared a strategy in 2003, although it was not formally labeled as such (Government of Tanzania and UN HABITAT, 2003). At the time, the basic
conditions for the development of a housing finance system were barely met in the country. The strategy appropriately devoted most of its attention—especially in the action plan—to steps that would address these fundamental impediments to system development.
Some context for the strategy is provided in the figures in Tables 2.1 and 2.2 for Dar es Salaam. In 1990, (the latest date for which data were available in 2003),the majority of dwellings acquired in both the formal and informal sectors were constructed by simple laborers (fundis). Units constructed by own-ers (sometimes with hired help) accounted for 11 percent in the formal and 32 percent in the informal sectors, respectively. Only 22 percent of occupants obtained their units by inheritance or by purchasing an existing unit—a tribute to the city’s rapid growth.
Only 8 percent of formal sector units were built using construction loans from finan-cial institutions, especially the government housing bank, which accounted for only 8 percent of formal sector units. Savings were overwhelmingly the most common source of construction funds, accounting for 58 percent of all units. In interpreting these figures it is important to know that 56 percent of house-holds in Dar were room renters at this time and another 17 percent were unit renters.

1�
TablE 2.1 HOUsE aCQUIsITIOn In DaR Es salaaM In 1990 (PERCEnT)
Mode of house acquisition Formal sector Informal sector All owners
Owner constructed �� �2 24
Constructed by fundis 56 5� 54
Contractor-built -- � �
Bought house from previous owner �� 4 8
Inherited the house �9 9 ��
Other means � � �
Source: Government of Tanzania – UN-Habitat (2003)
TablE 2.2 sOURCEs OF FUnDs FOR DWEllInG COnsTRUCTIOn (PERCEnT)
source of funds Formal sector Unplanned sector all owners
Savings 6� 56 58
Selling assets 9 � 5
Loan from friends 7 � 4
Loan from employer � � �
Credit union 2 � �
Tanzania Housing Bank 6 2 4
Unspecified �2 �4 25
Source: Government of Tanzania – UN-HABITAT (2003)
Loans from the Tanzania Housing Bank, es-sentially the only lender and now defunct, was reported by only 6 percent of those construct-ing formal sector housing and 2 percent of those constructing in the informal sector.
The strategy report’s content is outlined in Box 2.1. It spent a good deal of time documenting the existing problems in the housing sector as well as in the provision of housing finance, and it explains in some cases how these conditions arose. The report spent comparatively little energy on preparing estimates of potential effective housing finance demand. This was
appropriate given the housing finance sector’s state of development.
Clearly the report’s most important contribu-tion has been the accurate identification of the principal problems and the assignment of responsibility to organisations for their reso-lution - a real action plan. The actions to be taken are stated in the report as well.
Did the planning exercise make any difference? No follow-up report documents the degree to which the action plan was executed. But one can compare the state of development of the
1�
housing finance system in 2007 with that of 2002 and the extent to which legal changes called for in the action plan have been ac-complished.
The following points provide an overview of the mid-2006 status:
Critically, macroeconomic stability had been restored. Inflation had dropped from 30 percent early in the decade to 4.2 percent at the end of 2005. This stability makes long-term lending much more at-tractive to banks.
Formal sector housing lending remained minimal, owing primarily to worries of excessive credit risk.
The micro finance sector’s regulatory structure had been notably strengthened and major Microfinance Institutions were about to become depositories. A clear objective of the regulatory improvements was to make banks more willing to provide micro lenders with term loans, although funds had yet to start flowing. While explicit housing loan products had yet to be introduced, a share of loans nomi-nally for other purposes was being used for housing construction and improvement. (Information from Merrill and Tomlinson (2006).)
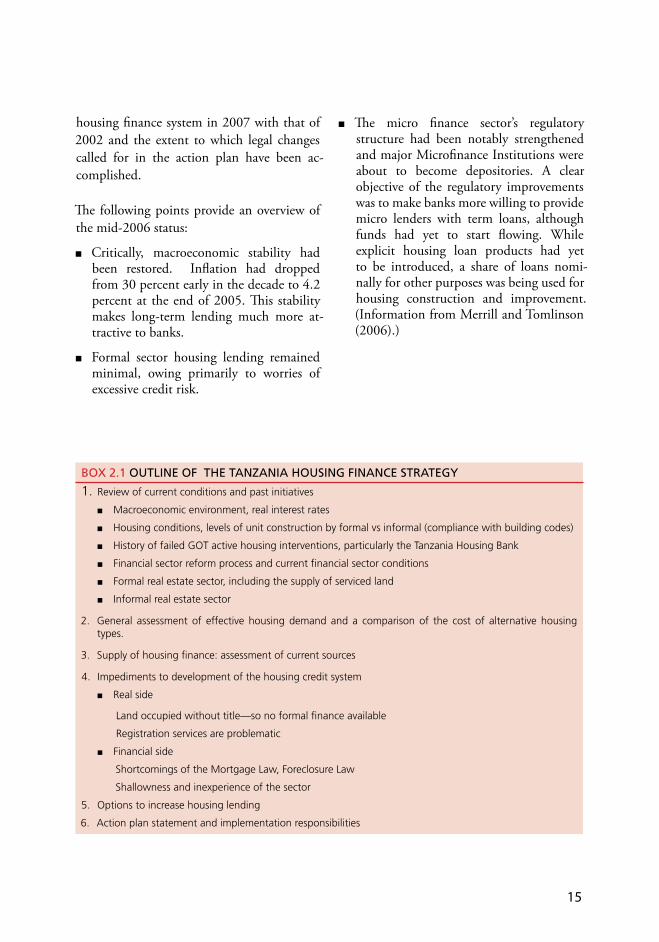
bOX 2.1 OUTlInE OF THE TanZanIa HOUsInG FInanCE sTRaTEGY
Review of current conditions and past initiatives
Macroeconomic environment, real interest rates
Housing conditions, levels of unit construction by formal vs informal (compliance with building codes)
History of failed GOT active housing interventions, particularly the Tanzania Housing Bank
Financial sector reform process and current financial sector conditions
Formal real estate sector, including the supply of serviced land
Informal real estate sector
General assessment of effective housing demand and a comparison of the cost of alternative housing types.
Supply of housing finance: assessment of current sources
Impediments to development of the housing credit system
Real side
Land occupied without title—so no formal finance available
Registration services are problematic
Financial side
Shortcomings of the Mortgage Law, Foreclosure Law
Shallowness and inexperience of the sector
Options to increase housing lending
Action plan statement and implementation responsibilities
�.
2.
�.
4.
5.
6.

1�
Table A.1 presents a more detailed status re-view of selected legal changes called for in the Action Plan by listing the changes called for in 2003 and the relevant laws in 2007. (This sum-mary draws on Rabenhorst and Butler (2007) and inputs from one of the authors.) Progress has been mixed at best. Notable progress has been achieved in three areas: (i) positioning micro lenders to make housing loans and obtain finance from commercial banks; (ii) implementation of a legal regularisation programme for spontaneous settlements; and (iii) making significant progress in preparing the way for a secondary mortgage facility. The first two reforms are particularly important because they may result in a dramatic expan-sion of credit to households not qualifying for bank housing finance.
While these three actions are encouraging, one must also note that the other dozen called-for actions listed in the table have seen little progress. Perhaps most damaging is the lack of revision on key provisions in the mortgage law. A mortgage market Task Force created in 2006 is now working on these issues and progress is expected.
lEssOns
The Tanzania example makes three important points:
a strategy can directly or indirectly serve as an organising device in a concerted effort to strengthen and develop a country’s housing finance system. Real improvements can and do follow. In most countries achiev-
i.
ing the kind of change called for in a strategy is challenging.
a country can develop a strategy with varying degrees of precision that requires varying level of re-sources. Much of the material in the following chapters addresses techni-cal analysis. The limited range of borrowers served and the many of the key impediments to expanded lending will be evident with com-paratively simple analysis. Beyond this, better analysis is desirable; but more important is developing the strategy collegially to attract all the key stakeholders and obtain an agreed action plan that has a solid chance of being implemented.
strategies take time to come to reali-sation. Key actions are often those requiring changes in a nation’s law or the creation of new institutions. Passing the necessary legislation is time consuming. In countries with a Civil Code legal structure, the Code itself may need to be modified which is a difficult undertaking. Creation of new institutions, such as a credit bureau or secondary market facili-ties, is a major undertaking requir-ing several years at best. The time required to realize a plan should inform action plan schedules and expectations in the strategy prepara-tion process if disappointment is to be avoided.
ii.
iii.

1�
sTRaTEGY OVERVIEW
Successful housing finance strategy develop-ment has two co-equal elements: technical analysis and developing support in the finan-cial community (broadly defined), relevant government agencies, and consumer-oriented non-governmental organisaions. This chapter briefly outlines the two components of a framework for a more detailed presentation.
THE TECHnICal ElEMEnTs
There are five basic technical tasks for prepar-ing a housing finance strategy.
1. Define concrete objectives. Although this is listed first, and some general goals should be defined when the project is launched, realistic objectives will be defined on the basis of the information developed in steps 2 through 5. This is an interative process.
2. Identify housing finance demand segments. Housing affordability is defined by savings levels (downpayments), income with which monthly loan repayments can be made, and loan terms. Separate estimates are for owners and renters and for principal locations, e.g., the capital, other cities, and rural areas. The result is an estimate for each market segment
03
of the annual volume of finance required to meet demands.
3. Document the current supply of housing fi-nance. Three sets of questions are addressed:
Who gets loans from which lenders and on what terms? What lenders’ practices may be limiting access? (Lenders include banks, formal non-bank institutions, and Microfinance Institutions.)
What are lenders’ sources of funds and how elastic are they, i.e. could they ex-pand to meet a larger demand or does expansion need to be included in the strategy?
For each type of lender, what is the ef-ficiency in loan origination, servicing, overall operations, and risk manage-ment?
4. Identify the gaps between demand and sup-ply. This should be done by segment and one should identify impediments to a greater volume of finance in segments where demand far outstrips supply.
a.
b.
c.

1�
5. Develop creative responses to the gaps defined, select an approach, and codify it into an action programme.
These topics are covered in Chapters 4-6.
THE “POlITICal PROCEss”
Without wide-based support in the financial community, including the Central Bank, among consumers, and within government agencies even the best technical analysis for a housing finance strategy will have little effect. Donor-led strategy efforts face particular chal-lenges in coalition building.
The natural tendency will be to look first and foremost for leadership in government agen-cies and the major commercial banks and other major players in the formal financial market. This is necessary and appropriate be-cause of the resources they command. But it is far from sufficient. For a strategy to be effec-tive it must comprehensively cover all market segments, especially the micro-lenders serving lower income families with smaller credits. These lenders and consumers, represented by Microfinance Institutions and the relevant non-governmental organisations, must as well be full partners in the process. Without the full range of participants, the strategy is very likely to address the needs of only upper income households in many developing countries. Securing the kind of broad support and buy-in essential for development and implementation is a much greater challenge than executing the technical analysis.
Below is a list of questions for those consider-ing preparing a strategy. Questions that need answers in order to structure the process and ensure a successful outcome.
Who are the primary stakeholders and why?
Who has necessary motivation and prestige to lead the exercise?
How can one engage the stakeholders?
How will they participate in the process?
Who prepares the strategy?
How is the strategy’s preparation financed?
After agreement on the strategy for improve-ment, how will it be implemented? Who will be responsible? With what resources?
Who will monitor the implementation?
The process of motivating and organising the strategy’s development and implementation is the topic of chapters 7-9.

1�
PaRT II
PREPaRInG THE sTRaTEGY

�0

�1
THE DEManD FOR HOUsInG FInanCE
Understanding the purchasing power - the effective housing demand - of households is fundamental to valid housing strategy prepa-ration. Preparing this part of the strategy is challenging mostly because of the data require-ments. But leaving these aside, demanding es-timations can be mechanical exercise that falls short of providing important insights into the current situation and future possibilities. The key step is to prepare an overview of current conditions to orient the analysis.
CURREnT COnDITIOns
A modest number of facts can provide a clear understanding of the basic housing conditions in a country. These facts include
The degree of urbanisation and the impor-tance of the largest 3-5 cities—the share of the population living in officially defined urban areas and the share living in the larg-est few cities (usually there is a clear break between the size of the largest 1-5 cities and other smaller ones).
The distribution of households in the largest cities, other urban areas, and rural areas among different tenure forms, rang-ing from formal home ownership to room renters in informal dwellings.
The share of dwellings in the three location groups that meet minimum standards in terms of construction materials and provi-sion of public services.
The growth in the number of households by location over the past 20 years and the forecast for the next 15-20 years.
Armed with this information, the results of the demand estimates can be more intel-ligently interpreted.
EsTIMaTInG HOUsInG DEManD
The demand for housing finance is derived from households’ (owners’ and renters’) demand for housing services, and from the desire of owners to invest in housing as an asset. Because owners and renters have different housing objectives, the amount of income they are willing to devote to housing usually differs, with owners willing to spend more. Similarly, families living in rural areas generally have different housing requirements and needs than their urban counterparts. This leads to differences in the share of households who own their units and in the share of in-come and the amount spent on expenses.
There is a good deal of experience in making affordability calculations, where the loan amount for households for different income groups is based on their income and loan terms. This information, combined with as-sumptions about downpayments, yields an estimate of the dwelling price each particular
04

��
household group can afford. The following list determines the number of loans for which there is demand and then the amount of financing required to meet those demands. Annex B contains a detailed exposition on how to make such estimates.
Steps in computing housing finance demand, with separate estimates prepared for house-holds who will want to own their homes and those who will be renters:
Determine the amount of money each in-come group is prepared to spend monthly on housing.
Estimate the average loan size each income group could take, using the expenditure information from the previous step.
Estimate the annual number of loans that will be sought, based on information on household formation, complex households that experience a family moving out, the number of households trading up to better units, and the number of households who will be continuing to develop their units or upgrade their completed units.
The product of the loan size and number of loans sought gives the overall demand esti-mate and the target for the development of corresponding housing finance supply.
A critical attribute of the estimates discussed above is that they cover the whole market, not just the market for formal finance, which is the focus of most housing finance demand estimates.
As stated earlier, these calculations ideally should be done for owner-occupied and rental housing in each type of location where there are systematic differences in the purchasing power of the households (including both household incomes and the terms on which
1.
2.
3.
4.
loans are available) or in the price of dwellings that would qualify for formal finance.
The conclusion of this analysis is an estimate of loan volume for 2-3 years in the future, or sev-eral estimates that vary with the assumptions about the extent of institutional development achieved, of the required volume of lending by location, tenure, and income group. These are the targets that policymakers will design a strategy to achieve.
COnsTRUCTIOn PERIOD FInanCE
This type of finance provides interim funds for building. These loans are paid off when units are sold to owner-occupants, with the developer using the sale proceeds to make the payment, or when landlords obtain per-manent financing for the investment portion they do not fund with equity. In fact, in many countries loans from formal lenders for the full development of multi-family or single family buildings constitute a small share of total construction finance. In the informal sec-tor most construction is incremental, and its funding has already been accounted for in the computations presented above. Additionally, developers of formal dwellings often obtain much of their construction finance through advanced payments from the ultimate pur-chasers.
In most transition and developing countries, construction period loans are often made only on more prestigious projects and even then only for a minority of the total cost. Lenders have found it difficult to underwrite these loans and to control payments, leaving them vulnerable to credit risk. Market assessment
��
has proved challenging and many lenders have suffered significant losses when they approved loans at the top of a construction boom only to see the market collapse and loans turn sour. Numerous lenders have released funds too quickly compared to construction progress and been unable to recover the funds when the builder has decided to stop construction for whatever reason.
It is evident that it is challenging to estimate the volume of construction finance needed and the amount that will actually be supplied. Many central banks do not gather separate information on this kind of lending. Even tracking recent lending levels is problematic. In these circumstances, the best basis for de-termining near-term future loan levels and what is needed to promote more of this kind of lending, is discussions with both develop-ers and lenders about their recent experiences, problems of obtaining and making loans, and future plans.
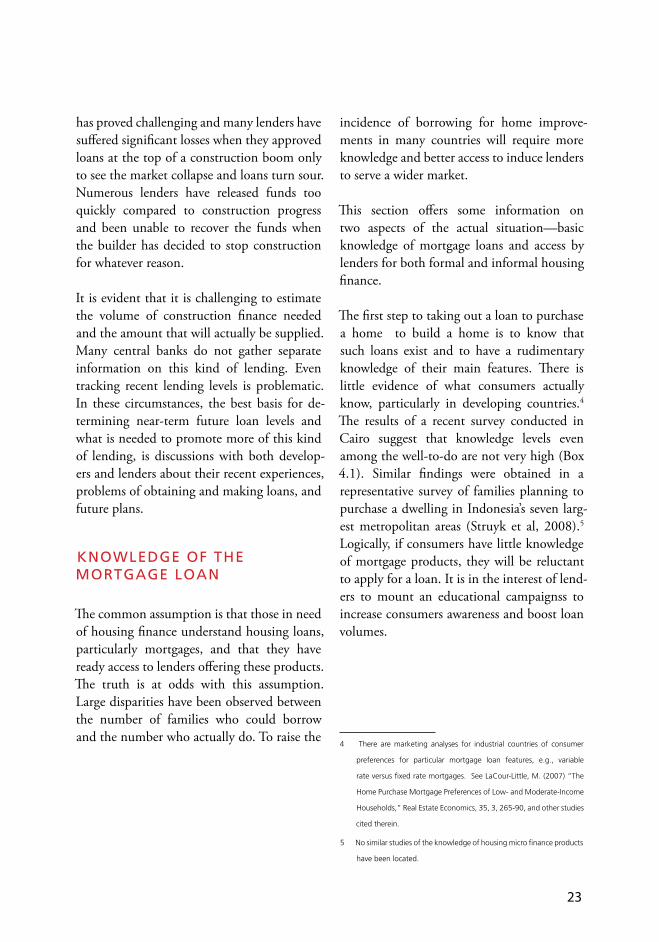
KnOWlEDGE OF THE MORTGaGE lOan
The common assumption is that those in need of housing finance understand housing loans, particularly mortgages, and that they have ready access to lenders offering these products. The truth is at odds with this assumption. Large disparities have been observed between the number of families who could borrow and the number who actually do. To raise the
incidence of borrowing for home improve-ments in many countries will require more knowledge and better access to induce lenders to serve a wider market.
This section offers some information on two aspects of the actual situation—basic knowledge of mortgage loans and access by lenders for both formal and informal housing finance.
The first step to taking out a loan to purchase a home to build a home is to know that such loans exist and to have a rudimentary knowledge of their main features. There is little evidence of what consumers actually know, particularly in developing countries.4 The results of a recent survey conducted in Cairo suggest that knowledge levels even among the well-to-do are not very high (Box 4.1). Similar findings were obtained in a representative survey of families planning to purchase a dwelling in Indonesia’s seven larg-est metropolitan areas (Struyk et al, 2008).5 Logically, if consumers have little knowledge of mortgage products, they will be reluctant to apply for a loan. It is in the interest of lend-ers to mount an educational campaignss to increase consumers awareness and boost loan volumes.
4 There are marketing analyses for industrial countries of consumer
preferences for particular mortgage loan features, e.g., variable
rate versus fixed rate mortgages. See LaCour-Little, M. (2007) “The
Home Purchase Mortgage Preferences of Low- and Moderate-Income
Households,” Real Estate Economics, �5, �, 265-90, and other studies
cited therein.
5 No similar studies of the knowledge of housing micro finance products
have been located.

��
bOX 4.1 KnOWlEDGE OF THE MORTGaGE lOan In CaIRO
The use of mortgages to purchase a house is nascent in Egypt. Clearly, the first step in activating consumers to
take out a mortgage is for them to understand this instrument. The results reported here are from a February
2007 survey of 504 Cairo consumers from the middle socio-economic bracket who stated that they planned
to purchase a unit in the next three years or had purchased a unit in the previous five years. The survey was
designed to determine their understanding and knowledge of mortgage loans and their attitude towards them.
This is not a representative sample.The findings give the upper limit on knowledge levels.
About �5 percent of respondents reported having heard or read something in the past year about taking out
a mortgage. This is a fairly high penetration rate and indicates that the concerted marketing campaigns of the
prior years were reasonably successful. Of those who had heard something on the topic, close to half stated
that they had paid close attention to the information or had carefully considered whether a mortgage would
be a good thing. Such a high rate of close attention indicates that many in the sample population have a real
interest in the subject, as one would expect from recent and would-be home purchasers.
Respondents demonstrated only a low to modest understanding of mortgages, as ascertained from responses
to an open-ended question asking them to say what a mortgage is. However, respondents scored higher on
their knowledge of specific knowledge loan features, such as the consequences of not making payments on
time, and the maximum share of income that could be used for monthly payments according to the law.
The results of regression analysis of actual knowledge of mortgages indicate that exposure to information on
this instrument, and the amount of attention consumers pay to it have been key in shaping knowledge and
attitudes. The respondent’s socio-economic class and age, or even participation in a registration, on the other
hand, has had little bearing. The findings highlight the important role that education campaigns and media
coverage have played in informing the population. They also indicate that experience with home purchase
mortgages and property registration is so limited that even among households from higher socio-economic
groups, understanding and knowledge of these instruments are not common. Both points argue for the con-
tinuation of campaigns to inform the public.
Source: Struyk (2007)
��
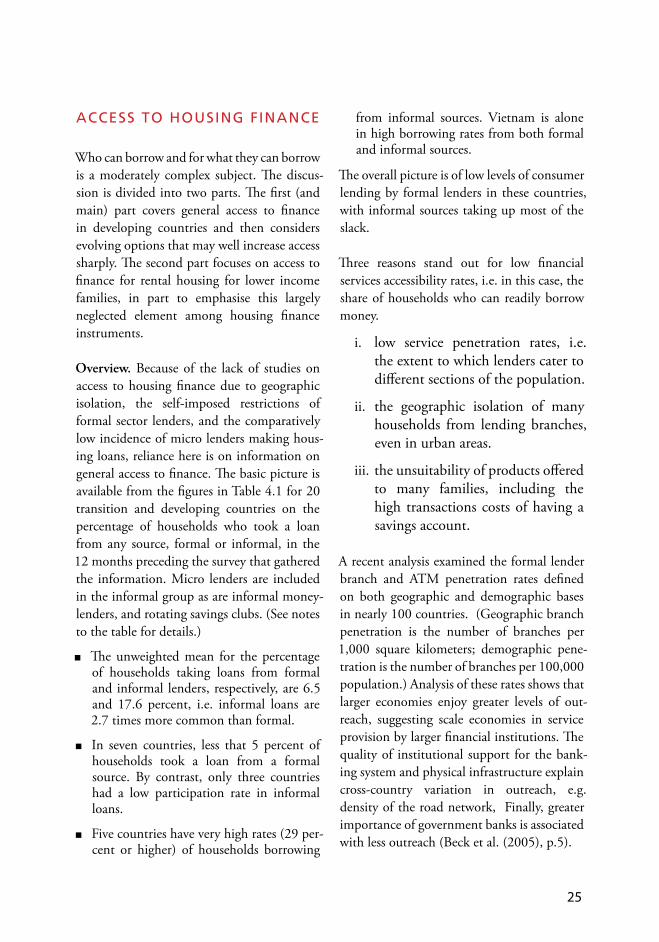
aCCEss TO HOUsInG FInanCE
Who can borrow and for what they can borrow is a moderately complex subject. The discus-sion is divided into two parts. The first (and main) part covers general access to finance in developing countries and then considers evolving options that may well increase access sharply. The second part focuses on access to finance for rental housing for lower income families, in part to emphasise this largely neglected element among housing finance instruments.
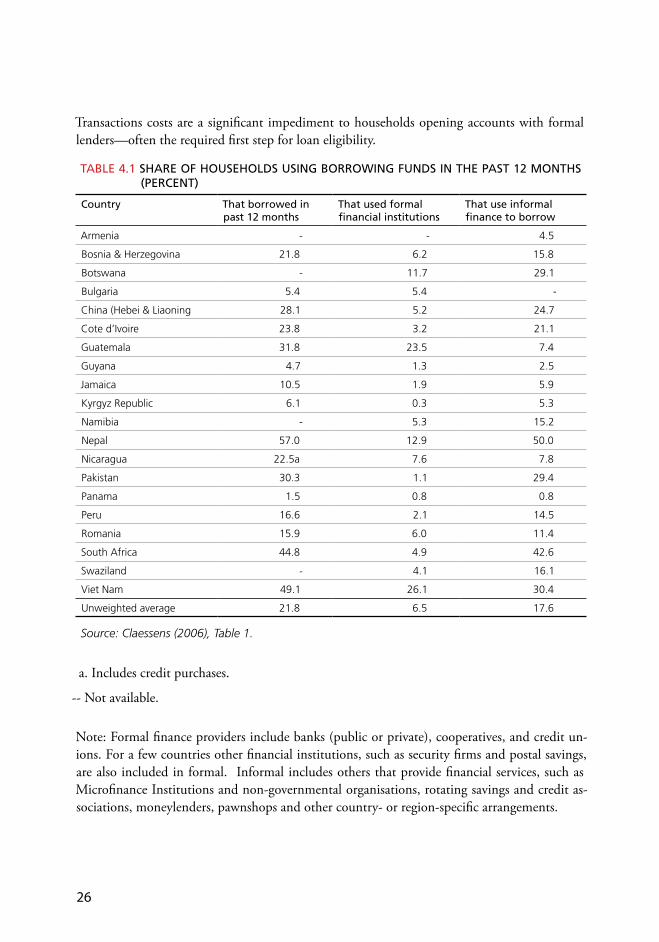
Overview. Because of the lack of studies on access to housing finance due to geographic isolation, the self-imposed restrictions of formal sector lenders, and the comparatively low incidence of micro lenders making hous-ing loans, reliance here is on information on general access to finance. The basic picture is available from the figures in Table 4.1 for 20 transition and developing countries on the percentage of households who took a loan from any source, formal or informal, in the 12 months preceding the survey that gathered the information. Micro lenders are included in the informal group as are informal money-lenders, and rotating savings clubs. (See notes to the table for details.)
The unweighted mean for the percentage of households taking loans from formal and informal lenders, respectively, are 6.5 and 17.6 percent, i.e. informal loans are 2.7 times more common than formal.
In seven countries, less that 5 percent of households took a loan from a formal source. By contrast, only three countries had a low participation rate in informal loans.
Five countries have very high rates (29 per-cent or higher) of households borrowing
from informal sources. Vietnam is alone in high borrowing rates from both formal and informal sources.
The overall picture is of low levels of consumer lending by formal lenders in these countries, with informal sources taking up most of the slack.
Three reasons stand out for low financial services accessibility rates, i.e. in this case, the share of households who can readily borrow money.
low service penetration rates, i.e. the extent to which lenders cater to different sections of the population.
the geographic isolation of many households from lending branches, even in urban areas.
the unsuitability of products offered to many families, including the high transactions costs of having a savings account.
A recent analysis examined the formal lender branch and ATM penetration rates defined on both geographic and demographic bases in nearly 100 countries. (Geographic branch penetration is the number of branches per 1,000 square kilometers; demographic pene-tration is the number of branches per 100,000 population.) Analysis of these rates shows that larger economies enjoy greater levels of out-reach, suggesting scale economies in service provision by larger financial institutions. The quality of institutional support for the bank-ing system and physical infrastructure explain cross-country variation in outreach, e.g. density of the road network, Finally, greater importance of government banks is associated with less outreach (Beck et al. (2005), p.5).
i.
ii.
iii.
��
Transactions costs are a significant impediment to households opening accounts with formal lenders—often the required first step for loan eligibility.
TablE 4.1 sHaRE OF HOUsEHOlDs UsInG bORROWInG FUnDs In THE PasT 12 MOnTHs (PERCEnT)
Country That borrowed in past 12 months
That used formal financial institutions
That use informal finance to borrow
Armenia - - 4.5
Bosnia & Herzegovina 2�.8 6.2 �5.8
Botswana - ��.7 29.�
Bulgaria 5.4 5.4 -
China (Hebei & Liaoning 28.� 5.2 24.7
Cote d’Ivoire 2�.8 �.2 2�.�
Guatemala ��.8 2�.5 7.4
Guyana 4.7 �.� 2.5
Jamaica �0.5 �.9 5.9
Kyrgyz Republic 6.� 0.� 5.�
Namibia - 5.� �5.2
Nepal 57.0 �2.9 50.0
Nicaragua 22.5a 7.6 7.8
Pakistan �0.� �.� 29.4
Panama �.5 0.8 0.8
Peru �6.6 2.� �4.5
Romania �5.9 6.0 ��.4
South Africa 44.8 4.9 42.6
Swaziland - 4.� �6.�
Viet Nam 49.� 26.� �0.4
Unweighted average 2�.8 6.5 �7.6
Source: Claessens (2006), Table 1.
a. Includes credit purchases.
-- Not available.
Note: Formal finance providers include banks (public or private), cooperatives, and credit un-ions. For a few countries other financial institutions, such as security firms and postal savings, are also included in formal. Informal includes others that provide financial services, such as Microfinance Institutions and non-governmental organisations, rotating savings and credit as-sociations, moneylenders, pawnshops and other country- or region-specific arrangements.
��
In this context, a notable success has been in South Africa and its so-called Mzansi account, with 3.3 million savers opening accounts in the first 18 months. The account is a basic, standardizsd debit card-based transactional and savings account. All that is required to open the account is a valid ID. To keep costs down and to ensure that the account is easy to use, transactions are limited to deposits, withdrawals and debit card payments—the account includes a debit card that can be used at retail outlets. No management fees are charged and one free deposit per month is permitted.
Mobile and cell phone banking holds the promise of sharply increasing the share of households with a deposit account with a formal financial institution. The need for improved access is particularly prominent in rural areas, but significant areas of major cities are underserved as well. One approach is the use of mobile banking where the volume of business does not justify opening a branch of-fice. There is notable positive experience with this approach (Box 4.2).
The promise of mobile banking for mortgage origination has been realised by HDFC-India, a major formal sector lender, for a number of years. Its agents visit villages on a regular basis to collect deposits and take loan applications. This technique has been an important element in its overall lending strategy.
Lastly, cell phone banking is being utilised in some places and shows promise. Certain South African financial institutions intro-duced “m-banking” options from about 2004 and marketed them strongly. An analysis of this experience found that by 2006 it had not resulted in a major increase in the number of households with formal banking relationships.
In part, this was due to substantial ignorance about the product despite information campaigns. On the other hand, the analysis points out that since about one-third of the
“unbanked” have cell phones, there is reason to anticipate expansion (Porteous, 2007).
The future role of information and commu-nications technologies in increasing access by the poor to banking services appears posi-tive but a good deal of uncertainty remains. Conclusions based on a recent survey of cur-rent practices and the experience of 62 finan-cial institutions in developing countries with information and communications technolo-gies are that so far not many new customers are being attracted to these services, although some poor households are using them. The profitability of banks remain uncertain. 6
Rental housing. The topic is the extent of ac-cess of small investors to finance to develope rental rooms or units. Where rentals are widely accepted as an adequate and permanent hous-ing solution, encouraging the development of such housing through the availability of finance will be an important element in a housing finance strategy.
There is no information on the extent of either the demand for or the supply of funds for this purpose. Discussions about micro housing finance lending focus on funds for the devel-opment or improvement of owner occupied units. It may well be that a significant share of the micro small and medium enterprise lending that is diverted to housing goes to the construction of rental rooms or units. But the information is lacking.
6 Analysis details and a list of the financial institution respondents are in
Ivatury, G. (2006) Using Technology to Build Inclusive Finance Services.
Washington, DC: CGAP Focus Note no. �2 .

��
bOX 4.2 MObIlE banKInG REInVEnTED
Kenya’s Equity Bank holds a prominent position among those interested in outreach to the poor. One reason
for this is the practical reintroduction of a relatively simple technology brought up to date: the mobile banking
unit. In 2006, the bank was doubling its number of vans and expected to have �00 in operation by the end of
year. Each van is equipped with laptops that have telecommunication links to a fixed branch, allowing the van
to provide a wide range of banking services. The standard schedule is for a mobile unit to visit each location
once a week. By mid-200�, two-thirds of the loans outstanding were to clients served through mobile banking
units.
Source: Honohan and Beck (2007), p. 155.

��
HOUsInG FInanCE sUPPlY
THE bIG PICTURE
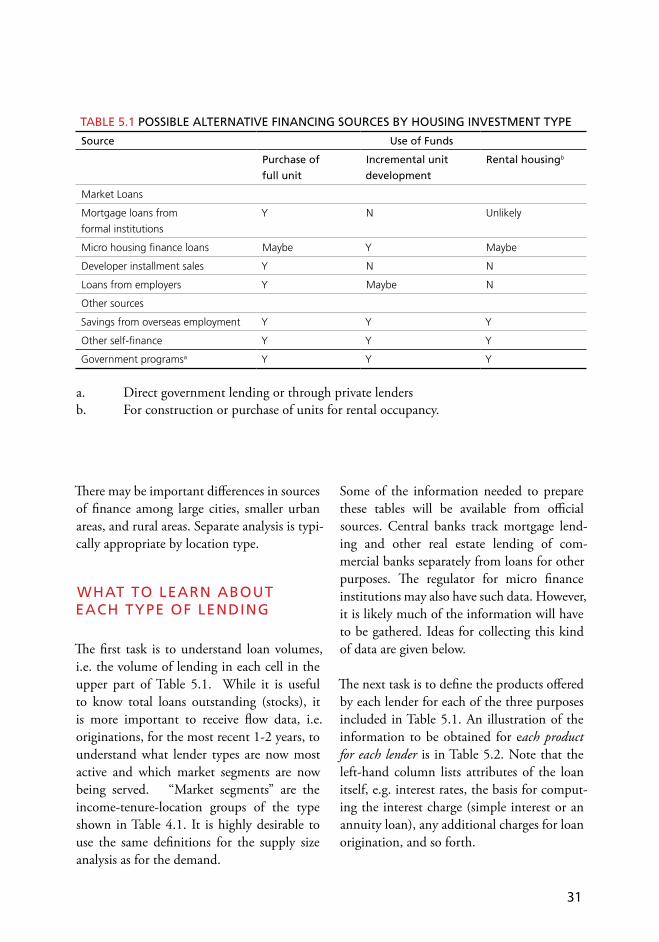
A good starting point is to assess the market for housing lending by understanding which lenders are making housing loans available for what purpose. Table 5.1 illustrates this type of classification. It is useful for identifying the lenders from whom information should be acquired for different types of lending.
The table lists six sources of finance and three possible uses of finance—purchase of a full unit, incremental unit development, and development of rental housing. Financing of rental housing is often overlooked in housing finance discussions, but rentals are an impor-tant tenure form in many countries, despite the fact that mass privatisation of former State-owned housing in Eastern Europe and the former Soviet Union in the 1990s created a dozen or so super home owner states where 80 percent or more of all housing is owner-occupied.7
7 Another source less frequently employed are community funds. Such
a fund is a financial mechanism that encourages savings through
establishing and strengthening local savings groups with the fund
typically used by communities for land purchase, infrastructure and
service investments, and, in some cases, housing construction. For
further description, see UN Habitat. (2002) Financing Adequate
Shelter for All: Addressing the Housing Finance Problem in Developing
Countries. Nairobi: UN Habitat.
The work outlined in the previous chapter will provide a good idea of the volume of funds required by different market segments over the next several years. Here the work shifts to the supply side of the market. The analysis in this case is more critical than on the demand side. In most countries it is obvious that the funds needed to meet effective demand are not available or, if lenders have funds, loans are not being made available. In addition to understanding the current lending patterns, analysis must dig deeper to understand the basis for the current pattern. It is quite pos-sible, for example, for lenders to believe that they are open to serving a wide range of clients, while not realising that their underwriting standards or minimum loan sizes have the effect of excluding most would-be borrowers.
The analysis required consists of several related activities. Overall, it is moderately complex, and it is important for the reader to review all the material and then to go back through it again to be certain that he understands how the pieces fit together. A section at the end of the chapter discusses the comparison of the estimated demand for housing loans and the supply of loans—what is referred to here as the “gap.”
05
�0
As noted in the last chapter, in Dar es Salaam over half of all households are room renters. This pattern is fairly widespread in Africa where rental housing is generally an important housing source (more information on this can be found, for example, in Angel (2002), Angel and Amtapunth (1989), Hoffman (1991), and Ikejiofor (1998).
Non-loan sources of finance are included in the table for good reason: in most develop-ing countries they are the primary source of finance, as seen above for Tanzania. While comprehensive data are lacking, that which is available documents this fact. In 2007, in Cairo, 77 percent of those purchasing units in the past five years reported using cash, i.e. not having a loan. A similar share of Jordanians re-ported all-cash purchases in 1983 (Struyk and Roman (2007)). Remittances are an impor-tant source of savings for dwelling construc-tion or purchase—for both owner occupancy and the development of rentals as an income source. Housing investment is particularly attractive in countries where savings products do not carry competitive interest rates and other investment opportunities to the small investor are limited. The low share of housing finance provided by loans underscores again the need for further development of the hous-ing finance sector in these countries.
In many developing countries, installment sales by developers are a prominent source of dwelling purchase finance. Purchasers must make large up-front payments and install-ments thereafter, which the developer uses to finance construction. Often, as in Egypt,
installment payments continue for several years after the unit is completed. Occupancy may only be permitted when 80 percent or more of all payments due have been made and even then the title deed remains in some cases with the developer until all payments are made (Struyk and Roman (2007)). Similar arrangements are common in Russia and other countries of the Former Soviet Union. In some cases there have been abuses by de-velopers delaying construction while they use the advanced payments for other purposes. Some developers simply disappeared with down-payments.
In some countries, government banks or agencies have been an important source of housing finance. Methods used include: direct loans; down payment subsidies, such as those in Chile, Hungary, and Russia; loans originated by private banks or government lenders at below market interest rates; and, a combination of these options. The different approaches have very different effects on the development of private housing finance as described on page 30.
�1
TablE 5.1 POssIblE alTERnaTIVE FInanCInG sOURCEs bY HOUsInG InVEsTMEnT TYPE
source Use of Funds
Purchase of
full unit
Incremental unit
development
Rental housingb
Market Loans
Mortgage loans from
formal institutions
Y N Unlikely
Micro housing finance loans Maybe Y Maybe
Developer installment sales Y N N
Loans from employers Y Maybe N
Other sources
Savings from overseas employment Y Y Y
Other self-finance Y Y Y
Government programsa Y Y Y
a. Direct government lending or through private lendersb. For construction or purchase of units for rental occupancy.
There may be important differences in sources of finance among large cities, smaller urban areas, and rural areas. Separate analysis is typi-cally appropriate by location type.
WHaT TO lEaRn abOUT EaCH TYPE OF lEnDInG
The first task is to understand loan volumes, i.e. the volume of lending in each cell in the upper part of Table 5.1. While it is useful to know total loans outstanding (stocks), it is more important to receive flow data, i.e. originations, for the most recent 1-2 years, to understand what lender types are now most active and which market segments are now being served. “Market segments” are the income-tenure-location groups of the type shown in Table 4.1. It is highly desirable to use the same definitions for the supply size analysis as for the demand.
Some of the information needed to prepare these tables will be available from official sources. Central banks track mortgage lend-ing and other real estate lending of com-mercial banks separately from loans for other purposes. The regulator for micro finance institutions may also have such data. However, it is likely much of the information will have to be gathered. Ideas for collecting this kind of data are given below.
The next task is to define the products offered by each lender for each of the three purposes included in Table 5.1. An illustration of the information to be obtained for each product for each lender is in Table 5.2. Note that the left-hand column lists attributes of the loan itself, e.g. interest rates, the basis for comput-ing the interest charge (simple interest or an annuity loan), any additional charges for loan origination, and so forth.
��
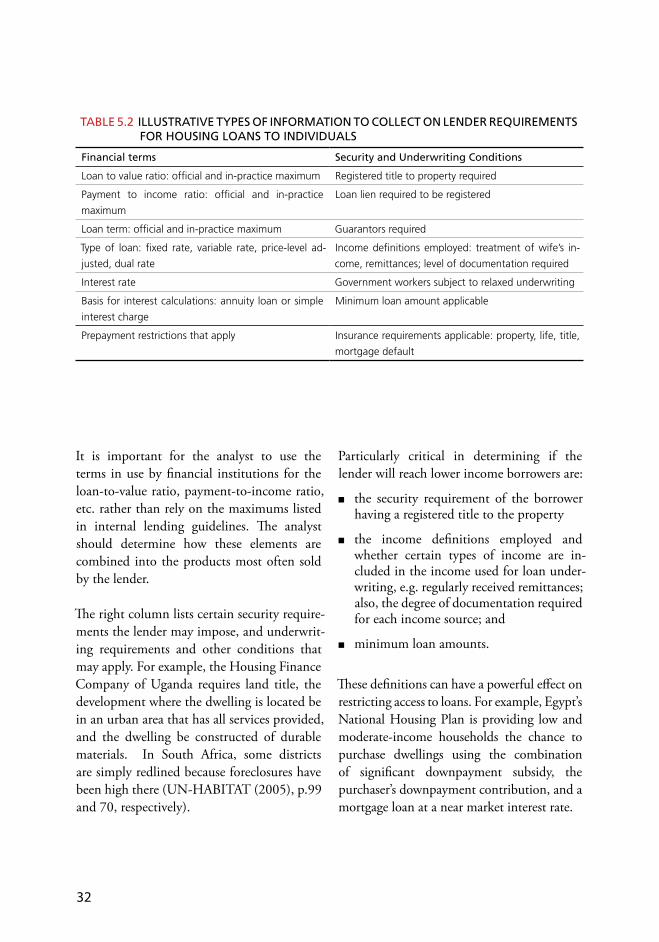
TablE 5.2 IllUsTRaTIVE TYPEs OF InFORMaTIOn TO COllECT On lEnDER REQUIREMEnTs FOR HOUsInG lOans TO InDIVIDUals
Financial terms security and Underwriting Conditions
Loan to value ratio: official and in-practice maximum Registered title to property required
Payment to income ratio: official and in-practice
maximum
Loan lien required to be registered
Loan term: official and in-practice maximum Guarantors required
Type of loan: fixed rate, variable rate, price-level ad-
justed, dual rate
Income definitions employed: treatment of wife’s in-
come, remittances; level of documentation required
Interest rate Government workers subject to relaxed underwriting
Basis for interest calculations: annuity loan or simple
interest charge
Minimum loan amount applicable
Prepayment restrictions that apply Insurance requirements applicable: property, life, title,
mortgage default
Particularly critical in determining if the lender will reach lower income borrowers are:
the security requirement of the borrower having a registered title to the property
the income definitions employed and whether certain types of income are in-cluded in the income used for loan under-writing, e.g. regularly received remittances; also, the degree of documentation required for each income source; and
minimum loan amounts.
These definitions can have a powerful effect on restricting access to loans. For example, Egypt’s National Housing Plan is providing low and moderate-income households the chance to purchase dwellings using the combination of significant downpayment subsidy, the purchaser’s downpayment contribution, and a mortgage loan at a near market interest rate.
It is important for the analyst to use the terms in use by financial institutions for the loan-to-value ratio, payment-to-income ratio, etc. rather than rely on the maximums listed in internal lending guidelines. The analyst should determine how these elements are combined into the products most often sold by the lender.
The right column lists certain security require-ments the lender may impose, and underwrit-ing requirements and other conditions that may apply. For example, the Housing Finance Company of Uganda requires land title, the development where the dwelling is located be in an urban area that has all services provided, and the dwelling be constructed of durable materials. In South Africa, some districts are simply redlined because foreclosures have been high there (UN-HABITAT (2005), p.99 and 70, respectively).
��
To simplify verification of income eligibil-ity, the only acceptable applicants are those whose income can be readily verified. This omits around 40 percent of all those believed to be eligible for both the grants and loans (Sims, 2007).
It would certainly be a mistake to think that these restrictions are special to developing economies. Stephens has documented a host of restrictions among European Union mortgage lenders, and red-lining is an oft-dis-cussed phenomenon in the U.S. (see, respec-tively, Stepens (2004) and Avery et al. (1999)). Further, it is likely that these restrictions will multiply in the U.S. over the next few years in response to the sub-prime mortgage crisis.
As will be discussed in the next chapter, in-formation on the points listed in Table 5.2 will be extremely valuable in thinking about extending coverage to potential borrowers who are now unserved.
What lending requirements should one obtain from lenders on loans made for rental housing? The financial terms of interest are generally the same as those for unit purchases, except that the payment-to-income ratio will often not be applicable. However, the values will be quite different for many items. For example, loan-to-value ratios are much lower—seldom over 60 percent; and, loan terms are shorter than those for the longer home purchase mortgages, often only a few years.
The differences of home purchase loans are greater when it comes to loan underwriting. One can list four distinctions that are impor-tant to the underwriter:
Is the loan for a rental room being added to the owner’s property, a room being added
1.
to a larger rental property, or for a single family unit?
Is the single family unit for an elite higher income market, including the expatriate market?
Is the loan for a multi-family building for middle-income families?
Is the investor an individual or a com-pany?
If the loan is for something other than room construction, is it for the purchase of an existing property or a new construc-tion?
The foremost underwriting consideration will always be the market analysis—is their a ready market for the unit? n other words, the key question is whether there will be rental income sufficient to cover the loan payments.For small loans to individuals, the underwriting is very similar to that for small and medium enterprise loans. Security of title is another constant requirement. But for new construc-tion loans, with their extended timeframes and added uncertainties and larger multi family projects, other factors have to be care-fully considered. (McCarthy (1996) discusses residential property construction underwrit-ing in the transition economy context.)
The analyst should obtain information on which of these various types of rental housing a lender offers loans. For those for which loans are made, a list of key underwriting factors should be obtained. For those for which loans are not made, inquiries should be made about the reasons because these can feed into a list of impediments that should be addressed when drawing up a housing strategy.
2.
3.
4.
5.

��
Where can the analyst obtain information on loan products, underwriting standards, and other eligibility requirements? The answer differs depending on the type of lender.
For formal sector lenders, the best option is through a survey sponsored by the Central Bank. Central banks are often willing to help gather information this way. For example, the Central Bank of Armenia cooperated in a survey effort with a team preparing a housing finance project for the German KfW agency. If this is not pos-sible, then there are two other options: a trade association, such as the local Bankers Association, which might be willing to survey its members; or interviews with a sample of lenders, especially with the cur-rent major players.
For non-bank financial institutions that are not supervised by the Central Bank, a sample of these lenders will need to be interviewed to obtain the information. Since several regulators may be involved and the number of institutions involved small, it may be more efficient to conduct the survey without investing resources in negotiating with the agencies.
For Micro Finance Institutions the situa-tion may be more complex. The first choice is to solicit sponsorship of a survey by their regulating agency. If not, then interview a sample of lenders. For those that are not regulated, a survey is the only option.
Finally, because installment sales by devel-opers are typically not regulated, interviews with them will be necessary.
Information on which particular market seg-ments are being served will only be available from lenders themselves, probably on an im-pressionistic basis, and/or from a household survey that explicitly inquires about sources of finance for dwelling purchase and incre-mental unit development.
aDDREssInG lEnDER EFFICIEnCY anD RIsK ManaGEMEnT
Housing affordability depends substantially on the price of the loan, i.e. the interest rate. While lending rates on housing are driven substantially by the lender’s cost of funds, other factors play major roles. In particular, poor risk management, low overall efficiency, and weak practices in housing loan origina-tion and servicing can lead to unnecessarily large spreads.
These are important topics, but they are not the central elements in a strategy. They are discussed here because of their importance, and because the presentation may stimulate the thinking of a strategy team. Still, whether to include them as a topic in a strategy, is a matter for discussion among the stakeholders involved in a strategy’s preparation.
As an introduction to the lending efficiency discussion, the information in Table 5.3 pro-vides some interesting information about net interest margins in African banks, banks in the rest of the world, and the composition of the differences between the two. The figures are basis points; net interest margin is defined in the notes to the table.8
African banks’ net interest margins are on average much higher than those for the rest of the world, although it is important to note that many banks in Latin America and Eastern Europe have similar margins. The greater margin can be decomposed into several elements. More than one-third of the African
8 The figures in the table are based on multiple regression analysis. The
discussion in the text draws heavily upon, Honohan, P., and Beck, T.
(2007). Making Finance Work for Africa. Washington, DC: World
Bank, pp. �6-4�.

��
banks’ larger margin is due to provision of the costs of poorly defined and enforced property rights, i.e. foreclosures are difficult and costly to bring to a successful conclusion.
But it also reflects the higher cost of risk as-sessment because of the lack of a strong infra-structure, including effective credit bureaus. African banks’ relative small sizes work against them, denying them economies of scale.
Volatile inflation, reflecting macroeconomic instability, adds to the difference because it increases the likelihood of interest rate mismatches. The lower banks’ capabilities in managing these risks, the greater the interest rate spread they will need to provide a suf-ficient cushion against possible changes in the inflation rate.
One element in “other bank characteristics” is fee income, higher levels of which may reduce the importance of interest income and raise expenses as more resources are devoted to capturing the fees. The “African residual,” i.e. the basis points that cannot be attributed to the factors just discussed, is fairly small and may reflect more limited competition in Africa. The broad patterns in the table for administrative costs are similar to those for the interest margin.
Overall, these figures suggest that for African banks, substantial efficiency increases are possible. They also reinforce the necessity for strong property rights as a pre-condition for low margin lending. Of course, banks in all regions could be more efficient. This analysis happens to focus on Africa.
TablE 5.3 nET InTEREsT MaRGInsa In InTERnaTIOnal COMPaRIOn
Interest margin (basis points) Administrative costsb (basis points)
Total
African banks 800 650
Rest of the world 480 480
Difference �20 �80
Of which:
property rights protection ��0 40
bank size 70 50
other bank characteristics -40 70
inflation �00 �0
Africa residual 60 -�0
Source: Honohan and Beck (2007), Table 2.2
Net interest income as a percent of earnings assets such as a loan that generates interest in-come.
Roughly, administrative costs = net interest income + non-interest income – profits – loan-loss provisions. Figures are also expressed as percent of earning assets in basis points.
a.
b.
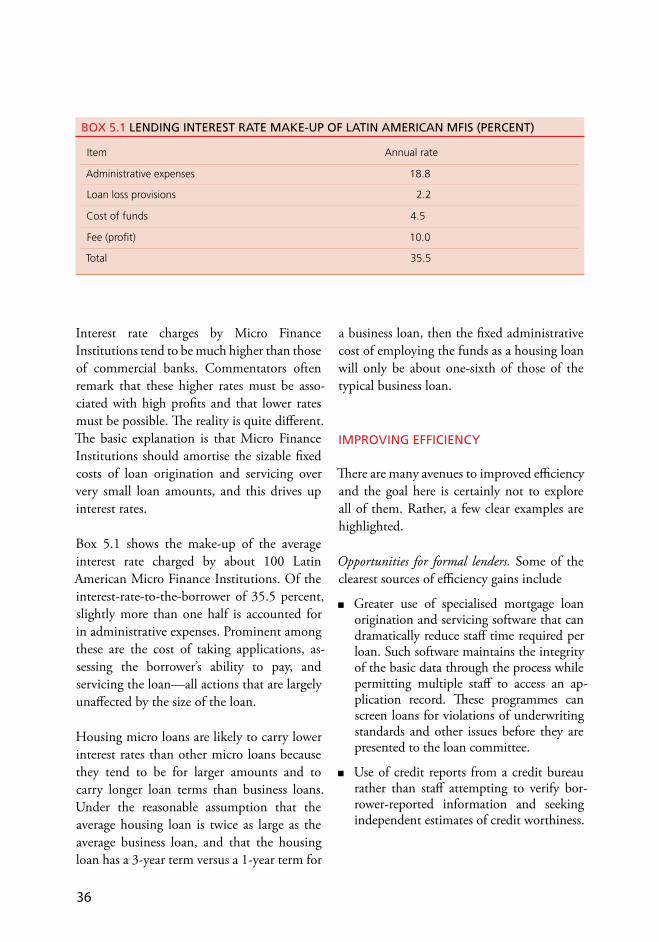
��
Interest rate charges by Micro Finance Institutions tend to be much higher than those of commercial banks. Commentators often remark that these higher rates must be asso-ciated with high profits and that lower rates must be possible. The reality is quite different. The basic explanation is that Micro Finance Institutions should amortise the sizable fixed costs of loan origination and servicing over very small loan amounts, and this drives up interest rates.
Box 5.1 shows the make-up of the average interest rate charged by about 100 Latin American Micro Finance Institutions. Of the interest-rate-to-the-borrower of 35.5 percent, slightly more than one half is accounted for in administrative expenses. Prominent among these are the cost of taking applications, as-sessing the borrower’s ability to pay, and servicing the loan—all actions that are largely unaffected by the size of the loan.
Housing micro loans are likely to carry lower interest rates than other micro loans because they tend to be for larger amounts and to carry longer loan terms than business loans. Under the reasonable assumption that the average housing loan is twice as large as the average business loan, and that the housing loan has a 3-year term versus a 1-year term for
a business loan, then the fixed administrative cost of employing the funds as a housing loan will only be about one-sixth of those of the typical business loan.
IMPROVInG EFFICIEnCY
There are many avenues to improved efficiency and the goal here is certainly not to explore all of them. Rather, a few clear examples are highlighted.
Opportunities for formal lenders. Some of the clearest sources of efficiency gains include
Greater use of specialised mortgage loan origination and servicing software that can dramatically reduce staff time required per loan. Such software maintains the integrity of the basic data through the process while permitting multiple staff to access an ap-plication record. These programmes can screen loans for violations of underwriting standards and other issues before they are presented to the loan committee.
Use of credit reports from a credit bureau rather than staff attempting to verify bor-rower-reported information and seeking independent estimates of credit worthiness.
bOX 5.1 lEnDInG InTEREsT RaTE MaKE-UP OF laTIn aMERICan MFIs (PERCEnT)
Item Annual rate
Administrative expenses �8.8
Loan loss provisions 2.2
Cost of funds 4.5
Fee (profit) �0.0
Total �5.5
��
Creation of a credit bureau or an expansion in its loan product coverage may be appropriate.
Outsourcing some functions where the need for services is sporadic. One example is property appraisal where lenders can hire independent licensed appraisers.
Micro lenders. The strategy for micro lenders is largely the same as that for their formal counterparts. Many of the most promising innovations are those with significant initial costs that reduce the fixed costs per transac-tions sharply. The idea is to apply electronic (computer and web) or financial technologies to this end. But to exploit these options, micro lenders must operate at a significant scale in terms of number of borrowers and volume of funds. (This point is elaborated upon in Honohan and Beck (2007), pp. 143-44.)
In addition to the loan processing software noted for formal lenders, other examples are:
Addressing financial access problems—ena-bling borrowers to cut their application costs by doing it remotely or even permitting them to make loan repayments remotely as is now becoming common with some South African micro lenders.
Improved accumulation, processing and dissemination of information on credit-worthiness. Some lenders can realise gains internally. Beyond this, a “micro lenders” credit bureau is a possibility, although the vast economies of scale of a single national credit bureau are quite compelling.
RIsK ManaGEMEnT
Housing loans, whether mortgages or micro finance loans, carry higher risks than many other loan types because of the extended period of the loans.
The main risks faced by housing lenders are summarised in Box 5.2. Credit risk is height-ened by the longer loan term simply because there is greater exposure to possible adverse developments in the borrower’s ability to pay and in house prices—downward price movements can wipe out borrower equity and destroy the investment incentive to make pay-ments. Similarly, prepayment risk increases with the length of the loan term because there is a greater likelihood that over the life of the loan, interest rates in the market will fall and borrowers will want to prepay their loans that now carry higher interest rates and refinance them at the lower rate. The largest risk, how-ever, usually is interest rate risk. This is most commonly manifested when a lender funds long term, fixed interest rate loans with short-term liabilities, for example, passbook savings and demand deposits. While the interest rate on the loans is fixed, those on liabilities are not. In the case of a sustained inflation surge, savers will demand higher interest rates. When depositories raise their rates to retain these funds (and avoid liquidity problems), the interest rate spread on housing loans is cut, possibly severely.
Fixed interest rate loans remain predominant in many markets, including places as diverse as Rwanda, Kyrgyzstan, Russia, Germany, and the United States. Variable rate loans that reprice semi-annually or annually and roll-over or hybrid loans (that reprice typically every 3-5 years) sharply mitigate interest rate risk. But the fixed rate loan remains popular with consumers. Struyk et al. (2008) present information based on a representative sample of Indonesian families planning to purchase a home in the next three years where 70 percent state that they would prefer a fixed rate to a variable rate loan.

��
bOX 5.2 PRInCIPal RIsKs In DWEllInG PURCHasE OR PROGREssIVE COnsTRUCTIOn FInanCE
Credit risk – the risk that the borrower does not repay his loan, either because he does not have the funds due to a loss in income or he experiences unexpected expenses, or because he elects not to pay, which can happen when house prices fall and the market value of the unit becomes less than the outstanding loan balance.
Interest rate risk – the risk that the lenders’ loans (assets) and liabilities, i.e. the funds used to make the loans, reprice at different intervals. The most common problem is that lenders use short-term liabilities to finance long-term housing loans with a fixed interest rate. The liabilities can reprice, possibly increasing, generally in response to market conditions, while the long-term loan interest rate remains fixed.
Liquidity risk – the risk that the lender will not have sufficient readily available funds to pay depositors and others from whom he has obtained liabilities when he is asked for repayments. Most real estate loans are not easily sold because would-be purchasers must do a good deal of due diligence to assess each loan’s quality. Hence, a large share of assets held in real estate loans reduces the lenders liquidity position.
Pre-payment risk – the risk that borrowers with long-term loans repay the loan before the end of the contract period. These repayments occur more often when interest rates fall. Borrowers then look to refinance their loans at lower rates. The lender who made the original loan in a sense suffers loses when loans are paid off in the lower interest rate environment because it can only invest them at the lower rate.
These risks are reduced and managed through a combination of actions that include:
improved efficiency of institutions provid-ing critical services, e.g. lien registration, so that the exposure to risk is reduced
allocation of risks to parties better able to manage them, e.g. secondary mortgage market and insurance companies offering mortgage default insurance
adoption of loan instruments that reduce risk, e.g. variable rate loans and some prepayment restrictions.
Note that a number of these risk management options would in most counties require gov-ernment action in creating new institutions, such as a credit bureau. This is discussed further below.
The degree of risk faced by formal lenders dif-fers from those for Micro Finance Institutions as do the appropriate actions each group should take to manage them. As shown in Table 5.4, formal lenders have substantial
a.
b.
c.
exposure to interest rate risk, but Micro Finance Institutions have less because of the short-term nature of their lending. They could have this risk, however, if they have long term liabilities in the form of term loans and they are forced by market conditions to lower the interest rates charged on their loan assets, i.e. a situation that is just the opposite from that of formal lenders.
Use of credit bureau information cuts credit risk and increases operational efficiency. While not many Micro Finance Institutions use credit bureau information, a careful analysis for Guatemala indicates that this sort of infor-mation improves lending decisions (McIntosh, Sadoulet, and de Janvry (2006)).

��
Should development of the strategy include systematic assessment of ways to improve risk management, it will be useful for formal lend-ers and Micro Finance Institutions initially to discuss their challenges and possible amel-iorating actions. Once there is agreement within each group, joint meetings should follow, because it may well be that some ac-tions will be common to both, e.g. creation or enhancement of a credit bureau.
FUnDInG sOURCEs FOR lEnDERs
An issue of fundamental importance is whether lenders will be able to respond to an increase demand for housing loans, i.e. will they have the funds to do so? This section explores op-tions available for formal sector lenders and Micro Finance Institutions.
The starting point is to understand the current sources used to fund housing loans through discussions with a sample of lenders. The standard sources include:
equity
term loans
deposits
simple bank-issued bonds placed with other banks and insurance and pension funds, and
refinancing facilities (access to capital markets).
Lenders should also be interviewed about the elasticity of their various sources and the feasibility of accessing new sources. In many transition and developing countries a primary result of these discussions will be a picture of limited availability of additional funds to meet increased housing loan demand.
What are the options? With a number of strong discussions about the options, and the market pre-conditions for adopting them available in publications, only a few highlights are presented here. (More information for the formal market can be found in Chiquier, Hassler and Lea (2004), Lea (1999), Hegedus and Struyk (2006).)
For the formal sector, the task is to tap broader capital markets. There is a wide range of op-tions that vary sharply in their sophistication and institutional requirements. Some options entail the creation of a new institution—a secondary market facility. Supporting its operations requires a high volume of transac-tions over which its substantial fixed costs can be amortised. If the volume is not sufficient, then the fees it must charge to intermediate between lenders and the capital market will be large and make the all-in cost of funds unattractive to lenders. In considering funds’ cost from a secondary facility in comparison with that of the lender’s own funds, it is critical to recall that the facility is providing both loanable funds and risk management services. As noted above, these facilities gener-ally relieve the lender from interest rate and prepayment risks on the loans it finances and reduces liquidity risk.
Table 5.5 lists some of the more prominent op-tions for banks and non-bank housing lenders (including, for example, non depository lend-ers such as the mortgage finance companies in Egypt and the credit associations in Armenia), with the option ordered from the compara-tively simple to the more complex.

�0
TablE 5.4 sElECTED RIsK ManaGEMEnT OPTIOns
Risk Type Formal sector lenders MFIs
Degree of risk
Management options Degree of risk Management options
Credit ModerateUse credit bureau for credit checks,
mortgage default insurance, and Efficient services for title and lien registration.
ModerateQualify marginal bor-rowers through con-tract savings products.
Use credit bureau for credit checks.
Interest rate Moderate-to-severea
Use variable interest rate loan products.
Sell or refinance loans in the secondary market.
Small (loans are short-term)
No action needed.
Liquidity risk Small-to-moderatea
Use secondary market to increase salability of loans or bonds backed by loans.
Organize stand-by lines of credit from commercial banks, pension funds, etc.
Small-to-moderateb
Organize stand-by lines of credit with commercial banks
Prepayment risk
Moderate Employ variable interest rate loan products.
Impose prepayment penalties on borrowers.c
Small
(loans are short-term)
Impose prepay-ment penalties on borrowers.c
Degree of risk depends on the overall term composition of the lender’s assets. The greater the share that is long term, the greater the risk.
Moderate only for Micro Finance Institutions that are depositories. Others will have financing primarily from term loans, which generally have known repayment dates. p
Penalties are prohibited in some countries.
a.
b.
c.

�1
As shown, the least complex option is for a sin-gle lender to place full faith-and-credit bonds with pension funds, other banks, and insur-ance companies. Complexity increases when a secondary agency is employed because it must acquire assets (loans), either by refinanc-ing loans that remain on the lender’s balance sheet or by purchasing the loans. Complexity increases yet again depending on whether the acquisition is with full recourse to the lender for loans whose borrowers default, or whether the facility accepts this risk (for a fee it charges the lenders).
The complexity of the secondary facility pro-grammes carries a major benefit: the agency, through its loan documentation, underwriting, and servicing requirements, can “organise the
market,” i.e. create standards for mortgages that apply to the majority of loans. This in turn has two impacts: the quality of under-writing and servicing increases overall, thereby reducing credit risk; and, it makes mortgages a more liquid asset. With loans conforming to certain standards, an investor no longer has to invest heavily in due diligence to assess the loan’s quality.
In countries with nascent capital markets, the primary customers for bond issues will be banks, pension funds, and life insurance com-panies. The latter two have long-term liabili-ties that long-term bonds match nicely. It is critical that fund managers make an informed market decision on purchasing these bonds. Governments in some countries have pressed
TablE 5.5 OPTIOns FOR aTTRaCTInG FUnDs FROM CaPITal MaRKETs FOR MORTGaGE lEnDInG
Relatively simple
Single lender accessing the market
Placement of full faith and credit bonds
Placement of bonds formally secured by mortgage loans
Open sale of full faith and credit bonds in the market
Open sale of securitised bonds
Transactions involving a secondary facility
Facility refinances, with full recourse, loans that remain on the lenders’ books; pass through securities for a loan pool are sold in the market
Facility refinances, with full recourse, loans that remain on the lenders’ books; bonds based generally on these assets are sold in the market
Facility purchases loans with full recourse; bonds based generally on these assets are sold in the mar-ket
Relatively complex
Facility purchases loans without recourse; securitized bonds sold in the market

��
public pension funds to buy bonds or make direct loans to government-related wholesale or retail lenders. The results have often been extremely adverse for pension funds and pen-sioners, with few loans actually made. Nigeria and Tanzania are countries that had such pro-grammes in the past. (See, respectively, Ogu and Ogbuozobe (2001) and Government of Tanzania and UN Habitat (2002).)
Micro Finance Institutions have very different requirements because of the shorter term, and much smaller size, of the housing loans they extend. Broadly, there are three options for Micro Finance Institutions to attract funds in the market place. Relatively simple options are to establish relations with commercial banks, and obtain funds through a microfinance apex institution. Much more challenging, but not discussed further here, is to tap into national or international capital markets. 9
Commercial banks are becoming increasingly involved in microfinance, according to the Consultative Group to Assist the Poorest, the micro lending clearinghouse. (Cited in Isern and Porteous (2005). This section relies heav-ily on this source.) Options for mobilising the resources of commercial banks for micro housing and other lending are shown in Figure 5.1. They fall into two broad groups: banks themselves using their resources to fund micro loans they make themselves, and banks
9 The options for obtaining funding from national markets are similar
to those listed above. This route is difficult because investors will
want the same level of documentation and experience from MFIs as
from their formal sector counterparts. With respect to international
markets, it is estimated that as of 2006 there were over 200
microfinance investment vehicles in the market, including donor
placements, with a total subscription of about $400 million (Pierce, M.
(2007) “Accessing International Capital Markets.” Cairo: Presentation
at the Third Microfinance Policy Forum, April �8).
entering into partnerships with independent Micro Finance Institutions.
With respect to the first strategy, a bank has three general choices. It can operate an internal micro finance unit within its regular operations; it can create a specialised institu-tion to conduct these operations, or it can create a microfinance service company. In the service company model, the bank forms a non financial legal entity to provide loan origination and corresponding management services. Compared with an independent Micro Finance Institution formed by the bank, its operations are more limited, and it is not regulated as a separate entity by the bank-ing authorities. Loans made by the company are carried on the bank’s books. Clearly, all of these options require a substantial com-mitment to micro lending by a bank. Some commercial banks have found trying to serve the micro market challenging and have been discouraged.10 Consequently, many banks prefer to work with independent Micro Finance Institutions.
�0 This was reportedly the case in India during the �990s. Difficulties
included the high fixed costs on small loan amounts, the difficulty of
assessing incomes, non standard collateral, and no possibility of pay roll
deductions for many borrowers because of the type of employment.
UN Habitat. (2005) Financing Urban Shelter: Global Report on Human
Settlements 2005. London: Earthscan for UN Habitat, p.8�.

��
FIGURE 5.1 alTERnaTIVEs FOR COMMERCIal banKs TO WORK In THE MICROFInanCE MaRKET
Source: Isern and Porteous (2005)
Provide service directly
Work through existing
providers
Internal unit
Specialized financial institution
Service company
Agricultural Bank Mongolia
Finadav Benin
Sogesol Malawi
Outsource retail operations
Commercial loans to MFIs
Provide infrastruc-ture & systems
ICICI Bank India
Bank of India
Garanti Bank Turkey

��
There are three options for commercial banks to work with these Micro Finance Institutions:
Outsourcing retail operations—The bank engages a Micro Finance Institution to originate loans that are carried on the bank’s books. For a fee, the Micro Finance Institution underwrites the loans, makes the credit decisions, and services the loans.
Line of credit facilities—Credit is provided either as term loans or lines of credit. This is a straightforward transaction, and the most common form of bank- Micro Finance Institution relationship.
Provision of infrastructure and services—The bank itself acts as a service bureau to the Micro Finance Institution by providing services such as access to ATMs, IT sup-port, and the like on a fee basis. Funds are not transferred from the bank to the Micro Finance Institution for onward lending.
It is worth noting that for Micro Finance Institutions that have low cost donor term loans for use in extending asset loans, taking commercial loans can cause complications. If other Micro Finance Institutions also obtain donor funds, then Micro Finance Institutions using commercial funding will have to charge higher interest rates than other lenders. There may be issues to resolve with the donors if the Micro Finance Institution seeks to blend its high cost commercial and low cost donor funds into having an overall, competitive in-terest rate that is higher than the rate on loans funded only from donor resources.
Some believe that microfinance apex institu-tions hold considerable promise for the devel-opment of micro lending generally. These apex institutions obtain funding from international donors and their home government to lend to Micro Finance Institutions for retail lending. They have been established to fund licensed
and unlicensed Micro Finance Institutions. A critical review of these organisations by the Consultative Group to Assist the Poorest (2002) called their effectiveness into question, and the report draws a number of lessons for structuring new institutions. For this discus-sion, the key point is that apex institutions themselves are not obtaining funds from the broader capital markets, but rather are work-ing with donors and national government’s in rationalising the distribution and oversight of funds available from these sources. This dependency on special funding sources works against making them a key element in a na-tional housing finance strategy.
Lastly, it is worth noting that the biggest and most experienced Micro Finance Institutions, the so-called Tier 1 firms, have in recent years been selling bonds on the open market that are securitised by loans they have originated. BRAC in Bangladesh issued a USD180 million offering of securitised receivables (Dieckmann (2007), p.9).
GOVERnMEnT PROGRaMMEs anD InITIaTIVEs
Government interventions in housing finance can be usefully divided into two parts. The first consists of actions designed to directly or indirectly provide decent quality housing to those unable to provide it for themselves. These generally are expenditure programmes, but Central Banks sometimes intervene with mandates that set maximum interest rates on housing loans or minimum housing lending volumes as a percent of those assets. In the 1980s, minimum investment requirements existed for example, in India. The second part consists of facilitating actions for housing fi-
��
nance market development that were touched on briefly in the opening chapter.
Assisting Households. The programmes under consideration here are geared towards assisting low (and sometimes moderate) in-come households in obtaining decent accom-modation. A critical distinction is between those that work through the financial system and those that do not, e.g. the construction and operation of rental housing or payment of housing allowances to help renters meet their rent. We are concerned primarily with those that are related to the financial system, in keeping with this Guidelines’ focus.
These can take a variety of forms:
Direct loans at below-market interest rates by government agencies or by private lend-ers using government-supplied funds (or subsidies that fill the gap between the mar-ket and the lower interest rate). Sometimes these loans have relaxed underwriting standards.
Interest rate subsidies paid by the govern-ment to lenders to reduce the interest charge to the borrower.
Mandates by the central bank or govern-ment that set interest rates on housing loans, or require lenders to have a share of their assets in housing loans.
Payment of bonus interest payments on contract savings schemes tied to dwelling purchase, such as with the German Bauspar programme.
Up-front or down payment subsidies.
Tax advantages on mortgage interest pay-ments.
To understand the degree of spending, and the distribution of benefits, of current pro-grammes, information for each programme
1.
2.
3.
4.
5.
6.
should be gathered on the number of ben-eficiaries, costs, and beneficiary profiles of these programmes. If possible an objective assessment should be made of their efficiency, including any negative incentives they create for private lenders in the same markets. (The Hegedus study cited Box B.2 presents a good example of how this is done.)
With respect to the efficacy of various options, there are two approaches that have been dis-credited. The first is the creation of a govern-ment bank to issue housing loans. In country after country this approach has proved ineffi-cient at best, with problems arising in respect of borrower selection and poor repayment collections (UN-Habitat (2005), pp. 60, 73, 74). The second is mandates by Central Banks or government’s that lenders extend credit at below market interest rates. Lending simply dries up unless there is an accompanying requirement for a minimum share of assets in mortgage loans. The net effect is some short-term increase in housing lending but interest rates on other lending rise to compensate for the losses on these loans. A general problem is that housing lending is viewed suspiciously by banks even long after the mandates are lifted.
Because implementation of assistance pro-grammes is so widespread, it is worthwhile to discuss them in more detail. (This section draws heavily on Struyk (2000), pp. 39-44.) Table 5.6 presents an assessment of five programmes commonly used to promote home ownership and the attainment of good quality housing. These are, in addition to the two problem programmes noted in the last paragraph. Economists generally accept a half-dozen criteria for judging the efficacy of interventions like these. The criteria are listed in the column headings and explained in the notes in the table. In the body of the table each
��
programme is rated against these criteria. The ratings range from “- -,“ meaning the subsidy does very badly when judged against a crite-rion, to “++,” which indicates a very strong rating. The specifics of subsidy design in a few cases are so important that a general rating for a category is not useful without knowing more concerning the specific program; this is indicated by a “*”. Finally, some subsidies are essentially neutral with respect to a criterion, and this is indicated by “N.”
The contract savings scheme receives consist-ently low marks. The subsidy is difficult for the beneficiary to value. Typically, the savings bonus is paid after one year on incremental savings during the previous contract year. Its ultimate value depends on how many years the savings continue to sit in the account. To compute the composite interest rates received on savings at the end of the contract requires the saver to compute the rate of return over the life of the savings contract, possibly adjust-ing it for tax-free allowances while other forms of financial savings are taxed. In general, sav-ings bonus programmes are not well-targeted toward the lower-income group. Anyone can sign a contract. The only control is over the amount of savings a bonus is paid.
Savings bonus programmes are structured so that savers who fulfill their contracts are eligible for mortgage loans at an interest rate that is below the market rate. (Without the government bonus on savings, the savings in-terest rate is also below the market rate. There is a closed circuit of saving and lending both at these lower rates.) The proper use of the funds must be monitored. Also note that the contract savings scheme, if in the form of the German-Austrian model, where new institu-tions are set up to offer the programme, can work against efficiency in the financial sector
by proliferating specialty lenders and denying other lenders economy of scale benefits.
The bonus programme and mortgage interest rate subsidy programme suffers from a major deficiency in that the government is commit-ted to long-term subsidy payments, which are hard to control during the contract period.Income tax deductions suffer from this prob-lem as well. 11
By contrast, support for a housing finance liquidity facility creates a positive incentive for commercial banks to lend for housing and will increase the share of home mortgage loans in total assets.
The programme with the most consistent set of “+s” is down payment subsidies. Note that these can go beyond a modest share of the purchase price, which is common (Box 5.3). In Russia’s scheme operating in the late 1990s, geared to the middle classes, a lower-income family who had been on the waiting list for housing could receive up to 70 percent of the purchase price as a grant paid directly to the seller at the time of the sale closing. With down payment subsidies, transparency is total for both legislators and beneficiaries: the subsidy is the amount handed over at the loan closing. Downpayment subsidies also receive high marks for cost control: the number of beneficiaries depend on the funds parliament appropriates each year.
�� The one rigorous analysis of the efficiency of the price (interest rate) of
loans made by the Bausparkassen in Germany found, after adjusting
for various factors, that these loans were priced about �� percent
higher than those originated by mortgage banks (Diamond, D., Jr.,
and Lea, M. (�992) “Housing Finance in Developed Countries: An
International Comparison of Efficiency,” Journal of Housing Research,
�, �, �-27�), table 7.2

��
rable goods to predict who is poor have also proven to have accuracy problems. In some instances, asset tests or savings requirements combined with income testing have worked well, as have the use of community input. No approach has proved consistently effec-tive, and the “capture” of subsidies by higher income households continues to be a problem in the assistance of individual households to improve their housing.
a. Criteria definitions
Open and transparent: The presence of the subsidy is easily identified. The costs are clear to the government and parliament. Beneficiaries can accurately and easily value the benefit.
Well-targeted: Subsidies are received by ben-eficiaries who would not otherwise be able to afford good quality housing.
Improved access: Permits some households, not otherwise able to borrow, access to loans from lenders.
Cost-effective: Increase in the number of well-housed families achieved at a low cost per incremental household assisted.
Administratively simple: Cost of running the programme is modest relative to the benefits in absolute terms.
Cost controlled: Government commitments are clear, are not long running in nature, and can be reduced in a timely way.
Non-detrimental to the Housing Finance System: subsidy is neutral or positive in its impact on the efficiency of the housing finance system.
These grants have a modest impact on the ability of the beneficiary to obtain mortgage finance by driving down the loan-to-value ratio to a level giving the bank ample assur-ance of no net loss if there is a default on the loan. Finally, in its basic form, the programme is administratively simple. All administrative actions for a particular beneficiary takes place over a period of several months. The file is closed once the disbursement is made and the beneficiary’s occupation of the purchased home is confirmed.
A variation on the downpayment subsidy is the subsidy combined with mandatory savings by beneficiaries. This is the Chilean model that has been adopted by South Africa (Box 5.3). Downpayment support programmes have become more popular. For example, this is a major component of Egypt’s National Housing Programme.
Despite the positive features of the down payment subsidy approach, it and other subsidy programmes have struggled to reach low-income families (UN-HABITAT (2005), pp. 60 and Box 4.11). The ability of low-income families to assemble significant down payments, or to meet the monthly payments of market-rate loans, is limited. In the Philippines, 77 percent of the country cannot afford a formal sector loan even at a subsidised interest rates because the monthly payments are unaffordable (UN-HABITAT (2005), p.64).
As a final comment the difficulty of targeting housing subsidies to the poor must be ac-knowledged. Direct tests based on household income are beset with under-reporting of incomes, especially those from informal sec-tor jobs. Proxy-means tests that use attributes of household members and ownership of du-

��
TablE 5.6 RaTInGs OF GOVERnMEnT InTERVEnTIOns TO InCREasE HOME OWnERsHIP anD THE aTTaInMEnT OF GOOD QUalITY HOUsInG
InterventionCriteria for Ratinga
Transpar-ent
Well-
targeted
Access to
finance
Effective
Admin
simple
Admin
simple
Cost
control
Neutral
for
system
D: savings bonus in
contract scheme
-- -- -- ++ - -- -
D: subsidy on
mortgage interest
+ * + + - -- N
D: income tax
deductions
- - + + + -- N
D: downpayment
subsidies
++ ++ + + + ++ +
S: support for
secondary facilities
-- - + * + * +
Source: Struyk (2000), Table 1.13
Legend:
-- Intervention has very low rating on this criterion
++ Intervention has strong, positive rating on this criterion
* Ratings depend substantially on the specific design of the programme
N Intervention is neutral with respect to this impact
n.a. Not applicable
D demand-side subsidy
S supply side subsidy

��
bOX 5.3 THE CHIlEan aPPROaCH TO HOUsInG sUbsIDIEs
Since the mid-�980s, housing policy in Chile has been oriented towards subsidising the demand for housing. There are now a number of different housing programmes. The principle is the same in each, with finance based on three components: beneficiaries’ savings, government subsidy, and loans. The proportion of these three components varies according to the cost of the house and according to each housing programme. The lower the price of the dwelling, the higher the proportion of the subsidy—although the actual subsidy per housing unit could be the same amount. One of the policy’s most important aspects is its continuity. Operating for about 20 years, it has provided about �00,000 subsidies per year.
In most programmes, people apply through the regional office of the Chilean Ministry of Housing or through local government. Each programme has its own regulations that stipulate who can apply, eligibility of financial support, and what they will obtain. The process of selection is an important element. One of the reasons for the model’s success is that almost everyone believes the process is transparent. The process is computerised and, in general terms, people know what the criteria are according to which they will be selected—for example, poverty level as indicated by a socio-economic survey of each family, and the initial amount of savings. The
result of this selection process is published in a local or national newspaper so that people are informed. Source: UN-HABITAT (2005), p.93, 95-96.
In some programmes the applicant manages the construction of his own unit, and in oth-ers, the regional government will contract, through a competitive process, with a private contractor for the construction of those units.
Problems with reaching the lowest income families were a consistent programme chal-lenge, and in 2000 a new non-loan version of the programme was created. The location of dwellings sponsored and their quality, remain issues.
While most governments are unable to pro-vide subsidies and subsidies being so difficult to target to the poor, it is obvious that an al-ternative approach is needed—the widespread availability of micro housing loans to support and accelerate housing consolidation.
Assisting Small Investors. The assistance target are those investors adding a rental room to the property they occupy or another property they own or constructing or improving a basic dwelling for the low-income housing market. The idea is straightforward: by increasing
the supply of units, a downward pressure on rental rates will develop. The most important element is to increase access to finance for this kind of development, primarily through Micros Finance Institution. This kind of lend-ing could be encouraged through government co-insurance against loan defaults.
One possible subsidy would be matching grants to investors up to a maximum amount with the requirement that the room or unit meets a few basic construction standards and has good access to water and sanitation fa-cilities. Price controls on rents are not advised given the severe problems of enforcing them. Quality standards would have to be met be-fore the grant is released to ensure compliance. Lenders could document compliance at the same time as they make their own inspection to justify the disbursement of the final loan tranche.
Increasing Lending Efficiency. As important as direct assistance to families to acquire good quality housing is, efforts by government to make lending and servicing housing loans

�0
more efficient while also reducing the risk is also important. These actions are grouped in Table 5.7 into three types: directly providing information and training, supporting expan-sion of lenders’ market coverage, and support-ing the development of new services.
Information and training. The value of these services often is overlooked in favour of the creation of new agencies and home purchase subsidies. There are still a good number of developing countries where central banks ei-ther do not gather information separately on mortgage loans or any other home purchase loans, or they gather it but fail to publish it. Egypt, for example, falls into the latter cat-egory. Without basic data on the means and distribution of housing loan volumes, interest rates, loan-to-value ratios, and the like, lenders cannot have a good idea of what is going on in the market limiting competition unneces-sarily.
Regulators or, in some countries, trade associa-tions, can improve the quality of lending and achieve some degree of consistency through training courses: for loan officers in loan underwriting and servicing, and for the staff and members of the lender’s asset and liability management committee on risk management techniques. Where high inflation becomes a persistent problem, these same agencies can introduce lenders to mortgage instruments designed for inflationary environments. 12
�2 These loan products include the price-level adjusted mortgage (PLAM),
dual-index mortgages (DIM), dual-rate mortgages (DRM), and shared
appreciation mortgages (SAM). These instruments have specific
features that can make them challenging to use without incurring
undue risk, and therefore a careful introduction to them is warranted.
Expanded market coverage. A key task of governments is to encourage innovation from lenders, in part through co-insuring potential losses while charging premiums designed to cover expected losses. Mortgage default insur-ance (partially) protects lenders from losses incurred when a mortgagor’s loan is foreclosed. In the great majority of countries that have this type of insurance, including those in western Europe, it is offered by state agencies. Although generally, it is thought that this type of insurance is too risky for developing coun-tries like Lithuania, Kazakhstan, and Estonia
- countries where this kind of coverage is now offered (Merrill and Whiteley (2003), p.12). In South Africa, a national agency covers 20 percent of the loss for non-governmental organizations extended loans in exchange for a 2 percent fee on the principal covered (UN-HABITAT (2005), p.160 and Merrill and Whiteley, op. cit.). To expand the provision of lower rent housing, governments can provide insurance on these loans on condition that the dwelling constructed meets certain basic standards.
Initiation of mortgage default insurance is often an attractive option for governments. A fundamental task of the insurer however, is to control the quality of the loan which it agrees to insure. There have been several cases where agencies failed because they did not introduce and/or strictly control the quality from the outset of operations.

�1
TablE 5.7 POssIblE GOVERnMEnT HOUsInG FInanCE MaRKET DEVElOPMEnT aCTIOns
area Examples
Information and training Regulators provide comprehensive information on market develop-ments
Regulators or trade associations offer training for loan officers on loan underwriting and servicing and risk management
In inflationary environments, regulators and trade associations provide information and training on loan instruments better designed to oper-ate in such conditions.
Regulators cause information on mortgagors’ rights to be widely prom-ulgated, with consumer protection agencies or the like addressing non bank lenders including developers.
Expand market coverage Government encourages offering insurance products for loans to riskier clients that spread risk among lenders and, if needed, creates public sector agencies to offer such products, with risk shared between the insurer and loan originators.
Government encourages commercial banks to make term loans to Micros Finance Institutions by providing protection against catastrophic losses.
Support of new services or up-
grading existing services to im-
prove efficiency and reduce risks
Property appraisal services
Credit bureau information services
Title and lien registration services
Secondary mortgage facility
Lower the price of loans
Regulators permit lower capital requirements on housing loans
Government gives lenders tax advantages for housing loans
The Mexican government has been par-ticularly active in using insurance as a tool to foster mortgage market development. Since the near collapse of mortgage lending in the early 1990s, owing to a period of massive macroeconomic instability, the government supported the introduction of mortgage default insurance, insurance on mortgage-backed bonds issued by certain lenders, and insurance against the kind of systemic risk experienced in this period when inflation
far exceeded increases in wages, and borrow-ers could not make payments due on their dual index mortgages. (For a description of these initiatives see Babatz (2004) and Dale-Johnson and Towle (2002). On the use of the dual index mortgage in Mexico during the period of turmoil, see Lipscomb and Hunt (1999).

��
For Micros Finance Institutions, governments can play a market-making role by providing partial insurance coverage on term loans from commercial banks to Micros Finance Institutions. Operational examples of this specific vehicle have not been identified. Nevertheless, the design of such a product appears to be straightforward. Government assistance for initiating such coverage could be the same as for mortgage default insurance, with help coming in the form of start-up capi-tal and a guarantee to lenders to cover losses if the agency was unable to do so itself.13
Improving support services. An array of service agents carry the major responsibility for the development of an efficient housing lending system. They range from appraisers, to the courts, to title registries and credit bureaus. A large volume of experience and significant documentation exists about each of these entities, particularly on websites of the rel-evant international trade associations, and the principal private sector entities in the field, e.g. credit bureaus. Overall, the more efficiently these agencies work, the more efficiently lenders can operate, and the lower the cost of funds to the borrower.
�� In this context the structure of the European Fund for Southeast
Europe (EFSE), created to increase the loanable funds available in
the region for SME and small housing loans, is of note. EFSE uses
simple structured finance techniques to sub-divide its capital structure
into three-tranches, each bearing a different risk profile, to leverage
donor funds and attract private investment. The donor funds are
in the maximum risk tranch. The approach creates efficiency gains
and divides risk in a manner that allows each investor to bear an
appropriate risk level, and corresponding return on funds. In the
case at hand, the government could take the donor role and attract
private finance to the less risk-exposed capital tranch. European Fund
for Southeastern Europe (EFSE). (2007) Annual Report. Luxembourg:
Oppenheim Pramerica Asset Management S.a.r.l..
One further point to make is that national governments should be careful not to launch some of these agencies too early in their coun-try’s housing finance evolution. Credit bureaus and secondary mortgage market facilities are costly to establish, and have major IT and organisational requirements. Also, secondary facilities must invest substantially in risk man-agement systems’ development. These costs must be amortised over high business volumes, either credit rating inquiries or mortgages purchased, if the price of their services will be acceptable to lenders. Premature creation of these agencies can lead to large government expenses incurred while the markets develop, or agencies fail, or both. Therefore, extensive and careful advanced consultation with po-tential clients for these services is critical.
EsTIMaTInG THE GaP
If data are plentiful and sufficient analytical capacity is employed, the key result of the analysis of the demand and supply sides of the housing finance market will be two sets of estimates, each for specific tenure-location-in-come household groups. On the demand side, there will be number of loans and the volume of finance required to meet effective demand in 2-3 years. On the supply side, there will be the volume of funds now available to those groups.
Current government housing activity needs to be accounted for by reducing the number of households and associated financial demand in each group by the assistance provided, i.e. the housing finance needs of these households already have been satisfied and should be excluded from further consideration.
��
points of the income distribution by location and tenure. Most countries have household income estimates by location. The critical element missing is the share of income spent on housing. Demand can be estimated under alternative assumptions—ranging from 15 to 30 percent of income. This should be suffi-cient to develop rough demand estimates that can be contrasted with supply information in orienting the work of the next chapter in mar-shalling activities to address the funding gap. (Boxes 4.1 and 4.2 provide some information on these points.)
The “gap” then is the set of differences between today’s housing finance volume and antici-pated demand. Recall that expected demand is conditional on anticipated improvements in certain lending practices that presently re-strict the realisation or activation of effective finance demands, such as arbitrary exclusion of some income sources that reasonably could be estimated by lenders.
Typically, when data are in short supply, the shortage is for the demand side of the market. It is important to obtain at least a general idea of the demand of households at different

��
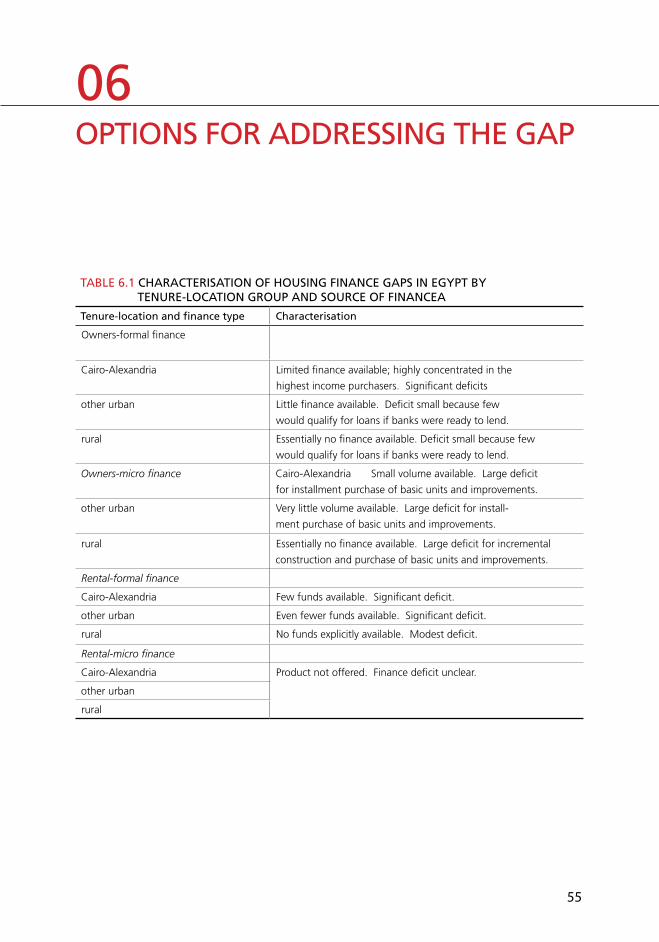
��
OPTIOns FOR aDDREssInG THE GaP06
TablE 6.1 CHaRaCTERIsaTIOn OF HOUsInG FInanCE GaPs In EGYPT bY TEnURE-lOCaTIOn GROUP anD sOURCE OF FInanCEa
Tenure-location and finance type Characterisation
Owners-formal finance
Cairo-Alexandria Limited finance available; highly concentrated in the
highest income purchasers. Significant deficits
other urban Little finance available. Deficit small because few
would qualify for loans if banks were ready to lend.
rural Essentially no finance available. Deficit small because few
would qualify for loans if banks were ready to lend.
Owners-micro finance Cairo-Alexandria Small volume available. Large deficit
for installment purchase of basic units and improvements.
other urban Very little volume available. Large deficit for install-
ment purchase of basic units and improvements.
rural Essentially no finance available. Large deficit for incremental
construction and purchase of basic units and improvements.
Rental-formal finance
Cairo-Alexandria Few funds available. Significant deficit.
other urban Even fewer funds available. Significant deficit.
rural No funds explicitly available. Modest deficit.
Rental-micro finance
Cairo-Alexandria Product not offered. Finance deficit unclear.
other urban
rural

��
The work outlined in this chapter is the heart of the policy’s strategy - the result is a set of action and options defined to eliminate the estimated housing finance gaps. Actual policy decisions are political and result from the type of process discussed in the next chapter.
It is useful to orient the analysis by taking a step back from the detailed estimates pro-duced in the past two chapters in favour of some fairly simple characterisations that help focus the discussion. An example of such a summary characterisation is shown in Table 6.1 for Egypt. (The entries are hypothetical.)
a. Entries are for illustrative purposes only. Excludes government programs.
The broad goal in all market segments is the availability of housing loans - for home pur-chase, incremental construction, and dwelling improvement. The task of those preparing the strategy is to identify the reasons why this goal has not been achieved in each market segment and then to array credible policy changes to address those issues.
Closing the gap overnight is not realistic. It is useful at this stage to set interim goals for each segment, such as reducing the deficit in the urban-owner-middle income segment by one-third over three years. Goals can be re-evaluated after the work outlined in the next two sections is done to determine if the aim is too ambitious or modest.
The next two sections of this chapter, present examples of actions that the government, central bank, parliament, and lenders work-ing together can take to address the kinds of impediments to lending identified in prior chapters. This is done at two levels: retail and wholesale. The retail level is the lender-to-
borrower level. When discussing these issues, the assumption is that lenders have adequate funds to lend. The wholesale level is capital market-to-lender level, i.e. how to ensure that lenders have funds to meet increased demand. Plans made at the retail level may have to be adjusted in light of what is possible in the early years of strategy implementation, i.e. if the volume of funds that can be mobilised is less than the loan demand that will be created through a series of actions at the retail level, then some of those actions may need to be postponed for a year or two. The final section lays out the steps for employing this informa-tion in preparing the actual strategy.
InCREasInG THE VOlUME OF HOUsInG lEnDInG
What can be done to increase housing lending by formal and micro lenders? The main task is to convince lenders that lending is safe, it can be high volume (therefore worth making the investment in training staff and developing expertise and products), and it is profitable (or for non-governmental organization micro lenders that lending is not a money-loser and that it responds to a real need). The best dem-onstration of these facts, of course, is several lenders extending significant loans volumes.
A number of issues often cited by lenders for not being fully engaged in housing lending are listed in Table 6.2. Separate lists are presented for formal and micro lenders. The table lists problems and responses to each. While the examples are far from exhaustive, they illus-trate the point that there is a policy response for every problem. Wherever possible the response includes examples of countries that have employed this response.
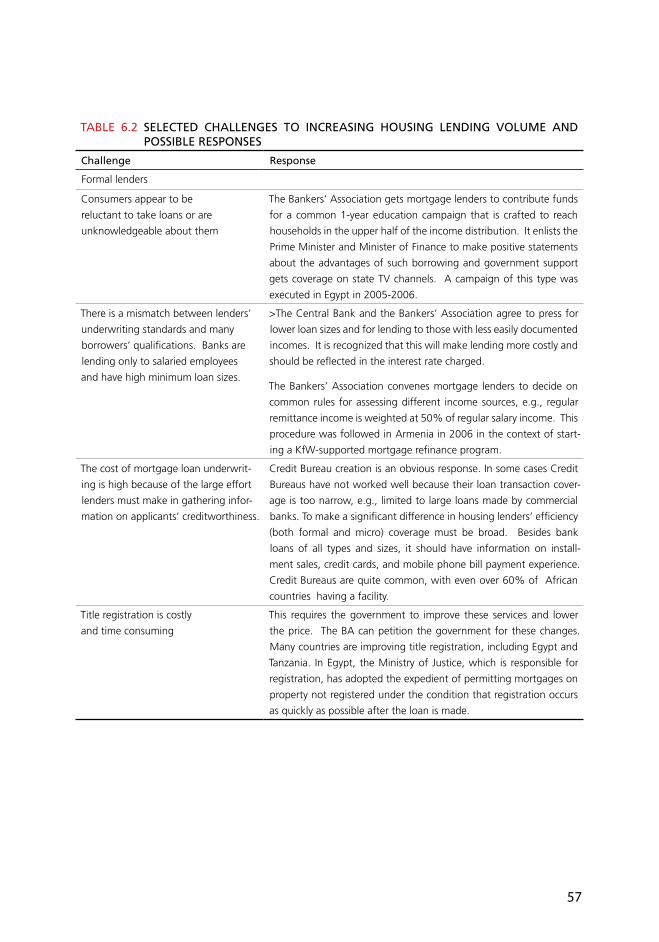
��
TablE 6.2 sElECTED CHallEnGEs TO InCREasInG HOUsInG lEnDInG VOlUME anD POssIblE REsPOnsEs
Challenge Response
Formal lenders
Consumers appear to be
reluctant to take loans or are
unknowledgeable about them
The Bankers’ Association gets mortgage lenders to contribute funds
for a common �-year education campaign that is crafted to reach
households in the upper half of the income distribution. It enlists the
Prime Minister and Minister of Finance to make positive statements
about the advantages of such borrowing and government support
gets coverage on state TV channels. A campaign of this type was
executed in Egypt in 2005-2006.
There is a mismatch between lenders’
underwriting standards and many
borrowers’ qualifications. Banks are
lending only to salaried employees
and have high minimum loan sizes.
>The Central Bank and the Bankers’ Association agree to press for
lower loan sizes and for lending to those with less easily documented
incomes. It is recognized that this will make lending more costly and
should be reflected in the interest rate charged.
The Bankers’ Association convenes mortgage lenders to decide on
common rules for assessing different income sources, e.g., regular
remittance income is weighted at 50% of regular salary income. This
procedure was followed in Armenia in 2006 in the context of start-
ing a KfW-supported mortgage refinance program.
The cost of mortgage loan underwrit-
ing is high because of the large effort
lenders must make in gathering infor-
mation on applicants’ creditworthiness.
Credit Bureau creation is an obvious response. In some cases Credit
Bureaus have not worked well because their loan transaction cover-
age is too narrow, e.g., limited to large loans made by commercial
banks. To make a significant difference in housing lenders’ efficiency
(both formal and micro) coverage must be broad. Besides bank
loans of all types and sizes, it should have information on install-
ment sales, credit cards, and mobile phone bill payment experience.
Credit Bureaus are quite common, with even over 60% of African
countries having a facility.
Title registration is costly
and time consuming
This requires the government to improve these services and lower
the price. The BA can petition the government for these changes.
Many countries are improving title registration, including Egypt and
Tanzania. In Egypt, the Ministry of Justice, which is responsible for
registration, has adopted the expedient of permitting mortgages on
property not registered under the condition that registration occurs
as quickly as possible after the loan is made.
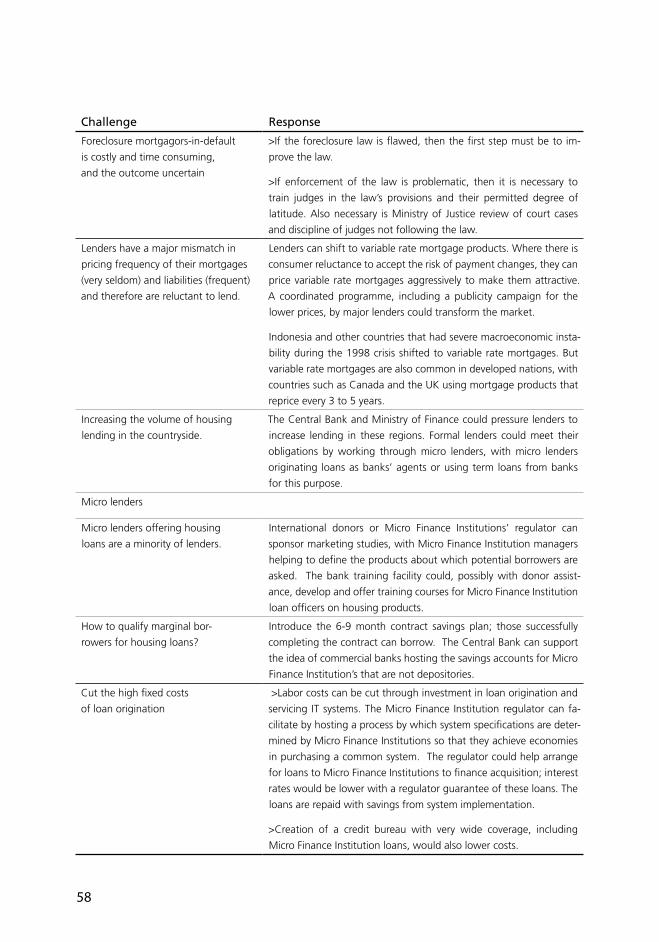
��
Challenge Response
Foreclosure mortgagors-in-default
is costly and time consuming,
and the outcome uncertain
>If the foreclosure law is flawed, then the first step must be to im-
prove the law.
>If enforcement of the law is problematic, then it is necessary to
train judges in the law’s provisions and their permitted degree of
latitude. Also necessary is Ministry of Justice review of court cases
and discipline of judges not following the law.
Lenders have a major mismatch in
pricing frequency of their mortgages
(very seldom) and liabilities (frequent)
and therefore are reluctant to lend.
Lenders can shift to variable rate mortgage products. Where there is
consumer reluctance to accept the risk of payment changes, they can
price variable rate mortgages aggressively to make them attractive.
A coordinated programme, including a publicity campaign for the
lower prices, by major lenders could transform the market.
Indonesia and other countries that had severe macroeconomic insta-
bility during the �998 crisis shifted to variable rate mortgages. But
variable rate mortgages are also common in developed nations, with
countries such as Canada and the UK using mortgage products that
reprice every � to 5 years.
Increasing the volume of housing
lending in the countryside.
The Central Bank and Ministry of Finance could pressure lenders to
increase lending in these regions. Formal lenders could meet their
obligations by working through micro lenders, with micro lenders
originating loans as banks’ agents or using term loans from banks
for this purpose.
Micro lenders
Micro lenders offering housing
loans are a minority of lenders.
International donors or Micro Finance Institutions’ regulator can
sponsor marketing studies, with Micro Finance Institution managers
helping to define the products about which potential borrowers are
asked. The bank training facility could, possibly with donor assist-
ance, develop and offer training courses for Micro Finance Institution
loan officers on housing products.
How to qualify marginal bor-
rowers for housing loans?
Introduce the 6-9 month contract savings plan; those successfully
completing the contract can borrow. The Central Bank can support
the idea of commercial banks hosting the savings accounts for Micro
Finance Institution’s that are not depositories.
Cut the high fixed costs
of loan origination
>Labor costs can be cut through investment in loan origination and
servicing IT systems. The Micro Finance Institution regulator can fa-
cilitate by hosting a process by which system specifications are deter-
mined by Micro Finance Institutions so that they achieve economies
in purchasing a common system. The regulator could help arrange
for loans to Micro Finance Institutions to finance acquisition; interest
rates would be lower with a regulator guarantee of these loans. The
loans are repaid with savings from system implementation.
>Creation of a credit bureau with very wide coverage, including
Micro Finance Institution loans, would also lower costs.

��
InCREasInG FUnDs aVaIlablE FOR HOUsInG lEnDInG
TablE 6.3 sElECTED CHallEnGEs TO InCREasInG THE VOlUME OF FUnDs aVaIlablE TO HOUsInG lEnDERs anD POssIblE REsPOnsEs
Challenge Response
Formal lenders
Two major housing lenders are short
of funds in a country with no second-
ary mortgage facility. Their standard
loan product is the variable rate loan.
>As respected banks, they could issue corporate bonds to raise the
funds. The bonds would have a maturity similar to that of the mort-
gages they will finance.
>If they believe they will get significantly better execution (a lower
interest rate demanded by investors) if the bonds are securitised, then
they could issue bonds of this type.
Banks offer a range of mortgage
products and use different rules in
underwriting loans. Interest rate risk
is a significant issue as fixed rate loans
are standard. Lenders generally could
expand housing lending but lack long
term funds.
The government could lead the effort to establish a simple refinance
facility. The refinance will provide both liquidity and interest rate risk
management assistance. The facility’s offer to refinance only loans
that conform to a set of standards will organise the market, i.e. create
standard loan products. (For the products to be acceptable to lenders,
it is essential that lenders participate in the process for defining the
standards.)
This type of refinance facility is fairly common, with examples including
Malaysia, Jordan, and Egypt.
Micro lenders
Make strong MFIs depositories There are an increasing number of well-managed Micro Finance
Institutions that are strong enough to be depositories. Where this is
not permitted by law, the necessary legislation would be passed and a
strong supervisory capacity established.
Differentiation among Micro Finance Institutions is common with
the strongest having the right to be depositories. Examples include
countries as diverse as Kyrgyzstan and South Africa.
Commercial Banks are concerned that
providing significant lines of credit to
MFIs carries a high risk because MFIs
are not strongly supervised.
The Government moves supervisory responsibility for Micro Finance
Institutions from a social ministry to the Central Bank. The Central
Bank will develop alternative standards for Micro Finance Institutions
compared with commercial banks, but supervision will definitely be
stronger for MFIs than it is now. The risk level perceived by commercial
banks in extending lines of credits to Micro Finance Institutions will be
reduced and the funds should flow.
Such credit lines are now common in the major Micro Finance
Institutions in South Asia.

�0
The kinds of actions listed in the table will lead to more mortgages and other housing loans being made, and lenders may be constrained by their supply of funds. Indeed, lenders may be quite reluctant to make some of the invest-ments called for in the table if they are not assured of being able to amortise their costs over substantially larger loan volumes.
Chapter 5 outlined a variety of ways to increase the volume of funds with appropriate maturi-ties to housing lenders. Table 6.3, following the same format as Table 6.2, gives a couple of further examples.
�1
PaRT III
ORGanIZInG anD IMPlEMEnTInG
sTRaTEGY DEVElOPMEnT

��

��
InsTITUTIOnal FRaMEWORK
– WHO DOEs WHaT
WHO sHOUlD lEaD THE sTRaTEGY’s PREPaRaTIOn?
The key requirement is that the leader has significant operational authority in the finan-cial sector. The main candidates to lead the exercise are the Chairman of the Central Bank and the Minister of Finance. To signal the im-portance of the private sector, the chairman of the bankers’ association or a similar body, and the head of the micro lenders association, if one exists, or the head of the largest Micro Finance Institution could be co-chairs.
There is a useful distinction to be made between sponsorship and leadership. The sponsor is the entity that causes the strategy to be developed. This might be the prime minister, at the urging of a major international donor—which implicitly makes them both sponsors. In industrial countries, it might be the Bankers’ Association. Whoever it is, will have a voice, usually the definitive voice, in selecting the exercise’s leaders. It is difficult to overstate the necessity of the leaders to be
07
Many housing finance strategies are designed by international donors working with housing and finance ministries in developing countries. The strategies are comprehensive. More often they address only the formal sector. The teams who produce these reports make rational rec-ommendations. This is usually where the story ends. In part, this is because governments or ministers change, and with them the support for these initiatives is often lost. The reports remain unused because the strategy team was too narrow—it excluded the commercial banks, mortgage finance companies, and micro lenders who hold the key to the plan’s implementation, including the provision of essential support for legislative changes.
This chapter seeks to find an inclusive process. The chapter poses five questions beginning with who should lead such an exercise, and ending with the recommendations that must be made to those who will implement the strategy.

��
genuinely committed to the strategy’s devel-opment. It is the sponsor’s task to convince the leaders to take the task seriously, and give it priority among their myriad duties.
WHO sHOUlD PaRTICIPaTE?
Above all, the procedss must be inclusive, bringing in informal lenders as well as formal, political leadership from small towns as well as the capital. Others that must participate
are any secondary market operators, and all involved regulatory authorities. It is often desirable to bring in key MPs who will have responsibility for passing the legislation neces-sary for strategy implementation.
The following list provides some initial guid-ance on whom to include. The list will differ by country, depending on the distribution of authority and interest in housing finance.
Government Officials
Minister of Finance
Central Bank Chairman
Minister of Justice
Head of agency regulating MFIs
Head of agency regulating non bank housing lend-ers
Head of title registration agency
Minister of Housing
Mayor of the capital
Mayors from 2-� other areas
Parliament
Chairs of committees likely to consider new financial legislation
Private sector representatives of
Bankers’ Association
Mortgage Lenders’ Association
Association of Appraisers
Credit Bureau
Major mortgage lenders
Major MFIs
Secondary mortgage facility
Think tanks with significant expertise in the field
NGOs interested in consumer rights

��
Most of these participants bring their own interests to the table as well as their concerns for the public good. Conflicts of interest will be present and it is incumbent upon commit-tee leadership and members to assess which proposals are truly in the public interest and which are designed to favour narrower inter-ests. Where necessary they must politely but firmly guide recommendations to be adopted appropriately. That said, it would be the case that many improvements that generate broad benefits will also benefit certain market par-ticipants.
A challenging question is the extent and nature of the involvement of the donor community. Donor community participation can easily evolve into donor community domination or direction, which would undermine a sense of local ownership and, correspondingly, local commitment to implementation. The nature of the community’s contribution must be carefully considered. One option is to invite donors to help with specific technical analysis essential to strategy development but not to be actual participants. Alternatively, they could be invited to participate as observers. In any event, donors should be invited to help with technical implementation elements.
The Committee will meet initially to debate and discuss in a general way the problems causing the limited loan volume, the skewed-to-the-rich distribution of available finance, and ideas for addressing these problems. Even the two to three meetings devoted to these discussions should be informed by basic information on the current volume of formal and micro housing lending. It saves time and keeps the discussion properly focused.
Key tasks for each committee member will be to supply to the strategy team the information needed for the analysis, and to be completely
open in the assessment of the current situa-tion and options for addressing the problems identified. Inclusion on the committee puts pressure on each member to fully cooperate.
This full Committee is too large to constitute a working group. A Steering Committee should be appointed by the Chairman to meet frequently to provide guidance to the team conducting the analysis supporting the strat-egy. Typically, a group of five to eight people makes a workable Steering Committee.
The whole committee, however, must be involved at key points in the process. These include:
Approving the Terms of Reference to the team commissioned to do the technical analysis
Reviewing the results and conclusions of the technical analysis
Discussing the various options for closing the gap (before a concrete plan is made)
Reviewing and approving the draft strate-gic plan to present to the Prime Minister or President.
It is critical for the Steering Committee to keep the full Committee consistently and fully informed so as to maintain a cooperative spirit in the group.
HOW sHOUlD THE TECHnICal analYsIs bE ORGanIsED?
This and the next question - who should pay for strategy development? - are closely related. There are two different staffing func-tions to consider. One is staff to attend to the immediate needs of the Committee. This includes tasks such as handling the logistics

��
of meetings, working with the Chairman to prepare agendas, working in the background with stakeholders to reach compromises, and carrying out detailed reviews of techni-cal reports and preparing summaries for the committee that respond to the Committee’s work style. The best choice here is staff from the Chairman’s organisation. These people are at hand when needed. Also, the Chairman has direct control over them, and can hold them fully accountable.
The second task is conducting the technical analysis. The main choices are: (a) staff from Committee member agencies and private sec-tor organisations or (b) a contractor. The first option uses the services of those who know the current situation in detail, and usually the services of those participating are free to the Committee. However, this approach has three powerful limitations. First, the staff appointed may not be familiar with a wider range of options for addressing the various problems identified. Second, they may lack the techni-cal expertise for some parts of the work, for example, designing a representative survey to determine consumer knowledge levels. Third, those appointed to do the work often are not relieved sufficiently from their regular duties, meaning that they are not able to devote enough time to strategy work. The result can be a technically weak document that takes much longer to prepare than envisioned.
The case for hiring a contractor is the mirror image of that for using agency and lender staff. They are likely to be technically competent and to have adequate time to focus, but their services are costly. Options for paying these costs are discussed below.
A key organisational question concerns the assembly of the data necessary for the techni-
cal work. Possible sources were reviewed in Chapters 4 and 5, on housing finance demand and supply, respectively, and are repeated here. Where reliable quantitative data is missing on either demand or supply, the Committee should take steps to ensure that the informa-tion will be forthcoming in the years ahead, if it is not gathered for the Committee’s work. Examples include: to improve demand estimates, adding a battery of questions to the standard socio-economic survey done peri-odically in most countries; and, on the supply side, getting regulators to change their routine reporting requirements to get some informa-tion, and, for other information needed on a one-time basis, distributing a special survey.
WHO sHOUlD PaY FOR sTRaTEGY DEVElOPMEnT?
Strategy preparation requires significant resources, but the amount can vary widely depending on the degree of rigor with which the demand for, and supply of, housing finance are estimated, and the availability of information from other sources. The greater the data collection’s scope—new surveys of households and financial institutions—the greater the cost. The longer the time required for this work phase. Each survey must be de-signed and fielded, the information obtained analysed and reported. This is a significant task each time.
There are three basic options for financing this work:
The lead government organization - the Ministry of Finance or the Central Bank
An international donor - e.g. multilaterals such as the World Bank, the IFC, Asian Development Bank, African Development

��
have the least access to housing finance and how great these deficits are
Set realistic goals for the strategy on the volume of housing lending and the dis-tribution of loans four to six years from the starting date. These should be stated quantitatively, perhaps in ranges, so that their accomplishments can be monitored
Agree policy actions under discussion should cover the relevant range of options to avoid further options being raised after an initial agreement is reached
Avoid direct clashes in priority settings by adopting a plan that covers all market seg-ments but spreads actions out over time in a realistic fashion
Give high priority to actions that can be executed quickly, and which therefore develop some momentum and credibility for the overall strategy. These actions will generally be those under the direct control of committee members, e.g. actions by the Central Bank or the Bankers’ Association.
Reconcile factions. The process should not be hurried. Multiple meetings are likely, and between group meetings the Committee Chair’s full attention and pres-tige must be used in one-on-one meetings
Be certain that market participants with less economic clout receive a full hearing, and their needs are at least partially met.
Nothing on this list is new to those who have run this kind of process. The style in which they are accomplished is of the greatest mo-ments.
2.
3.
4.
5.
6.
7.
Bank, Inter-American Development Bank, or bi-laterals such as USAID
Private sector lenders and others participat-ing in the process - e.g. a secondary facility or credit bureau.
There is no superior choice. Each carries its own costs and benefits. Donor funding is attractive since it relieves others from paying. The drawbacks include the time for contract-ing these services, and a more direct involve-ment by the donor in shaping the strategy. A fact in every case is that whoever foots the bill will have a strong voice when decisions are made.
If a country is considering approaching an international donor, it should do some careful homework before doing so. In particular, it should carry out an inventory on the infor-mation currently available against what will be required. The information on the differ-ence can inform the initial discussions, and avoid major misunderstandings that can delay strategy development.
HOW TO DETERMInE THE RECOMMEnDaTIOns?
Every group has its own dynamic, and every country has its own distribution of power and ways of reaching agreements. It is simply not possible to provide a “road map” for the decision-making process. There are, however, a few suggestions that may prove useful.
Agree on the facts before beginning to discuss solutions and priorities. Especially important is agreeing on which market segments (tenure-location-income group)
1.

��
DEFInInG THE sTRaTEGY
The strategy team will examine each of the problems identified in the process outlined in Chapter 6, and select what they believe to be the most effective way to address them. The strategy team will also have to be aware that it has limited resources with which to work.
“Resources” here is defined in the broad sense to include a willingness of lenders to take actions such as changing their underwriting standards, the staff and monetary resources the govern-ment can devote to establishing new agencies, and political resources in passing the necessary legislation and implementing stronger lender supervision if needed.
In considering the actions to be taken for each market segment, the strategy team will have to balance those resources against the size of the problem and the magnitude of the benefits anticipated, i.e. the implicit benefit-cost ratio. Considering this ratio, the decision may result in expanding housing micro finance.
The team will want to address the impedi-ments to “retail” housing finance. These ten-tative decisions will inform the discussion of the “wholesale” segment by providing at least
a general idea of the increase in demand and what to expect. In other words, the team will need to estimate the likely impact on housing loan demand, formal and micro, of the ac-tions selected for the retail segment.14 Should the increase be modest, then the magnitude and timing of the institutional changes to the wholesale element, would be very different from those required if very large increases are anticipated.
Table 7.1 provides some examples of summa-ries of the contents of a strategy statement. A complete listing would certainly take longer. Actions for formal and micro market segments are listed separately, in part to accent that dif-ferent implementers are often involved in two sets of actions.
This type of document can be presented to all stakeholders for consideration, and in forming the basis of an action plan. Whether the plan is realised depends critically on how organised the planning is as discussed earlier in this chapter.
�4 The effects on loan demand can be estimated using the approach
described in Chapter 4, but with the new loan and accessibility
conditions in effect. If the data available are not very extensive, it
may be efficient for these estimates to be informed by, or based on,
lenders’ opinions of the impacts.
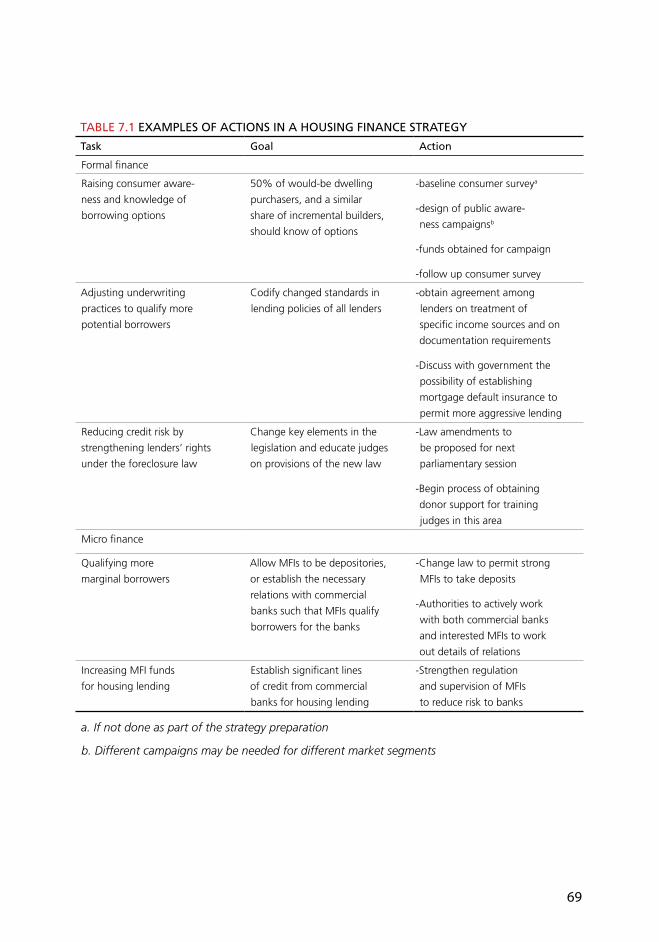
��
TablE 7.1 EXaMPlEs OF aCTIOns In a HOUsInG FInanCE sTRaTEGY
Task Goal action
Formal finance
Raising consumer aware-
ness and knowledge of
borrowing options
50% of would-be dwelling
purchasers, and a similar
share of incremental builders,
should know of options
-baseline consumer surveya
-design of public aware-
ness campaignsb
-funds obtained for campaign
-follow up consumer survey
Adjusting underwriting
practices to qualify more
potential borrowers
Codify changed standards in
lending policies of all lenders
-obtain agreement among
lenders on treatment of
specific income sources and on
documentation requirements
-Discuss with government the
possibility of establishing
mortgage default insurance to
permit more aggressive lending
Reducing credit risk by
strengthening lenders’ rights
under the foreclosure law
Change key elements in the
legislation and educate judges
on provisions of the new law
-Law amendments to
be proposed for next
parliamentary session
-Begin process of obtaining
donor support for training
judges in this area
Micro finance
Qualifying more
marginal borrowers
Allow MFIs to be depositories,
or establish the necessary
relations with commercial
banks such that MFIs qualify
borrowers for the banks
-Change law to permit strong
MFIs to take deposits
-Authorities to actively work
with both commercial banks
and interested MFIs to work
out details of relations
Increasing MFI funds
for housing lending
Establish significant lines
of credit from commercial
banks for housing lending
-Strengthen regulation
and supervision of MFIs
to reduce risk to banks
a. If not done as part of the strategy preparation
b. Different campaigns may be needed for different market segments

�0
aFTER THE RECOMMEnDaTIOns
Typically a task force or commission, like the one under discussion here, is appointed by the country’s Prime Minister or President. When it completes its deliberations, its report is delivered to the person who appointed it. Once it is accepted, perhaps with some modi-fications, implementation can begin.

�1
THE aCTIOn Plan
After months of preparation and discussion, the assignment of responsibility may have long been determined. It is critical that the Committee is confident that those assigned responsibilities have the necessary resources and essential authority to be executed. Where authority is questionable, it may be within the Committee’s abilities to strengthen it
- by requesting a formal delegation of author-ity from the Central Bank, the Minister of Finance or another senior official under whose competence the matter would fall.
Critical to this is to account for the inter-rela-tions among action items in preparing the Plan and in assigning responsibilities. This is the case when changes to laws are required because often a change in one law requires a change in a related law. Additionally, it is wise to present a package of related legislative changes to parliament for consideration as a block, which often streamlines parliamentary consideration.
An example of exactly such a case occurred in the Russian Federation in 2004 when the gov-ernment submitted a large package of related, and in some case interlocking, changes into existing law and the Civil Code along with new laws to the State Duma (parliament). The legislation was essential for implementa-
At this stage in the strategy development process a recommended course of action has been agreed upon by the commission and its sponsor. Two more steps remain to realise the strategy: converting the list of recommenda-tions into action and assigning responsibility for the plans’ implementation.
THE Plan COMPlETED
With respect to the action plan, the tasks to be done should be specifically stated in the approved recommendations, if the format outlined in chapters 6 and 7 was followed. But these do not constitute an action plan. Two key ingredients are still missing: assign-ment of responsibility for executing each task and the development of a schedule governing when those actions should be carried out.
Table 8.1 takes the recommendations laid out in Table 6.4 and adds these two additional parameters to them--responsibility is assigned and realistic time lines established. This format is similar to that used by many governments in developing their legislative programme for the coming year and should be familiar to many readers.
08
��
tion the governent’s new “Affordable Housing Programme.” Over the 1997-2007 period, Russia in effect had a “rolling strategic devel-opment” for its housing sector, with a particu-lar emphasis on housing finance. The 2004 legislative package included improvements in mortgage foreclosure procedures, created the necessary legal basis for a full range of secondary market operations, set the basis for the creation of a credit bureau, streamlined registration procedures and made significant improvements in the ability of developers to deliver housing on fully serviced lots. An annotated list of these actions is included in Appendix 1; note the large number of legisla-tive actions in the last 10 days of 2004.
Returning to the Action Plan, the time lines will have greater uncertainty, in part because of the time it takes for the strategy to receive final approval relative to the legislature’s schedule. If the legislature is scheduled to meet shortly after the plan’s approval, action may have to wait until the following session—better to provide a very carefully-written draft law than a hurried weak draft that is then further weakened in the legislative process.
A couple of points in the Action Plan are worth noting. First, the plan should emphasize the continuing need for consultation with all the relevant stakeholders so that coalitions for advancing the innovations remain strong. It is likely that road blocks will be encountered and political strategies for overcoming them developed anew.
The second point concerns the implementa-tion schedule. For the particular examples in the tables, the time lines are quite brief, being universally under a year, assuming that the parliament passes the proposed legislation in the next session. The time requirements would
be much greater—several years—if a new institution were created, such as a secondary facility or a credit bureau. Creation of either of these entities is complex and requires sub-stantial up-front cash and experienced experts to lead development. Those drawing up the action plan schedule involving the creation of new agencies are well-advised to consult similar organisations in other countries that have recently become operational to learn how long it took for the agency to go from concept to an operational entity.
ManaGInG IMPlEMEnTaTIOn
Who manages the implementation process is extremely important. It is as important as who was elected to oversee the strategy’s development. Generally speaking, it is good practice for the agency that led the strategy’s development to oversee its implementation. The advantages are clear. First, the leader will have significant authority to push the process along. Second, his or her team will be fully up-to-speed on the details of the plan and will be in a position to monitor progress. Third, the agency is likely to fully invest in the strategy’s goals and action plan.
The Implementation Committee chairperson should request that each person or organisa-tion assigned a lead responsibility for a task in the action plan prepares a detailed imple-mentation plan in the first four to six weeks after the plan gains final approval. Once approved by the Committee, this will create a concrete guide to the implementers, and a set of milestones against which their progress can be measured.
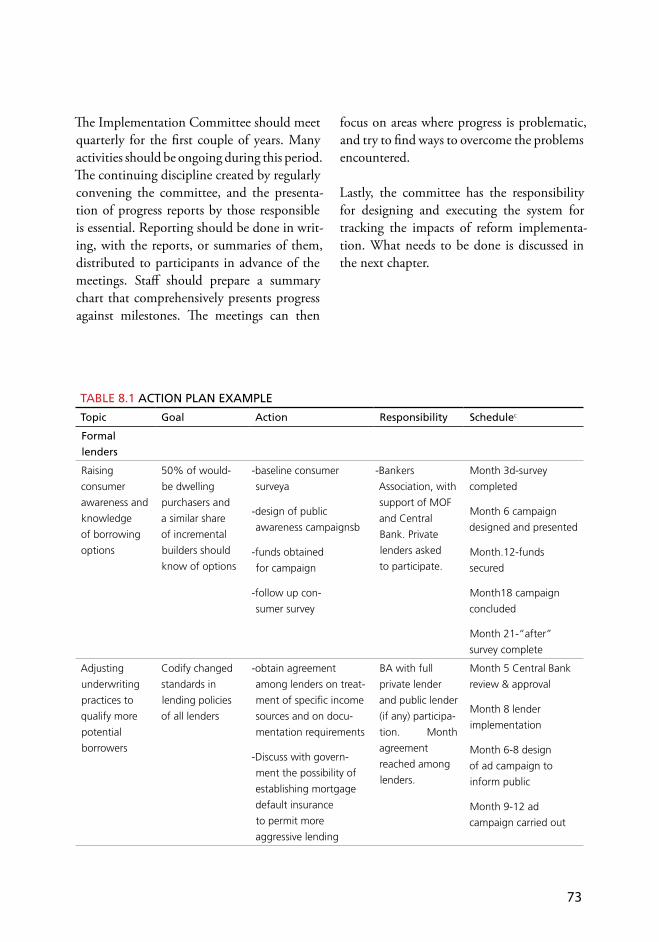
��
The Implementation Committee should meet quarterly for the first couple of years. Many activities should be ongoing during this period. The continuing discipline created by regularly convening the committee, and the presenta-tion of progress reports by those responsible is essential. Reporting should be done in writ-ing, with the reports, or summaries of them, distributed to participants in advance of the meetings. Staff should prepare a summary chart that comprehensively presents progress against milestones. The meetings can then
focus on areas where progress is problematic, and try to find ways to overcome the problems encountered.
Lastly, the committee has the responsibility for designing and executing the system for tracking the impacts of reform implementa-tion. What needs to be done is discussed in the next chapter.
TablE 8.1 aCTIOn Plan EXaMPlE
Topic Goal action Responsibility schedulec
Formal
lenders
Raising
consumer
awareness and
knowledge
of borrowing
options
50% of would-
be dwelling
purchasers and
a similar share
of incremental
builders should
know of options
-baseline consumer
surveya
-design of public
awareness campaignsb
-funds obtained
for campaign
-follow up con-
sumer survey
-Bankers
Association, with
support of MOF
and Central
Bank. Private
lenders asked
to participate.
Month �d-survey
completed
Month 6 campaign
designed and presented
Month.�2-funds
secured
Month�8 campaign
concluded
Month 2�-“after”
survey complete
Adjusting
underwriting
practices to
qualify more
potential
borrowers
Codify changed
standards in
lending policies
of all lenders
-obtain agreement
among lenders on treat-
ment of specific income
sources and on docu-
mentation requirements
-Discuss with govern-
ment the possibility of
establishing mortgage
default insurance
to permit more
aggressive lending
BA with full
private lender
and public lender
(if any) participa-
tion. Month
agreement
reached among
lenders.
Month 5 Central Bank
review & approval
Month 8 lender
implementation
Month 6-8 design
of ad campaign to
inform public
Month 9-�2 ad
campaign carried out

��
TablE 8.1 aCTIOn Plan EXaMPlE
Reducing
credit risk by
strengthening
lenders’ rights
under the
foreclosure law
Change key
elements in the
legislation and
educate judges
on provisions of
the new law
-Law amendments to
be proposed for next
parliamentary session
-Begin process of
obtaining donor
support for training
judges in this area
Ministry of
Justice (lead) and
Central Bank.
Consultation
with consumer
NGOs, lend-
ers, MPs
Min Finance
initiative
discussions
with donors
on training
Month 6 amendments
ready, including vetting
with all parties.
2 Months ahead of
next session, submit-
ted to parliament.
Micro lenders
Qualifying
more marginal
borrowers
Allow MFIs to
be depositories
or establish
the necessary
relations with
commercial banks
such that MFIs
qualify borrowers
for the banks
-Change law to
permit strong MFIs
to take deposits;
-Authorities to
actively work with both
commercial banks and
interested MFIs to work
out details of relations
Ministry of
Justice (lead),
Ministry
of Finance,
Central Bank
Month 6 amendments
ready, including vetting
with all parties.
2 Months ahead of
next session, submit-
ted to parliament
Increasing
MFIs funds
for housing
lending
Establish
significant lines of
credit from com-
mercial banks for
housing lending
-Strengthen regulation
and supervision of MFIs
to reduce risk to banks.
Central Bank is
the MFI regula-
tor; so changes
are within its
competence.
Month 6 amendments
ready, including vetting
with all parties.
Month �2 imple-
mentation, after
formal promulgation
& comment period.
a. If not done as part of the strategy preparation
b. Different campaigns may be needed for different market segments
c. Months after approval
d. Dates are the time at which the action is completed.
��
MOnITORInG REsUlTs09
This chapter is about tracking the impact of the implementation plan. The previous chapter discussed how the committee responsible for implementation could ensure the action plan was being executed. This chapter addresses the fundamental questions: what is the action plan’s effect on the volume of housing finance available, and who is receiving housing loans? Answering these questions will take a special effort—existing data systems are very unlikely to produce the information required.
As suggested earlier, implementing a housing finance strategy takes time—a year or two is an optimistic estimate for putting the first pieces fully in place. Agreements should be reached; laws and regulations changed; responsibilities shifted among government agencies (and the receiving agencies must become effective in their new tasks); and, in some cases, new organisations must be created, such as a credit bureau, or a liquidity or secondary market facility. Therefore, do not expect to see results in the first months of implementation, and do not announce to the public that major changes will be visible in the short-term.
Effective monitoring is best done from both the supply- and demand-sides of the housing finance market. What information should be gathered and who should do it are the subjects discussed below. A fundamental point is that there must be baseline data or information
that can be used in measuring change.15 If the tasks outlined in Chapters 4 and 5 were carried out, the necessary information is in hand. If this information was not gathered in preparing the plan, then very similar informa-tion must be gathered as soon as the action plan is approved.
DEManD OR HOUsEHOlD sIDE
The data that will be obtained from lenders (outlined below) will provide very good information on regulated lenders’ activities, and summary information on their lending patterns. However, some lenders may be left out, such as developers selling units on an in-stallment basis and, in some countries, some Micro Finance Institutions making housing loans. Information reported by households is an invaluable supplement to the regulatory reports data. But it is more than that: it shows
�5 Even though the analysis will compare developments over time with
the conditions at baseline, strictly speaking it will not be measuring
impacts but rather changes. To measure impact one must be able to
hold everything else constant. In other words, one has to take into
account everything else going on that might increase housing loan
volume and its distribution over the period and net out the effects of
everything except the strategy’s implementation. To take an example,
say that an international bank entered the country early in the plan
implementation period, and the bank became a very active housing
lender. While this results in an increase in housing lending, this event
probably cannot be associated with the strategy.
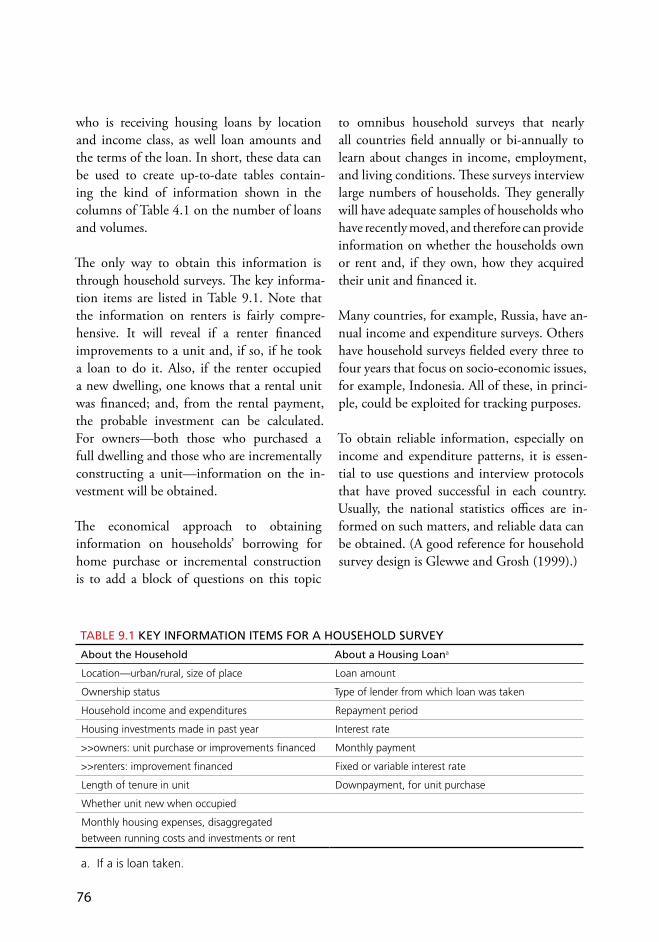
��
who is receiving housing loans by location and income class, as well loan amounts and the terms of the loan. In short, these data can be used to create up-to-date tables contain-ing the kind of information shown in the columns of Table 4.1 on the number of loans and volumes.
The only way to obtain this information is through household surveys. The key informa-tion items are listed in Table 9.1. Note that the information on renters is fairly compre-hensive. It will reveal if a renter financed improvements to a unit and, if so, if he took a loan to do it. Also, if the renter occupied a new dwelling, one knows that a rental unit was financed; and, from the rental payment, the probable investment can be calculated. For owners—both those who purchased a full dwelling and those who are incrementally constructing a unit—information on the in-vestment will be obtained.
The economical approach to obtaining information on households’ borrowing for home purchase or incremental construction is to add a block of questions on this topic
to omnibus household surveys that nearly all countries field annually or bi-annually to learn about changes in income, employment, and living conditions. These surveys interview large numbers of households. They generally will have adequate samples of households who have recently moved, and therefore can provide information on whether the households own or rent and, if they own, how they acquired their unit and financed it.
Many countries, for example, Russia, have an-nual income and expenditure surveys. Others have household surveys fielded every three to four years that focus on socio-economic issues, for example, Indonesia. All of these, in princi-ple, could be exploited for tracking purposes.
To obtain reliable information, especially on income and expenditure patterns, it is essen-tial to use questions and interview protocols that have proved successful in each country. Usually, the national statistics offices are in-formed on such matters, and reliable data can be obtained. (A good reference for household survey design is Glewwe and Grosh (1999).)
TablE 9.1 KEY InFORMaTIOn ITEMs FOR a HOUsEHOlD sURVEY
about the Household about a Housing loana
Location—urban/rural, size of place Loan amount
Ownership status Type of lender from which loan was taken
Household income and expenditures Repayment period
Housing investments made in past year Interest rate
>>owners: unit purchase or improvements financed Monthly payment
>>renters: improvement financed Fixed or variable interest rate
Length of tenure in unit Downpayment, for unit purchase
Whether unit new when occupied
Monthly housing expenses, disaggregated
between running costs and investments or rent
a. If a is loan taken.

��
sUPPlY sIDE
The Implementation Committee will be inter-ested in three aspects of lenders’ operations: profiles of the housing loans being made and to whom lenders are making housing loans; the incidence of borrowers being late in mak-ing their loan repayments and the incidence of actual loans-in-default (usually defined as a loan being delinquent 90 days or more); and, whether lenders are extending the term of their liabilities, i.e. increasing the average maturity of liabilities, by obtaining term loans, selling bonds, or refinancing their housing loans with a secondary facility.
lOan anD bORROWER PROFIlEs
Reports that regulators receive regularly are the best vehicle for monitoring housing loan origination: loan volume for mortgages, other home purchase loans, home improvement loans, and incremental construction loans; the terms for each type of loan (Loan-To-Value distribution by loan length and loan size); the market segment (as measured by borrower income) the loans are serving; and the geographic distribution of different types of loans. One should expect over time to see these statistics change in the directions targeted by the strategy.
There are two approaches for regulators to use in obtaining detailed information on loan types. The standard quarterly call reports completed by lenders could be expanded to include the number of loans, total loan vol-umes, and means for Loans-To-Value’s, loan terms, and geographic distribution of lending. The standard reports will need modification to collect the above data; but, once the reports have been programmed for computer produc-
tion, there is little further work required of the lenders. There are a couple of disadvan-tages to this approach, however: it increases the reporting burden on lenders significantly, and it is rather inflexible since the form will have to be changed in case information needs change.
The alternative is to require lenders to provide on a quarterly basis a set of data with exten-sive information about each loan. The data can then be analysed by the regulator’s staff to produce all the tables of interest, including those reported in the regulator’s published statistics.16 Because a borrower’s income and dwelling location could be included in the data supplied, it would be possible to produce tables similar to those coming from the de-mand side analysis.17 As noted, however, the coverage of lenders will not be as extensive as from the demand data.
If there are lenders who are not currently sub-ject to such reporting requirements, perhaps Micro Finance Institutions, their reporting re-quirements should be changed to provide the
�6 If there is a credit bureau with comprehensive coverage operating,
another option is to identify all housing loans by purpose and type
(unit purchase, etc.). The credit bureau could then use its data base
to prepare the tables needed by the implementation committee.
�7 There is likely to be a significant disparity in the incomes reported in
the demand surveys and the lender reports. In demand surveys most
households tend to understate their incomes for fear of attracting
attention of the tax collectors or others. The incentive is just the
opposite when applying for a loan. Here the household wants to
convince the lender of how large his income is so that he can qualify
for a larger loan. The differences in a household’s motivation in
reporting its income can lead to some very misleading conclusions. In
the mid-�980s, for example, staff at one of the multi-national lenders
compared the income profiles of mortgage borrowers from India’s
Housing Development Finance Corporation with income data from a
general household survey and concluded (incorrectly) that HDFC was
only serving the very wealthiest of all Indians.

��
above data. Those implementing the strategy should be prepared for it to take some time for Micro Finance Institutions to change their data systems to provide the data.
DElInQUEnCIEs anD DEFaUlTs
Clearly, widening the income and geographic distribution of housing finance loans will achieve little if borrowers are unable to repay the loans, i.e. they default. Part of the strategy may be getting formal sector lenders to relax some elements of their underwriting stand-ards to enable a greater share of households to qualify for loans. If delinquencies and default accelerate, then such changes must be reviewed. Close tracking of arrears and defaults on housing loans is, therefore, very important.
Regulators routinely require reporting on delinquencies and defaults. But they do not distinguish generally by loan purpose, although they may ask for a separate account-ing of consumer and business loans. The Implementation Committee will need to con-vince regulators of the importance of separate information on housing loans and receive it at least semi-annually.
Alternatively, the loan-level data set men-tioned earlier could be structured as a panel, so that it assigned a unique identifier to each loan that could be tracked over time. The data set would need to include information on payment status, i.e. current, 30 days past due, etc. and fully paid, and the reason for full payment.
TERM DIsTRIbUTIOn OF lIabIlITIEs
In addition to knowing who is receiving housing loans, the Strategy Implementation Committee is also interested in the term of distribution of lenders’ liabilities. Several elements in the Action Plan are likely to be actions designed to extend the average term of liabilities, thereby lowering interest rate risk. The term distribution of liabilities is a standard part of the call report for commercial banks’ and non-bank financial institutions. Regulators of other types of lenders should make certain that this information is col-lected. If unregulated lenders are significant housing lenders, periodic—perhaps semi-an-nual—surveys may be required to gather this essential information.
WHO PREPaREs THE analYsIs anD REPORTs?
The inventory of information to be collected is extensive. How are all the data to be trans-formed into crisp reports that inform the Implementation Committee of developments? Who will do the work?
The assignment of responsibility needs to be made when the Action Plan is being devel-oped so that the responsible party pays close attention to the information in call reports and surveys. Critically, the assignment should go to an entity with the necessary resources to carry out the task.
��
The decision about who should carry out the analysis and report writing involved in tracking changes is also an important element. Again, there are two broad options: the agency that has been responsibile for this task can as-sign staff to it, or it can contract out for these services. The agency should decide for itself which solution is superior. It is sometimes dif-ficult to find funds for contracting out, or to be sure that the funding will be available year after year. On the other hand, the agency may not have staff who have the necessary skills in manipulating the large household-level and loan-level data sets that may be involved.
Whoever draws the assignment, their initial task will be to prepare a detailed plan for data acquisition and analysis. Table shells for reports should be prepared for review by the Implementation Committee.
REVIEWInG REsUlTs
The Implementation Committee should re-view information on the results of Action Plan implementation just as it reviews progress on plans already achieved. Within its first two quarterly meetings, the Committee should
review the monitoring plan in detail, and approve it when it is satisfactory. Particular attention should go towards the report table and chart formats—they must be in a form that will be understandable to Committee members. Thereafter, semi-annual reports by the monitoring team would be appropriate.
After the first year or eighteen months, when increases in loan volumes and changes in the distribution of loans reach a notable level, the Implementation Committee is advised to begin holding regular press conferences or is-suing press releases that report progress to the public. These news items can serve as a con-tinuing reminder to the public of the changes in lending practices and may encourage more potential borrowers to explore loan options in depth. The information on increased loan volumes may also stimulate lenders who were initially reluctant to enter this market to a significant degree.

�0

�1
REFEREnCEs
Angel, S. (2002) Housing Policy Matters: A Global Analysis. Oxford: Oxford University Press.
Aziz, S., K. Selim, Serageldin, H., Kama, Hl. (2007) Housing Demand Study for Greater Cairo. Cairo: Bearing Point, Technical Assistance for Policy Reform Project Report, processed.
Avery, R.B., Beeson, P.E., and Schniderman, M.S. (1999) “Neighborhood Information and Home Mortgage Lending,” Journal of Urban Economics, 45, 2, 287-310.
Angel, S., and Amtapunth, P. (1989) “The Low-cost Rental Housing Market in Bangkok,” Habitat International, 13, 173-75.
Babatz, G. (2004) “The Role of the Sociedad Hipotecaria Federal in the Development of the Mexican Mortgage Market,” Housing Finance International, March, 42-51.
Beck, T., Demirguc-Kunt, A., and Peria, M.S.M. (2005) “Reaching Out:
Access to and Use of Banking Services Across Countries.” Washington, DC: World Bank Policy Working Paper 3752.
Buckley, R. (1994) “Housing Finance in Developing Countries: The Role of Credible
Contracts,” Economic Development and Cultural Change, 42, 2, 317-32.
CGAP. (2002) “Apex Institutions in Microfinance.” Washington, DC: CGAP Working Paper no. 6.
Cain, A. (2008) “Housing Microfinance in Post-conflict Angola: Overcoming Socioeconomic Exclusion Through Land Tenure and Access to Credit,” Environment & Urbanization, 19, 2, 361-90.
Chan,C.K., Yao, Y.M., Zhao, S.X.B. (2003) “Self-help Housing Strategy for Temporary Populations in Guangzhou, China,” Habitat International, vol.27, no.3, pp.19-35.
Chiquier, L. (2006) Untitled Presentation. Washington, DC: World Bank Group, Housing Finance Conference, “To Build Sound and Accessible Housing Finance Systems,” March 15-17.
Chiquier, L., Hassler, O., Lea, M. (2004) Mortgage Securities in Emerging Markets. Washington, DC: World Bank, Policy Working Paper 3370.
Claessens, S. (2006) “Access to Financial Services: A Review of the Issues and Public Policy Objectives,” World Bank Research Observer, vol.21, no.2, pp.207-40.
��
Dale-Johnson, D., and Towle, G. (2002) “The Mexican Mortgage Market: Has the Ship Come In?” Housing Finance International, June, 19-28.
Dieckmann, R. (2007) Microfinance: An Emerging Investment Opportunity. Frankfurt: Deutsche Bank Research, International Topics, Current Issues, December 19.
Diamond, D., Jr., and Lea, M. (1992) “Housing Finance in Developed Countries: An International Comparison of Efficiency,” Journal of Housing Research, 3, 1, 1-271.
European Fund for Southeastern Europe (EFSE). (2007) Annual Report. Luxembourg: Oppenheim Pramerica Asset Management S.a.r.l.
Ferguson, B., and Navarrete, J. (2003) “New Approaches to Progressive Housing in Latin America: A Key to Habitat Programs and Policy,” Habitat International, 27, 309-23.
Glewwe, P. and Grosh, M. (1999) Designing Household Survey Questionnaires for Developing Countries: Lessons from 10 Years of LSMS. Washington, DC: World Bank.
Government of Tanzania and UN-Habitat. (2003) Re-Establishment of Effective Housing Finance Mechanisms in Tanzania: The Potentials and the Bottlenecks. Nairobi: United Nations Human Settlements Programme, processed.
Hegedus, J., and Struyk, R. (eds.) (2006) Housing Finance: New and Old Models in Central Europe, Russia, and Kazakhstan, Central European University Press.
Hegedus, J. et al. (2004) “Potential Effects of Mortgage and Subsidy Programs on Housing Affordability: The Cases of Budapest and Moscow,” European Journal of Housing Research, 4, 2, 151-84.
Hoffman, M. (1991) “Rental Housing in Urban Indonesia,” Habitat International, 15, 181-206.
Honohan, P., and Beck, T. (2007). Making Finance Work for Africa. Washington, DC: World Bank.
Ikejiofor, U. (1998) “Tyranny of Inappropriate Policies: Sharing as Housing Strategy among Middle/Low Income Households in Abuja, Nigeria,” Cities, 15, 6, 429-36.
Isern, J., and Porteous, D. (2005) “Commercial Banks and Microfinance: Evolving Models of Success.” Washington, DC: CGAP, Focus Note, no. 28.
Ivatury, G. (2006) Using Technology to Build Inclusive Finance Services. Washington, DC: CGAP Focus Note no.32.
Jaffee, D.W., and Renaud, B. (1997) “Strategies to Develop Mortgage Markets in Transition Economies,” in J. Doukas, V. Murinde and C. Wihlborg (eds.), Financial Sector Reform and Privatization in Transition Economies, Amsterdam: Elsevier Science Publications.
LaCour-Little, M. (2007) “The Home Purchase Mortgage Preferences of Low- and Moderate-Income Households,” Real Estate Economics, 35, 3, 265-90

��
Lea, M. (1999) “Prerequisites for a Successful Secondary Mortgage Market: The Role of the Primary Market.” Washington, D: Inter-American Development Bank, Paper Presented at the Conference on The Development of Mortgage Securitization in Latin American and the Caribbean.
Lipscomb, J.B., and Hunt, H. (1999) “Mexican Mortgages: Structure and Default Incentives, Historical Simulation, 1982-1998,” Journal of Housing Research, 10, 2, 235-59.
Mayo, S.K., Malpezzi, S., and Gross, D.J. (1986) “Shelter Strategies for the Urban Poor in Developing countries, World Bank Research Observer, 1, 2, 183-203.
McCarthy, D. (1996) Program for Financing Construction of Residential Real Estate in Russia. Washington, DC: Urban Institute, Russia Housing Sector Reform Project, proc-essed.
McIntosh, C., Sadoulet, E., and de Janvry, A. (2006) “Better Lending and Better Clients: Credit Bureau Impact on Microfinance.” Madison: University of Wisconsin, Assets and Market Access Collaborative Research Support Program, BASIS Brief no. 45.
Merrill, S. and Whiteley, D. (2003) “Establishing a Mortgage Guarantee Insurance in Transition and Emerging Markets: A Case Study of Kazakhstan,” Housing Finance International, September, 10-19.
Mints, V. (2004) “Strategies of Transitional Countries to Establish a Housing Finance System: The Russian Experience,” Housing Finance International, December, 25-31.
Ogu, V.I., and Ogbuozobe, J.E.. (2001) “Housing Policy in Nigeria: Towards Enablement of Private Housing Development,” Habitat International, 25, 473-92.
Okpala, D., Mutizwa-Mangiza, N., and Moisseev, I. (2005) Financing Urban Housing: United Nations Global Report on Human Settlements. Nairobi: UN Habitat.
Okpala, D. (1994) “Financing Housing in Developing Countries: A Review of the Pitfalls and Potentials in the Development of Formal Housing Finance Systems,” Urban Studies, 31, 9, 1571-84.
Pierce, M. (2007) “Accessing International Capital Markets.” Cairo: Presentation at the Third Microfinance Policy Forum, April 18.
Porteous, D. (2007) Just How Transformational is M-Banking? Johannesburg: FinMark Trust.
Pugh, C. (1994) “Development of Housing Finance and the Global Strategy for Shelter,” Cities, 11, 6, 384-92.
Rabenhorst, C., and Butler, S.. (2007) Tanzania: Action Plan for Developing the Mortgage Finance Market—Report on Legal and Regulatory Issues in the Mortgage Market in Tanzania. Washington, DC: Urban Institute Report to The First Initiative.
Renaud, B. (1996) Housing Finance in Transition Economies: The Early Years in Eastern Europe and the Former Soviet Union. Washington, DC: World Bank Policy Research Working Paper No. 1565.
Siembieda, W.J., and Moreno, E.L. (1997) “Expanding Housing Choices for the Sector

��
Popular: Strategies for Mexico,” Housing Policy Debate, 8, 3, 651-77.
Sims, D. (2007) Review of Egyptian Subsidized Housing Programs and Lessons Learned. Cairo: Report Prepared by the Technical Assistance Policy Reform Project, processed.
Smets, P. (1999) “Housing Finance Trapped in a Dilemma of Perceptions: Affordability Criteria for the Urban Poor in India,” Housing Studies, 14, 6, 821-38.
Stephens, M. (2006) “Housing Finance, ‘Reach’ and Access to Owner-occupation in Western Europe.” York: University of York, Centre for Housing Policy Working Paper.
Struyk, R., Kokularupan, N., and Patel, N. (2008, forthcoming) “Indonesian Home Purchasers’ Loan Preferences,” Housing Finance International.
Struyk, R. (2007) “Egyptian Consumer Knowledge and Attitudes on Mortgage Finance and Property Registration,” Housing Finance International, December, pp. 33-43.
Struyk, R. and Brown, M. (2006) “Update on Egyptian Mortgage Lending,” Housing Finance International, December, 32-6.
Struyk, R., and Roman, I. (2008, forthcom-ing) “Home Purchase in Nascent Mortgage Markets: Determinants of Who Borrows and Who Pays Cash in Cairo,” Habitat International.
Struyk, R. (ed.) (2000) Homeownership and Housing Finance Policy in the Former Soviet Bloc: Costly Populism. Washington, DC: Urban Institute.
Tomlinson, M. (2007) A Literature Review on Housing finance Development in Sub-Saharan Africa. Vorna Valley, South Africa: FinMark Trust.
UN-Habitat. (2002) Financing Adequate Shelter for All: Addressing the Housing Finance Problem in Developing Countries. Nairobi: UN Habitat.
UN-Habitat. (2005) Financing Urban Shelter: Global Report on Human Settlements 2005. London: Earthscan for UN Habitat.
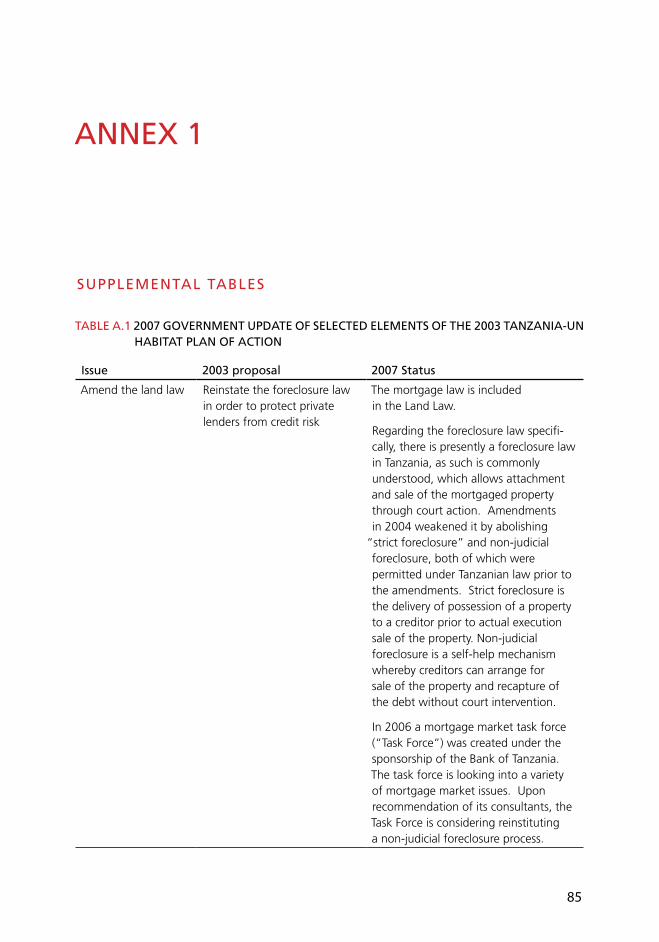
��
annEX 1
sUPPlEMEnTal TablEs
TablE a.1 2007 GOVERnMEnT UPDaTE OF sElECTED ElEMEnTs OF THE 2003 TanZanIa-Un HabITaT Plan OF aCTIOn
Issue 2003 proposal 2007 status
Amend the land law Reinstate the foreclosure law in order to protect private lenders from credit risk
The mortgage law is included in the Land Law.
Regarding the foreclosure law specifi-cally, there is presently a foreclosure law in Tanzania, as such is commonly understood, which allows attachment and sale of the mortgaged property through court action. Amendments in 2004 weakened it by abolishing
“strict foreclosure” and non-judicial foreclosure, both of which were permitted under Tanzanian law prior to the amendments. Strict foreclosure is the delivery of possession of a property to a creditor prior to actual execution sale of the property. Non-judicial foreclosure is a self-help mechanism whereby creditors can arrange for sale of the property and recapture of the debt without court intervention.
In 2006 a mortgage market task force (“Task Force”) was created under the sponsorship of the Bank of Tanzania. The task force is looking into a variety of mortgage market issues. Upon recommendation of its consultants, the Task Force is considering reinstituting a non-judicial foreclosure process.

��
Issue 2003 proposal 2007 status
Recognize the monetary value of undeveloped
land to make land a principal loan
security. In the interim, accord mortgage
lenders special fore-closure powers.
As of 2007 the law still does not permit a conveyance of an occupancy right to undeveloped land acquired from the state, which is the sole owner of all Tanzanian land. This is an anti-speculation device favored in quite a few developing countries. The upshot is that in theory a right holder cannot pledge the land occupancy right to obtain a loan for constructing a home on vacant land. Formal amendment of this law is under review by the Task Force, including creating an exception for residential mortgage lending.
Clarify the status of spouses in mortgaging matrimonial homes.
No progress, but the issue is under review by the Task Force. The consultants to the Task Force have recommended a variety of approaches to the issue of undisclosed spouses.
Banks adopt standard disclosure sheet in
customary and small mortgages.
No progress. As of 2007 there were no specific disclosure and consumer protection requirements in the mort-gage law. Upon recommendation by its consultants, this issue is under consideration by the Task Force.
Condominium Law Introduce condominium law to facilitate
easy sale of multi-family housing.
No progress. The consultants to the Task Force have recommended that adoption of a condominium law be considered, and a draft model law was provided to the Task Force. Apparently a few informal commercial condomini-ums are being created in Dar by con-tract under a common ownership theory.
Land Delivery Systems
Improve efficiency in land and liens registration through capacity building to facilitate mortgage lending.
There is an ongoing effort to upgrade performance of the registry with international assistance. Contracts with international consulting firms for techni-cal assistance were signed in 2007. The project is expected to provide diagnos-tics and system and human resources upgrading. This is a long-term process.

��
Issue 2003 proposal 2007 status
Embark on legal regularization of spontaneous settlements through creation of cadastres and half-cadastres.
The Ministry of Lands is currently implementing a project of temporary licensing of land occupancy in unplanned urban areas, granting 2 year, renewable occupancy licenses to informal occupants. It is expected that this programme will induce informal occupants to come forward. The project is expected to be completed by 20�5, and will encompass most informal settlement areas of Dar es Salaam.
Underwriting system Establish a Credit Reference Law and Bureau to facilitate easy underwriting of borrowers by lenders.
No progress as of early 2007, but the matter is under consideration by the Task Force. The Task Force consultants provided an outline of a credit reporting law.
Strengthen the regulatory bodies of accounting, valua-tion and auditing professions to achieve accountability, transparency and professional codes ofconduct.
Appraisal practice is under consideration by the Task Force. No information is available on accounting and auditing.
Mortgage Lending Regulatory Framework
Adequately regulate and supervise mortgage lending to give confidence to investors.
No progress; the appropriate level of supervision by the BOT is under consideration by the Task Force.
Reduce the minimum reserve requirement (MMR) for mortgage lenders to broaden lending.
Under consideration by the Task Force.
Mobilization of Housing Finance Funds
Bring together Pensions Funds (NSSF, PPF, LAPF, PSPF) and commercial banks to negotiate on releasing long-term funds to mortgage lending basing on risk and reward system.
No apparent progress; polices under review by the Task Force.
Work out mechanism of creat-ing a housing fund through compulsory savings, sale of Government housing stock etc.
No progress.

��
Issue 2003 proposal 2007 status
Work towards starting a secondary mortgage market re-financing facility or apex in-dependent housing institution.
In the opinion of the Task Force, there is enough law in place now to develop a simple secondary market, in particular through a re-financing facility or apex institution. The Bank of Tanzania has recently asked the World Bank for assistance in creating a business plan for a re-financing institution and the request is under consideration.
The Tanzania Securities Commission is anticipating review and possible adoption of the assets backed securities law adopted by Kenya as part of an ongoing effort to create an integrated East African financial market.
Work towards evolving savings and credit associa-tions into building societies providing mortgages and housing micro-finance.
Tanzania has a wide variety of sav-ings and credit cooperatives and micro-finance institutions. The regula-tory framework has been significantly improved in recent years. Some are beginning to think about housing lending, or at least incremental housing loans/upgrading loans.

��
TablE a.2 sUMMaRY OF RUssIan FEDERaTIOn aFFORDablE HOUsInG MaRKET InITIaTIVE sTaTUs OF lEGIslaTIVE PROPOsals, JanUaRY 2005
Document title Proposed changes Effective date
�. Housing Code of the Russian Federation, No.�88-FZ, �2.29.2004
Regulates core legal relations in the housing sector.
Delineates the housing sector authorities of the federal, subfederal and local governments.
Regulates rights and duties of home-owners and their family members.
Determinates eligibility criteria for providing units in social housing and registration as low-income households.
Establishes procedures for allocation of units in social, departmental or special-purpose housing stock, and for regulation of the use of these types of property.
Determinates the legal status of common-use property in multifamily buildings. Sets main principles of multifamily building management.
Provides regulations for associations of homeowners, housing construction and housing cooperatives.
Regulates the policy of rent and service fee collection and the policy of providing social assistance in making payments for housing and utility services.
March 0�, 2005

�0
Document title Proposed changes Effective date
2. On Carrying the Housing Code of the Russian Federation into Effect, No. �89-FZ, �2.29.2004
Establishes the procedure and term for carrying the Housing Code of the Russian Federation into effect:
Declares stale the Housing Code of the RSFSR (except as provided), RF Law “On Fundamentals of the Federal Housing Policy”, federal law “On Associations of Homeowners” and several other legislative acts;
Terminates free privatization of housing;
Regulates procedures for keeping records of households put on the waiting list before March 0�, 2005 as eligible to improve their housing conditions and procedures for allocating units in social housing to them for social rent.
Binds housing/housing construction coopera-tives, in which all equity contributions are paid, to re-register as associations of homeowners.
Regulates the transfer of land under multifamily buildings to homeowners living in them for common (equity) ownership.
January ��, 2005.
Free privatization and de-privatization will be cancelled on January 0�, 2007 (those who become tenants of public and municipal housing after March 0�, 2005, are not eligible to privatize housing free of charge).
Housing/housing construction cooperatives, which have all equity con-tributions paid and failed to re-register as associations of homeowners, will be liquidated from January 0�, 2007.
�. On Introducing Amendments into Article 446 of the Russian Federation Civil Procedure Code, No.�94-FZ, �2.29.2004
Stipulates that mortgaged residential units and land plots, the foreclosure on which is regu-lated by the federal mortgage law, should be withdrawn from the privately-owned property forbidden for court-sanctioned foreclosure.
January 09, 2005
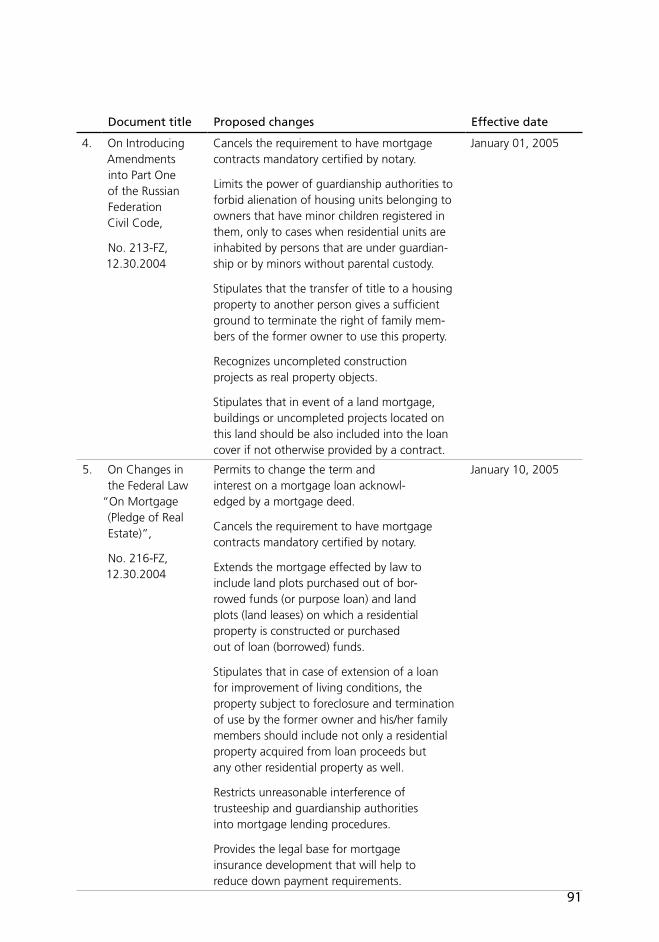
�1
Document title Proposed changes Effective date
4. On Introducing Amendments into Part One of the Russian Federation Civil Code,
No. 2��-FZ, �2.�0.2004
Cancels the requirement to have mortgage contracts mandatory certified by notary.
Limits the power of guardianship authorities to forbid alienation of housing units belonging to owners that have minor children registered in them, only to cases when residential units are inhabited by persons that are under guardian-ship or by minors without parental custody.
Stipulates that the transfer of title to a housing property to another person gives a sufficient ground to terminate the right of family mem-bers of the former owner to use this property.
Recognizes uncompleted construction projects as real property objects.
Stipulates that in event of a land mortgage, buildings or uncompleted projects located on this land should be also included into the loan cover if not otherwise provided by a contract.
January 0�, 2005
5. On Changes in the Federal Law
“On Mortgage (Pledge of Real Estate)”,
No. 2�6-FZ, �2.�0.2004
Permits to change the term and interest on a mortgage loan acknowl-edged by a mortgage deed.
Cancels the requirement to have mortgage contracts mandatory certified by notary.
Extends the mortgage effected by law to include land plots purchased out of bor-rowed funds (or purpose loan) and land plots (land leases) on which a residential property is constructed or purchased out of loan (borrowed) funds.
Stipulates that in case of extension of a loan for improvement of living conditions, the property subject to foreclosure and termination of use by the former owner and his/her family members should include not only a residential property acquired from loan proceeds but any other residential property as well.
Restricts unreasonable interference of trusteeship and guardianship authorities into mortgage lending procedures.
Provides the legal base for mortgage insurance development that will help to reduce down payment requirements.
January �0, 2005

��
Document title Proposed changes Effective date
6. On Credit Histories, No. 2�8-FZ, �2.�0.2004
Permits the disclosure of fair credit information about borrowers to lenders (commercial banks) through regulation of credit history bureaus.
June 0�, 2005
Article 5, Part � (obliging credit insti-tutions to provide a credit bureau with information on borrowers with their consent) will come into force from September 0�, 2005.
7. On Making Changes in Selected Legislative Acts of the Russian Federation in Connection with Enactment of the Federal Law “On Credit Histories”, No. 2�9-FZ, �2.�0.2004
Brings the effective legislation in line with the federal law “On Credit Histories”.
Introduces changes into the Russian Federation Civil Code (clarifying the concept of bank secrecy), changes into the Russian Federation Code of Administrative Violations envisag-ing sanctions for violation of rules of credit history maintenance and safekeeping and information disclosure, and changes into the federal law “On Banks and Banking” obliging credit institutions to provide information to at least one credit history bureau.
June 0�, 2005
Article �, Item � and Item � (Para
“b”), making credit institutions liable for non-disclosure of in-formation to a credit bureau, will come into force from September 0�, 2005.
8. On Introducing Amendments into the Federal Law
“On Mortgage Securities No. �9�-FZ, �2.29.2004
Specifies the procedure for sale of mortgage coverage in event of default (bankruptcy) of its issuer.
Stipulates that the size of coverage of mortgage securities issued by credit institu-tions may exceed the size of obligations under them for no more than 20 percent.
Permits issuance of housing mortgage bonds.
Permits credit institutions to issue mortgage-backed certificates.
Provides a means for issuing mortgage securities with variable interest rates.
January 09, 2005
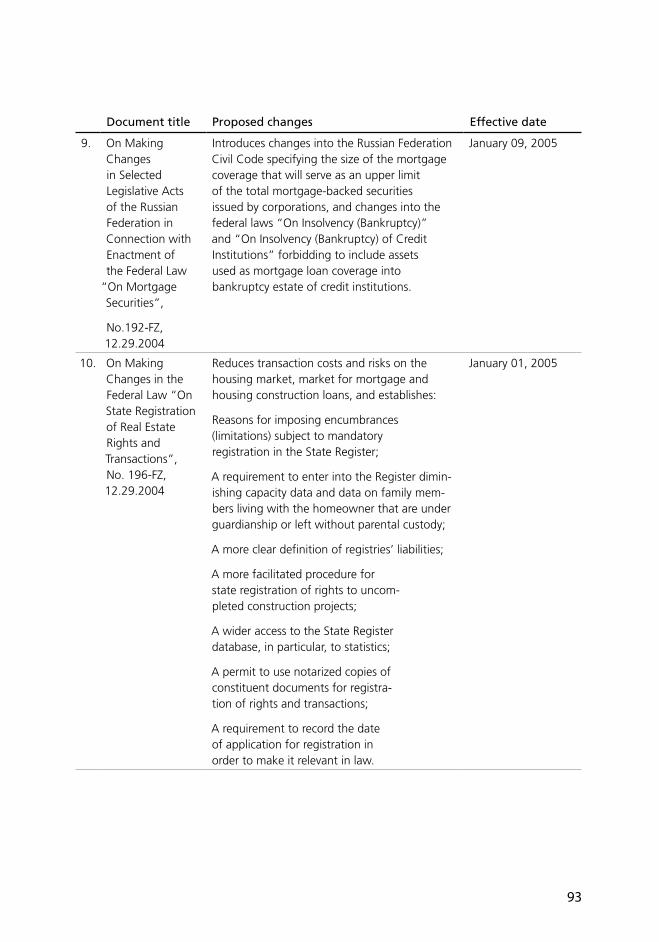
��
Document title Proposed changes Effective date
9. On Making Changes in Selected Legislative Acts of the Russian Federation in Connection with Enactment of the Federal Law
“On Mortgage Securities”,
No.�92-FZ, �2.29.2004
Introduces changes into the Russian Federation Civil Code specifying the size of the mortgage coverage that will serve as an upper limit of the total mortgage-backed securities issued by corporations, and changes into the federal laws “On Insolvency (Bankruptcy)” and “On Insolvency (Bankruptcy) of Credit Institutions” forbidding to include assets used as mortgage loan coverage into bankruptcy estate of credit institutions.
January 09, 2005
�0. On Making Changes in the Federal Law “On State Registration of Real Estate Rights and Transactions”, No. �96-FZ, �2.29.2004
Reduces transaction costs and risks on the housing market, market for mortgage and housing construction loans, and establishes:
Reasons for imposing encumbrances (limitations) subject to mandatory registration in the State Register;
A requirement to enter into the Register dimin-ishing capacity data and data on family mem-bers living with the homeowner that are under guardianship or left without parental custody;
A more clear definition of registries’ liabilities;
A more facilitated procedure for state registration of rights to uncom-pleted construction projects;
A wider access to the State Register database, in particular, to statistics;
A permit to use notarized copies of constituent documents for registra-tion of rights and transactions;
A requirement to record the date of application for registration in order to make it relevant in law.
January 0�, 2005
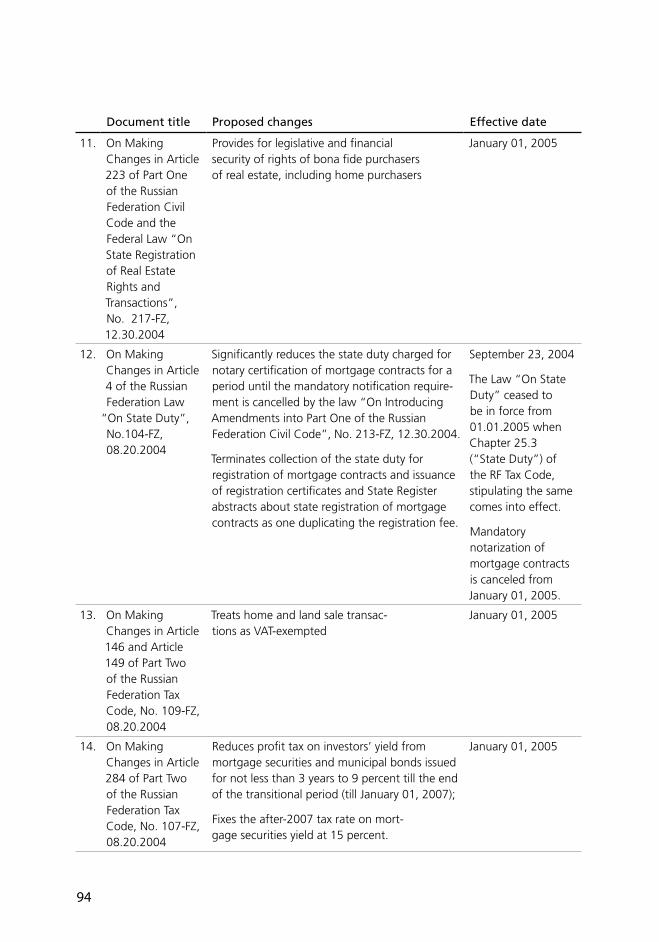
��
Document title Proposed changes Effective date
��. On Making Changes in Article 22� of Part One of the Russian Federation Civil Code and the Federal Law “On State Registration of Real Estate Rights and Transactions”, No. 2�7-FZ, �2.�0.2004
Provides for legislative and financial security of rights of bona fide purchasers of real estate, including home purchasers
January 0�, 2005
�2. On Making Changes in Article 4 of the Russian Federation Law
“On State Duty”, No.�04-FZ, 08.20.2004
Significantly reduces the state duty charged for notary certification of mortgage contracts for a period until the mandatory notification require-ment is cancelled by the law “On Introducing Amendments into Part One of the Russian Federation Civil Code”, No. 2��-FZ, �2.�0.2004.
Terminates collection of the state duty for registration of mortgage contracts and issuance of registration certificates and State Register abstracts about state registration of mortgage contracts as one duplicating the registration fee.
September 2�, 2004
The Law “On State Duty” ceased to be in force from 0�.0�.2005 when Chapter 25.� (“State Duty”) of the RF Tax Code, stipulating the same comes into effect.
Mandatory notarization of mortgage contracts is canceled from January 0�, 2005.
��. On Making Changes in Article �46 and Article �49 of Part Two of the Russian Federation Tax Code, No. �09-FZ, 08.20.2004
Treats home and land sale transac-tions as VAT-exempted
January 0�, 2005
�4. On Making Changes in Article 284 of Part Two of the Russian Federation Tax Code, No. �07-FZ, 08.20.2004
Reduces profit tax on investors’ yield from mortgage securities and municipal bonds issued for not less than � years to 9 percent till the end of the transitional period (till January 0�, 2007);
Fixes the after-2007 tax rate on mort-gage securities yield at �5 percent.
January 0�, 2005
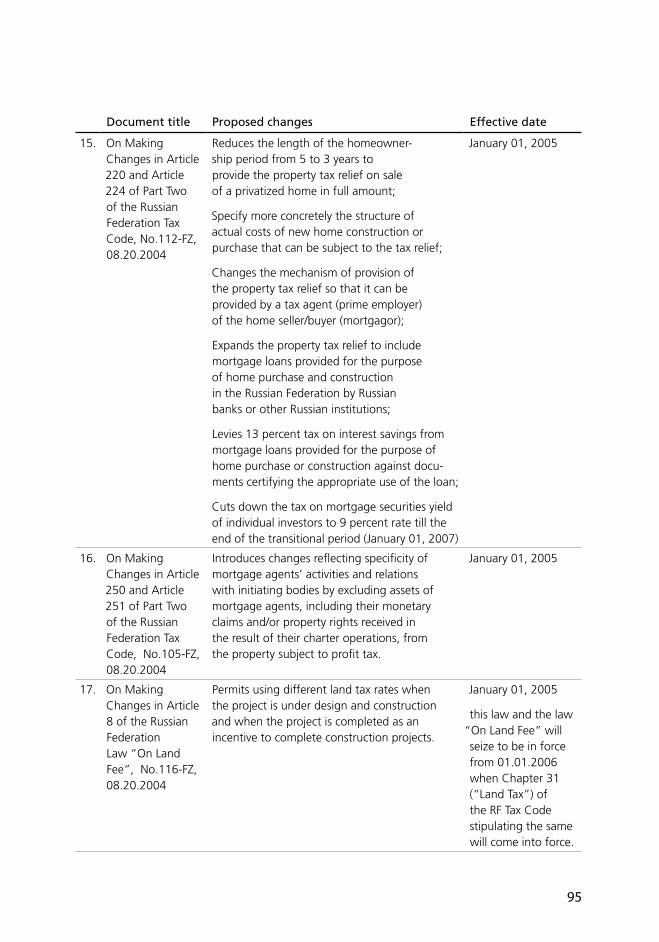
��
Document title Proposed changes Effective date
�5. On Making Changes in Article 220 and Article 224 of Part Two of the Russian Federation Tax Code, No.��2-FZ, 08.20.2004
Reduces the length of the homeowner-ship period from 5 to � years to provide the property tax relief on sale of a privatized home in full amount;
Specify more concretely the structure of actual costs of new home construction or purchase that can be subject to the tax relief;
Changes the mechanism of provision of the property tax relief so that it can be provided by a tax agent (prime employer) of the home seller/buyer (mortgagor);
Expands the property tax relief to include mortgage loans provided for the purpose of home purchase and construction in the Russian Federation by Russian banks or other Russian institutions;
Levies �� percent tax on interest savings from mortgage loans provided for the purpose of home purchase or construction against docu-ments certifying the appropriate use of the loan;
Cuts down the tax on mortgage securities yield of individual investors to 9 percent rate till the end of the transitional period (January 0�, 2007)
January 0�, 2005
�6. On Making Changes in Article 250 and Article 25� of Part Two of the Russian Federation Tax Code, No.�05-FZ, 08.20.2004
Introduces changes reflecting specificity of mortgage agents’ activities and relations with initiating bodies by excluding assets of mortgage agents, including their monetary claims and/or property rights received in the result of their charter operations, from the property subject to profit tax.
January 0�, 2005
�7. On Making Changes in Article 8 of the Russian Federation Law “On Land Fee”, No.��6-FZ, 08.20.2004
Permits using different land tax rates when the project is under design and construction and when the project is completed as an incentive to complete construction projects.
January 0�, 2005
this law and the law “On Land Fee” will seize to be in force from 0�.0�.2006 when Chapter �� (“Land Tax”) of the RF Tax Code stipulating the same will come into force.

��
Document title Proposed changes Effective date
�8. On Making Changes in Article 60 of the Russian Federation Budget Code, No.���-FZ, 08.20.2004
Permits local governments to transfer proceeds they receive when sell or lease out governmentally-owned land plots for housing construction purposes, to their budgets in full till the completion of land rights shar-ing between governments of all levels.
January 0�, 2005
Article 60 of the Budget Code will seize to be in force from 0�.0�.2006 when the federal law “On Making Changes in the RF Budget Code for Regulating Intergovernmental Fiscal Relations”, which includes the similar clause into Article 6� of the Budget Code, will come into force.
�9. Town Planning Code of the Russian Federation, No.�90-FZ, �2.29.2004
Improves legislative regulation of urban planning and construction activities through:
delineation of land use and town planning authorities of federal, re-gional and local governments;
determination of the contents and rules of execution and approval of land-use planning documents;
determination of the contents, structure and rules of execution and ap-proval of local zoning regulatory acts
- land use and development rules;
determination of the contents and rules of execution and approval of layout documents;
requirement of mandatory organization of pubic hearings before approval of town planning regulatory documents;
determination of the contents of project documentation and rules of execution and issuance of permits for starting and manag-ing building activities, exercising building inspections and state building supervision, commissioning of completed projects;
determination of the contents and rules of man-agement of town planning information support;
Establishment of liability for violation of the town planning legislation.

��
Document title Proposed changes Effective date
20. On Enactment of the Town Planning Code of the Russian Federation, No.�9�-FZ, �2.29.2004
�. Specifies deadlines for putting in force specific clauses of the RF Town Planning Code and legal effects that will arise after expiration of them:
- Prohibition to reserve and seize lands for public or municipal purposes, as well as to transfer them from one category to another in default of land-use docu-ments – from January 0�, 2006;
- Prohibition to execute layout documents in default of land-use docu-ments - from January 0�, 2006;
- Prohibition to perform any kind of state expert review of project documenta-tion except the unified state expert examination - from January 0�, 2007;
- Prohibition to perform any kind of state control over construction or general modernization projects except the unified state supervision - from January 0�, 2007;
- Prohibition of preliminary land allocation for construction purposes and issuance of building permits in default of land use and development rules – from January 0�, 20�0.
2. Introduces changes into the RF Land Code, in particular,
- determines specifics of public or municipal land allocation for housing construction purposes including the requirement to sale or lease out such lands through public auctions, and to follow the specific procedure for allocation of land plots for integrated residential development;
- specifies public and municipal projects, for which seize (buy-out) of land plots is permitted
January 09, 2005
Clauses requiring to allocate land for housing construc-tion purposes only through public auctions and regulating such auc-tion procedures will cone into force from October 0�, 2005.
Chapter On Town Planning Information Support will come into force from July 0�, 2006.

��
Document title Proposed changes Effective date
2�. On Making Changes in Article 256 of the Russian Federation Tax Code, No. ��0-FZ, 08.20.2004
Permits private operators to depreciate the property they are authorised to use throughout the whole term of the investment agreement.
January 0�, 2005
22. On General Principles of Regulation of Public Utility Tariffs, No. 2�0-FZ, �2.�0.04)
Introduces general principles of regulation of public utility tariffs, price (tariff) premiums and connection fees.
Delineate utility tariff regulation authorities of the federal, subfederal and local governments.
Obliges all regulators and utilities to comply with tariff and price regula-tion procedures set by the law.
January 0�, 2006
Clauses permitting to exceed the cost of electric and heat power based on tariffs and price premiums paid for electric and heating goods and services will come into force from June 0�, 2008
2�. On Making Changes in Selected Legislative Acts of the Russian Federation in Connection with Enactment of the Federal Law “On General Principles of Regulation of Public Utility Tariffs”, No. 2��-FZ, �2.�0.2004
Introduces changes into the RF Civil Procedure Code increasing administrative responsibility of officials for violation of the established tariff regulation rules and procedures.
Introduces changes into federal laws “On Electric Power Production”, “On Public Regulation of Electricity and Heat Tariffs in the Russian Federation”, “On Amendment or Recognizing Ineffective Selected Legislative Acts of the Russian Federation Due to Enactment of federal laws “On Changes and Additions to the Federal law “On General Principles of Organization of Legislative (Representative) and Executive Bodies of State Power in the RF Subject” and “On General Principles of Local Self-governance in the Russian Federation” clarifying tariff regulation procedures for local natural monopolies
– heat and electric power producers.
“On Gas Supply in the Russian Federation” to set more clear procedures for regulating tariffs of natural monopolies – gas, heat and electric power providers
January 0�, 2006
Changes to the RF Civil Procedure Code and Federal Law #�22-FZ approved as of 08/22/2004 will come into force from January 02, 2005.
Changes to the federal law #4�-FZ approved as of 04/�4/�995 permit-ting to exceed the cost of electric and heat power based on tariffs and price premiums paid for electric and heating goods and services will come into force from June 0�, 2008.
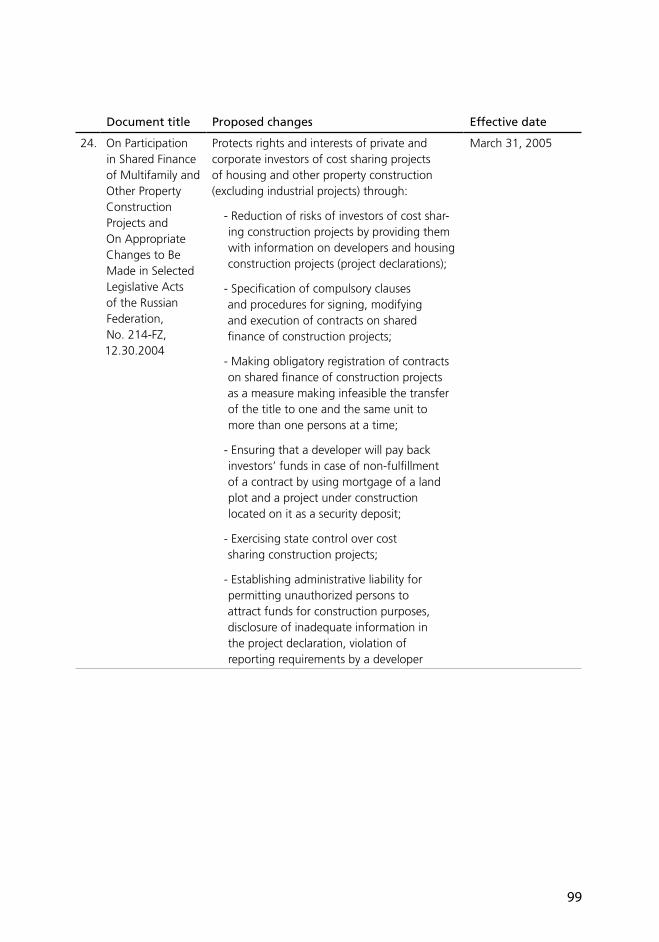
��
Document title Proposed changes Effective date
24. On Participation in Shared Finance of Multifamily and Other Property Construction Projects and On Appropriate Changes to Be Made in Selected Legislative Acts of the Russian Federation, No. 2�4-FZ, �2.�0.2004
Protects rights and interests of private and corporate investors of cost sharing projects of housing and other property construction (excluding industrial projects) through:
- Reduction of risks of investors of cost shar-ing construction projects by providing them with information on developers and housing construction projects (project declarations);
- Specification of compulsory clauses and procedures for signing, modifying and execution of contracts on shared finance of construction projects;
- Making obligatory registration of contracts on shared finance of construction projects as a measure making infeasible the transfer of the title to one and the same unit to more than one persons at a time;
- Ensuring that a developer will pay back investors’ funds in case of non-fulfillment of a contract by using mortgage of a land plot and a project under construction located on it as a security deposit;
- Exercising state control over cost sharing construction projects;
- Establishing administrative liability for permitting unauthorized persons to attract funds for construction purposes, disclosure of inadequate information in the project declaration, violation of reporting requirements by a developer
March ��, 2005
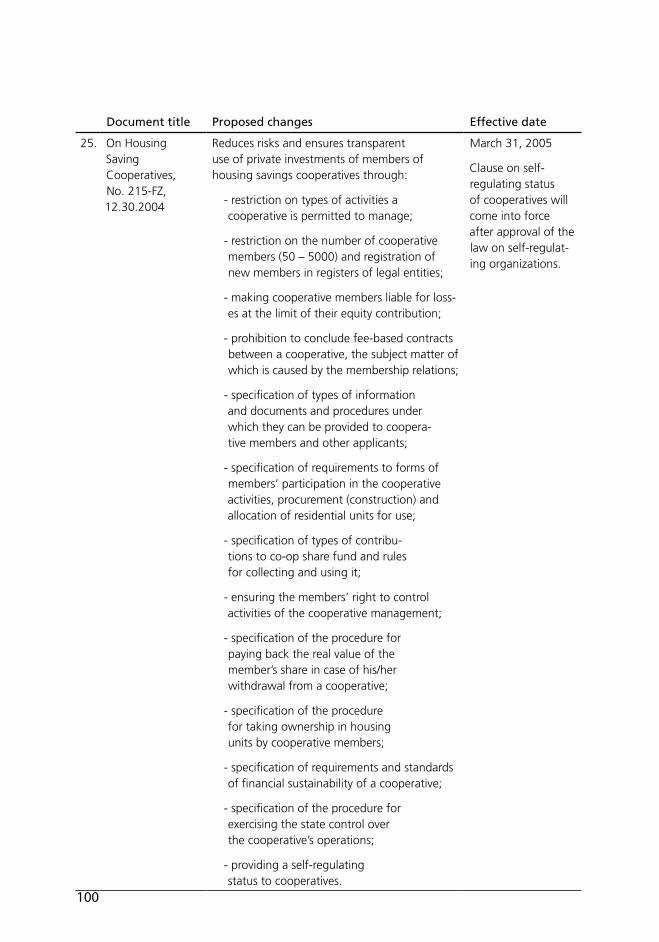
100
Document title Proposed changes Effective date
25. On Housing Saving Cooperatives, No. 2�5-FZ, �2.�0.2004
Reduces risks and ensures transparent use of private investments of members of housing savings cooperatives through:
- restriction on types of activities a cooperative is permitted to manage;
- restriction on the number of cooperative members (50 – 5000) and registration of new members in registers of legal entities;
- making cooperative members liable for loss-es at the limit of their equity contribution;
- prohibition to conclude fee-based contracts between a cooperative, the subject matter of which is caused by the membership relations;
- specification of types of information and documents and procedures under which they can be provided to coopera-tive members and other applicants;
- specification of requirements to forms of members’ participation in the cooperative activities, procurement (construction) and allocation of residential units for use;
- specification of types of contribu-tions to co-op share fund and rules for collecting and using it;
- ensuring the members’ right to control activities of the cooperative management;
- specification of the procedure for paying back the real value of the member’s share in case of his/her withdrawal from a cooperative;
- specification of the procedure for taking ownership in housing units by cooperative members;
- specification of requirements and standards of financial sustainability of a cooperative;
- specification of the procedure for exercising the state control over the cooperative’s operations;
- providing a self-regulating status to cooperatives.
March ��, 2005
Clause on self-regulating status of cooperatives will come into force after approval of the law on self-regulat-ing organizations.

101
Document title Proposed changes Effective date
26. On Making Changes in Part Two of the Russian Federation Tax Code and Several Other Legislative Acts of the Russian Federation, (passed the first reading)
Permits local governments to impose local real estate tax on residential property (home units, summer and garden cottages, garages, land plots under them and land plots allocated for construction of these types of property) based on large-scale market-based assessment of property value, uniform tax rates for both corporate and individual taxpayers and a tax-exempted minimum provided for individual homeowners.
27. On Conclusion of Investment Agreements in Public Service Sector, draft federal law # 5�72�-4 (passed the first reading)
Calls for involvement of private operators into municipal infrastructure management and de-velopment as a measure to solve one of the key problems slowing down the housing production growth– the lack of developed land plots

10�
10�
annEX b
EsTIMaTInG THE DEManD FOR HOUsInG FInanCE
This Annex outlines how to prepare housing finance demand estimates on a comprehen-sive basis. It discusses what one does when the necessary data are not at hand. The final sec-tion addresses households’ access to housing finance. Effective demand for loans will not be actualised unless potential borrowers have a basic understanding of loan products, there are lenders willing to make loans to those bor-rowers, and these lenders are accessible by the borrowers.
There are two examples that will help orient the reader on how housing finance demand analyses is executed: (i) by Hoek-Smit and ii) by Hegedus, are provided below (Boxes B.1 and B.2). Their approached are contrasted below. As shown, neither is fully comprehen-sive.
nEW HOUsInG nEEDs VERsUs aFFORDablE WanTs.
Hoek-Smit used household growth rates by decile by region to estimate the need for new housing by region. She did not measure the size of the housing stock requiring upgrad-ing or consolidation. Hegedüs, on the other hand, did not measure future housing need
for either new or upgraded units. Rather, he estimated the number of households which would choose to buy a new home or upgrade their existing one. He assumed that all house-holds would make this choice if the change resulted in a housing solution at least 25 per-cent higher in cost than their current dwelling and they could afford the expense.
HOUsInG PURCHasE aFFORDabIlITY assUMInG aCCEss TO a HOUsInG lOan.
Both authors assessed housing finance afford-ability for first time buyers by examining the PTY ratio banks allow, the down payment required, and loan terms and interest rates available by location and borrowers’ income decile. Both authors also calculated the loan size and housing prices these households could afford by income decile and location, and compared these figures to housing costs. Hegedüs assessed affordability of home up-grading (either buying a more expensive unit or remodeling the owner’s existing unit) and the resulting impact on demand; Hoek-Smit assessed affordability for first time home buy-ers only. Neither considered consolidation of sub-standard units.
Perhaps the best way to describe what is required in greater detail is with a stylised
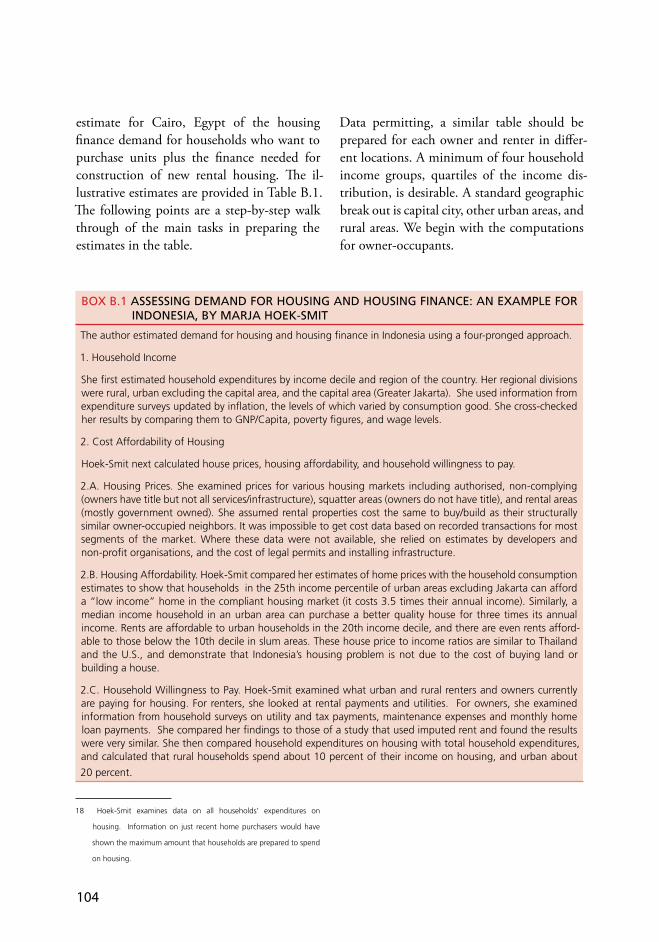
10�
estimate for Cairo, Egypt of the housing finance demand for households who want to purchase units plus the finance needed for construction of new rental housing. The il-lustrative estimates are provided in Table B.1. The following points are a step-by-step walk through of the main tasks in preparing the estimates in the table.18
�8 Hoek-Smit examines data on all households’ expenditures on
housing. Information on just recent home purchasers would have
shown the maximum amount that households are prepared to spend
on housing.
Data permitting, a similar table should be prepared for each owner and renter in differ-ent locations. A minimum of four household income groups, quartiles of the income dis-tribution, is desirable. A standard geographic break out is capital city, other urban areas, and rural areas. We begin with the computations for owner-occupants.
bOX b.1 assEssInG DEManD FOR HOUsInG anD HOUsInG FInanCE: an EXaMPlE FOR InDOnEsIa, bY MaRJa HOEK-sMIT
The author estimated demand for housing and housing finance in Indonesia using a four-pronged approach.
�. Household Income
She first estimated household expenditures by income decile and region of the country. Her regional divisions were rural, urban excluding the capital area, and the capital area (Greater Jakarta). She used information from expenditure surveys updated by inflation, the levels of which varied by consumption good. She cross-checked her results by comparing them to GNP/Capita, poverty figures, and wage levels.
2. Cost Affordability of Housing
Hoek-Smit next calculated house prices, housing affordability, and household willingness to pay.
2.A. Housing Prices. She examined prices for various housing markets including authorised, non-complying (owners have title but not all services/infrastructure), squatter areas (owners do not have title), and rental areas (mostly government owned). She assumed rental properties cost the same to buy/build as their structurally similar owner-occupied neighbors. It was impossible to get cost data based on recorded transactions for most segments of the market. Where these data were not available, she relied on estimates by developers and non-profit organisations, and the cost of legal permits and installing infrastructure.
2.B. Housing Affordability. Hoek-Smit compared her estimates of home prices with the household consumption estimates to show that households in the 25th income percentile of urban areas excluding Jakarta can afford a “low income” home in the compliant housing market (it costs �.5 times their annual income). Similarly, a median income household in an urban area can purchase a better quality house for three times its annual income. Rents are affordable to urban households in the 20th income decile, and there are even rents afford-able to those below the �0th decile in slum areas. These house price to income ratios are similar to Thailand and the U.S., and demonstrate that Indonesia’s housing problem is not due to the cost of buying land or building a house.
2.C. Household Willingness to Pay. Hoek-Smit examined what urban and rural renters and owners currently are paying for housing. For renters, she looked at rental payments and utilities. For owners, she examined information from household surveys on utility and tax payments, maintenance expenses and monthly home loan payments. She compared her findings to those of a study that used imputed rent and found the results were very similar. She then compared household expenditures on housing with total household expenditures, and calculated that rural households spend about �0 percent of their income on housing, and urban about
20 percent.

10�
Continuation.......Box B.1 Assessing Demand for Housing and Housing Finance: An Example for Indonesia, by Marja Hoek-Smit
�. New Housing Needs by Region and Income Decile
Hoek-Smit used household growth rates by decile by region to estimate the need for new housing in the market segments detailed in 2.A. above. The overall requirement for new urban housing for newly formed households was 700,000 to 750,000 units per annum. Two-thirds of new households will be migrants. Rural areas will not gain households. She did not measure the size of the housing stock requiring upgrading or consolidation.
4. Housing Purchase Affordability Assuming Access to a Formal or Informal Sector Housing Loan
Hoek-Smit next assessed housing finance affordability by examining the PTY ratio banks allow, the downpay-ment required, and loan terms and interest rates available by region and income decile of recipient.
She then calculated the loan size and housing costs households could afford by income decile and region, and compared these figures to housing costs. Median income urban households cannot afford the lowest cost developer-built house. The 20th income decile in urban areas can only afford a loan �/6th the size of the lowest cost housing solution. She attributes this lack of housing affordability to Indonesia’s high interest rates (20 to �0+ percent for housing loans) and the �0+ percent downpayment requirement. She did not assess affordability of home upgrading or consolidation projects.

10�
bOX b.2 assEssInG DEManD FOR HOUsInG anD HOUsInG FInanCE: an EXaMPlE FOR MOsCOW anD bUDaPEsT, bY JÓZsEF HEGEDÜs ET al.
Hegedüs et al. assessed the demand for housing and housing finance in Moscow and Budapest using data at the household level. They calculated the mortgage size households could afford and the maximum cost of housing each household could purchase. They compared these figures with the price of housing available for purchase in the cities to determine the maximum potential demand for housing and housing finance for first time buyers and those who could “trade up” to a higher-priced unit.
I. Household Level Data
The authors identified household level data sets containing information on income, savings, current dwelling values and equity, and credit history using recent household surveys.
I.A Income The authors employed extant household surveys and adjusted the figures for underreporting.
I.B Savings They estimated individual household savings by considering the total volume of savings nationwide and then either assigned a pro rata figure based on the aggregate adjusted incomes [Moscow] or estimated an amount using variables like household income, durable consumption goods, etc. [Budapest].
I.C Owner’s Dwelling Value For potential buyers who already were owner-occupants, the authors estimated the value of Moscow homeowner’s dwellings with information from the Moscow Statistics Committee and the Moscow Guild of Realtors. For Budapest the authors used a hedonic pricing model with data on survey respondents’ evaluations of their units.
I.D Home Equity This figure was calculated as home value minus current mortgage amount.
I.E Credit History Households were assumed to have good credit if they had no arrears in housing and utility payments in the last �2 months.
II. Maximum Affordable Mortgage Size
The authors calculated households’ maximum affordable mortgage size with the above data and the following terms available from banks at the time of the study: interest rate (including extant subsidies); maximum loan term; minimum and maximum loan sizes; maximum Loan-To-Value; Payment-to-Income limits; minimum and maximum borrower age limits; and borrower credit history.
III. Maximum Affordable Housing Cost
The authors calculated the maximum housing price households could afford as potential Mortgage Capacity (no. II above) + Savings (I) + Existing Unit Equity (I). In this estimation, they factored in available down payment subsidies and all additional housing purchase/mortgage acquisition costs including home and life insurance fees, taxes, broker fees, and other closing and transactions costs.
IV. Cost of Housing Available for Purchase
The authors estimated three target prices for potential Dwellings (new or existing) households could purchase in each market. These prices were median (50th or median percentile of prices for apartments currently for sale); moderately-priced (25th percentile); and low-priced (�0th percentile).
V. Other Assumptions Made to Estimate Demand
This model assumed: all households choose to buy a new home or upgrade their existing one if the change results in a housing solution at least 25 percent higher in price than their current dwelling; all households that can upgrade their housing situation do so immediately; and all households buy/upgrade to the maximum priced unit they can afford.

10�
Continuation.....Box B.2 Assessing Demand for Housing and Housing Finance: An Example for Moscow and Budapest, by József Hegedüs et al.
HVI. Demand Results
The authors estimated the number of first-time buyer and upgrading households that could afford to purchase each of the target-priced units in IV above. They did not assess demand for apartments that cost above the median price. For the first-time buyer and upgrading household groups, they calculated: the total number of households who could obtain improved housing solutions (purchase and remodel); what percent of total households in the markets these figures represented; the total volume of resulting mortgages; and the total value of resulting housing solutions.
VI. Demand Results
The authors estimated the number of first-time buyer and upgrading households that could afford to purchase each of the target-priced units in IV above. They did not assess demand for apartments that cost above the median price. For the first-time buyer and upgrading household groups, they calculated: the total number of households who could obtain improved housing solutions (purchase and remodel); what percent of total households in the markets these figures represented; the total volume of resulting mortgages; and the total value of resulting housing solutions.

10�
Determine the amount of money each in-come group is prepared to spend monthly on housing, exclusive of running costs, es-pecially utilities. Conceptually, for owners this is the monthly mortgage payment plus costs of maintaining the unit. For renters it is the contract rent, i.e. the payment made to the landlord. The rent figures can be obtained reliably from household surveys. Monthly payments by owners can be more complex to estimate where the tradition is for cash purchase of homes. Two approach-es are possible: (a) observe the monthly fi-nance payments of households in the same income group who have recently purchased their home with a loan and use this plus a standard maintenance allowance;19 or (b) impute the dwelling’s rent and assign this to be the monthly expense.20 Between the two, the first is the preferred method because it is more accurate.
Estimate the average loan size each income group could take by using the monthly pay-ment amount found in the prior step and applying it to the current terms for loans from formal and micro lenders. The notes to the table show the loan terms for formal and micro loans in Egypt. The interest rate for micro loans is much higher than for formal finance (22 versus 13.5 percent) and loan term much shorter (3 versus 10 years). Importantly, the terms for micro loans include a maximum loan amount; no minimum for formal loans is applied al-
�9 Recent loans must be used where loans have fixed interest rates
because, over time with inflation, the share of income the borrower
devotes to the monthly payment declines as income rises and the
payment is fixed. A standard annual maintenance allowance of �
percent of unit value is often used.
20 There are two general approaches to the imputation. Both involve use
of rental information on dwellings similar to the one occupied by each
owner for which the analyst has data. One approach is match general
physical types, e.g., single family unit with three rooms. The second
is to estimate values using an estimated regression model where the
dependent variable is the monthly rent and the independent variables
are the unit’s physical and location attributes.
though one could be in effect. In the table a “—“ in a cell means that the affordable loan amount violates the maximum loan amount constraint.
Estimate the annual number of loans. The prior step tells the analyst the loan size dif-ferent groups can take. This, combined with information on down payment patterns, yields the value of the unit households in each income group can afford to purchase with formal finance and the affordable size of the incremental investment those secur-ing housing incrementally with the help of micro finance can make. The question here is how many households will borrow each year? Conceptually several factors enter this equation:
the number of new households seeking to purchase a unit or begin incremental construction of one;
the number of existing families who have been living in complex households who are now ready to move out;
the number of households who trade up to a better unit; and,
the share of households who will be con-tinuing to develop their units or upgrade their completed units.21
2� Historical demographic data can be used to address point (a) and
then be adjusted according to tenure patterns, i.e., the analyst can
assume that the split between owners and renters continues to be
the same or make another assumption. Information on point (b) can
be obtained from household surveys that include questions on the
plans of sub-families within larger households and from questions that
inquire about the prior living arrangements of new unit occupants.
Similarly, household surveys can provide information on (c) and (d).
Limited information on the incidence of upgrading investments in
different environments suggests that the incidence may vary widely.
(See Struyk (forthcoming) for comparison of Cairo and Manila.) In
many cases, the analyst will just have to use judgment in making these
estimates.
a.
b.
c.
d.

10�
TablE b.1 IllUsTRaTIVE PREsEnTaTIOn OF annUal HOUsInG FInanCE DEManD In CaIRO, 2006a
a. For Cairo owner-occupied housing
Income Decile
Monthly Paymentb
Possible loan amount (lE thousands)
annual number of loanse
annual Funds Required (lE million)
Formalc Microd Formal Micro Formal Micro
First 77.2 5.� 2.0 500 �.0
Second ��6.7 7.7 �.� �,�00 �.4
Third �4�.� 9.� �.7 �,600 5.9
Fourth �64.0 �0.8 4.� 2,�00 9.0
Fifth �9�.� �2.5 5.0 2,800 �4.0
Sixth 200.0 ��.� --
Seventh 225.7 �4.8 --
Eighth 257.8 �6.9 -- 2,000 ��.8
Ninth �28.0 2�.5 -- 5,000 �07.5
Tenth 444.7 29.2 -- 7,000 204.4
Total �4,000 8,�00 �45.7 ��.0
B. For Cairo renter-occupied housing
Income Decile
Monthly Paymentb
Possible loan amount (lE thousands)
annual number of loanse
annual Funds Required (lE million)
Formalc Equityi Formal Equity Formal Equity
First �7 �.6 �.�
Second 56 2.5 2.0
Third 68 2.9 2.5 400 �.0
Fourth 79 �.� 2.9 900 2.6
Fifth 92 �.9 �.� �,500 5.0
Sixth 96 4.0 �.5 2,700 9.4
Seventh �09 4.6 �.9 �,000 ��.7
Eighth �24 5.2 4.5 �,�00 �4.0
Ninth �57 6.6 5.7 700 900 4.6 5.�
Tenth 2�4 9.0 7.7 �,�00 600 9.9 4.6
�,800 ��,200 �4.5 5�.4

110
All of the estimates discussed in the previous paragraph are for the total number of house-holds who are acquiring or improving housing. These give the upper limit to the number of loan takers. To determine the loan volume to plan for, the figures must be reduced to those who will actually take out a loan. A major reduction to the number of possible formal loans may be that many borrowers who could qualify for a loan will not have sufficient purchasing power, combining the loan and the down payment, to purchase a unit in the formal market.22 Also note that the difference between those who could purchase a dwelling unit and those who receive financing is deter-mined in part by formal lenders’ underwriting restrictions, e.g. not counting some sources of income or not counting them fully to determine a borrower’s available income or insisting on units being located in areas with full urban services.
The underlying income data used here are for Cairo, Egypt at end of 2006. The exchange rate then was Egyptian Pounds (LE) 5.7 = USD 1. Source: Sims (2007), table 9.
For households in LE. Based on an assumed expenditure of 25 percent of income on housing
Loan terms are: 13.5 percent interest, 10 year term. Downpayment requirement is 35 percent.
Loan terms are: 23 percent interest, 3 year term, maximum loan amount of LE 20,000. No downpayment require-ment because these are for incremental construction or improvements. At the
22 To make this calculation the analyst augments the amount of the
loan by the average size of the downpayment that unit purchasers
of this income typically pay. This “effective demand” figure is then
compared with the cost of a basic dwelling in the formal market, i.e.,
meeting various building regulations, having clear title, etc.
a.
b.
c.
d.
end of 2006 there were no micro hous-ing loans in Egypt but they were under consideration by several lenders on the terms indicated here.
Assumed numbers for illustrative pur-poses. Includes loans for upgrading as well as full unit new construction and incremental dwelling development.
Rents are the monthly payment. Assumes that renters spend 20 percent less on housing than owners and that 60 percent of the rents paid to the landlord is avail-able for capital costs.
Loan per dwelling unit, not for the whole property.
Loan terms (arbitrarily defined) are: 15 percent for 5 years.
This is an investment of private funds, not a loan. “Loan terms” are the rate of return and period over which the investor wants to recover his investment. They (arbitrarily defined) are: 22 percent for 5 years. No limits.
Obtaining the data for these equations can be simplified by gathering information on actual transactions in each market segment. For the formal sector there should be data from finan-cial authorities on the number of mortgage loans made in the last year. To this volume should be added developers’ installment sales. (Installment sales will likely have different terms from mortgage loans.) Discussions with micro lenders can provide a rough estimate of the number of loans they made in the past year.
Use these number-of-loan values as the starting point. Remember as more lenders offer loans and offer them to a wider range of borrowers, the number of borrowers will
e.
f.
g.
h.
i.
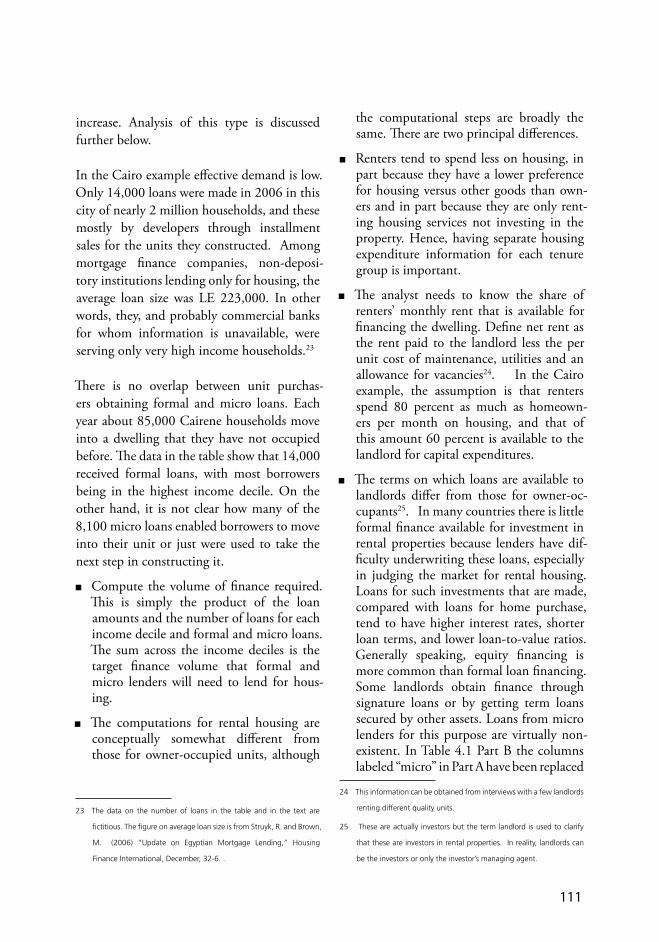
111
increase. Analysis of this type is discussed further below.
In the Cairo example effective demand is low. Only 14,000 loans were made in 2006 in this city of nearly 2 million households, and these mostly by developers through installment sales for the units they constructed. Among mortgage finance companies, non-deposi-tory institutions lending only for housing, the average loan size was LE 223,000. In other words, they, and probably commercial banks for whom information is unavailable, were serving only very high income households.23
There is no overlap between unit purchas-ers obtaining formal and micro loans. Each year about 85,000 Cairene households move into a dwelling that they have not occupied before. The data in the table show that 14,000 received formal loans, with most borrowers being in the highest income decile. On the other hand, it is not clear how many of the 8,100 micro loans enabled borrowers to move into their unit or just were used to take the next step in constructing it.
Compute the volume of finance required. This is simply the product of the loan amounts and the number of loans for each income decile and formal and micro loans. The sum across the income deciles is the target finance volume that formal and micro lenders will need to lend for hous-ing.
The computations for rental housing are conceptually somewhat different from those for owner-occupied units, although
2� The data on the number of loans in the table and in the text are
fictitious. The figure on average loan size is from Struyk, R. and Brown,
M. (2006) “Update on Egyptian Mortgage Lending,” Housing
Finance International, December, �2-6. .
the computational steps are broadly the same. There are two principal differences.
Renters tend to spend less on housing, in part because they have a lower preference for housing versus other goods than own-ers and in part because they are only rent-ing housing services not investing in the property. Hence, having separate housing expenditure information for each tenure group is important.
The analyst needs to know the share of renters’ monthly rent that is available for financing the dwelling. Define net rent as the rent paid to the landlord less the per unit cost of maintenance, utilities and an allowance for vacancies24. In the Cairo example, the assumption is that renters spend 80 percent as much as homeown-ers per month on housing, and that of this amount 60 percent is available to the landlord for capital expenditures.
The terms on which loans are available to landlords differ from those for owner-oc-cupants25. In many countries there is little formal finance available for investment in rental properties because lenders have dif-ficulty underwriting these loans, especially in judging the market for rental housing. Loans for such investments that are made, compared with loans for home purchase, tend to have higher interest rates, shorter loan terms, and lower loan-to-value ratios. Generally speaking, equity financing is more common than formal loan financing. Some landlords obtain finance through signature loans or by getting term loans secured by other assets. Loans from micro lenders for this purpose are virtually non-existent. In Table 4.1 Part B the columns labeled “micro” in Part A have been replaced
24 This information can be obtained from interviews with a few landlords
renting different quality units.
25 These are actually investors but the term landlord is used to clarify
that these are investors in rental properties. In reality, landlords can
be the investors or only the investor’s managing agent.
11�
with those for “Equity” to highlight this point. Including this information in the table is useful for understanding the total supply of capital to the housing sector.
The terms of formal loans to lenders are shown in the notes to the table. For the use of equity, the effective interest rate is the rate of return demanded by the landlord. For Cairo these are stated as 22 percent per year and that the investment should be paid off in five years. Panel B shows only a few rental units financed with formal finance and a modest number with equity.
Panel B shows that 15,000 rental units were financed through loans and equity in 2006, compared with 22,100 owner-occupied units. This is consistent with the surge in new rental contracts occurring since rent control legisla-tion was changed in 1996 to permit new units and newly vacated units to rent at market rates (Aziz et al. (2007), p.34). The overall housing loan requirements for Cairo in 2006 were about LE 393 million26. Obviously, to obtain an estimate of the volume of finance necessary the analyst must sum up the esti-mates prepared for all tenure-location groups.
What about families who cannot afford decent housing i.e. those who should be the target of government assistance? Critical to this is which families are included in this group. The standard here should not be to include all those who cannot afford housing at a point in time. Rather, it should include only those whose prospects are very poor in achieving good housing over an extended time horizon during which many poor people in fact suc-ceed in consolidating their dwellings. An
26 The estimate of total housing investment would also include
downpayments plus another LE 5� million in equity finance for rental
housing plus other equity spending on owner-occupied housing.
informative calculation is to capitalise the potential monthly expenditure on housing. But one also needs to consider the fact that many poor families manage to save significant sums for certain purposes such as marriage of their children. While not all can do this, some can. The argument here is against defining the target group for government assistance using a simple affordability equation. It is better to take a more conservative approach by explic-itly considering local experience in housing attainment.
In forecasting the housing finance require-ments of the future, the steps outlined in Box B.1 taking into account the increases in the number of households, household income growth, and increases in dwelling prices, is definitely important. In the first few years of strategy implementation, the biggest driver of change in finance requirements is likely to be changes in the way lenders underwrite loans, institutional developments that reduce the risk of lending, e.g. stronger foreclosure provi-sions enacted or creation of a credit bureau that provides better information on loan ap-plicants’ credit history, and actions to increase the volume of funds available to lenders for housing loans. It is important to do sensitivity analysis of how the volume of loan demand will differ under alternative assumptions about the pace of adjustments in lending practices as well as growth in household income and dwelling prices.
The conclusion of this analysis is an estimate of loan volume for 2-3 years in the future, or sev-eral estimates that vary with the assumptions about the extent of institutional development achieved, of the required volume of lending by location, tenure, and income group. These are the targets that policymakers should consider when drawing up a strategy.