guide to bio-process lab -...
TRANSCRIPT

COACHES HANDBOOK FOR BIO-PROCESS LAB TABLE OF CONTENTS Part A. INTRODUCTION TO BIO-PROCESS LAB A.1 SCIENCE PROCESS SKILLS – BASIC AND INTEGRATED A.2 SKILLS AND GRADES 5-8 BACKGROUND VIA NATIONAL STANDARDS A.3 SUPERVISORS AND COACHES GUIDE A.4 PREPARATION TIPS FOR STUDENTS A.5 PRINCIPLES FOR THE DESIGN AND ANALYSIS OF EXPERIMENTS Part B. LESSONS TO DEVELOP LIFE SCIENCE PROCESS SKILLS LESSON 1 DESIGNING AN EXPERIMENT LESSON 2 MICROSCOPE REVIEW AND QUIZ LESSON 3 STEREO OR DISSECTING MICROSCOPE REVIEW LESSON 4 LAB EQUIPMENT AND PROPER USAGE LESSON 5 BALANCE REVIEW LESSON 6 METRIC SYSTEM AND MEASUREMENT TIPS LESSON 7 INSTRUMENT LAB AND MEASUREMENT LAB LESSON 8 TECHNOLOGY FOR DATA COLLECTION LESSON 9 OBSERVATIONS AND INFERENCES LESSON 10 FORMULATING A DICHOTOMOUS KEY LESSON 11 GRAPHING AND DATA ANALYSIS LESSON 12 ANALYSIS AND ERRORS LESSON 13 ANALYSIS OF FOOD LABELS LESSON 14 POPULATION DENSITY AND ECOLOGICAL ANALYSIS LESSON 15 GENETICS BACKGROUND AND SAMPLE PROBLEMS Part C. SAMPLE TOURNAMENTS SAMPLE TOURNAMENT #1 SAMPLE TOURNAMENT #2 SAMPLE TOURNAMENT #3 SAMPLE TOURNAMENT #4 NOTE: ANSWER KEYS ARE INCLUDED AFTER EACH LESSON AND SAMPLE TOURNAMENT. GUIDE TO BIO-PROCESS LAB written by Karen L. Lancour 312 W. Bosley Alpena, Michigan 49707
Electronic Version edited by Mark A. Van Hecke August 2007 COPYRIGHT 2008 The SCIENCE OLYM PIAD COACHES MANUEL AND RULES may not be copied without the expressed written permission of Science Olympiad , Inc., except within the school building which holds the membership. Recommended statement to be placed on all printed pages distributed within a school building: “Reproduction for distribution within (school name) by permission of Science Olympiad, Inc.”
|

SCIENCE PROCESS SKILLS Basic Science Process Skills: 1. Observing - using the senses of sight, hearing, taste, smell, and touch to gather information about an object or event. It is description of what was actually perceived. This information is considered qualitative data. 2. Measuring - using standard measures or estimations to describe specific dimensions of an object or event. This information is considered quantitative data. 3. Inferring - formulating possible explanations based upon observations. It is an educated guess based upon previously gathered observations or data. 4. Classifying - grouping or ordering objects or events into categories based upon characteristics or defined criteria. 5. Predicting - guessing the most likely outcome of a future for an event based upon a pattern of
evidence. 6. Communicating - using words, symbols, or graphics to describe an object, action or event. Integrated Science Process Skills: 1. Formulating Hypotheses - stating the expected outcomes for experiments 2. Identifying of Variables - stating the changeable factors that can affect an experiment. It is important to change only the variable being tested and keep the rest constant. The one being manipulated is the independent variable; the one being measured to determine its response is the dependent variable; and all being kept constant are constants or controlled
variables. 3. Defining Variables Operationally - explaining how to measure a variable in an experiment. 4. Describing Relationships Between Variables - explain relationships between variables experiment such as between the independent and dependant variables. 5. Designing Investigations - designing an experiment by identifying materials and
appropriate steps to test a hypothesis. 6. Experimenting - carrying out an experiment. 7. Acquiring Data - collecting qualitative and quantitative data. 8. Organizing Data in Tables and Graphs - making data tables and graphs for data collected. 9. Analyzing Investigations and Their Data - interpreting data, identifying errors, evaluating the hypothesis, formulating conclusions, and recommending further testing where necessary. 10. Formulating Models - recognizing patterns in data and making comparisons to familiar objects
| or ideas.

SUGGESTED SKILLS AND BACKGROUND AREAS FOR LIFE SCIENCE PROGRAMS BASED UPON NATIONAL STANDARDS I. Skills Related to the Scientific Processes of Investigation A. Identifying problems. B. Formulating hypotheses. C. Recognizing differences between hypotheses, theories, and observations. D. Formulating, evaluating, and following procedures. E. Making observations and formulating inferences. F. Making measurements and collecting data. G. Organizing, presenting, and interpreting data.
1. Making data tables, diagrams, charts, and graphs. 2. Using data to make interpretations, comparisons, and predictions. 3. Recognizing kinds of error as random and experimental. 4. Using data to evaluate hypotheses. 5. Performing calculations as area, density, volume, percent, probability, ratios, and population density.
H. Formulating conclusions and inferences. I. Using technology to assist with analysis and formulation of models. J. Understanding new technologies and techniques key to life science labs. K. Communicating and evaluating communications effectively. II. Lab Skills Involved in Life Science Process Lab
A. Knowledge of lab safety procedures and safety symbols. B. Identification and proper use of laboratory equipment such as:
1. Compound light microscope. 2. Dissecting or stereo-microscope. 3. Glassware and typical laboratory equipment. 4. Dissecting equipment. 5. Instruments for measurement and their incrementation. 6. Microbiology and molecular genetics instruments. 7. Physiology instruments. 8. Instruments for collecting and preserving specimens. 9. Equipment used to prepare temporary and permanent slides.
C. Ability to perform typical laboratory procedures such as: 1. Preparing wet mounts. 2. Formulating and using dichotomous keys. 3. Using stains and indicators. 4. Using sterilization and transfer techniques for microbes. 5. Caring for live organisms.
|

III. Common Background Knowledge for Life Science
Based upon the National Science Education Content Standards NOTE: Event Supervisors will provide any specific content necessary in order to perform a requested process task such as the unique morphological features needed to use a dichotomous key.
Grades 5 - 8 A. Structure and Function of Living Systems 1. Levels of organization and the complementary nature of structure and function 2. Structure of cells 3. Functions of cells 4. Tissues and organs 5. Human organism systems 6. Disease - cause and result B. Reproduction and Heredity 1. Continuation of species - sexual and asexual reproduction 2. Sexual reproduction in plants and animals 3. Principles of heredity 4. Traits - influence of heredity and environment C. Regulation and Behavior 1. Homeostasis 2. Regulation of an organism’s internal environment 3. Behavior of organisms 4. Evolution of behavior as a result of adaptation D. Populations and Ecology 1. Populations and their interrelationships - food chains & food webs 2. Functions of specific kinds of populations - producers, consumers, decomposers 3. Role of sunlight and transfer of energy through food webs 4. Ecosystems - biotic and abiotic factors & their interrelationships E. Diversity and Adaptation of Organisms 1. Unity of organisms and evidences of common ancestry 2. Biological evolution through adaptation over many generations 3. Causes for extinction of organisms
|
BIO-PROCESS LAB - GUIDE FOR SUPERVISORS, COACHES, & STUDENTS
This event is a lab-oriented competition involving the fundamental science processes of a middle school life-science program. The event is not meant to be a comprehensive biology course. If specific content is needed when students are being tested on certain process skills, the supervisor will provide that content. The event consists of a series of biological questions or tasks that involve the use of process skills.
Lab Stations and Tasks for Assessing Process Skills
Below is a list of lab stations and types of questions or tasks which might be used to assess science process skills. To allow most students to be successful, it may be a good idea for event supervisors to vary the difficulty of questions at each station! Lab Safety
• Distinguishing "safe" behaviors vs. "unsafe" behaviors, identifying safety symbols, evaluating situations -- what to do "if" or what's wrong.
• Identifying the proper techniques to handle lab emergencies. Observations
• Using senses to notice specific features. • Identifying similarities and differences in features. • Identifying qualitative and quantitative changes in conditions. • Using observable properties to classify objects, organisms or events.
Inferences • Formulating assumptions based upon observations. • Distinguishing between observations and inferences. • Using observations and inferences to identify testable questions or problems.
Problem • Using observations to propose a topic for experimentation. • Narrowing the scope of the topic to specific testable aspects. • Formulate problems within the specific aspects of the topic which are clearly testable. • Identify which of the problems can be tested with materials available. • Generalizing variables to be considered in testing the problem such as “The effect of (the independent variable) upon (the dependent variable.)
Hypothesis • Proposing a hypothesis for a given problem. • Predicting the effect of the change in the independent variable upon the dependent variable. • Explaining the relationship or tend that is expected to occur. • Providing rationale for a hypothesis or prediction. • Determining the testability of a hypothesis based upon materials provided. • Evaluating statements presented with a set of data as to their appropriate label.: 1. logical
hypothesis, 2. illogical hypothesis of contrary to data, 3. not a hypothesis, but a restatement of data, 4. reasonable hypothesis, but not based on data
Predictions • Predicting the results for a proposed lab test or setup. • Selecting predictions based upon previously observed patterns. • Providing rationale for predictions.
Lab Equipment • Identifying pieces of lab equipment and their function. • Identifying appropriate pieces of equipment to perform a specific task. • Selecting and using the appropriate piece(s) of lab equipment for a task.
|
Procedures • Analyzing procedures for flaws in design. • Identifying the proper set of equipment for carrying out an experimental procedure. • Arranging steps of procedures in the appropriate order. • Determining the repeatability of a procedure. • Identifying an appropriate procedure to test a problem.
Design Analysis • Analyzing designs for experiments relative to problem, • Evaluating the basic assumptions used in the design of the experiment. • Identifying components as the independent variable, dependent variable, constants (controlled
variables), standard of comparison (control), and time period for the test. • Evaluating the procedure for repeatability. • Evaluating the materials and appropriateness of the steps in the procedure. • Identifying appropriate types of qualitative and quantitative data to be collected.
Measurement • Identifying the capacity, range, and increments of measuring devices as a ruler, graduated
protractor, caliper, cylinder, pipet, syringe, or thermometer. • Identifying length, temperature, volume, and mass to the capacity of the instrument. • Converting units within the metric system. • Reading the meniscus when measuring liquids in a cylinder.
Balances • Identifying types of balances as electronic and triple beam. • Determining the capacity of the balance, its increments, its readability, the types of auxiliary
weights, the parts of the balance and their function. • Determining the mass of an object to the capacity of the instrument. • Using auxiliary weights to reach the capacity of a triple beam balance.
Microscopy • Understanding of parts of microscope & their function, magnification, appearance of images,
resolution, changes in field with magnification, types of microscopes and their uses. • Preparing a wet mount. • Using a light microscope to perform a requested task. • Using a dissecting microscope to perform a requested task.
Chemical Analysis • Identifying the appropriate reagents for specific chemical testing. • Using reagents as pH paper, iodine, glucose test paper, bromthymol blue for chemical analysis. • Interpreting the results of reagent data.
Dichotomous Key • Using observations to formulate a dichotomous/taxonomic key. • Identifying individuals or objects using a dichotomous key. • Identifying similarities and differences in characteristics from a dichotomous key.
Calculations • Using measurements to determine area, volume, percentages, probabilities, ratios. • Determine population density of a sample. • Performing statistical analysis of raw data as mean, median, mode, and range.
Data Presentation • Preparing an appropriate date table, chart, diagram, illustration. • Evaluating the presentation of data.
|

Graphing
• Selecting the appropriate graph for a set of data as line, bar, and pie graphs. • Identifying the title, source, independent variable & dependent variables, and the legend. • Scaling each axis for a graph. • Preparing a line, bar or pie graph to represent a set of data. • Predicting data points not included in a given graph and/or making a best line fit. • Interpreting a graph and making predictions or inferences based upon the data on a graph.
Analysis of Data • Identifying sources of experimental error or human mistakes in the data. • Determining the validity of results using qualitative and quantitative data. • Interpreting graphs as well as charts and diagrams as food webs, pedigrees, Punnett squares,
food labels, energy and food pyramids, relationships of organisms. • Identifying data which supports or rejects a hypothesis. • Identifying discrepancies between stated hypothesis and actual data. • Understanding cause and effect relationships.
Errors • Identifying human mistakes or blunders. • Identifying experimental errors as systematic errors and random errors. • Making recommendations for eliminating future mistakes or experimental errors. • Explaining the effects that human mistakes or experimental errors upon results.
Conclusions • Selecting the most logical conclusion for given experimental data. • Accepting or rejecting hypotheses based upon data analysis. • Proposing a new hypothesis for rejected hypotheses. • Formulating models • Proposing a future test for inconclusive results.
Some Helpful Hints for Event Supervisors:
• It may help to have questions laminated or placed in sheet protectors. This procedure eliminates damage or tampering during competition.
• Taping questions to the table helps to keep stations organized and undisturbed. • Bring extra items needed at stations as extra rulers.
Quick supervisor checklist of useful items to include stop watches, answer sheets, extra set of questions, tie-breaker sheets, answer keys, highlighter, calculator, extra pencils, red pens, extra mm rulers, stapler, masking tape, scotch tape
|

BIO-PROCESS LAB - GUIDE FOR SUPERVISORS, COACHES, & STUDENTS
This event is a lab-oriented competition involving the fundamental science processes of a middle school life-science program. The event is not meant to be a comprehensive biology course. If specific content is needed when students are being tested on certain process skills, the supervisor will provide that content. The event consists of a series of biological questions or tasks that involve the use of process skills.
Lab Stations and Tasks for Assessing Process Skills
Below is a list of lab stations and types of questions or tasks, which might be used to assess science process skills. To allow most students to be successful, it may be a good idea for event supervisors to vary the difficulty of questions at each station!
Lab Safety • Distinguishing "safe" behaviors vs. "unsafe" behaviors, identifying safety symbols, evaluating
situations -- what to do "if" or what's wrong. • Identifying the proper techniques to handle lab emergencies.
Observations • Using senses to notice specific features. • Identifying similarities and differences in features. • Identifying qualitative and quantitative changes in conditions. • Using observable properties to classify objects, organisms or events.
Inferences • Formulating assumptions based upon observations. • Distinguishing between observations and inferences. • Using observations and inferences to identify testable questions or problems.
Problem • Using observations to propose a topic for experimentation. • Narrowing the scope of the topic to specific testable aspects. • Formulate problems within the specific aspects of the topic which are clearly testable. • Identify which of the problems can be tested with materials available. • Generalizing variables to be considered in testing the problem such as “The effect of (the independent variable) upon (the dependent variable.)
Hypothesis • Proposing a hypothesis for a given problem. • Predicting the effect of the change in the independent variable upon the dependent variable. • Explaining the relationship or tend that is expected to occur. • Providing rationale for a hypothesis or prediction. • Determining the testability of a hypothesis based upon materials provided. • Evaluating statements presented with a set of data as to their appropriate label.: 1. logical
hypothesis, 2. illogical hypothesis of contrary to data, 3. not a hypothesis, but a restatement of data, 4. reasonable hypothesis, but not based on data
Predictions • Predicting the results for a proposed lab test or setup. • Selecting predictions based upon previously observed patterns. • Providing rationale for predictions.
Lab Equipment • Identifying pieces of lab equipment and their function. • Identifying appropriate pieces of equipment to perform a specific task. • Selecting and using the appropriate piece(s) of lab equipment for a task.
|

Procedures • Analyzing procedures for flaws in design. • Identifying the proper set of equipment for carrying out an experimental procedure. • Arranging steps of procedures in the appropriate order. • Determining the repeatability of a procedure. • Identifying an appropriate procedure to test a problem.
Design Analysis • Analyzing designs for experiments relative to problem, • Evaluating the basic assumptions used in the design of the experiment. • Identifying components as the independent variable, dependent variable, constants (controlled
variables), standard of comparison (control), and time period for the test. • Evaluating the procedure for repeatability. • Evaluating the materials and appropriateness of the steps in the procedure. • Identifying appropriate types of qualitative and quantitative data to be collected.
Measurement • Identifying the capacity, range, and increments of measuring devices as a ruler, graduated
protractor, caliper, cylinder, pipet, syringe, or thermometer. • Identifying length, temperature, volume, and mass to the capacity of the instrument. • Converting units within the metric system. • Reading the meniscus when measuring liquids in a cylinder.
Balances • Identifying types of balances as electronic and triple beam. • Determining the capacity of the balance, its increments, its readability, the types of auxiliary
weights, the parts of the balance and their function. • Determining the mass of an object to the capacity of the instrument. • Using auxiliary weights to reach the capacity of a triple beam balance.
Microscopy • Understanding of parts of microscope & their function, magnification, appearance of images,
resolution, changes in field with magnification, types of microscopes and their uses. • Preparing a wet mount. • Using a light microscope to perform a requested task. • Using a dissecting microscope to perform a requested task.
Chemical Analysis • Identifying the appropriate reagents for specific chemical testing. • Using reagents as pH paper, iodine, glucose test paper, bromthymol blue for chemical analysis. • Interpreting the results of reagent data.
Dichotomous Key • Using observations to formulate a dichotomous/taxonomic key. • Identifying individuals or objects using a dichotomous key. • Identifying similarities and differences in characteristics from a dichotomous key.
Calculations • Using measurements to determine area, volume, percentages, probabilities, ratios. • Determine population density of a sample. • Performing statistical analysis of raw data as mean, median, mode, and range.
Data Presentation • Preparing an appropriate date table, chart, diagram, illustration. • Evaluating the presentation of data.
|

Graphing • Selecting the appropriate graph for a set of data as line, bar, and pie graphs. • Identifying the title, source, independent variable & dependent variables, and the legend. • Scaling each axis for a graph. • Preparing a line, bar or pie graph to represent a set of data. • Predicting data points not included in a given graph and/or making a best line fit. • Interpreting a graph and making predictions or inferences based upon the data on a graph.
Analysis of Data • Identifying sources of experimental error or human mistakes in the data. • Determining the validity of results using qualitative and quantitative data. • Interpreting graphs as well as charts and diagrams as food webs, pedigrees, Punnett squares,
food labels, energy and food pyramids, relationships of organisms. • Identifying data which supports or rejects a hypothesis. • Identifying discrepancies between stated hypothesis and actual data. • Understanding cause and effect relationships.
Errors • Identifying human mistakes or blunders. • Identifying experimental errors as systematic errors and random errors. • Making recommendations for eliminating future mistakes or experimental errors. • Explaining the effects that human mistakes or experimental errors upon results.
Conclusions • Selecting the most logical conclusion for given experimental data. • Accepting or rejecting hypotheses based upon data analysis. • Proposing a new hypothesis for rejected hypotheses. • Formulating models • Proposing a future test for inconclusive results.
Some Helpful Hints for Event Supervisors:
• It may help to have questions laminated or placed in sheet protectors. This procedure eliminates damage or tampering during competition.
• Taping questions to the table helps to keep stations organized and undisturbed. • Bring extra items needed at stations as extra rulers.
Quick supervisor checklist of useful items to include stop watches, answer sheets, extra set of questions, tie-breaker sheets, answer keys, highlighter, calculator, extra pencils, red pens, extra mm rulers, stapler, masking tape, scotch tape
|

BIO-PROCESS LAB - Student Preparation Tips Team work skills - Use time effectively! Assign tasks and trust your partner’s skills. - Identify and utilize the strengths of each team member. - Practice working as a team. Time limits - Practice under competition conditions. - Practice effective methods of using the strength of each team member to maximize the use of allotted time. - Make up sample questions and stations to practice completing tasks within an assigned time limit. Answering questions - Carefully read all questions to determine exactly what is being asked. - Take a moment to determine if your answer makes sense. - Be certain that your have completely answered each question. - Pay attention to details in the questions and in your answers. Measurements and Calculations - Be sure to analyze the instrument to determine it's capacity (range) and increment values to insure the proper use of the instrument. Make measurements to the accuracy of the instrument. - Select the most appropriate type of instrument for the type of measurement requested. - Read the increment carefully. Be sure to remember any special considerations such as a meniscus. - Use the same instrument for multiple measurements to improve precision. - Give your answer in the proper units and be sure to include the units with your answer. - Be sure calculations are set up and carried out properly. Work in a neat organized fashion showing all work where partial credit is possible. Be sure your answer makes sense. - Remember that calculations may be used for breaking ties. Reference materials
- Review the process skills involved in doing life science labs and designing or evaluating
investigations.. - Review the identity and appropriate use of common lab equipment. - Use your school's life science textbook and lab manual to help you develop practice lab stations and questions PRINCIPLES OF EXPERIMENTAL DESIGN A controlled experiment is an experiment where all of the environmental variables or factors are controlled (kept constant or normal) except for the factor being tested. The parts of an experiment are as follows: PROBLEM: A statement that defines the topic of the experiment and identifies the relationship between the two variables. Be specific enough to allow the design of an experiment. It should generalize the factors being tested as” The effect of the (independent variable) upon the (dependent variable).”
|
HYPOTHESIS: A statement that predicts the outcome of testing the relationship between the independent variable and the dependent variable as specified in the problem. Be sure to include your rationale for this prediction.
VARIABLES: Environmental factors or conditions which can change.
Independent Variable is the factor being purposely changed or manipulated. Dependent Variable is the factor, which responds to the change in the Independent Variable. Its response is measured as data. Constants (controlled variables) are all other factors, which are not manipulated during the experiment. These are often potential independent variables for future experiments.
EXPERIMENTAL CONTROL (STANDARD OF COMPARISON): The component in which the independent variable is not changed or manipulated. It is used to verify that from trial to trial everything is kept the same and that the change in the independent variable is actually causing the response in the dependent variable.
MATERIALS AND PROCEDURE: A recipe for conducting the experiment. It consists of a list of materials/equipment followed by step-by-step instructions. These instructions must be specific enough to allow the experiment to be repeated exactly the same way each time it is conducted. Specify what type data should be collected during the experiment in order to measure the response of the dependent variable.
QUALITATIVE DATA: Observations or descriptions of things noticed with the senses during the course of the experiment and any data based on a nonstandard scale. Observations may pertain to things that happen relative to the dependent variable as well as those are not directly related to the dependent variable, the procedure, or and things that went wrong during the experiment. These types of observations may assist you in identify errors and evaluating the results. Qualitative data is usually categorized by factors such as color, texture, shape, size, and behavior and is organized into a table, diagram, or flow chart. You may draw pictures to show what you observed. Qualitative data may be as important as the measurements in evaluating the results so do not under estimate their worth. QUANTITATIVE DATA: Data that is based upon measurement and the presentation of this data. When organizing data for analysis, use visual tools as data tables, graphs, diagrams or flow charts. Be sure to thoroughly label all graphs, diagrams or flow charts.
Measurement: A measurement requires both magnitude (how much) and a unit. Examine the instrument to be sure you know its capacity and the value of the numbered graduations or increments as well as the unnumbered ones. Be sure to select the appropriate instrument for the proper degree of accuracy. When you are measuring liquids in a cylinder or pipette, remember to read the bottom of the meniscus curve. Data Tables: Use data tables to organize data as it is collected. Be sure all data raw data is given and that the correct significant figures are used and units are included. Also be sure all appropriate labels are included. Provide another condensed table with the most important data. Graphs: When graphing, remember that the independent variable goes on the horizontal or X - axis while the dependent variable goes on the vertical or Y- axis. To scale or number the axis of a graph so it will always fit the grid, use the following formula: High value - Low value (use zero if you plan to start numbering by zero) divided by the number of spaces on that axis. Always round up. Begin numbering with your lowest value and go up by your calculated graduation. Be sure to include all appropriate labels.
STATISTICAL ANALYSIS OF DATA: Measure of Central Tendency: A value at the center of the data set. It can be measured as the mean or average, the median, or the mode. Measure of Variation: For qualitative data, a frequency table or histogram can be used. For quantitative data, the range and standard deviation should be used.
|
Regression Analysis: Using an equation or graph to show the relationship of variables. Finding the line of best fit is often used. Percent Error: Another common form of statistic analysis. ANALYSIS OF RESULTS: Evaluate the qualitative and quantitative data. How do the results of your various trials compare? What was learned from this experiment? What trend was established? Does the data support your hypothesis? Why or Why not? POSSIBLE EXPERIMENTAL ERRORS: Any human mistakes that were made and any experimental errors that became evident. What effect did these errors and/or mistakes have on the qualitative or quantitative data. What went wrong during the experiment and how should the experiment have been done differently to avoid these problems in the future? CONCLUSION: Restate the hypothesis and summarize the major results. Explain why the results did or did not support the hypothesis. Include what was learned and any unexpected results. RECOMMENDATIONS FOR FURTHER INVESTIGATION AND APPLICATIONS: Recommend modifications of the experiment design or procedure. For future testing, give suggestions for refinement of your hypothesis based upon your data. Include other aspects of the general topic that should be considered for future investigations in order to better understand the general topic or question. Finally give practical applications for the principles obtained from the experiment. REPORT: The report will be written. Use the outline provided by the event supervisor to organize your report. It is similar to the rubric that will be used to evaluate your report. QUESTIONS TO ASK WHEN ANALYZING THE DESIGN OF AN EXPERIMENT 1. What was this study trying to determine? 2. Was the problem testable? 3. Was the hypothesis a testable prediction? 4. What was the independent variable (the factor being tested)? 5. What was the dependent variable (the factor responding to the test)? Was it measured quantitatively? 6. What made up the experimental group (the group being tested)? Was it a representative sample? 7. What made up the control group (the group not tested for the independent variable)? Was there a control group and was it a representative sample of the same type as the experimental group? 8. List the controlled variables ( those factors not being tested). Are all of these factors kept normal and the same for both groups? Remember the independent variable for the experimental group is the only thing that should be tested. 9. Are there any weaknesses in the design of this experiment? List those weaknesses. 10.How would you change the design of this experiment to correct these weaknesses?
DESIGNING AN EXPERIMENT Background information: A controlled experiment is an experiment where all environmental factors or conditions are controlled (kept constant or normal) except for the factor being tested. A variable is an environmental factor or condition.
An independent variable is the factor or condition being tested. The dependent variable is the factor which responds to the change in the independent variable. It's response is measured as data.
|
Controlled variables are all other factors or conditions which are kept constant or normal during the experiment.

Most experiments have two groups of subjects - an experiment group and a control group. The number in each group is determined by the designer of the experiment.
The experimental group is the group being tested by having the independent variable changed. The control group is the group in which the independent variable is not changed but treated as a controlled variable.
Assignment:
1. Choose one of the listed problems or formulate one of your own. 2. Formulate a working hypothesis as a proposed solution to your problem. 3. Identify each of the following relative to your proposed solution.
A. Independent variable B. Dependent variable C. Controlled variables D. Experimental group E. Control group
4. Develop a list of materials and a simple procedure to enable a person to test your proposed solution. 5. Predict what will happen and indicate what evidence should be collected as your proposed solution is being carried out. 6. Write this assignment in a final form including parts 1 - 5. Be sure to use complete sentences and proper grammar.
Some Sample Problems:
1. How does water affect the germination of seeds? 2. Which type of music allows plants to grow the best? 3. How does caffeine affect the heart rate of a Daphnia? 4. Do yeast need the same vitamins as man? 5. How does temperature affect the activity of enzymes? 6. How does the amount of sugar affect the rising of bread or pizza dough? 7. What role can enzymes play in cleaning up our water? 8. What effect do various types of textured walls have on sound? 9. What minerals promote the best plant growth? 10. What effect does the intensity of light have on the response of planaria to light?
|
DESIGNING AN EXPERIMENT
(A sample of a student's work) Background:
Daphnia are creatures that can be observed under a microscope. With the microscope you can see and count their heartbeat. This makes them good for testing the affects of caffeine on heart rate.
Problem:
How does caffeine affect the heart rate of a Daphnia? Hypothesis:
If Daphnia is given a variety of different pops such as Coke, Mountain Dew and 7-up, then the Mountain Dew will make the greatest increase in the Daphnia's heart rate.
Variables:
The independent variable in this experiment will be the three different types of pop. The dependent variable is the heart rate and the controlled variables are the temperature and food. The Daphnia which get the different type of pop are the experimental group, and the control group is the Daphnia which get no pop at all.
Materials:
To perform this lab you will need four Daphnia, and eye dropper, Coke, Mountain Dew, 7-up, a microscope, a well slide and four dishes to hold the Daphnia.
Procedure:
Measure and record the heart rate in beats per minute of each Daphnia. Put each of the four Daphnia in different dishes. Put two drops of Coke in the first dish, two drops of Mountain Dew in the second dish, two drops of 7-up in the third dish and none in the last one. After a half an hour find the heart rate of the three experimental Daphnia, also in beats per minute and record the information. Then compare which pop caused the Daphnia's heart rate to speed up the most.
Data Requirements:
1) Record the heart rate of each Daphnia before putting in the pop. 2) Record the heart rate of each of the experimental Daphnia after the pop has been in a half an hour. 3) Compare the results to see which one increased the most and which one increased a little if at all.
|
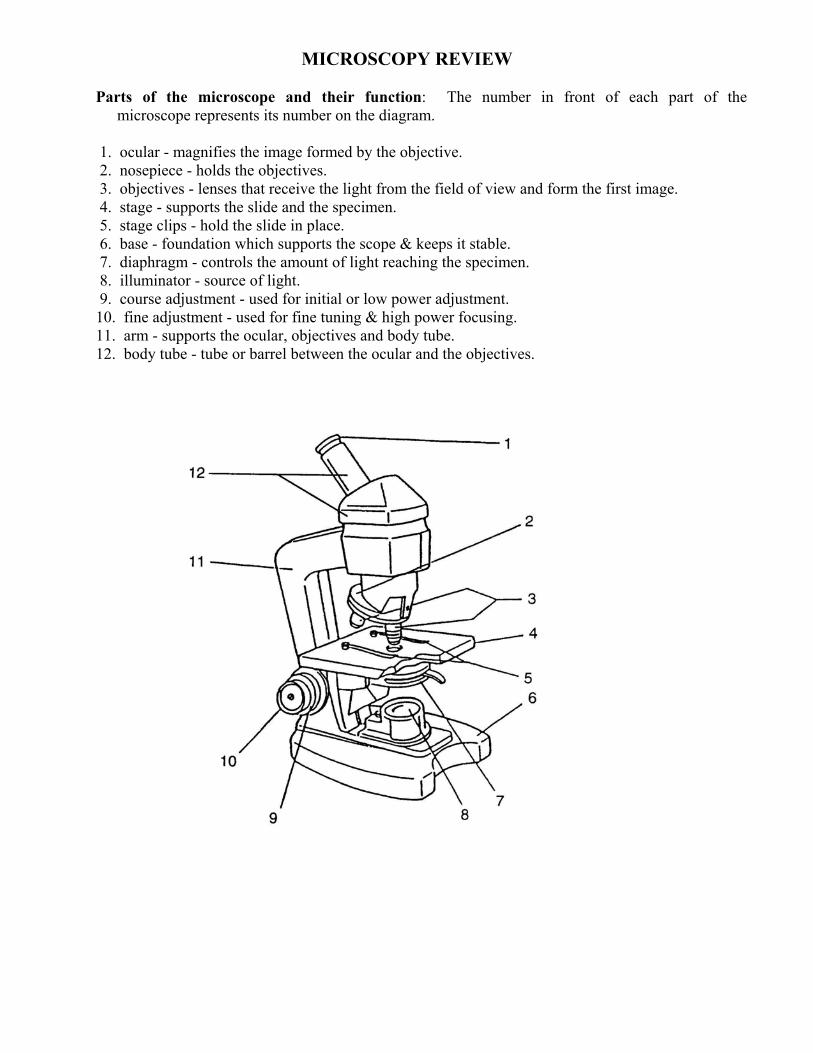
MICROSCOPY REVIEW Parts of the microscope and their function: The number in front of each part of the
microscope represents its number on the diagram. 1. ocular - magnifies the image formed by the objective. 2. nosepiece - holds the objectives. 3. objectives - lenses that receive the light from the field of view and form the first image. 4. stage - supports the slide and the specimen. 5. stage clips - hold the slide in place. 6. base - foundation which supports the scope & keeps it stable. 7. diaphragm - controls the amount of light reaching the specimen. 8. illuminator - source of light. 9. course adjustment - used for initial or low power adjustment. 10. fine adjustment - used for fine tuning & high power focusing. 11. arm - supports the ocular, objectives and body tube. 12. body tube - tube or barrel between the ocular and the objectives.
|
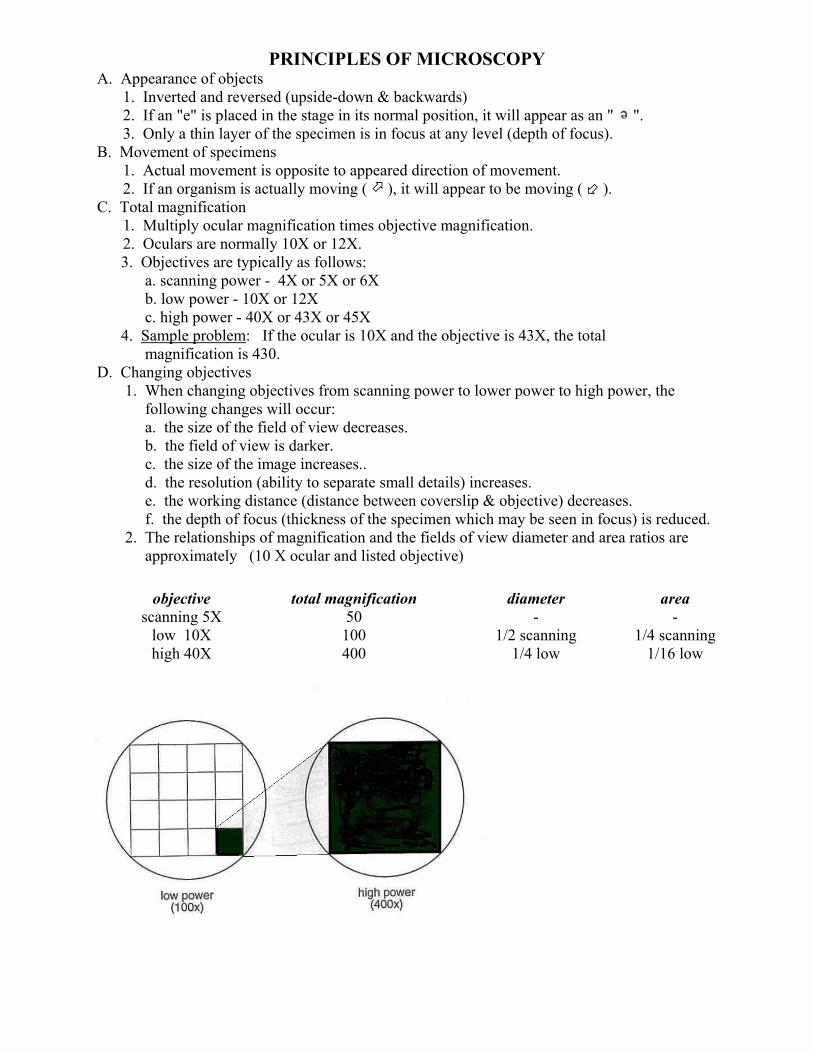
PRINCIPLES OF MICROSCOPY A. Appearance of objects 1. Inverted and reversed (upside-down & backwards) 2. If an "e" is placed in the stage in its normal position, it will appear as an " ". 3. Only a thin layer of the specimen is in focus at any level (depth of focus). B. Movement of specimens 1. Actual movement is opposite to appeared direction of movement. 2. If an organism is actually moving ( ), it will appear to be moving ( ). C. Total magnification 1. Multiply ocular magnification times objective magnification. 2. Oculars are normally 10X or 12X. 3. Objectives are typically as follows: a. scanning power - 4X or 5X or 6X b. low power - 10X or 12X c. high power - 40X or 43X or 45X 4. Sample problem: If the ocular is 10X and the objective is 43X, the total magnification is 430. D. Changing objectives 1. When changing objectives from scanning power to lower power to high power, the following changes will occur: a. the size of the field of view decreases. b. the field of view is darker. c. the size of the image increases.. d. the resolution (ability to separate small details) increases. e. the working distance (distance between coverslip & objective) decreases. f. the depth of focus (thickness of the specimen which may be seen in focus) is reduced. 2. The relationships of magnification and the fields of view diameter and area ratios are approximately (10 X ocular and listed objective)
objective scanning 5X low 10X high 40X
total magnification 50 100 400
diameter - 1/2 scanning 1/4 low
area - 1/4 scanning 1/16 low
|

PRINCIPLES OF ADVANCED MICROSCOPY
A. Measuring the diameter of the field of view. 1. Place a transparent millimeter ruler on the stage, hold it down with the stage clips, and observe the ruler in the desired field of view - scanning or low. (See Fig. 1) 2. Focus on the metric edge of the ruler. Hint: applying gentle pressure to the free end of the ruler will help adjust for the thin ruler and allow for better focus. 3. Place the center of one millimeter marking at the left edge of the field of view (see Figure 2) and measure the diameter of the field in millimeters. For reference: Scanning power (50X) is about 3.0 to 3.2 mm and low power (100X) is about 1.5 to 1.6 mm. Sizes will vary with changes in magnification and manufacturer.
4. Convert the measurement in millimeters to micrometers by multiplying by 1000. Samples: low power field 1.6 mm X µm/mm = 1600 µm or mcm scanning power field 3.2 mm X 1000 µm/mm = 3200 µm or mcm 5. The diameter of the high power field is less than one millimeter. It can be calculated from the diameter of the low power field by using the following formula: high power field diameter = low power magnification lower power field diameter high power magnification Sample: h.p. field = 100 to h.p. field = 100 X 1600 = 400 µm or mcm 1600 µm 400 400 B. Estimating the size of an object. 1. Determine the number of cells or objects that would fit across the diameter of the field of view. 2. Estimate the size of the object by dividing the diameter of the field by the number of the objects that would fit across the field. Sample: a. diameter of the field is 2 mm x 1000 µm/mm = 2000 µm b. length of cell "x" is 2000 µm/ 3 cells = 660 µm/cell
|

DEPTH OF FOCUS EXERCISE Below are four objects located between a slide and a coverslip. The actual objects would of course be 3-D. The objects are left to right; a cone, a cylinder, a sphere and a cube. As one focuses down through the various levels a two dimensional representation will be visible. At each level (represented by the dotted lines to the slide diagram) draw what two dimensional shapes would be present and give their proper location on the slide diagram.
|

ANSWER KEY FOR DEPTH OF FOCUS EXERCISE Below are four objects located between a slide and a coverslip. The actual objects would of course be 3-D. The objects are left to right; a cone, a cylinder, a sphere and a cube. As one focuses down through the various levels a two dimensional representation will be visible. At each level (represented by the dotted lines to the slide diagram) draw what two dimensional shapes would be present and give their proper location on the slide diagram.
|

MICROSCOPY QUIZ I. PARTS OF THE MICROSCOPE: For each of the following parts of the microscope, give the letter representing it's function and the number representing it's location. PART FUNCTION ocular A. holds slide in place coarse adjustment B. foundation to keep scope stable fine adjustment C. controls the amount of light to specimen arm D. supports slide and specimen nosepiece E. lens that form initial image of specimen objectives F. holds objectives - allows changing power stage G. used for initial & low power focusing stage clips H. supports ocular, objectives & body tube diaphragm I. source of light illuminator J. magnifies image formed by objective base K. used for fine tuning & high power focusing LOCATION
|

II. MICROSCOPY SKILLS: 1. A student prepares a slide of the letter "d" and positions the slide on the stage of the microscope so
the letter is in the normal reading position. When viewed through the microscope, the image of the letter will appear as
A. d B. b C. q D. p 2. An organism viewed under the microscope appears to be moving " ". The organism is
actually moving A. B. C. D. 3. A student observes a specimen under high (400X) power and then switches back to low (100X)
power. How will the appearance of the image change when going from high power to low power?
A. larger and darker B. smaller and darker C. smaller and brighter D. larger and brighter 4. A microscope is equipped with a 10X ocular and two objectives - one is 10X and the other is
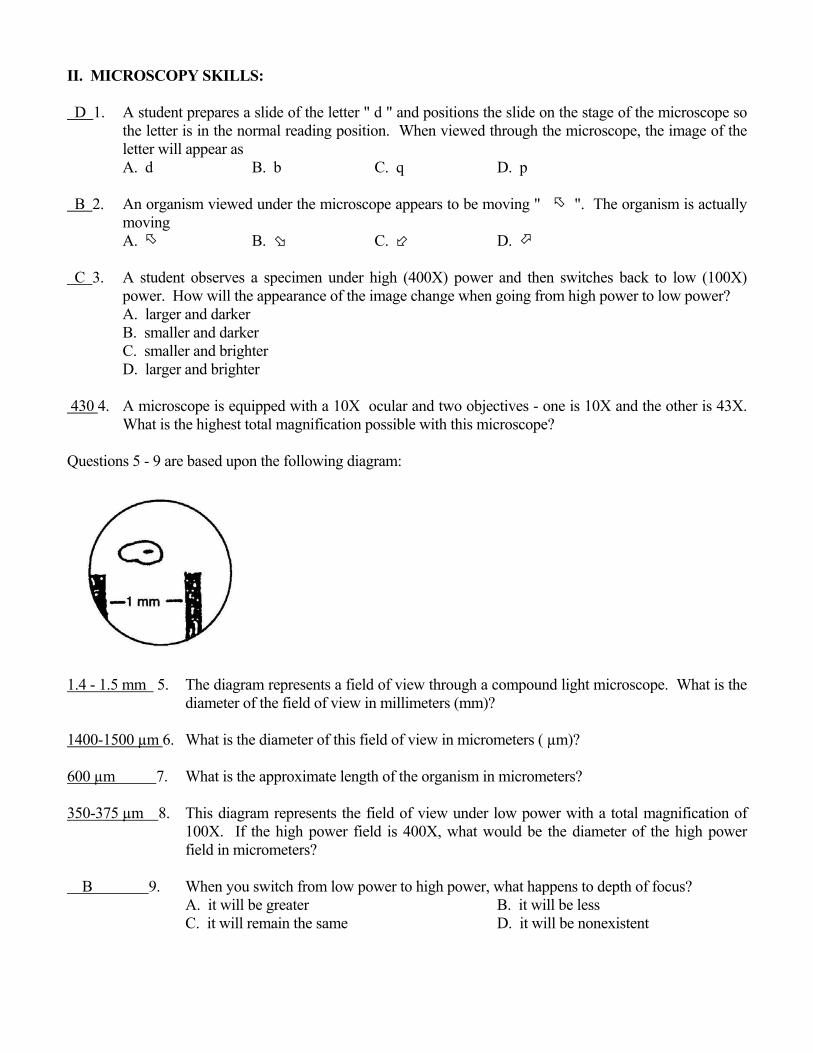
43X. What is the highest total magnification possible with this microscope? Questions 5 - 9 are based upon the following diagram:
5. The diagram represents a field of view through a compound light microscope. What is the
diameter of the field of view in millimeters (mm)? 6. What is the diameter of this field of view in micrometers (µm)? 7. What is the approximate length of the organism in micrometers ( µm)? 8. This diagram represents the field of view under low power with a total magnification of 100X. If
the high power field is 400X, what would be the diameter of the high power field in micrometers? 9. When you switch from low power to high power, what happens to depth of focus? A. it will be greater B. it will be less C. it will remain the same D. it will be nonexistent
|

ANSWER KEY FOR MICROSCOPY QUIZ I. PARTS OF THE MICROSCOPE: For each of the following parts of the microscope, give the letter representing it's function and the number representing it's location. PART FUNCTION 1. J ocular A. holds slide in place 9. G coarse adjustment B. foundation to keep scope stable 10.K fine adjustment C. controls the amount of light to specimen 11.H arm D. supports slide and specimen 2. F nosepiece E. lens that forms initial image of specimen 3. E objective F. holds objectives - allows changing power 4. D stage G. used for initial & low power focusing 5. A stage clips H. supports ocular, objectives & body tube 7. C diaphragm I. source of light 8. I illuminator J. magnifies image formed by objective 6. B base K. used for fine tuning & high power focusing LOCATION
|
II. MICROSCOPY SKILLS: D 1. A student prepares a slide of the letter " d " and positions the slide on the stage of the microscope so
the letter is in the normal reading position. When viewed through the microscope, the image of the letter will appear as
A. d B. b C. q D. p B 2. An organism viewed under the microscope appears to be moving " ". The organism is actually
moving A. B. C. D. C 3. A student observes a specimen under high (400X) power and then switches back to low (100X)
power. How will the appearance of the image change when going from high power to low power? A. larger and darker B. smaller and darker C. smaller and brighter D. larger and brighter 430 4. A microscope is equipped with a 10X ocular and two objectives - one is 10X and the other is 43X.
What is the highest total magnification possible with this microscope? Questions 5 - 9 are based upon the following diagram:
1.4 - 1.5 mm 5. The diagram represents a field of view through a compound light microscope. What is the
diameter of the field of view in millimeters (mm)? 1400-1500 µm 6. What is the diameter of this field of view in micrometers ( µm)? 600 µm 7. What is the approximate length of the organism in micrometers? 350-375 µm 8. This diagram represents the field of view under low power with a total magnification of
100X. If the high power field is 400X, what would be the diameter of the high power field in micrometers?
B 9. When you switch from low power to high power, what happens to depth of focus? A. it will be greater B. it will be less C. it will remain the same D. it will be nonexistent
|
STEREO OR DISSECTING MICROSCOPE
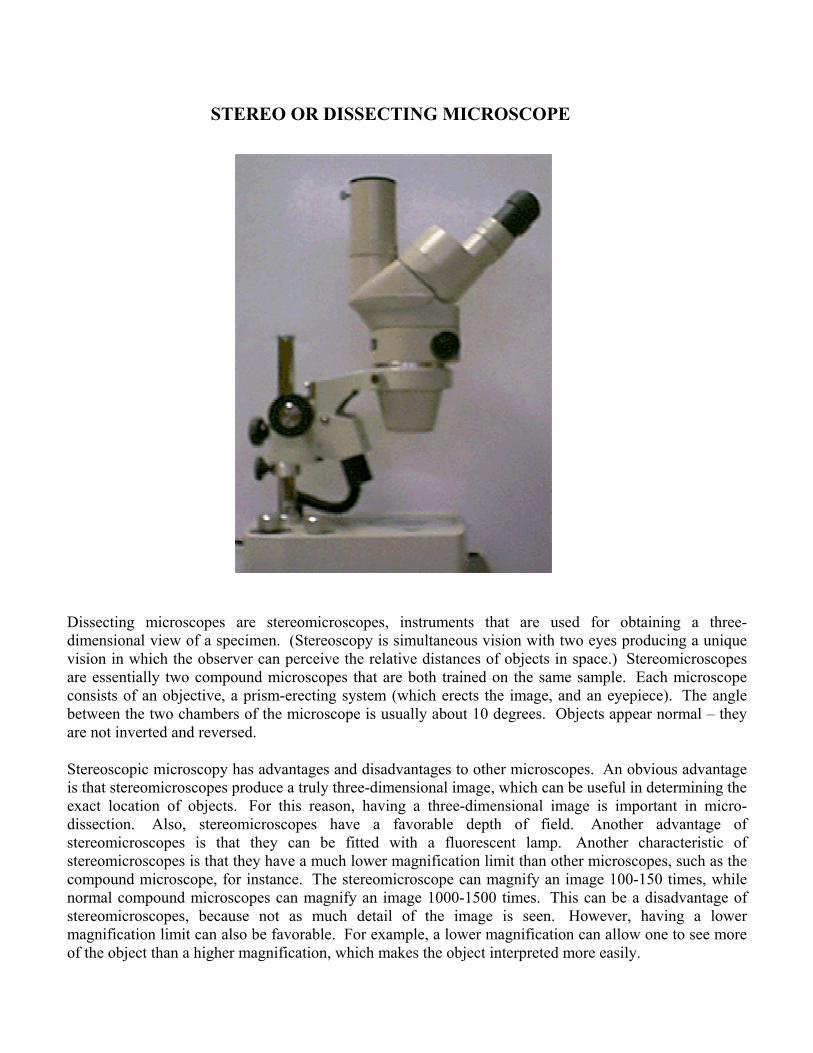
Dissecting microscopes are stereomicroscopes, instruments that are used for obtaining a three-dimensional view of a specimen. (Stereoscopy is simultaneous vision with two eyes producing a unique vision in which the observer can perceive the relative distances of objects in space.) Stereomicroscopes are essentially two compound microscopes that are both trained on the same sample. Each microscope consists of an objective, a prism-erecting system (which erects the image, and an eyepiece). The angle between the two chambers of the microscope is usually about 10 degrees. Objects appear normal – they are not inverted and reversed.
Stereoscopic microscopy has advantages and disadvantages to other microscopes. An obvious advantage is that stereomicroscopes produce a truly three-dimensional image, which can be useful in determining the exact location of objects. For this reason, having a three-dimensional image is important in micro-dissection. Also, stereomicroscopes have a favorable depth of field. Another advantage of stereomicroscopes is that they can be fitted with a fluorescent lamp. Another characteristic of stereomicroscopes is that they have a much lower magnification limit than other microscopes, such as the compound microscope, for instance. The stereomicroscope can magnify an image 100-150 times, while normal compound microscopes can magnify an image 1000-1500 times. This can be a disadvantage of stereomicroscopes, because not as much detail of the image is seen. However, having a lower magnification limit can also be favorable. For example, a lower magnification can allow one to see more of the object than a higher magnification, which makes the object interpreted more easily.
|

LAB ITEMS AND THEIR USES
Picture Name Usage
Balance – Electronic
Balances are used to determine the weight of objects. The capacity varies with the model as does the incrementation.
Balance – Triple Beam with weights
Balances are used to determine the weight of objects. The auxillary weights extend the capacity of the balance up to 2610 g
Beaker Beakers are used to hold and heat liquids. The graduations for estimation.
Bottle Bottles can be used for storage, mixing or displaying.
Bunsen Burner
Bunsen burners are used for heating and exposing items to flame. They have many more uses than a hot plate, but do not replace a hot plate.
Caliper – Vernier
Calipers are used to measure the inside and outside diameter of cylinders. The Vernier scale allows more accurate measurement.
Culture dishes
Culture dishes are used to house and culture small plants and animals. There are also small varieties
|

Crucible Crucibles are used to heat small quantities to very high temperatures.
Dialysis tubing
Dialysis tubing is used for osmosis experiments. It is a thin membrane which controls the size movement of materials.
Dissecting Kit
Dissecting kits contain instruments that are used for dissection such as scissors, forceps, scalpels, probes.
Dissecting Pan
The dissecting pan is used to hold the item being dissected. Dissecting pins are used to hold the specimen in place
Dropping Bottles
Dropping bottles are used to hold liquids and have a stopper with a dropper for dispensing the liquids.
Erlenmeyer Flask
The Erlenmeyer Flask is used to heat and store liquids. The advantage to the Erlenmeyer Flask is that the bottom is wider than the top so it will heat quicker because of the greater surface area exposed to the heat.
Evaporating Dish
The Evaporating Dish is used to heat and evaporate liquids.
Florence Flask
The Florence Flask is used for heating subtances that need to be heated evenly. The bulbed bottom allows the heat to distribute through the liquid more evenly. The Florence Flask is mostly used in distillation experiments.
|

Funnel The funnel can be used to dispense liquids into any container so they will not be lost or spilled.
Graduated Cylinder
Graduated cylinders are used to measure the volume of liquids. They come in a variety of capacities and increments.
Meter stick A meter stick is used to measure the length of objects up to one meter. Smaller versions are called metric rulers.
Microscope slides
Microscope slides are used to hold specimens to be examine with a compound microscope.
Microscope Coverslips
Coverslips are placed over the liquid bubble on a slide so the image can be examined without getting the liquid on the lens of the microscope.
Microscope – Compound
Compound microscopes are used to examine small objects with a magnification range usually from 40X to 1000X. Observed images appear inverted and reversed.
Microscope – Stereo or Dissecting
Stereo or Dissecting microscopes are used to observe larger objects or objects being dissected. Observed images are appear normal. Magnification ranges is usually from 20X to 40X.
Petri dish
Petri dishes are used to culture bacteria. They can also be used as small lab dishes with a cover.
|
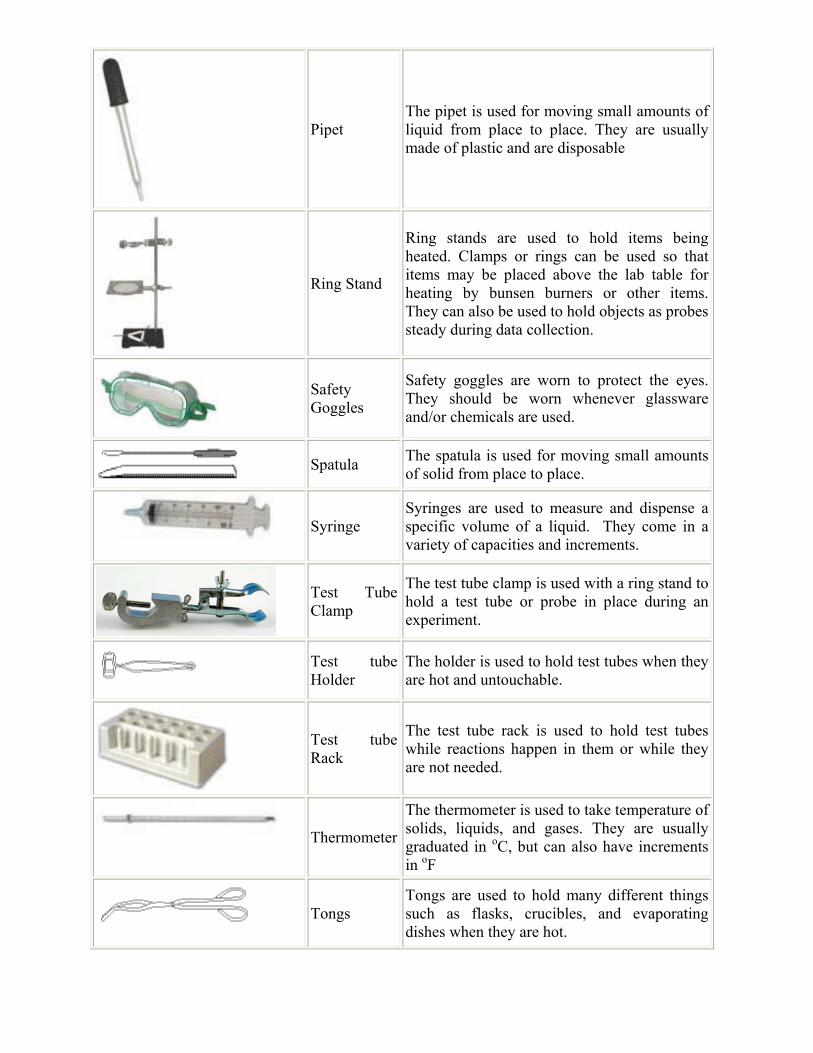
Pipet The pipet is used for moving small amounts of liquid from place to place. They are usually made of plastic and are disposable
Ring Stand
Ring stands are used to hold items being heated. Clamps or rings can be used so that items may be placed above the lab table for heating by bunsen burners or other items. They can also be used to hold objects as probes steady during data collection.
Safety Goggles
Safety goggles are worn to protect the eyes. They should be worn whenever glassware and/or chemicals are used.
Spatula The spatula is used for moving small amounts
of solid from place to place.
Syringe Syringes are used to measure and dispense a specific volume of a liquid. They come in a variety of capacities and increments.
Test Tube The test tube clamp is used with a ring stand to
Clamp hold a test tube or probe in place during an experiment.
Test tube The holder is used to hold test tubes when they Holder are hot and untouchable.
Test tube The test tube rack is used to hold test tubes
Rack while reactions happen in them or while they are not needed.
Thermometer
The thermometer is used to take temperature of solids, liquids, and gases. They are usually graduated in oC, but can also have increments in oF
Tongs
are used to hold many different things Tongssuch as flasks, crucibles, and evaporating dishes when they are hot.
|
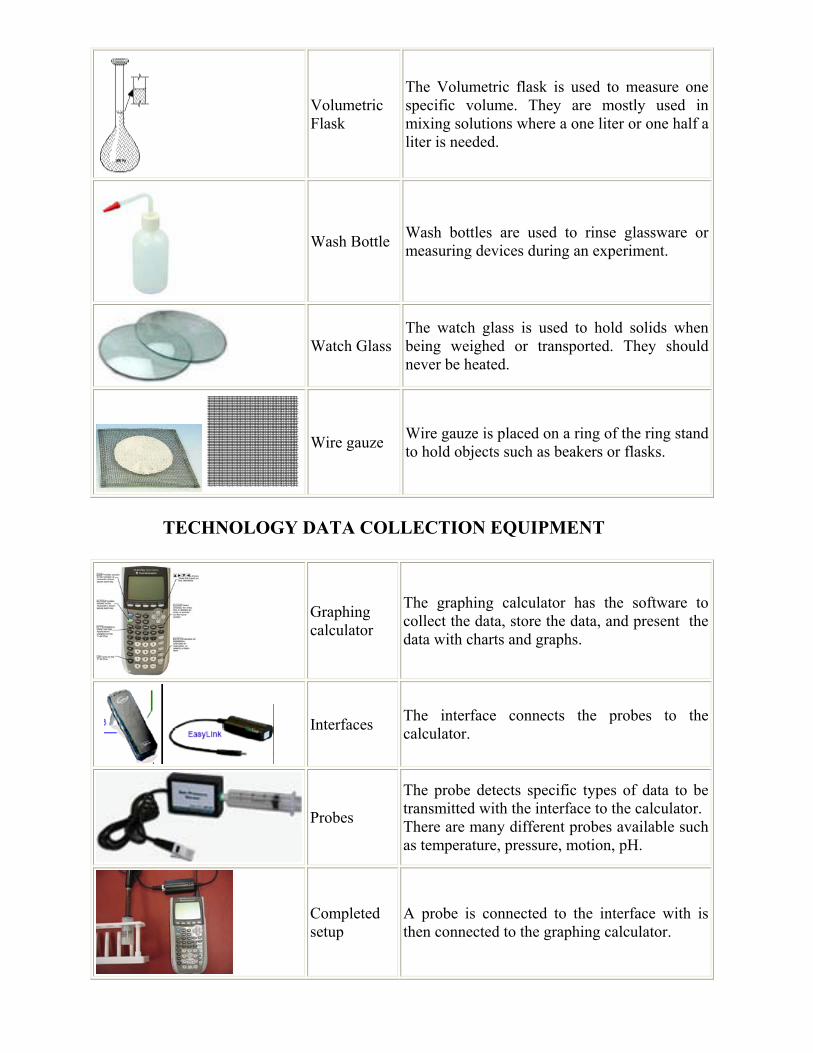
Volumetric Flask
The Volumetric flask is used to measure one specific volume. They are mostly used in mixing solutions where a one liter or one half a liter is needed.
Wash Bottle Wash bottles are used to rinse glassware or measuring devices during an experiment.
Watch Glass The watch glass is used to hold solids when being weighed or transported. They should never be heated.
Wire gauze Wire gauze is placed on a ring of the ring stand to hold objects such as beakers or flasks.
TECHNOLOGY DATA COLLECTION EQUIPMENT
Graphing calculator
The graphing calculator has the software to collect the data, store the data, and present the data with charts and graphs.
Interfaces The interface connects the probes to the calculator.
Probes
The probe detects specific types of data to be transmitted with the interface to the calculator. There are many different probes available such as temperature, pressure, motion, pH.
Completed setup
A probe is connected to the interface with is then connected to the graphing calculator.
|
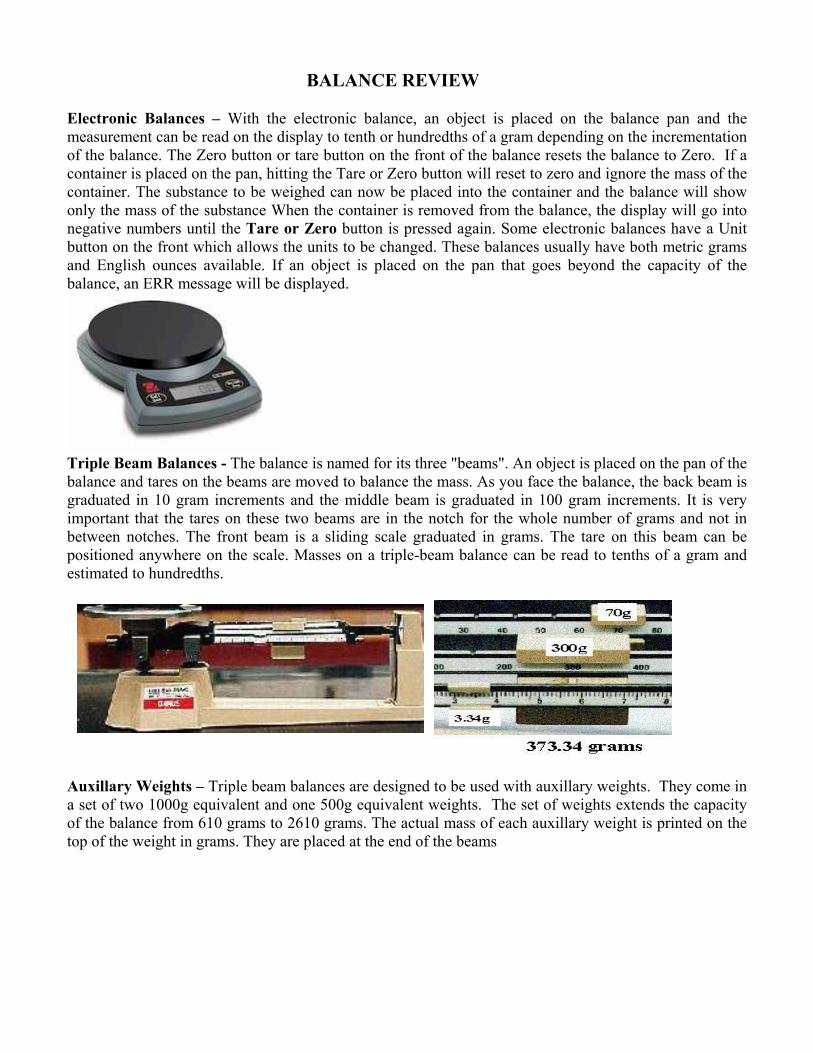
BALANCE REVIEW Electronic Balances – With the electronic balance, an object is placed on the balance pan and the measurement can be read on the display to tenth or hundredths of a gram depending on the incrementation of the balance. The Zero button or tare button on the front of the balance resets the balance to Zero. If a container is placed on the pan, hitting the Tare or Zero button will reset to zero and ignore the mass of the container. The substance to be weighed can now be placed into the container and the balance will show only the mass of the substance When the container is removed from the balance, the display will go into negative numbers until the Tare or Zero button is pressed again. Some electronic balances have a Unit button on the front which allows the units to be changed. These balances usually have both metric grams and English ounces available. If an object is placed on the pan that goes beyond the capacity of the balance, an ERR message will be displayed.
Triple Beam Balances - The balance is named for its three "beams". An object is placed on the pan of the balance and tares on the beams are moved to balance the mass. As you face the balance, the back beam is graduated in 10 gram increments and the middle beam is graduated in 100 gram increments. It is very important that the tares on these two beams are in the notch for the whole number of grams and not in between notches. The front beam is a sliding scale graduated in grams. The tare on this beam can be positioned anywhere on the scale. Masses on a triple-beam balance can be read to tenths of a gram and estimated to hundredths.
Auxillary Weights – Triple beam balances are designed to be used with auxillary weights. They come in a set of two 1000g equivalent and one 500g equivalent weights. The set of weights extends the capacity of the balance from 610 grams to 2610 grams. The actual mass of each auxillary weight is printed on the top of the weight in grams. They are placed at the end of the beams
|

THE METRIC SYSTEM The International System of Units (SI), which was adopted in 1960 by the Eleventh Conference on Weights and Measures, is universally accepted for scientific measurements. The seven base units of the SI system are as follows: Quantity Unit Symbol length meter (metre) m mass kilogram kg time second s electric current ampere A temperature Kelvin K amount of substance mole mol luminous intensity candela cd The base or derived units commonly used in biology are: Quantity Unit Symbol length meter (metre) m mass gram g volume (liquids) liter (litre) L volume (solids) cubic centimeter cm3 temperature degree Celsius oC time second s Common prefixes for measurement units are: Prefix Symbol Multiplier mega M 1,000,000 kilo k 1,000 hecto h 100 deka da 10 deci d 1/10 centi c 1/100 milli m 1/1000 micro µ or mc 1/1,000,000 nanno n 1/1 billion
|

MEASUREMENT TIPS Accuracy - The closeness of a measurement to the true value of what is being measured. The accuracy depends upon the quality of the instrument being used. Instruments are supplied with the following information. Capacity - the amount that can be measured with the instrument. Range - the high value up to the low value. (Used where zero is not the low value.) Numbered increments or graduations - the value represented by the numbered graduations or increments on the instrument. Some instruments such as balances may have more than one set of numbered increments. Unnumbered increments or graduations - the value represented by the unnumbered graduations or increments on the instrument. Readability - the smallest unnumbered increment on the instrument. The readability is listed on some instruments as balances. It is always listed in the supply catalogs with a description of each instrument. Vernier scale - a gliding scale to increase the accuracy of the estimation. It is often found on vernier calipers, micrometers, barometers and balances. Tips for measurement * Choose the appropriate instrument. * Be sure to identify the value of the numbered and unnumbered increments as well as the readability of the instrument before beginning the measurement. * When measuring liquids in a cylinder or pipet, remember to read the bottom of the meniscus curve. * When measuring with a metric ruler, be sure that the first increment is present. In some cheap rulers it may not be present or may not be at the very end of the ruler. In this case, begin measuring at 1.0 cm. and subtract subtract 1.0 cm from your reading. Remember that the numbered increment of a metric ruler are in cm and the unnumbered increment is mm. * Remember that beakers are designed to hold liquids and estimate amounts. They were not intended for use as a measurement device. * When making several measurements, use the same instrument each time for more reproducible results. * On instruments that have sufficient space between the unnumbered
increments, it is customary to record the answer one place beyond the value of the readability by estimating the last value.
Measuring device smallest increment record to examples nearest metric ruler 1 mm 0.1 mm grad. cylinder 1 mL 0.1 mL grad. cylinder 0.2 mL 0.1 mL grad. cylinder 0.1 mL 0.01 mL Celsius thermometer 2o C 1o C balance 0.1 g 0.01 g
* For electronic balance, there is no way to estimate the last value so the answer must be recorded as presented by the balance. * Be sure to read the instrument carefully to avoid human experimental errors.
|

INSTRUMENT LAB Capacity (cap) is the amount that can be measured with an instrument. Range is the low value up to the high value - thermometers. Numbered increment or graduation (NI) is the value represented by each of the numbered graduations or increments on the instrument. Some instruments such as balances may have more than one set of numbered increments. Unnumbered increment or graduation (UnNI) is the value represented by the unnumbered graduations or increments on the instrument. For each instrument, provide the requested information. Instrument A Instrument B Type of instrument Type of instrument Range (thermometer) Capacity Numbered increments Numbered increments Unnumbered increments Unnumbered increments Instrument C Instrument D Type of instrument Type of instrument Capacity Capacity Numbered increments Numbered increments Unnumbered increments Unnumbered increments Instrument E Instrument F Type of instrument Type of instrument Capacity Capacity Numbered increments Numbered increments Unnumbered increments Unnumbered increments Instrument G Instrument H Type of instrument Type of instrument Capacity Capacity Numbered increments Numbered increments Unnumbered increments Unnumbered increments Instrument I Instrument J Type of instrument Type of instrument Capacity Capacity Numbered increments Numbered increments Unnumbered increments Unnumbered increments Instrument K Instrument L Type of instrument Type of instrument Capacity Capacity Numbered increments Numbered increments Unnumbered increments Unnumbered increments
|

ANSWER KEY FOR INSTRUMENT LAB Capacity (cap) is the amount that can be measured with an instrument. Range is the low value up to the high value - thermometers. Numbered increment or graduation (NI) is the value represented by each of the numbered graduations or increments on the instrument. Some instruments such as balances may have more than one set of numbered increments. Unnumbered increment or graduation (UnNI) is the value represented by the unnumbered graduations or increments on the instrument. For each instrument, provide the requested information. Instrument A Instrument B Type of instrument thermometer Type of instrument graduated cylinder Range (thermometer) -20 o C to 110 o C Capacity 250 mL Numbered increments 10 o C Numbered increments 50 mL Unnumbered increments 1o C Unnumbered increments 2 mL Instrument C Instrument D Type of instrument syringe Type of instrument vernier caliper Capacity 60 cc Capacity 155 mL Numbered increments 10 cc Numbered increments 10 mm 0.1 mm Unnumbered increments 1 cc Unnumbered increments 1 mm .05 mm Instrument E Instrument F Type of instrument graduated cylinder Type of instrument syringe Capacity 10 mL Capacity 3 cc Numbered increments 2 mL Numbered increments 0.5 cc Unnumbered increments 0.2 mL Unnumbered increments 0.1 cc Instrument G Instrument H Type of instrument graduated cylinder Type of instrument metric ruler Capacity 100 mL Capacity 305 mm (30.5 cm) Numbered increments 10 mL Numbered increments 1 cm Unnumbered increments 1 mL Unnumbered increments 1 mm (0.1 cm) Instrument I Instrument J Type of instrument syringe Type of instrument graduated cylinder Capacity 30 cc Capacity 10 mL Numbered increments 5 cc Numbered increments 1 mL Unnumbered increments 1 cc Unnumbered increments 0.2 mL Instrument K Instrument L Type of instrument meter stick Type of instrument protractor Capacity 1 m (100 cm) Capacity 180o Numbered increments 1 cm Numbered increments 10o Unnumbered increments 1 mm (0.1cm) Unnumbered increments 1o
|

INSTRUMENT WORKSHEET Capacity (cap) is the amount that can be measured with an instrument. Range is the low value up to the high value - thermometers. Numbered increment or graduation (NI) is the value represented by each of the numbered graduations or increments on the instrument. Some instruments such as balances may have more than one set of numbered increments. Unnumbered increment or graduation (UnNI) is the value represented by the unnumbered graduations or increments on the instrument. Instrument A Instrument B Type of instrument Type of instrument Range (thermometer) Capacity Numbered increments Numbered increments Unnumbered increments Unnumbered increments It's reading is It's reading is Instrument C Instrument D Type of instrument Type of instrument Range (thermometer) Capacity Numbered increments Numbered increments Unnumbered increments Unnumbered increments It's reading is It's reading is
|

Instrument E Instrument F Type of instrument Type of instrument Capacity Capacity Numbered increments Numbered increments Unnumbered increments Unnumbered increments It’s reading is It’s reading is Instrument G Instrument H Type of instrument Type of instrument Capacity Capacity Numbered increments Numbered increments Unnumbered increments Unnumbered increments It's reading is cm It's reading is mm
Instrument G
Instrument H
|

ANSWER KEY FOR INSTRUMENT WORKSHEET Capacity (cap) is the amount that can be measured with an instrument. Range is the low value up to the high value - thermometers. Numbered increment or graduation (NI) is the value represented by each of the numbered graduations or increments on the instrument. Some instruments such as balances may have more than one set of numbered increments. Unnumbered increment or graduation (UnNI) is the value represented by the unnumbered graduations or increments on the instrument. Instrument A Instrument B Type of instrument thermometer Type of instrument balance Range (thermometer) 49o to 63o C Capacity 610 g Numbered increments 10o C Numbered increments 10g 100g 1g Unnumbered increments 1o C Unnumbered increments 0.1g It's reading is 56.0o C It's reading is 437.0 g Instrument C Instrument D Type of instrument thermometer Type of instrument balance Range (thermometer) 3.9 o C to 5.3o C Capacity 311 g Numbered increments 1oC Numbered increments 100g 10g 1g 0.1g Unnumbered increments 0.1oC Unnumbered increments 0.01g It's reading is 4.58oC It's reading is 131.975 g
|

Instrument E Instrument F Type of instrument graduated cylinder Type of instrument graduated cylinder Capacity 32 mL Capacity 71 mL Numbered increments 10 mL Numbered increments 5 mL Unnumbered increments 1 mL Unnumbered increments 0.5 mL It's reading is 26.5 mL It's reading is 67.5 mL Instrument G Instrument H Type of instrument metric ruler Type of instrument metric ruler Capacity 15 cm Capacity 19 cm Numbered increments 1 cm Numbered increments 1 cm Unnumbered increments 1 mm or 0.1 cm Unnumbered increments 1 mm or 0.1 cm It's reading is 8.20 cm It's reading is 115.0 mm
Instrument G
Instrument H
|

MEASUREMENT LAB Part I Stations Station A: Triple Beam Pan Balance with auxiliary weights 1. What is the capacity of this balance with the auxiliary weights? 2. What is the capacity of this balance without the auxiliary weights? 3. What is the actual weight of the 500 g auxiliary weight? 4. What is the value of the unnumbered increments? 5. What is the mass of object "X" in grams? Station B: Graduated Cylinder 6. What is the capacity of this graduated cylinder? 7. What is the value of the numbered increments? 8. What is the value of the unnumbered increments? 9. How much colored water is in the actual graduated cylinder? 10. What is the volume in the diagrammed graduated cylinder? Station C: Ruler (Using the metric scale) 11. What is the value of the numbered increments? 12. What is the value of the unnumbered increments? 13. Measure the length of the plastic box in centimeters. It is ? 14. Measure the width of the plastic box in centimeters. It is ? 15. What is the area of the box in square meters? Station D: Celsius Thermometer 16. What is the temperature range that this thermometer can detect? 17. What is the value of the numbered increments? 18. What is the value of the unnumbered increments? 19. What is the temperature registered on the actual thermometer? 20. What is the reading on the diagram of a thermometer? Station E: Syringe (Using the metric scale) It should be used without a needle 21. What is the capacity of this syringe in cubic centimeters? 22. What is the value of the numbered increments? 23. What are the values of the unnumbered increments? 24. How many milliliters should this syringe hold? 25. Read the syringe diagram. It has cc of liquid. Station F: Vernier Calipers 26. What is the capacity of this instrument in centimeters? 27. What are the values of the two numbered increments in centimeters? 28. What are the values of the two unnumbered increments in centimeters? 29. Measure the inside diameter of the cylinder. It is cm. 30. Measure the outside diameter of the cylinder. It is cm.
|

Station G: Electronic Balance (Using the metric scale) 31. What is the capacity of this balance in grams? 32. What is the value of the most specific increment? 33. What does the ERR tell you? 34. What does the TARE do? 35. Weigh object "X". It's mass in grams is ? Station H: Protractor 36. What is the capacity in degrees for this protractor? 37. What is the value of the numbered increments? 38. What is the value of the unnumbered increments? 39. Measure angle "A" on the diagram. It is degrees. 40. Measure angle "B" on the diagram. It is degrees.
Part II. Choosing Appropriate Instruments Using the appropriate instrument, perform the following measurements to the accuracy requested..
1. Measure the dimensions of the lab table and determine its area. Length cm Width cm Area sq.m 2. Measure out 8.4 cc of colored water. 3. Measure out 156.5 ml of colored water. 4. Measure the inside diameter of the largest graduated cylinder among your instruments. It's inside diameter in millimeters is . 5. Weigh the plastic beaker that is provided. It weights grams. 6. Determine the temperature of the lab. It is .
|

MEASUREMENT LAB Part I: For each station, answer the questions at the station. Be sure to include appropriate units. Station A Station E 1. 21. 2. 22. 3. 23. 4. 24. 5. 25. Station B Station F 6. 26. 7. 27. 8. 28. 9. 29. 10. 30. Station C Station G 11. 31. 12. 32. 13. 33. 14. 34. 15. 35. Station D Station H 16. 36. 17. 37. 18. 38. 19. 39. 20. 40.
Part II. Choosing Appropriate Instruments Have your results verified by your instructor.
1. Measure the dimensions of the lab table and determine its area. Length cm Width cm Area sq.m 2. Measure out 8.4 cc of colored water. 3. Measure out 156.5 ml of colored water. 4. Measure the inside diameter of the largest graduated cylinder among your instruments. It's inside diameter in millimeters is . 5. Weigh the plastic beaker that is provided. It weights grams. 6. Determine the temperature of the lab. It is .
|
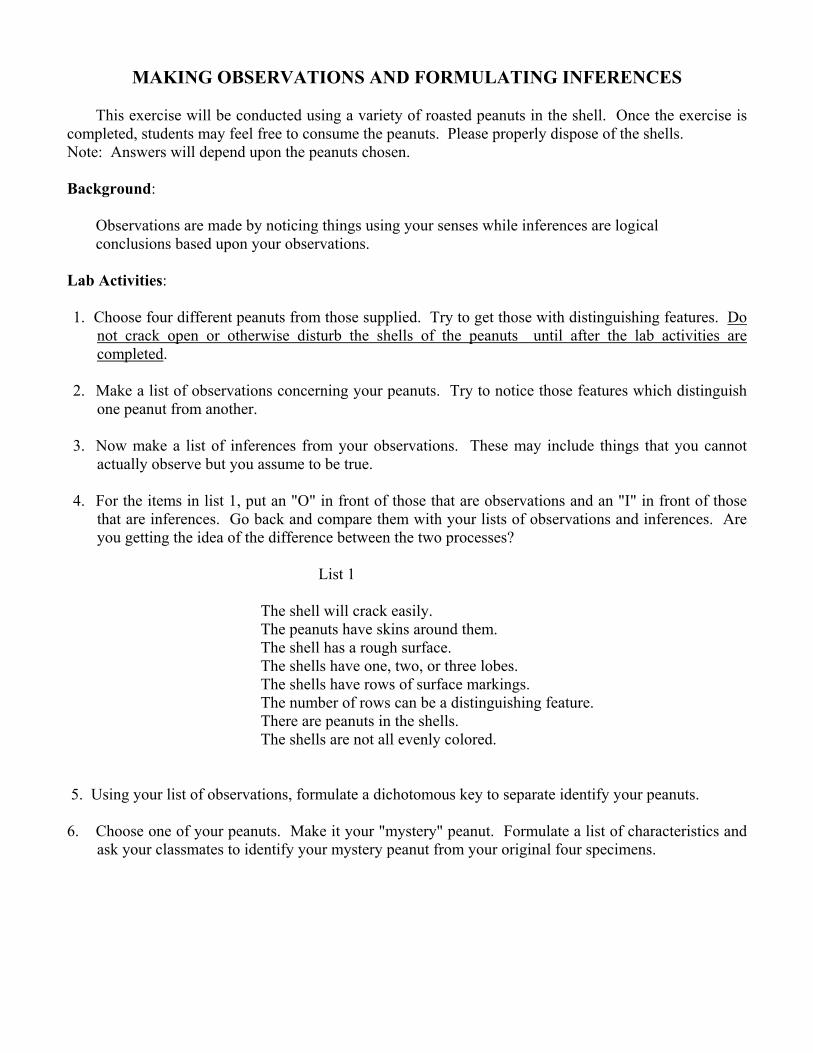
MAKING OBSERVATIONS AND FORMULATING INFERENCES
This exercise will be conducted using a variety of roasted peanuts in the shell. Once the exercise is completed, students may feel free to consume the peanuts. Please properly dispose of the shells. Note: Answers will depend upon the peanuts chosen. Background: Observations are made by noticing things using your senses while inferences are logical conclusions based upon your observations. Lab Activities: 1. Choose four different peanuts from those supplied. Try to get those with distinguishing features. Do
not crack open or otherwise disturb the shells of the peanuts until after the lab activities are completed.
2. Make a list of observations concerning your peanuts. Try to notice those features which distinguish
one peanut from another. 3. Now make a list of inferences from your observations. These may include things that you cannot
actually observe but you assume to be true. 4. For the items in list 1, put an "O" in front of those that are observations and an "I" in front of those
that are inferences. Go back and compare them with your lists of observations and inferences. Are you getting the idea of the difference between the two processes?
List 1 The shell will crack easily. The peanuts have skins around them. The shell has a rough surface. The shells have one, two, or three lobes. The shells have rows of surface markings. The number of rows can be a distinguishing feature. There are peanuts in the shells. The shells are not all evenly colored. 5. Using your list of observations, formulate a dichotomous key to separate identify your peanuts. 6. Choose one of your peanuts. Make it your "mystery" peanut. Formulate a list of characteristics and
ask your classmates to identify your mystery peanut from your original four specimens.
|
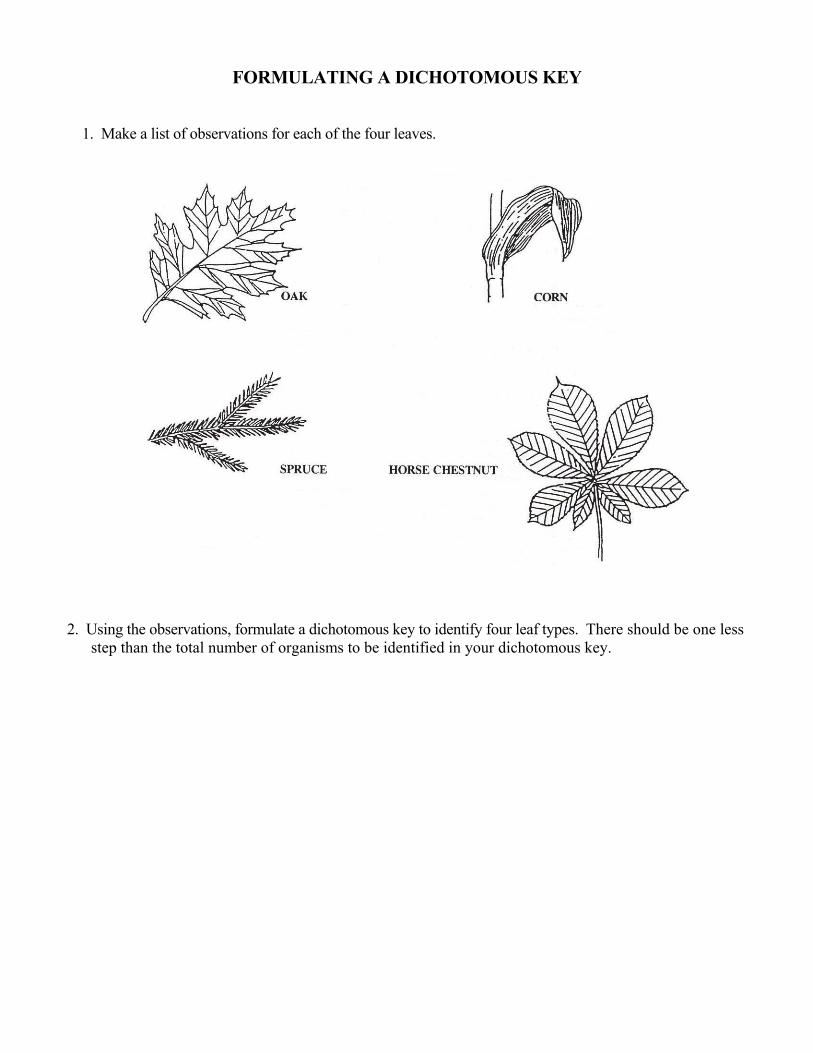
FORMULATING A DICHOTOMOUS KEY
1. Make a list of observations for each of the four leaves. 2. Using the observations, formulate a dichotomous key to identify four leaf types. There should be one less step than the total number of organisms to be identified in your dichotomous key.
|

ANSWER KEY FOR FORMULATING A DICHOTOMOUS KEY
1. Make a list of observations for each of the four leaves.
2. Using the observations, formulate a dichotomous key to identify four leaf types. (A Sample) 1. Needle-like leaves......................................................... Spruce 1. Broad leaves .......................................................................... 2. 2. Parallel veins .................................................................... Corn 2. Net veins................................................................................ 3. 3. Simple leaf......................................................................... Oak 3. Compound leaf................................................ Horse Chestnut
|
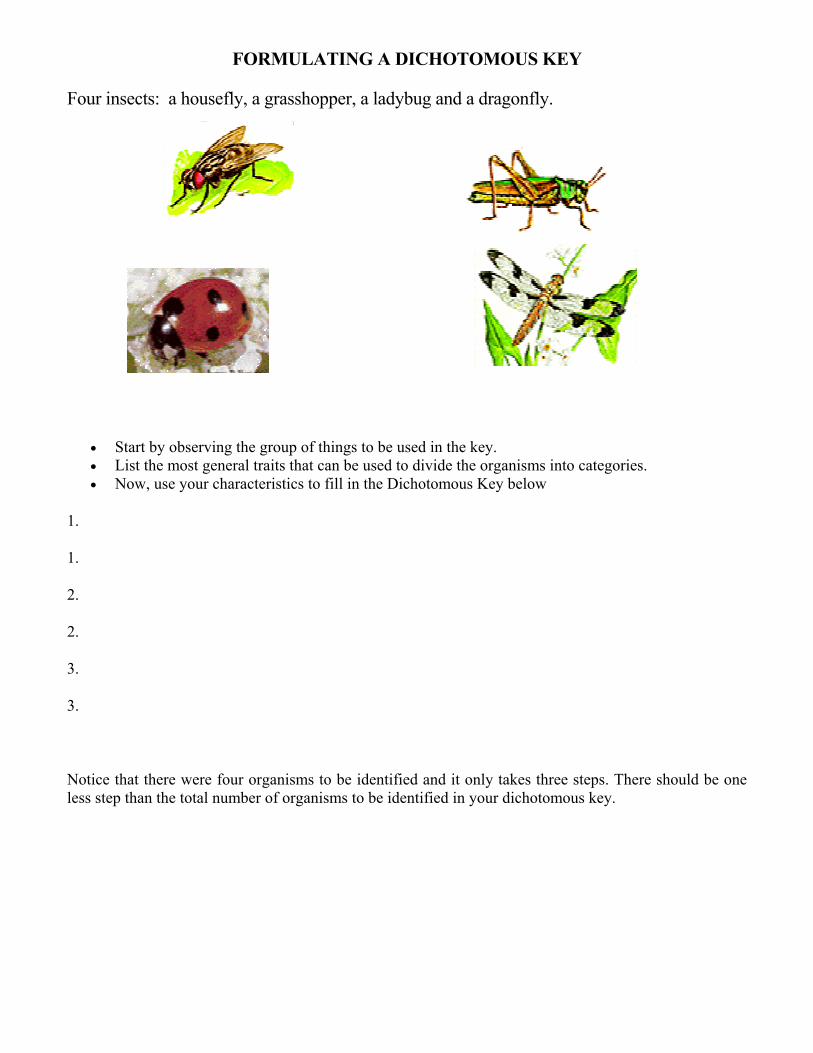
FORMULATING A DICHOTOMOUS KEY Four insects: a housefly, a grasshopper, a ladybug and a dragonfly.
• Start by observing the group of things to be used in the key. • List the most general traits that can be used to divide the organisms into categories. • Now, use your characteristics to fill in the Dichotomous Key below
1.
1.
2.
2.
3.
3.
Notice that there were four organisms to be identified and it only takes three steps. There should be one less step than the total number of organisms to be identified in your dichotomous key.
|
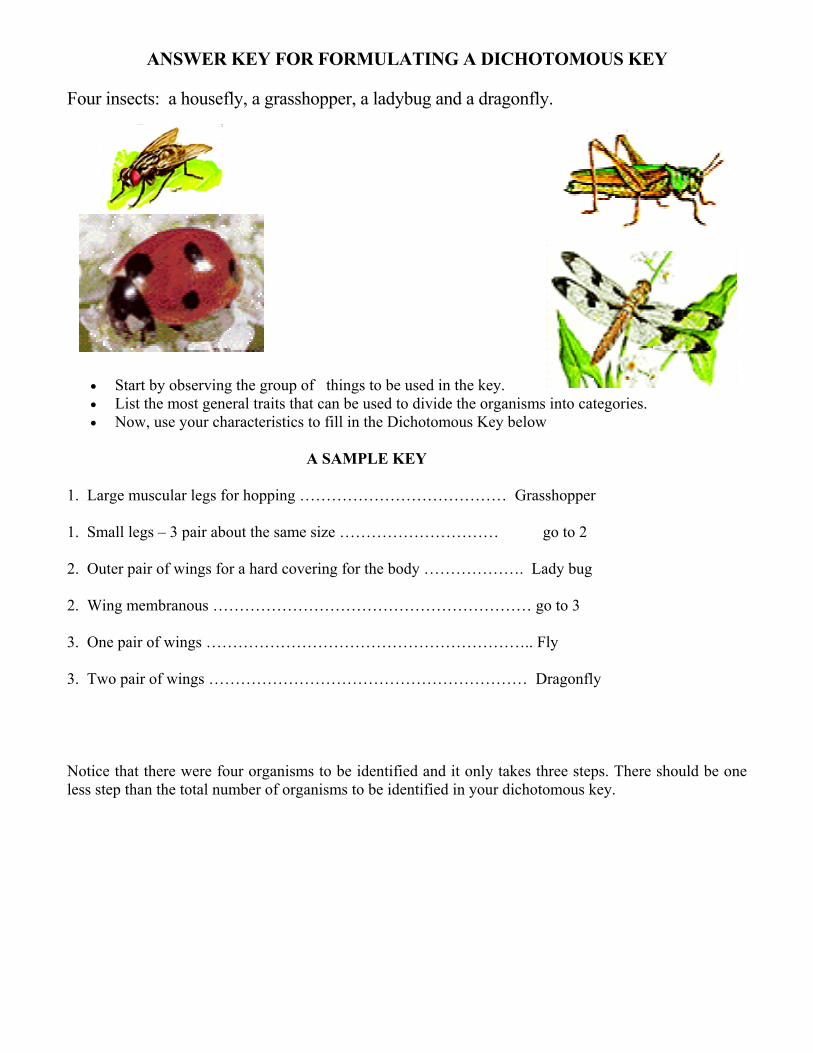
ANSWER KEY FOR FORMULATING A DICHOTOMOUS KEY Four insects: a housefly, a grasshopper, a ladybug and a dragonfly.
nto categories. Now, use your characteristics to fill in the Dichotomous Key below
A SAMPLE KEY
1. Large muscular legs for hopping ………………………………… Grasshopper
1. Small legs – 3 pair about the same size ………………………… go to 2
2. Outer pair of wings for a hard covering for the body ………………. Lady bug
2. Wing membranous …………………………………………………… go to 3
3. One pair of wings …………………………………………………….. Fly
3. Two pair of wings …………………………………………………… Dragonfly
here should be one ss step than the total number of organisms to be identified in your dichotomous key.
• Start by observing the group of things to be used in the key. • List the most general traits that can be used to divide the organisms i•
Notice that there were four organisms to be identified and it only takes three steps. Tle
|

PRESENTING SCIENTIFIC DATA WITH TABLES AND GRAPHS
Have headings
I. Data tables A. Format 1. Contain boxes divided into rows and columns. 2. and subheadings to explain data in boxes.
ation is contained in the table.
n either the title or headings.
e in the report. ave the number to the left of the title.
Is placed just below the table on the left side. Gra
in biology)
r for the number or amount of each thing.
B. Title 1. Is simple and concise. 2. Tells what inform C. Units of Measurement 1. Must be evident for all types of measurements represented. 2. May appear i D. Numbering Tables 1. Are numbered in the order of appearanc 2. H E. Source 1. Tells who collected data. 2. II. phs A. Types of Graphs (Commonly used 1. Histographs or bar graphs a. Use when there are various kinds of things. b. Form a ba 2. Line graph a. Shows a relationship between two kinds of things. b. Independent variable - factor whose changing value does
not depend upon its relationship to the other factor. (The factor being tested.) It goes on the X axis. c. Dependent variable - factor whose changing value is
red to see what's happening.) Y axis.
. Prin aphing
ains the independent variable.
dependent upon its relationship to the other factor. (The factor being measu It goes on the B ciples of Gr 1. X Axis a . Is the horizontal axis. b . Cont 2. Y Axis a. Is the vertical axis. b. Contains the dependent variable. 3. Scaling the Graph (Numbering each axis) a. Find the highest and lowest number to be placed on axis.
e.
ce by the number of boxes along axis.
b. If the numbering begins at zero, use it as lowest valu (such as percents or where all value started at zero) c. Find the difference between the highest and lowest value. d. Divide the differen e. Always round up. f. Starting with the lowest value, number lines along axis.
box has the same value increment.
ersect. which represent experimental error.
g. Be sure each 4. Plotting Points a. Find value for both X and Y axis. b. Place a dot where the two value lines would int 5. Circle points 6. Draw curve. 7. Labeling the graph a. Title of graph - concise but complete with graph number . b. X and Y Axis with name and units. c. Legend or code for more than one line on graph. d. Source telling who collected the data (lower left)
|

GRAPH ANALYSIS Exercise 1: Graphing A group of scientists conducted an experiment to determine the effect of Chemical A on the ability of mice to learn a maze. Each of the two groups of mice contained 50 males and 50 females. Group A received chemical A each day and group B received the same amount of water. After 10 minutes each mouse was given the maze test. Below are the average values as collected at the Institute for Advanced Animal Learning Studies. 1. Graph the provided data. When scaling the axis, use zero as lowest number for the independent variable and the actual low time for the dependent variable. 2. Be sure all information is provided on the graph. i.e. labels 3. Complete the Analysis of the Study questions. EFFECT OF CHEMICAL A ON MICE'S ABILITY TO DO MAZE Group A - CHEMICAL A Group B - WATER Day Ave.Time (sec) Day Ave.Time (sec) 1 61 1 75 2 57 2 74 3 52 3 72 4 45 4 75 5 35 5 68 6 29 6 65 7 25 7 62 8 23 8 55 9 20 9 52 10 16 10 48 11 13 11 42 12 14 12 37 13 12 13 35 14 13 14 30
|
_______________________________

ANALYSIS OF THE STUDY Using the information from the graphing assignment, answer the following questions concerning the study. . 1. What were the scientists trying to determine with this study? 2. Who did the study? 3. Which group was the experimental or test group? 4. Which group was the control group? 5. What animal was studied and how many were in each group? 6. What was the independent variable? 7. What was the dependent variable? 8. Which variables were the controlled variables for this study? 9. How long was the study conducted? 10. What was the longest time it took an animal to complete the maze? 11. What was the shortest time it took an animal to complete the maze? 12. Calculate the % improvement for group A. 13. Calculate the % improvement for group B. 14. Which group learned the fastest? Which group had the greatest % improvement? 15. What was the effect of Chemical A on the ability of the test subjects to learn?
|

ANSWER KEY FOR GRAPH ANALYSIS Exercise 1: Graphing A group of scientists conducted an experiment to determine the effect of Chemical A on the ability of mice to learn a maze. Each of the two groups of mice contained 50 males and 50 females. Group A received chemical A each day and group B received the same amount of water. After 10 minutes each mouse was given the maze test. Below are the average values as collected at the Institute for Advanced Animal Learning Studies. 1. Graph the provided data. When scaling the axis, use zero as lowest number for the independent variable and the actual low time for the dependent variable. 2. Be sure all information is provided on the graph. i.e. labels 3. Complete the Analysis of the Study questions.
EFFECT OF CHEMICAL A ON MICE'S ABILITY TO DO MAZE Group A - CHEMICAL A Group B - WATER Day Ave.Time (sec) Day Ave.Time (sec) 1 61 1 75 2 57 2 74 3 52 3 72 4 45 4 75 5 35 5 68 6 29 6 65 7 25 7 62 8 23 8 55 9 20 9 52 10 16 10 48 11 13 11 42 12 14 12 37 13 12 13 35 14 13 14 30 EFFECT OF CHEMICAL A ON MICE'S ABILITY TO DO MAZE
Legend __ Group A (Chemical A) --- Group B ( Water)
| Institute for Advanced Animal Learning Studies

ANSWER KEY FOR ANALYSIS OF THE STUDY Using the information from the graphing assignment, answer the following questions concerning the study. 1. What were the scientists trying to determine with this study? The effect of Chemical A on the ability of mice to learn a maze. 2. Who did the study? A group of scientists from the Institute of Advanced Animal Learning Studies. 3. Which group was the experimental or test group? Group A 4. Which group was the control group? Group B 5. What animal was studied and how many were in each group? Mice (100 animals [50 males and 50 females] per group) 6. What was the independent variable? Day - "Chemical A being administered." 7. What was the dependent variable? Time in seconds 8. Which variables were the controlled variables for this study? All other variables. 9. How long was the study conducted? 14 days. 10. What was the longest time it took an animal to complete the maze? 75 seconds. 11. What was the shortest time it took an animal to complete the maze? 12 seconds. 12. Calculate the % improvement for group A. longest - shortest (61-12) % improvement = longest X 100 = 61 = 80%o 13. Calculate the % improvement for group B. 75 - 30 % improvement = 75 X 100 = 60% 14. Which group learned the fastest? Which group had the greatest % improvement? Group A. Group A. 15. What was the effect of Chemical A on the ability of the test subjects to learn? It improved the mice's ability to learn the maze.
|

HUMAN MISTAKES VS. EXPERIMENTAL ERRORS
Human Mistakes are mistakes or blunders made by the person performing the procedure due to carelessness or individual bias. Examples of human mistakes are misreading directions, incorrectly reading a measuring device, using incorrect chemicals or forgetting to include a component, incorrectly measuring chemicals, spilling or contaminating solutions, breaking equipment or using unclean equipment, recording measurements incorrectly or doing calculations incorrectly. Data derived as a result of human mistakes is not valid. If you know you have made a human mistake, the results should not be used. Many problems in competition result from human mistakes. Human mistakes can be avoided by care and attention to detail when performing a task. Experimental Errors are errors resulting from instrument variation or the techniques used to conduct an experiment. There are two types of experimental errors – systematic errors and random errors. Random Errors are chance variations due to variations in individual test specimens, difference measuring devices or pieces of equipment, environmental variations, or different persons performing the experiment. These errors will have an equal chance of having results that are too high or too low. If sufficient numbers of measurements are made the low values will cancel out the high. Examples of chance variations or random errors include variation in eye level when reading an instrument, variations in calibration from one instrument to another of the same type, variations in different pieces of equipment of the same type, slight variations in environmental conditions. The experimenter has little or no control over random errors. Systematic Errors are the result of the way in which the experiment was conducted or the design of the system. These errors result in values that are consistently too high or too low. Examples of systematic errors are miscalibrated measuring instruments, improperly adjusted instruments, not noticing a ruler with rounded ends, a clock with runs too fast or too slow, reading the top instead of bottom of a meniscus. Reducing systematic errors comes with increased skill of the experimenter in refining techniques and checking the calibration of instruments, recognizing and eliminating sources of systematic errors. BASIC STATISTICAL ANALYSIS Mean is the average. It is found by adding all of the values and dividing by the total number of values. The mean is used to analyze random error. Median is the middle value. It is found by arranging all of the values in increasing or decreasing value or magnitude and finding the middle. Mode is the value that occurs most frequently or often. Range is the difference between the high value and the low value.
|
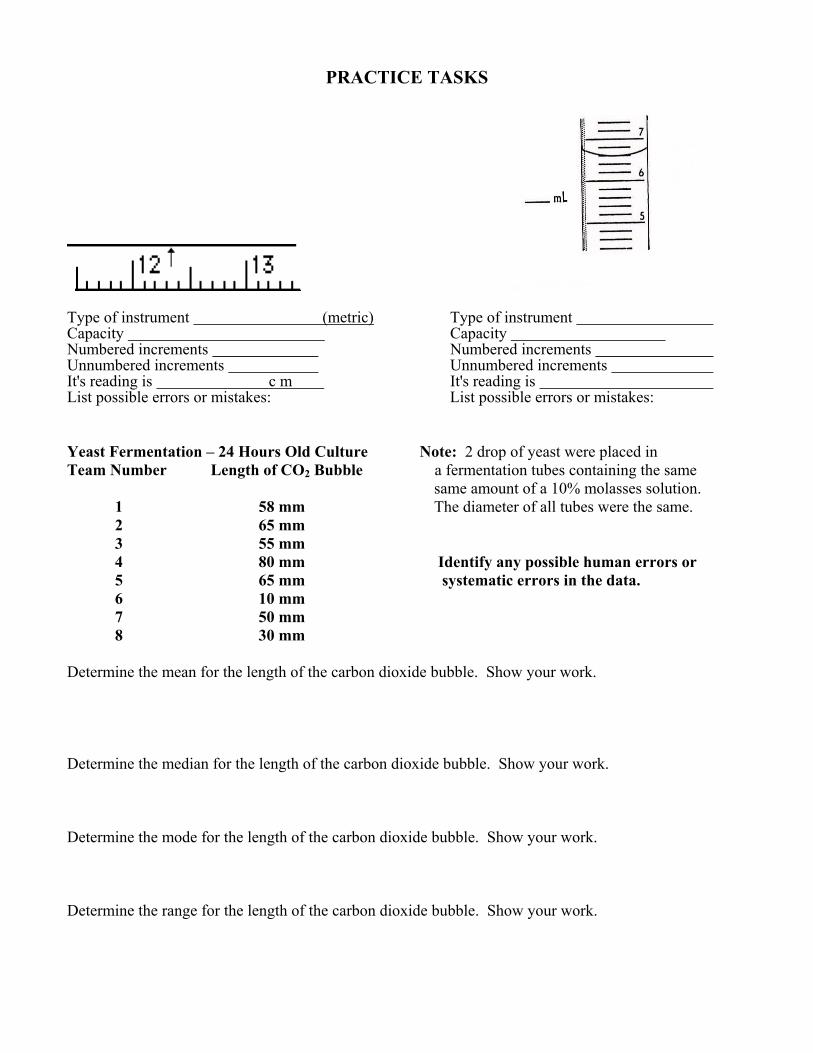
PRACTICE TASKS
Type of instrument (metric) Type of instrument Capacity Capacity Numbered increments Numbered increments Unnumbered increments Unnumbered increments It's reading is c m It's reading is List possible errors or mistakes: List possible errors or mistakes: Yeast Fermentation – 24 Hours Old Culture Note: 2 drop of yeast were placed in Team Number Length of CO2 Bubble a fermentation tubes containing the same same amount of a 10% molasses solution. 1 58 mm The diameter of all tubes were the same. 2 65 mm 3 55 mm 4 80 mm Identify any possible human errors or 5 65 mm systematic errors in the data. 6 10 mm 7 50 mm 8 30 mm Determine the mean for the length of the carbon dioxide bubble. Show your work. Determine the median for the length of the carbon dioxide bubble. Show your work. Determine the mode for the length of the carbon dioxide bubble. Show your work. Determine the range for the length of the carbon dioxide bubble. Show your work.
|

PRACTICE TASKS - ANSWER KEY
Type of instrument ruler (metric) Type of instrument graduated cylinder Capacity 13.4 cm or 134 mm Capacity 7.4 mL Numbered increments 1 cm Numbered increments 1 mL Unnumbered increments 1 mm Unnumbered increments .2 mL It's reading is 12.35 cm It's reading is 6.60 mL List possible errors or mistakes: List possible errors or mistakes: reading a mm instead of cm incorrectly reading meniscus not estimating last digit incorrectly reading unnumbered increments Yeast Fermentation – 24 Hours Old Culture Note: 2 drop of yeast were placed in Team Number Length of CO2 Bubble a fermentation tubes containing the same same amount of a 10% molasses solution. 1 58 mm The diameter of all tubes were the same. 2 65 mm 3 55 mm 4 80 mm Identify any possible human errors or 5 65 mm systematic errors in the data. 6 10 mm Not mixing the yeast suspension in # 6 7 50 mm so not as much yeast was added. Determine the mean for the length of the carbon dioxide bubble. Show your work. Mean is total of all divided by 7 = 383/7 = 55 Determine the median for the length of the carbon dioxide bubble. Show your work. Median is the middle value = 80 65 66 58 55 50 10 = 58 Determine the mode for the length of the carbon dioxide bubble. Show your work. Mode is the value that occurs most frequently = 65 Determine the range for the length of the carbon dioxide bubble. Show your work. Range is 10 mm to 80 mm
|

FOOD LABEL WORKSHEET #1 1. How many grams per container? 2. How many grams per serving? 3. How many servings per container? 4. How many grams are there in an ounce? 5. How many calories per serving? 6. How many calories per container? 7. How many calories per gram of fat? 8. How many calories per gram of protein or carbohydrate? 9. The % Daily Value is based upon what calorie diet? 10. What is the most abundant ingredient? 11. What is the best vitamin source based on % daily values? 12. What is the best mineral source excluding sodium? 13. What % of a single serving is protein? 14. How many of the calories in a serving come from protein? 15. What % of a single serving is Total Carbohydrate? 16. What % of the Daily Value of Total Carbohydrate is in a single serving? 17. What % of a single serving is Total Fat? 18. How many calories are in a single serving of Total Fat? 19. How many mg of Sodium are in a serving?
| 20. What % of a single serving is neither protein, fat, nor carbohydrate?
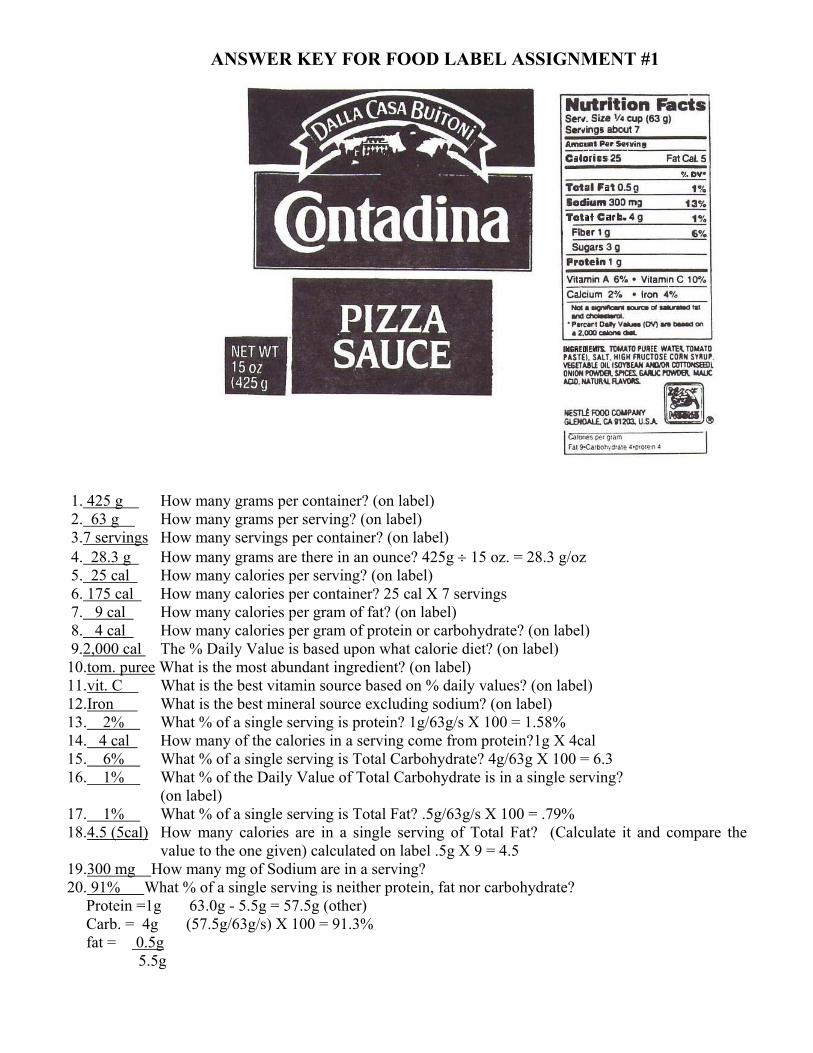
ANSWER KEY FOR FOOD LABEL ASSIGNMENT #1 1. 425 g How many grams per container? (on label) 2. 63 g How many grams per serving? (on label) 3.7 servings How many servings per container? (on label) 4. 28.3 g How many grams are there in an ounce? 425g ÷ 15 oz. = 28.3 g/oz 5. 25 cal How many calories per serving? (on label) 6. 175 cal How many calories per container? 25 cal X 7 servings 7. 9 cal How many calories per gram of fat? (on label) 8. 4 cal How many calories per gram of protein or carbohydrate? (on label) 9.2,000 cal The % Daily Value is based upon what calorie diet? (on label) 10.tom. puree What is the most abundant ingredient? (on label) 11.vit. C What is the best vitamin source based on % daily values? (on label) 12.Iron What is the best mineral source excluding sodium? (on label) 13. 2% What % of a single serving is protein? 1g/63g/s X 100 = 1.58% 14. 4 cal How many of the calories in a serving come from protein?1g X 4cal 15. 6% What % of a single serving is Total Carbohydrate? 4g/63g X 100 = 6.3 16. 1% What % of the Daily Value of Total Carbohydrate is in a single serving? (on label) 17. 1% What % of a single serving is Total Fat? .5g/63g/s X 100 = .79% 18.4.5 (5cal) How many calories are in a single serving of Total Fat? (Calculate it and compare the
value to the one given) calculated on label .5g X 9 = 4.5 19.300 mg How many mg of Sodium are in a serving? 20. 91% What % of a single serving is neither protein, fat nor carbohydrate? Protein =1g 63.0g - 5.5g = 57.5g (other) Carb. = 4g (57.5g/63g/s) X 100 = 91.3% fat = 0.5g 5.5g
|
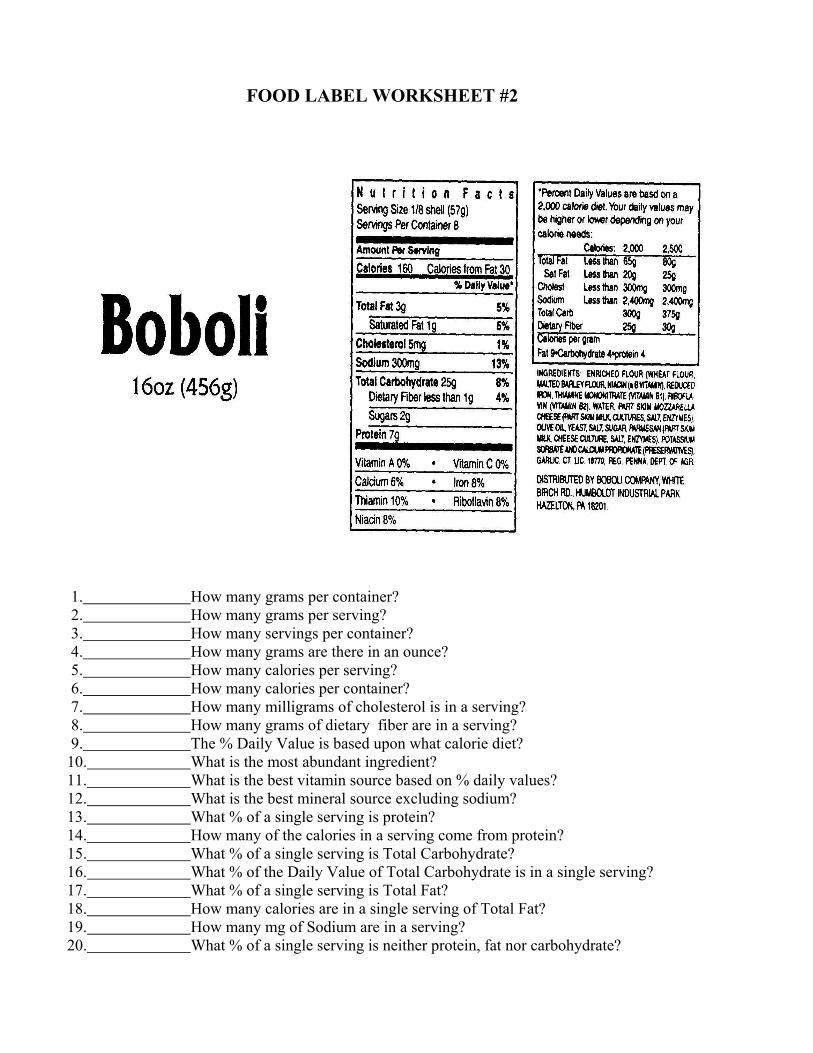
FOOD LABEL WORKSHEET #2
1. How many grams per container? 2. How many grams per serving? 3. How many servings per container? 4. How many grams are there in an ounce? 5. How many calories per serving? 6. How many calories per container? 7. How many milligrams of cholesterol is in a serving? 8. How many grams of dietary fiber are in a serving? 9. The % Daily Value is based upon what calorie diet? 10. What is the most abundant ingredient? 11. What is the best vitamin source based on % daily values? 12. What is the best mineral source excluding sodium? 13. What % of a single serving is protein? 14. How many of the calories in a serving come from protein? 15. What % of a single serving is Total Carbohydrate? 16. What % of the Daily Value of Total Carbohydrate is in a single serving? 17. What % of a single serving is Total Fat? 18. How many calories are in a single serving of Total Fat? 19. How many mg of Sodium are in a serving? 20. What % of a single serving is neither protein, fat nor carbohydrate?
|

ANSWER KEY FOR FOOD LABEL WORKSHEET #2
1.465g How many grams per container? (57g X 8 servings =456g) 2.57g How many grams per serving? (on label) 3.8 servings How many servings per container? (on label) 4.28.5g How many grams are there in an ounce? 465g/16oz. = 28.5 g/oz. 5.160 cal How many calories per serving? (on label) 6.1280 cal How many calories per container? 160cal x 8 servings = 1280 cal/cont. 7.5mg How many milligrams of cholesterol is in a serving? (on label) 8.less than 1 How many grams of dietary fiber are in a serving? (on label) 9.2000 cal diet The % Daily Value is based upon what calorie diet? (on label) 10.enriched flour What is the most abundant ingredient? (on label) 11.thiamin What is the best vitamin source? (on label - 10%) 12.Iron What is the best mineral source? (on label - 12%) 13.12 % What % of a single serving is protein? 7g/57g X 100 = 12% 14.28 cal How many of the calories in a serving are from protein? 7g X 4 cal/g = 28 cal 15.44 % What % of a single serving is Total Carbohydrate? 25g/57g X 100% = 44% 16.8% What % of the Daily Value of Total Carbohydrate is in a single serving? (on label) 17.5% What % of a single serving is Total Fat? (Calculate it and then compare this (calc) (label) value to the one given) 3g/57g X 100% = 5% 18.27 cal/30 cal How many calories are in a single serving of Total Fat? 3g X 9cal/g = 27cal 19.300 mg How many mg of Sodium are in a serving? (on label) 20.39% What % of a single serving is neither protein, fat nor carbohydrate? protein = 12% 7g (22g/57g) X 100 = 39% T. carbo = 44% 25g T. fat = 5% 3g Other = 39% 22g _____ _____ 100% 57g
|

POPULATION DENSITY AND ANALYSIS OF A SAMPLE 1. What is the length of the diagram in centimeters? 2. What is the area of the diagram in sq. cm? 3. The diagram represents a sample containing five kinds of plants. The scale for the
diagram is 10 mm = .10 meters. What is the actual area of the sample in square meters?
4. What is the density of plant per square meter? 5. What is the density of all five plants per sq. meter? 6. Which plant is best adapted to the conditions of the entire sample area? 7. Which plant is most dependent upon water? 8. Which plant is least abundant in the sample? 9. Which plant probably lives at the highest elevation? 10. What is the simplest way to determine the number of individuals in a large population?
|

ANSWER KEY FOR POPULATION DENSITY AND ANALYSIS OF A SAMPLE 7 cm 1. What is the length of the diagram in centimeters? .0049 m2 2. What is the area of the diagram in sq. cm? .07m2 = .0049 m2 .49 m2 3. The diagram represents a sample containing five kinds of plants. The scale for the
diagram is 10 mm = .10 meters. What is the actual area of the sample in square meters?
.7m2 = .49m2 14 's / m2 4. What is the density of plant per square meter? 7 's / .49 m2 = 14 's/m2 75 plants/m2 5. What is the density of all five plants per sq. meter? 37 plants / .49 m2 = 75 plants/m2 's 6. Which plant is best adapted to the conditions of the entire sample area? Throughout sample 's 7. Which plant is most dependent upon water? All near stream 's 8. Which plant is least abundant in the sample? 's 9. Which plant probably lives at the highest elevation? Taking samples10. What is the simplest way to determine the number of individuals in a large
population?
|
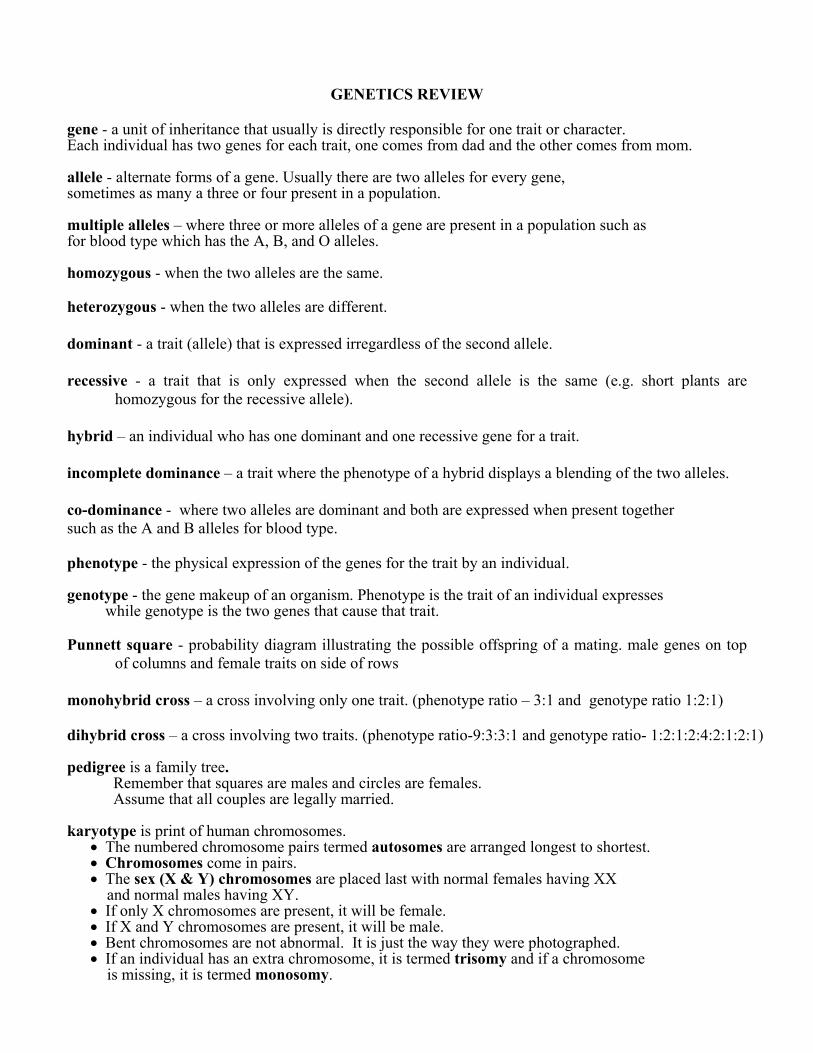
GENETICS REVIEW
gene - a unit of inheritance that usually is directly responsible for one trait or character. Each individual has two genes for each trait, one comes from dad and the other comes from mom. allele - alternate forms of a gene. Usually there are two alleles for every gene, sometimes as many a three or four present in a population. multiple alleles – where three or more alleles of a gene are present in a population such as for blood type which has the A, B, and O alleles. homozygous - when the two alleles are the same. heterozygous - when the two alleles are different.
dominant - a trait (allele) that is expressed irregardless of the second allele.
recessive - a trait that is only expressed when the second allele is the same (e.g. short plants are homozygous for the recessive allele).
hybrid – an individual who has one dominant and one recessive gene for a trait.
incomplete dominance – a trait where the phenotype of a hybrid displays a blending of the two alleles.
co-dominance - where two alleles are dominant and both are expressed when present together such as the A and B alleles for blood type. phenotype - the physical expression of the genes for the trait by an individual. genotype - the gene makeup of an organism. Phenotype is the trait of an individual expresses while genotype is the two genes that cause that trait. Punnett square - probability diagram illustrating the possible offspring of a mating. male genes on top of columns and female traits on side of rows
monohybrid cross – a cross involving only one trait. (phenotype ratio – 3:1 and genotype ratio 1:2:1)
dihybrid cross – a cross involving two traits. (phenotype ratio-9:3:3:1 and genotype ratio- 1:2:1:2:4:2:1:2:1) pedigree is a family tree. Remember that squares are males and circles are females. Assume that all couples are legally married. karyotype is print of human chromosomes.
• The numbered chromosome pairs termed autosomes are arranged longest to shortest. • Chromosomes come in pairs. • The sex (X & Y) chromosomes are placed last with normal females having XX and normal males having XY. • If only X chromosomes are present, it will be female. • If X and Y chromosomes are present, it will be male. • Bent chromosomes are not abnormal. It is just the way they were photographed. • If an individual has an extra chromosome, it is termed trisomy and if a chromosome
| is missing, it is termed monosomy.

Genetics Practice Problems Background: Phenotype is the observable trait an individual possesses while genotype is gene combinations an individual has which result in the trait being expressed. Directions: Complete each of the following genetics problems. Use Punnett squares where necessary to assist you. 1. In guinea pigs, short hair (S) is dominant over long hair (s). Two heterozygous dominant guinea pigs are crossed (Ss X Ss). ____________What will be the genotype ratio of their offspring? ____________What will be the phenotype ratio of their ratio? 2. In mice, black eyes (B) is dominant over red eyes (b). A heterozygous dominant mouse is crossed with a homozygous recessive mouse (Bb X bb). ___________What will be the genotype ratio of their offspring?
_________ __What will be the phenotype ratio of their ratio? 3. Four o'clock flowers exhibit incomplete dominance. Red flowers are RR and white flowers are WW. When a RW flower is present, it will be pink. A pink flower is crossed with a red flower. ___________What will be the genotype ratio of their offspring? ___________What will be the phenotype ratio of their ratio? 4. A man who is blood type AB marries a women who is blood type O. ___________What blood types might be present in their children? 5. A man who is a hemophiliac marries a woman who is a carrier for the hemophilia gene. ___________What percent of their sons can be expected to be hemophiliacs? ___________What percent of their daughters can be expected to be hemophiliacs? 6. In race horses, black hair (B) is dominant over chestnut hair (b) and a trotting gait (T) is dominant over a pacing gait (t). Two heterozygous black trotters are mated (BbTt X BbTt). ___________What will be the genotype ratio of their offspring? ___________What will be the phenotype ratio of their ratio? 7. A baby is born with blood type O. The baby's mother has blood type B. ___________What blood type could the biological father not have?
|

A karyotype is an arrangement of chromosomes with the autosomes arranged longest to shortest and the sex chromosomes listed last. Karyotypes are used to identify persons with extra or missing chromosomes. An extra chromosome is termed trisomy and a missing chromosome is monosomy.
8. Examine the karyotype listed below and answer the questions.
Is this individual a male or female? Is there any evidence of monosomy? If so, which pair of chromosomes is affected? Is there any evidence of trisomy? Is so, which pair of chromosomes is affected? How many chromosomes are present in a somatic cell of a normal human? How many chromosomes are present in a somatic cell of this human? A pedigree is a family tree. Males are represented by squares females are represented by circles.
9. Examine the pedigree provided and answer the questions. It represents a family with the recessive autosomal gene for cystic fibrosis. Shaded individuals have cystic fibrosis, half shaded are carrier, and not shaded do not have the gene for cystic fibrosis.
What is the relationship of individuals one and four? What is the genotype of individual seven? How many generations are represented on this pedigree? Which individuals might be identical twins? What phenotype will individual two express?
|
ANSWER KEY FOR GENETICS PRACTICE PROBLEMS Background: Phenotype is the observable trait an individual possesses whereas genotype is the gene combination an individual has which results in the trait being expressed. Directions: Complete each of the following genetics problems. Use Punnett squares where necessary to assist you. 1. In guinea pigs, short hair (S) is dominant over long hair (s). Two heterozygous
dominant guinea pigs are crossed (Ss X Ss). 1SS:2Ss:2ss What will be the genotype ratio of their offspring? 3 short:1 tall What will be the phenotype ratio of their ratio? 2. In mice, black eyes (B) is dominant over red eyes (b). A heterozygous dominant
mouse is crossed with a homozygous recessive mouse (Bb X bb). 2Bb : 2bb What will be the genotype ratio of their offspring? 2 black ¦ 2 red What will be the phenotype ratio of their ratio? 3. Four o'clock flowers exhibit incomplete dominance. Red flowers are RR and white
flowers are WW. When a RW flower is present, it will be pink. A pink flower is crossed with a red flower.
2RR : 2RW What will be the genotype ratio of their offspring? 2 red : 2 pink What will be the phenotype ratio of their ratio? 4. A man who is blood type AB marries a women who is blood type O. A or B What blood types might be present in their children? 5. A man who is a hemophiliac marries a woman who is a carrier for the hemophilia gene. 50% What percent of their sons can be expected to be hemophiliacs? 50% What percent of their daughters can be expected to be hemophiliacs? 6. In race horses, black hair (B) is dominant over chestnut hair (b) and a trotting gait
(T) is dominant over a pacing gait (t). Two heterozygous black trotters are mated (BbTt X BbTt). 1:2:1:2:4:2:1:2:1 What will be the genotype ratio of their offspring? 9:3:3:1 What will be the phenotype ratio of their ratio? Genotype: Phenotype: 1 BBTT : 2 BbTT : 1 bbTT 9 black trotters : 3 black pacers: 2 BBTt : 4 BbTt : 2 bbTt 3 chestnut trotters : 1 chestnut pacer 1 BBtt : 2 Bbtt : 1 bbtt
|

7. A baby is born with blood type O. The baby's mother has blood type B. AB What blood type could the biological father not have? PUNNETT SQUARES
1.
SS Ss
Ss ss 2
Bb bb
Bb bb 3
RR RW
RR RW 4
IAi IBi
IAi IBi
5
XXh XhXh
Xy Xhy 6
BBTT BBTt BbTT BbTt
BBTt BBtt BbTt Bbtt
BbTT BbTt bbTT bbTt
BbTt Bbtt bbTt bbtt
|

A karyotype is an arrangement of chromosomes with the autosomes arranged longest to shortest and the sex chromosomes listed last. Karyotypes are used to identify persons with extra or missing chromosomes. An extra chromosome is termed trisomy and a missing chromosome is monosomy. 8. Examine the karyotype listed below and answer the questions. male Is this individual a male or female? Both X and Y No Is there any evidence of monosomy? If so, which pair of chromosomes is affected? Yes - 21st Is there any evidence of trisomy? Is so, which pair of chromosomes is affected? Trisomy 21 = Down's Syndrome 46 How many chromosomes are present in a somatic cell of a normal human? 47 How many chromosomes are present in a somatic cell of this human? A pedigree is a family tree. Males are represented by squares females are represented by circles. 9. Examine the pedigree provided and answer the questions. It represents a family with the recessive autosomal gene for cystic fibrosis. Shaded individuals have cystic fibrosis, half shaded are carrier, and not shaded do not have the gene for cystic fibrosis. Father & Daughter What is the relationship of individuals one and four? Cc What is the genotype of individual seven? three How many generations are represented on this pedigree? 11 & 12 Which individuals might be identical twins? CC What phenotype will individual two express?
|
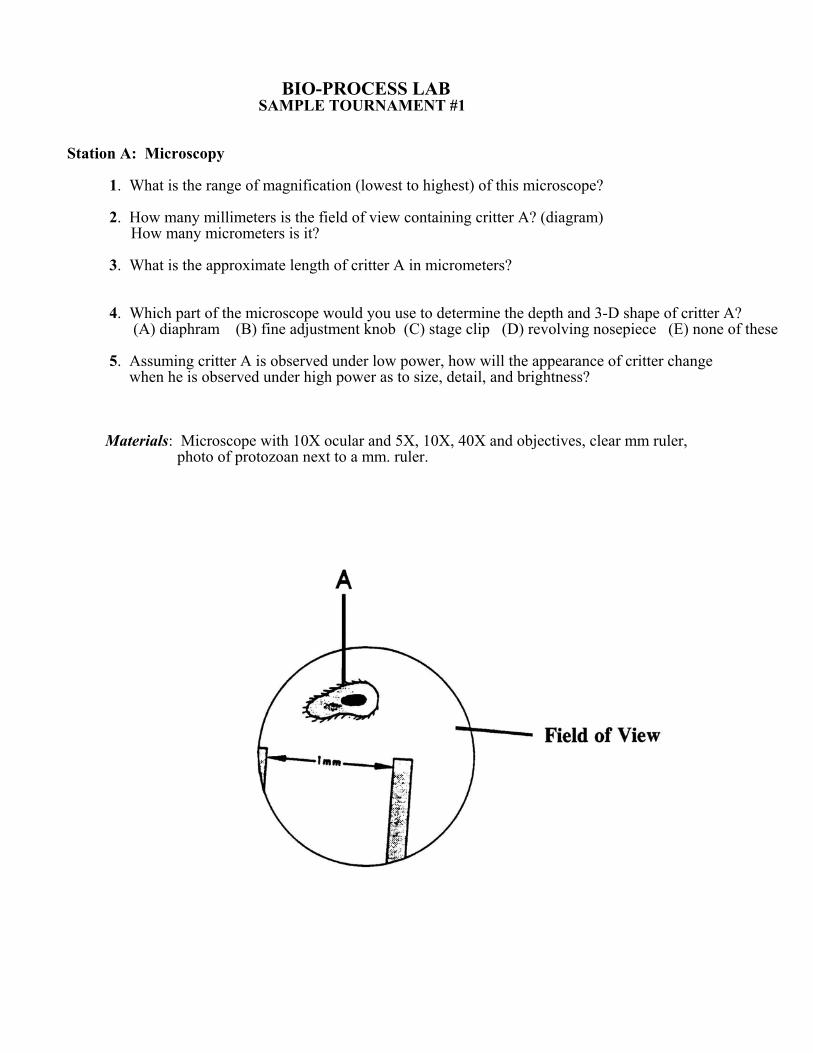
BIO-PROCESS LAB SAMPLE TOURNAMENT #1
Station A: Microscopy 1. What is the range of magnification (lowest to highest) of this microscope? 2. How many millimeters is the field of view containing critter A? (diagram) How many micrometers is it? 3. What is the approximate length of critter A in micrometers? 4. Which part of the microscope would you use to determine the depth and 3-D shape of critter A? (A) diaphram (B) fine adjustment knob (C) stage clip (D) revolving nosepiece (E) none of these 5. Assuming critter A is observed under low power, how will the appearance of critter change when he is observed under high power as to size, detail, and brightness? Materials: Microscope with 10X ocular and 5X, 10X, 40X and objectives, clear mm ruler, photo of protozoan next to a mm. ruler.
|

Station B: Lab Safety Examine the safety symbols and list of activities provided and answer the following questions. For questions 6 & 7 , use the safety symbols 6. Symbol “A” represents what type of hazard? 7. Symbol “B” represents what type of hazard? For questions 8 & 9, use the list of observed activities 8. Which of the observed activities would be considered safe and proper for a student’s health and safety? 9. Which of the observed activities would be considered unsafe and should not be done in the laboratory? 10. For the situation described below, explain the correct procedure for dealing with the emergency. You are performing a lab and you spill some bleach on your hand. SAFETY SYMBOLS LIST OF OBSERVED ACTIVITIES A. B.
A. Eating a candy bar while doing your frog dissection. B. Putting a broken test tube into the waste basket. C. Using a plastic graduated cylinder for heating a liquid. D. Mixing together chemicals to see what will happen. E. Wearing safety goggles when working with glass or chemicals.
|

Station C: Hypothesis Using the information about spider webs and the following key, decide which is the appropriate response. Key: A. A logical hypothesis according to the data. B. Illogical hypothesis or contrary to the data. C. Not a hypothesis, but a restatement of data. D. Reasonable hypothesis, but not based on this data 11. Web B was built when the spider was one month old. 12. As a spider gets older, its web becomes smaller in order to conserve energy. 13. All members of a species of spiders will build similar spider webs. 14. The spider needs more food as it grows, so it builds a larger web to catch more food. 15. These spider webs were built by the same spider.
|

Station D: Lab Equipment Use the list of equipment provided to answer the following questions 16. Give the letter of the piece of equipment that should be used to measure 0.1 mL of a liquid. 17. Give the letters of the pieces of equipment that should be used to dissect a shark. 18. Give the letters of the pieces of equipment that should be used to make a wet mount? 19. Give the letters of the pieces of equipment that should be used to heat 10 mL of a liquid. 20. Give the letters of the pieces of equipment that should be used to observe a planarian feeding. LIST OF EQUIPMENT A. compound stereoscope I. coverslip B. dissecting pan J. dissecting microscope C. safety goggles K. small culture dish D. dissecting kit L. test tube holder E. Pyrex test tube M. eye dropper F. 1 mL pipet N. Bunsen burner G. microscope slide O. mortar & pestle H. 10 mL graduated cylinder P. 10 mL beaker
|
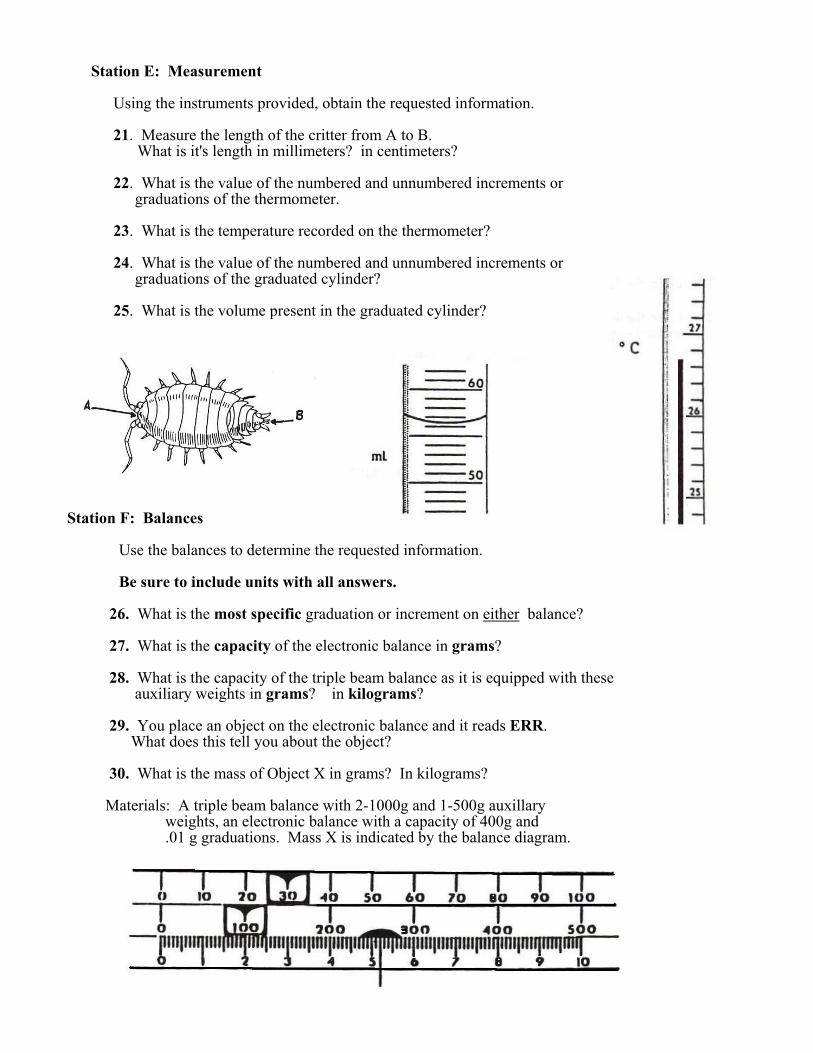
Station E: Measurement Using the instruments provided, obtain the requested information. 21. Measure the length of the critter from A to B. What is it's length in millimeters? in centimeters? 22. What is the value of the numbered and unnumbered increments or graduations of the thermometer. 23. What is the temperature recorded on the thermometer? 24. What is the value of the numbered and unnumbered increments or graduations of the graduated cylinder? 25. What is the volume present in the graduated cylinder?
Station F: Balances Use the balances to determine the requested information. Be sure to include units with all answers. 26. What is the most specific graduation or increment on either balance? 27. What is the capacity of the electronic balance in grams? 28. What is the capacity of the triple beam balance as it is equipped with these auxiliary weights in grams? in kilograms? 29. You place an object on the electronic balance and it reads ERR. What does this tell you about the object? 30. What is the mass of Object X in grams? In kilograms? Materials: A triple beam balance with 2-1000g and 1-500g auxillary weights, an electronic balance with a capacity of 400g and .01 g graduations. Mass X is indicated by the balance diagram.
|

Station G: Inferences Inferences are logical conclusions based upon observations. 31. From list 1, give the letters of those statements which are observations 32. From list 1, give the letters of those statements which are inferences. 33. From list 2, how many peanut seeds are in the shell? Is this an inference or is it an observation? 34. From list 2, about how many cm. should each lobe be? Why? 35 Which specimen is the mystery peanut? Give evidence to support your answer. Materials: 6 shelled peanuts which have not been opened (Only the shells are visible). List 1 – Observations vs. Inferences List 2 – Mystery Peanut A. The shell will crack easily Shell is triple lobed. B. The peanuts have skins around them. Shell is 6 cm. long. C. The shell has a rough surface. Shell lobes are uneven. D. The shells have one, two, or three lobes. One lobe is bent. E. The shells have rows of surface markings. Shell color is not uniform. F. There are peanuts in the lobes of the shell. G. The shells are not all evenly colored. Peanuts 1 – 6 Peanut 1 has all shell lobes straight. Peanut 2 has a uniform colored shell. Peanut 3 has a triple lobed shell. Peanut 4 is 4.5 cm. long Peanut 5 has 2 lobes. Peanut 6 is a single lobe.
|
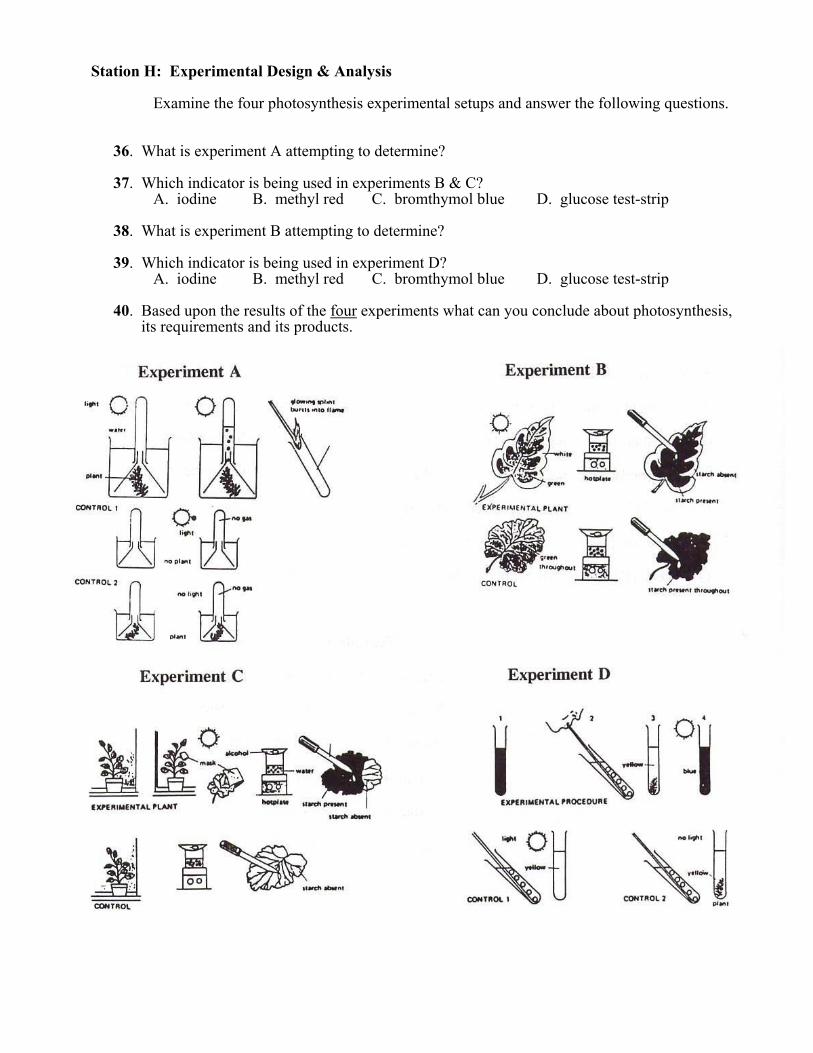
Station H: Experimental Design & Analysis Examine the four photosynthesis experimental setups and answer the following questions. 36. What is experiment A attempting to determine? 37. Which indicator is being used in experiments B & C? A. iodine B. methyl red C. bromthymol blue D. glucose test-strip 38. What is experiment B attempting to determine? 39. Which indicator is being used in experiment D? A. iodine B. methyl red C. bromthymol blue D. glucose test-strip 40. Based upon the results of the four experiments what can you conclude about photosynthesis, its requirements and its products.
|
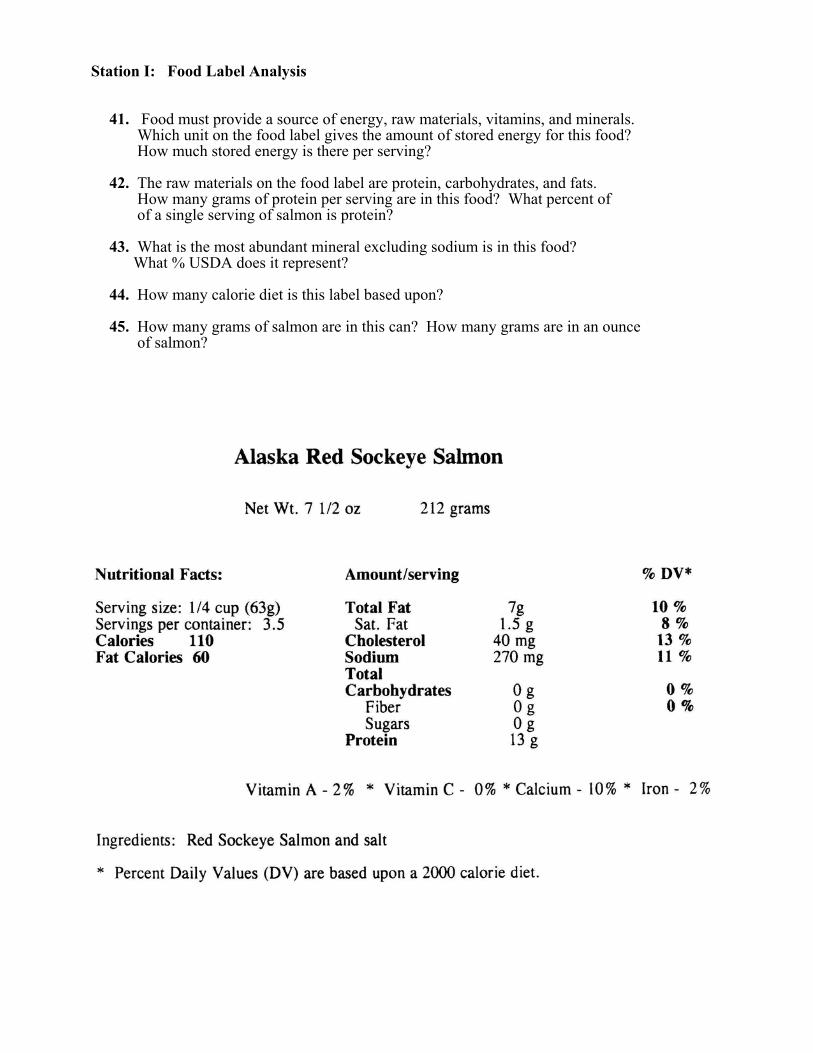
Station I: Food Label Analysis 41. Food must provide a source of energy, raw materials, vitamins, and minerals. Which unit on the food label gives the amount of stored energy for this food? How much stored energy is there per serving? 42. The raw materials on the food label are protein, carbohydrates, and fats. How many grams of protein per serving are in this food? What percent of of a single serving of salmon is protein? 43. What is the most abundant mineral excluding sodium is in this food? What % USDA does it represent? 44. How many calorie diet is this label based upon? 45. How many grams of salmon are in this can? How many grams are in an ounce of salmon?
|
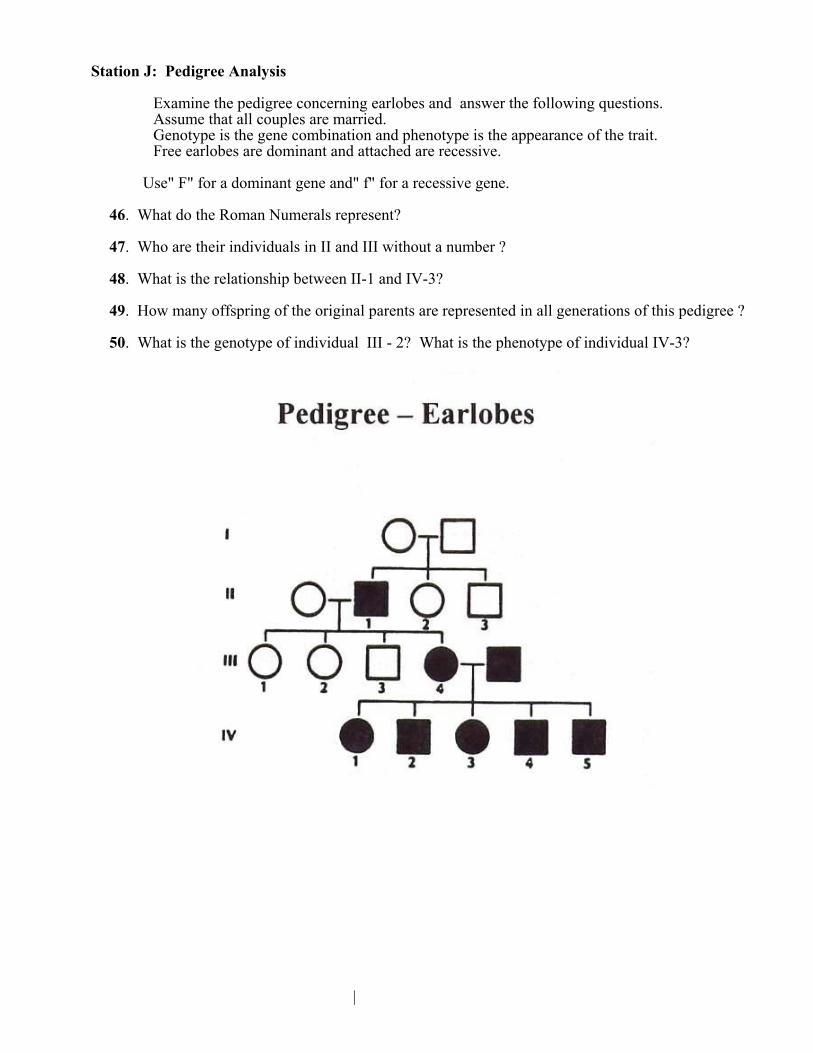
Station J: Pedigree Analysis Examine the pedigree concerning earlobes and answer the following questions. Assume that all couples are married. Genotype is the gene combination and phenotype is the appearance of the trait. Free earlobes are dominant and attached are recessive. Use" F" for a dominant gene and" f" for a recessive gene. 46. What do the Roman Numerals represent? 47. Who are their individuals in II and III without a number ? 48. What is the relationship between II-1 and IV-3? 49. How many offspring of the original parents are represented in all generations of this pedigree ? 50. What is the genotype of individual III - 2? What is the phenotype of individual IV-3?
| |

BIO-PROCESS LAB SCHOOL NUMBER SAMPLE TOURNAMENT # 1 SCHOOL STATE S NT NAMES: (PLEASE PRINT) TUDE RAW SCORE 1. RANK 2. POINTS BE SURE TO INCLUDE APPROPRIATE UNITS WITH ALL ANSWERS!!!
F: to 400 X
STATION A: STATION 1. 50 X 26. .01 g 2 ~ 1.5 mm ~ 1500 mcm 27. 400 g
mcm 3. ~ 600 28. 2610 g 2.61 kg 4. B – fine adjustment knob 29. error – beyond capacity
ore detail, darker 5.larger, m 30. 135.2 g
STATION B: STATION G: 6. fire or flame
31. C D E G 7. eye 32. A B F 8. E 33. 3 Inference 9. A B C D 34. ~ 2 cm It is 6cm & 3 lobes 10.Flush with H20 + tell teacher 35. peanut 3=only one that fits STATION C: STATION H: 11. C 36.Is light & chlorophyll needed 12. B 37. A – iodine 13. D 38.Is chlorophyll needed 14. A 39. C – bromythmyol blue 15. C 40. needs chlorophyll & light & C02 - makes O2 + starch STATION D: STATION I: 16. O 41. calories 110 cal 17. P 42. 13g,%protein = 13g/63g = 21% 18. A G I M 43. calcium – 10% 19. F 44. 2000 calorie diet 20. B D J C 45. 212 g – g/oz = 212g/7.5oz = ~ 28g/oz STATION E: STATION J: 21. 35.0 mm 3.50 cm 46. generations 22. NI = 1 o C UN = 0.2 o C 47. spouses (not offspring) 23. 26.5 o C 48. grandfather/granddaughter 24. NI = 10 mL UN = 1 mL 49. 12 25. 56.5 mL 50. Ff female attached
|

BIO-PROCESS LAB SAMPLE TOURNAMENT #2
tation A: Using a Microscope
microscope?
Hint
S 1. What is the range of magnification (lowest to highest) for this 2. A slide with the letters "P" is positioned in the normal reading position on the stage. Show how the "P" will appear when viewed. Use the slide with the "P" to help you if you wish. Place the transparent ruler on the stage, hold it down with the stage clips and focus on the metric scale with the low (10X) power objective. : Applying gentle pressure to the free end of the
ruler will help to adjust for the thickness of the ruler and allow better focus. (See the diagram)
amete f the w (1 ) pow
3. What is the di r o lo 0X er field of this microscope in millimeters ? in micrometers? 4. Assuming this algae photo was taken using the low power field of this microscope, what is the length in micrometers of the cell that is labeled "one cell" ? 5. A slide of red blood cells is viewed under high power (10X ocular and
40X objective). Ten evenly distributed cells are visible across . H man cells ould
the field of view ow y sh be visible across the low (10X) power field of view?
|

Station B: Experimental De Examine the graph provided and answer the following questions.
6. What is the independent variable for this study?
pendent variable for this study?
n epicotyl at day ll?
(B) Bean seedlings grow slower than corn seedlings.
(D) Corn grows better in sandy soil than beans do.
sign and Graphing
7. What is the de 8. Which seedlings were studied for their germination patterns? 9. What should be the height in centimeters of the bea 10. Based upon the data, one might conclude that (A) The corn seedling is dead. (C) The hypocotyl of bean seedlings grow taller than the hypocotyl of corn seedlings during the first week.
|
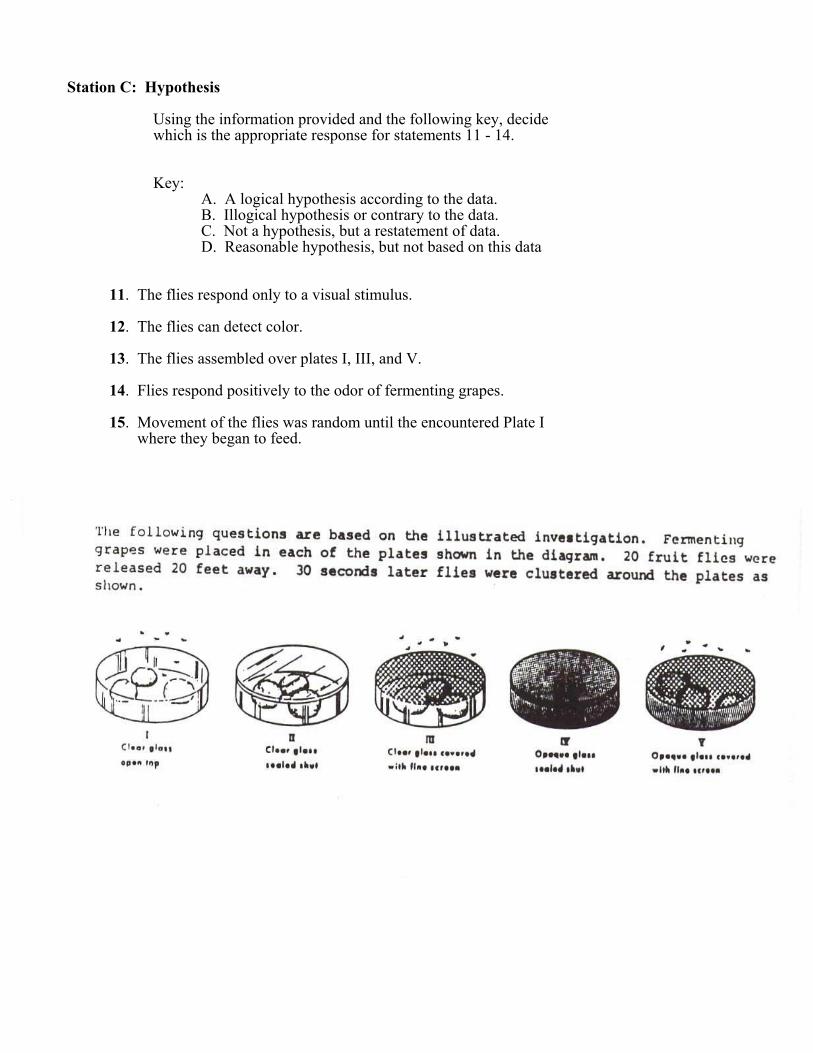
tation C: Hypothesis
Using the information provided and the following key, decide
A. A logical hypothesis according to the data. o the data.
C. Not a hypothesis, but a restatement of data. ta
respond only to a visual stimulus.
12. The flies can detect color.
13. The flies assembled over plates I, III, and V.
grapes.
ntered Plate I
S which is the appropriate response for statements 11 - 14. Key: B. Illogical hypothesis or contrary t D. Reasonable hypothesis, but not based on this da 11. The flies 14. Flies respond positively to the odor of fermenting 15. Movement of the flies was random until the encou where they began to feed.
|

Station D: Balances
.
Be sure to include units with all answers.
. W at is th er
Use the balances to determine the requested information 16 h e most specific graduation or increment on eith
bal ce?
. W at is th
18. What is the capacity of the triple beam balance as it is grams?
in kilograms?
19. What is the actual
an 17 h e capacity of the electronic balance? equipped with these two auxiliary weights in combined weight in grams of the two
balance.
's weight. What is it's weight in grams?
PLEASE - Place
auxiliary weights supplied with the triple beam 20. Place object X on the appropriate balance and determine it
all slides on the balance back at zero!! MATERIALS: Electronic balance – 0.1 g X 300 g, triple beam balance with 1 – 500 g and 1 - 1000g auxillary weights. Object X is a bottle filled with water to equal 750 g. NOTE: The auxillary weights have an actual mass of 147.5 g and 295 g.
|
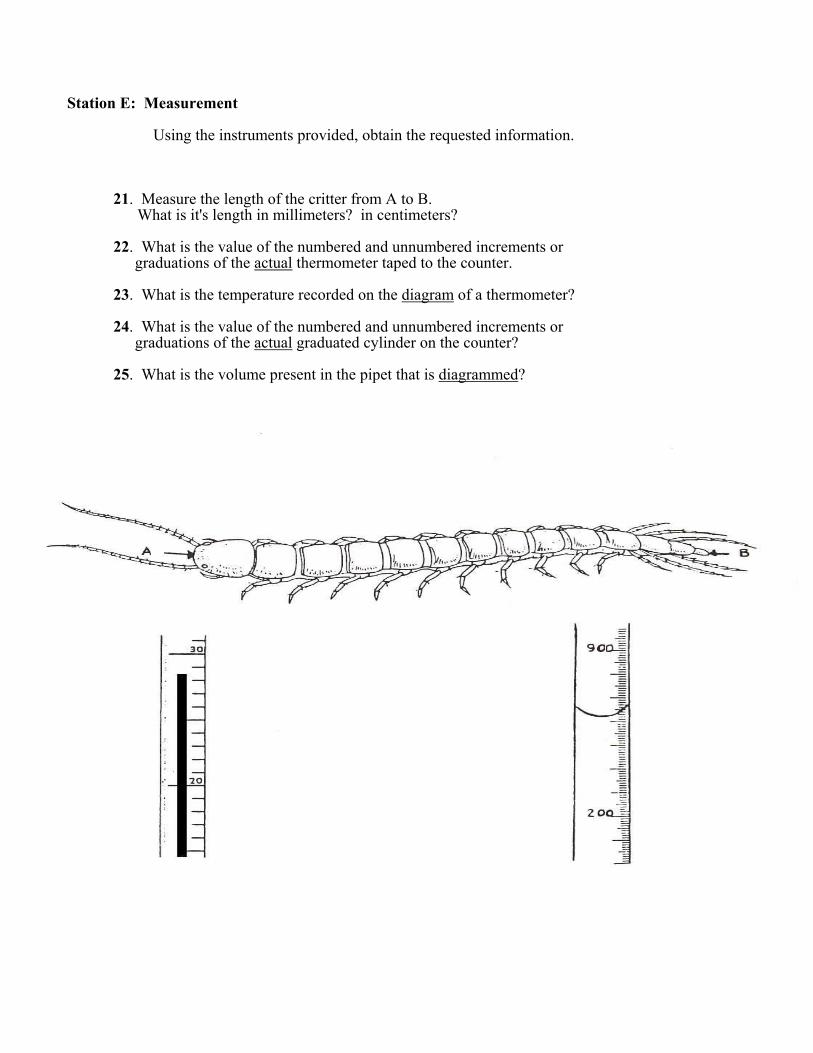
Station E: Measurement
ation.
t's length in millimeters? in centimeters?
ered increments or graduations of the actual
Using the instruments provided, obtain the requested inform 21. Measure the length of the critter from A to B. What is i 22. What is the value of the numbered and unnumb thermometer taped to the counter. 23. What is the temperature recorded on the diagram of a thermometer?
24. What is the value of the numbered and unnumbered increments or graduations of the actual graduated cylinder on the counter?
25. What is the volume present in the pipet that is diagrammed ?
|

Station F: Observations Use the specimens, diagrams and data provided to answer the following questions.
26. Using the diagrams provided and your knowledge of the bones
27. Skull B is from what animal?
pellet?
29. How many of the animals consumed by this owl should be rodents?
food chain that would be the most
in a vertebrate skeleton, name bone C . 28. On average, how many animal skeletons are found per owl 30. From the organisms represented in the food web, list a common source of energy
the data table. for the owl whose pellets were analyzed and represented on
|

|

Station G: Genetics For questions 31 - 33, refer to the pedigree on Huntington's chorea. Background: Assume that all couples are married. Genotype is the gene combination and phenotype is the appearance of a trait. Huntington’s is caused by a dominant allele. Capitals letters indicate dominant genes and lower case indicate recessive genes. Remember that circles are females and squares are males. 31. What is the probable genotype of individual D? 32. What is the relationship of individuals D and E? 33. What is the probability that individual M will not have Huntington's chorea? For questions 34 & 35, refer to the karyotypes provided? Background: A karyotype is an arrangement of chromosomes with the autosomes arranged longest to shortest and the sex chromosomes are placed at the end. Remember normal males have an X and Y and normal females have 2 X chromosomes. 34. Which individual(s) are male? 35. How many chromosomes are present in a somatic (body) cell of individual B?
|
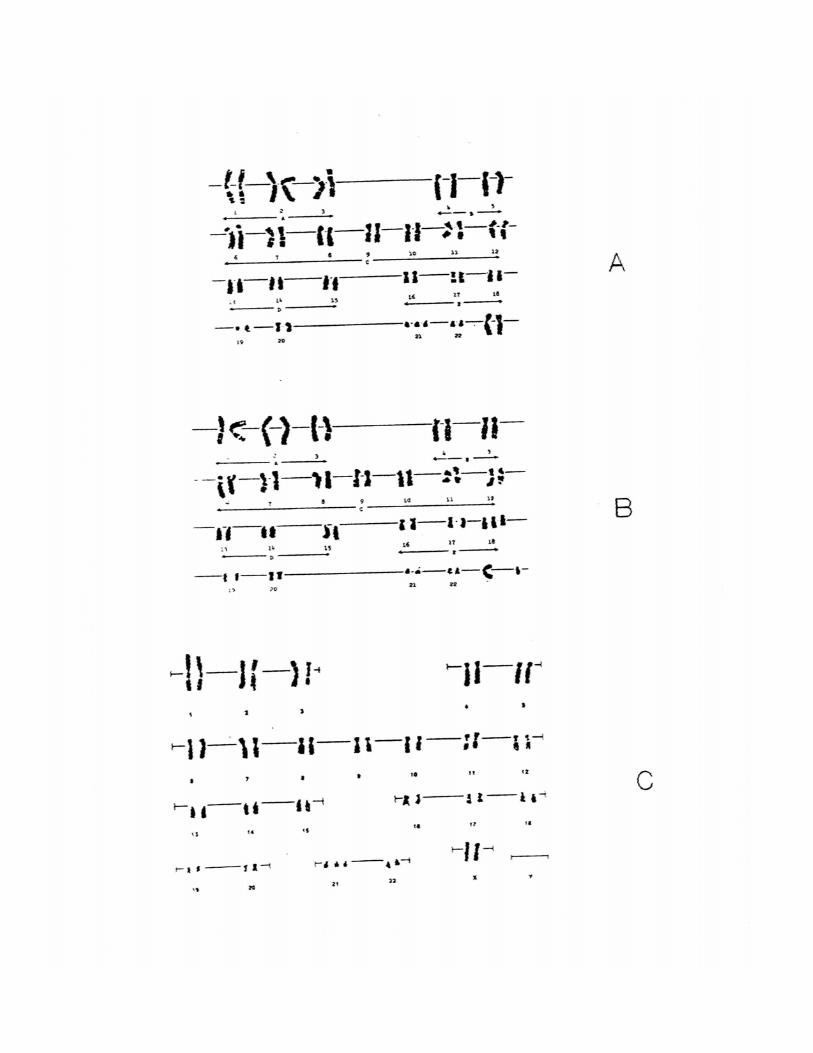
|

Station H: Nutrition & Bioenergy Examine the food label on the food provided. 36. Food must provide a source of energy, raw materials, vitamins, and minerals. What unit on the food label gives the amount of stored energy for this food and how much is there in one serving? 37. The raw materials listed on the food label are protein, carbohydrates and fat. How many grams of total carbohydrate are present per serving? What % of the USDA does it provide? 38. What is the most abundant vitamin in this food? What % USDA does it provide? 39. What is the most abundant ingredient in this food and what is the least abundant ingredient? 40. What % of a single serving of this food is protein? Show how you calculated it. Spaghetti with Meat Sauce Nutritional Facts: Amount/serving % DV* Serving size: 1pkg (326 g) Total Fat 40 g 6% Servings per container 1 saturated fat 1g 5% Calories 300 polyunsaturated fat 1g Fat Calories 35 monounsaturated fat 1.5 g Cholesterol 15 mg 4% Sodium 510 mg 20% Total Carbohydrates 51 g 17% Dietary fiber 5g 20% Sugars 9g Protein 13g Vitamin A – 15%* Vitamin C – 4%* Calcium – 6%* Iron – 10%* Ingredients: Cooked spaghetti, tomatoes, water, beef, mushrooms, onions, bleached flour, salt, parmesan cheese, beef flavor, soy sauce, pepper * Percent Daily Values (DV) are based upon a 2000 calorie diet
|
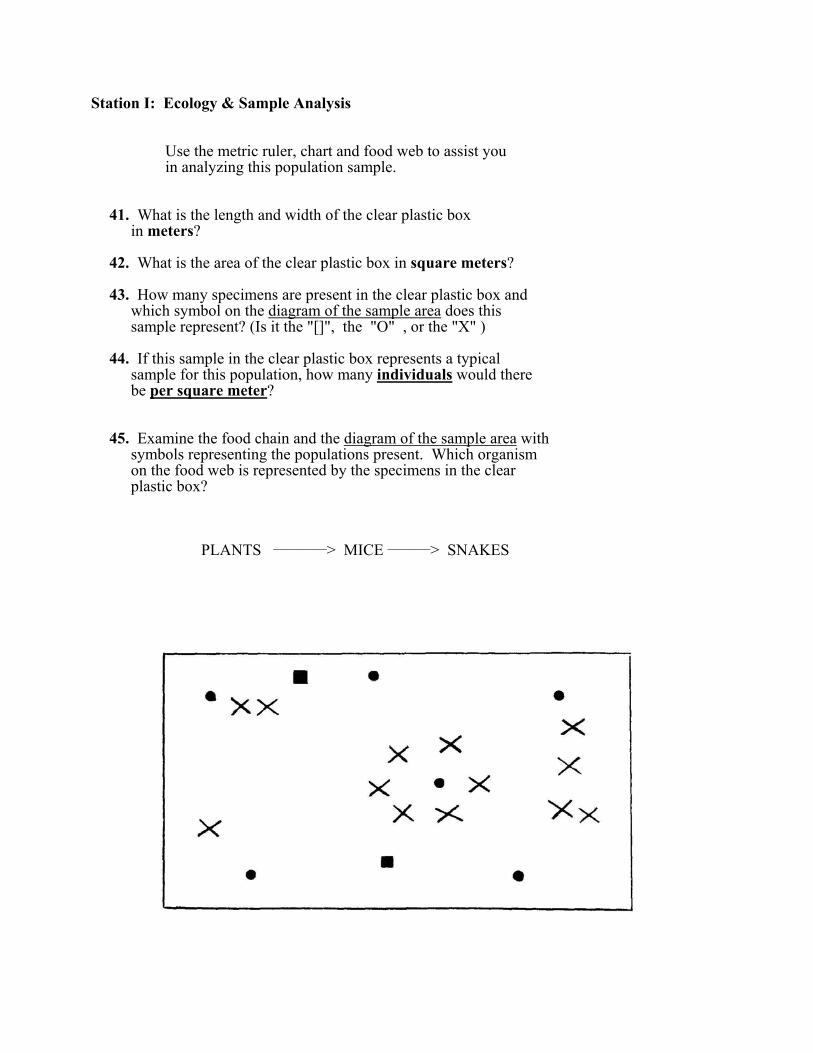
Station I: Ecology & Sample Analysis Use the metric ruler, chart and food web to assist you in analyzing this population sample.
rs?
which symbol on the diagram of the sample area
41. What is the length and width of the clear plastic box in meters? 42. What is the area of the clear plastic box in square mete 43. How many specimens are present in the clear plastic box and does this
44. If this sample in the clear plastic box represents a typical
sample represent? (Is it the "[]", the "O" , or the "X" ) sample for this population, how many individuals would there be per square meter?
chain and the diagram of the sample area 45. Examine the food with symbols representing the populations present. Which organism on the food web is represented by the specimens in the clear plastic box?
PLANTS __________> MICE ________> SNAKES
|

Station J: Dichotomous key Use the specimens and the dichotomous key
46. Specimen A is a ?
to identify the requested specimen.
. Materials: Specimen A = white pine needles
47. Specimen B is a ? . Specimen B = maple leaf
48. Specimen C is a ? . Specimen C = horse chestnut leaf
49. Specimen D is a ? . Specimen D = ash leaf 50. Specimen E is a ? . Specimen E = elm leaf
1. Leaves needle-like . . . . . . . . . . . . . . . . . . . . . . . . . . . . . .2 1. Leaves are broad and flat . . . . . . . . . . . . . . . . . . . . . . . . 3 2. Needles in bundles of 5 . . . . . . . . . . . . . . . . . Pinus strobus 2. Needles in bundles of 2 . . . . . . . . . . . . . . . . .Pinus resinosa 3. Leaves compound . . . . . . . . . . . . . . . . . . . . . . . . . . . . . 4 3. Leaves simple . . . . . . . . . . . . . . . . . . . . . . . . . . . . . . . . 5 4. Leaves palmately compound . . . . . . . . . . . . . . . .Aesculus sp. 4. Leaves pinnately compound . . . . . . . . . . . . . . . . Fraxinus sp. 5. Leaves arranged opposite on stem . . . . . . . . . . . . . . . . . . . .6 5. Leaves arranged alternate on stem . . . . . . . . . . . . . . . . . . ..7 6. Leaves lobed star-like . . . . . . . . . . . . . . . . . . . . . . .Acer sp. 6. Leaves not lobed, large heart-shaped . . . . . . . . . . . Catalpa sp.. 7. Leaves with uneven base, longer than wide . . . . . . . Ulmus sp. 7. Leaves with even base, longer than wide . . . . . . . . . .Betula sp.
|

ANSWER KEY: SAMPLE TOURNAMENT #2 SCHOOL NUMBER BIO-PROCESS LAB SCHOOL STATE STUDENT NAMES: R (PLEASE P INT) RAW SCORE 1. RANK 2. POINTS BE SURE TO INCLUDE APPROPRIATE UNITS WITH ALL ANSWERS!!!
450 X
STATION A: STATION F: 1. 50X to 26. femur 2 . d 27. shrew
5 mm 1500 mcm 3. 1. 28. ~ 3 4. 300 mcm 29. 37
cells 5. 40 30. plant rodent owl
STATION B: STATION G: 6. Days
31. H h 7. Length in cm 32. sister and brother 8. corn & bean 33. 50 % 9. 9 cm 34. Individual B
10. C 35. 47
STATION C: STATION H: 11. B
36. calories 300 calories 12. D 37. 51 g 17% 13. C 38. vitamin A 15% 14. A 39. spaghetti pepper 15. B 40. 13 g /326 g X 100% = 4%
STATION D: STATION I: 16. 0.1 g
41. .175 m X .125 m 17. 300 g 42. .02 m2 18. 2110 g
43. 13 19. 442.5 g 44. 650 individuals/ m2 20. 750.0 g 45. plants
N J:
STATION E: STATIO 21. 137.0 mm 13.70 cm 46. Pinus strobus . 22. n = 10o C un = 1o C 47. Acer . 23. 28.5o C 48. Aesculus 24. n = 10 mL un = 1 mL 49. Fraxinus . 25. 620.0 mL 50. Ulmus .
|
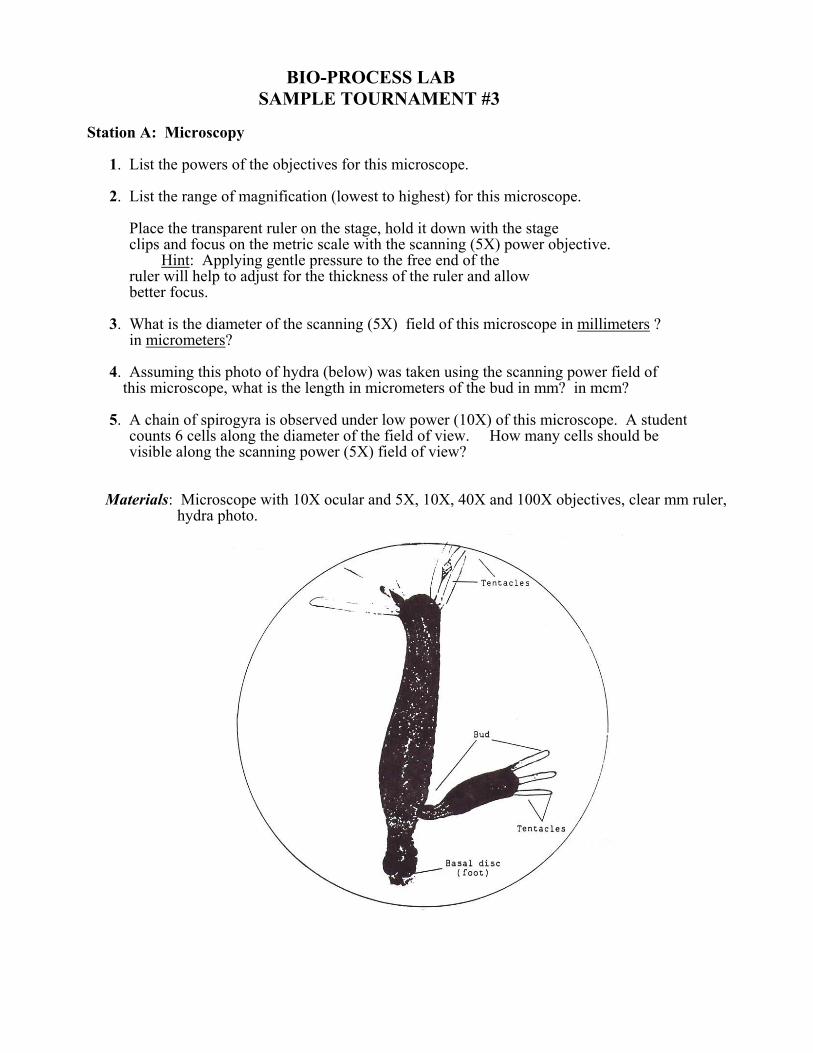
BIO-PROCESS LAB
1. List the powers of the objectives for this microscope.
Place the transparent ruler on the stage, hold it down with the stage clips and focus on the metric scale with the scanning (5X) power objective.
SAMPLE TOURNAMENT #3 Station A: Microscopy 2. List the range of magnification (lowest to highest) for this microscope. Hint: Applying gentle pressure to the free end of the ruler will help jus the kn f the ruler and allow to ad t for thic ess o better focus. 3. What is the diameter of the scanning (5X) field of this microscope in millimeters ? in micrometers? 4. Assuming this photo of hydra (below) was taken using the scanning power field of
, wha s the gth i icro this microscope t i len n m meters of the bud in mm? in mcm? 5. A chain of spirogyra is observed under low power (10X) of this microscope. A student counts 6 cells along the diameter of the field of view. How many cells should be visible along the scanning power (5X) field of view? Materials: Microscope with 10X ocular and 5X, 10X, 40X and 100X objectives, clear mm ruler, hydra photo.
|
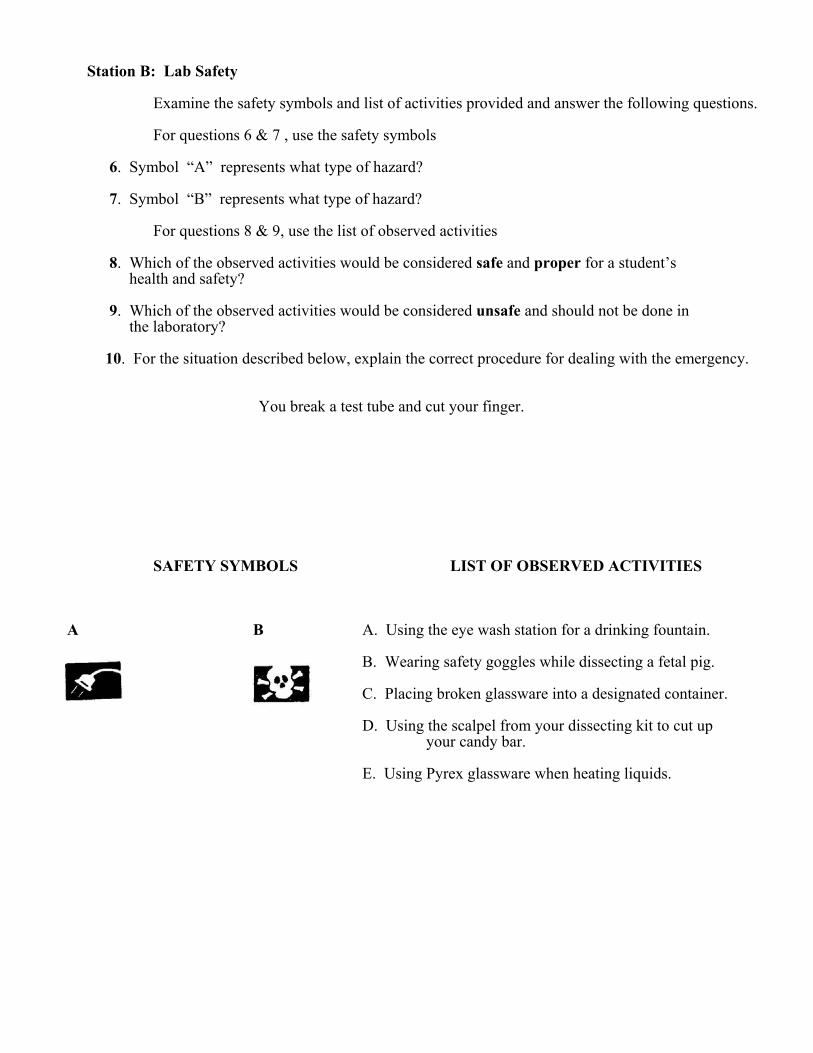
Station B: Lab Safety Examine the saf ed and answer the following questions.
& 7 , use the safety symbols
proper for a student’s
9. Which of the observed activities would be considered unsafe and should not be done in
10. For the situation described below, explain the correct procedure for dealing with the emergency.
You break a test tube and cut your finger.
SAFETY SYMBOLS LIST OF OBSERVED ACTIVITIES
A B A. Using the eye wash station for a drinking fountain.
B. Wearing safety goggles while dissecting a fetal pig. C. Placing broken glassware into a designated container.
D. Using the scalpel from your dissecting kit to cut up your candy bar. E. Using Pyrex glassware when heating liquids.
ety symbols and list of activities provid For questions 6 6. Symbol “A” represents what type of hazard? 7. Symbol “B” represents what type of hazard? For questions 8 & 9, use the list of observed activities 8. Which of the observed activities would be considered safe and health and safety? the laboratory?
|
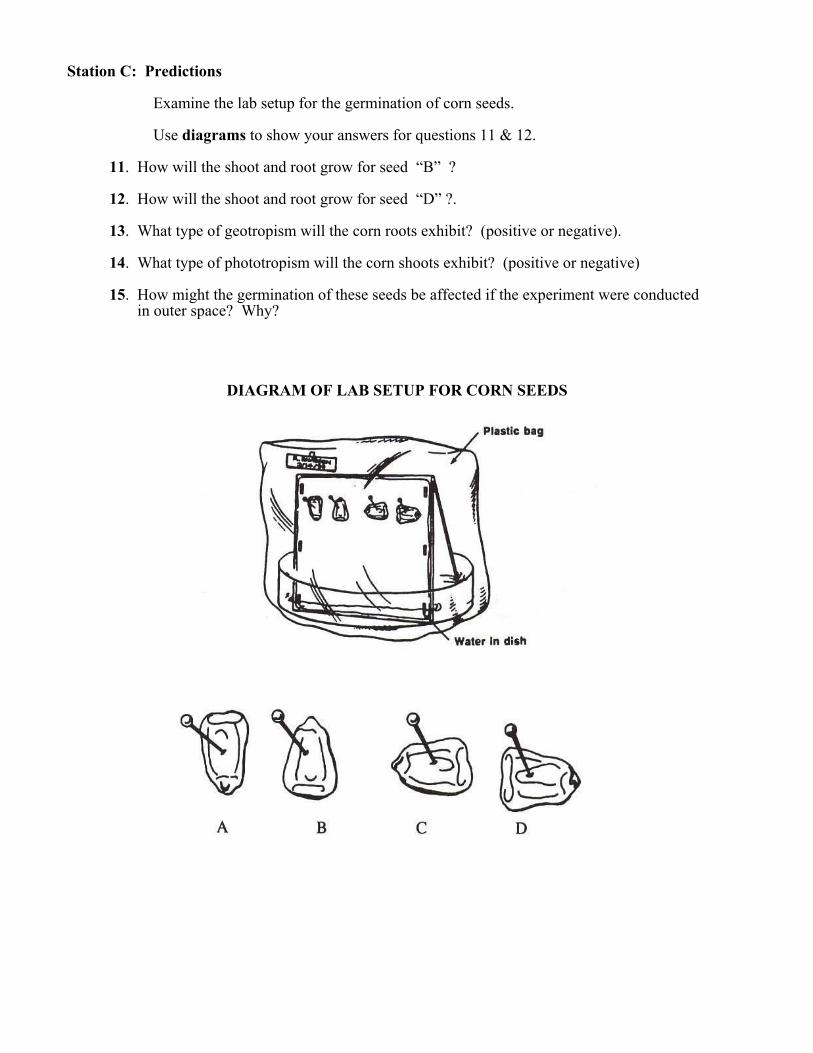
Station C: Predictions Examine the lab setup for the germination of corn seeds. Use diagrams to show your answers for questions 11 & 12.
” ?
” ?.
. W itive or negative).
15. How might the germination of these seeds be affected if the experiment were conducted
DIAGRAM OF LAB SETUP FOR CORN SEEDS
11. How will the shoot and root grow for seed “B 12. How will the shoot and root grow for seed “D 13 hat type of geotropism will the corn roots exhibit? (pos 14. What type of phototropism will the corn shoots exhibit? (positive or negative) in outer space? Why?
|
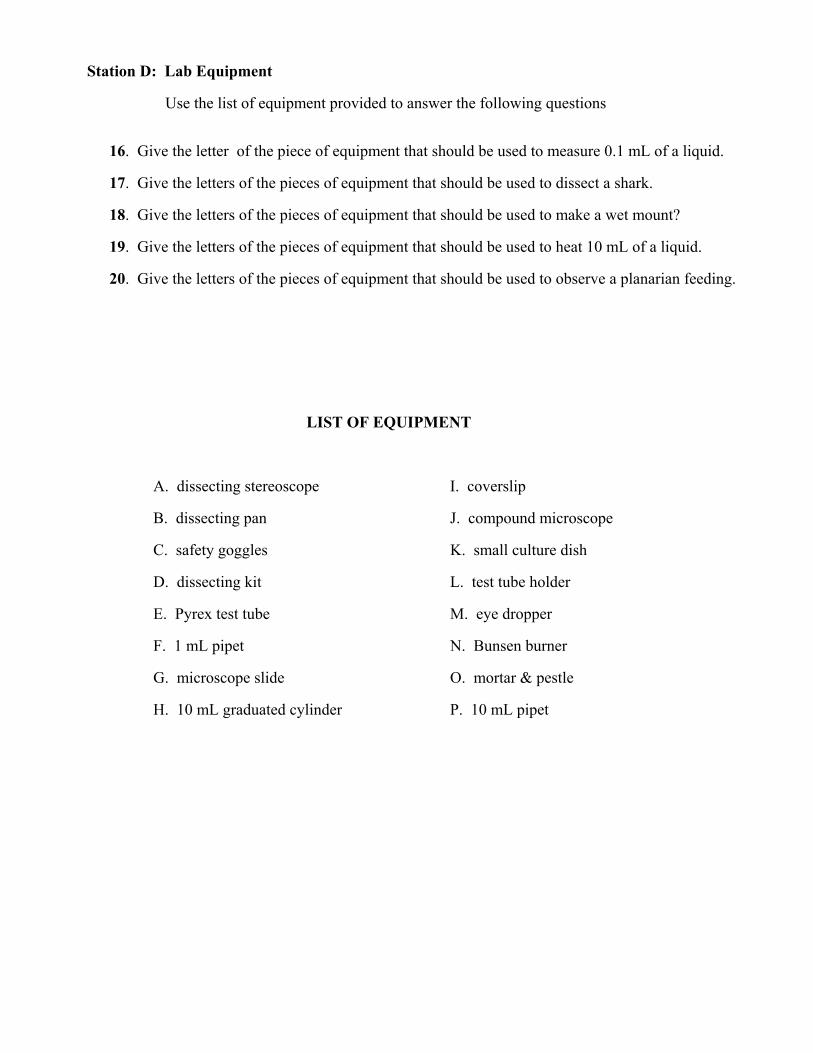
Station D: Lab Equipment
ing questions
16. Give the letter of the piece of equipment that should be used to measure 0.1 mL of a liquid.
17. Give the letters of the pieces of equipment that should be used to dissect a shark.
18. Give the letters of the pieces of equipment that should be used to make a wet mount?
19. Give the letters of the pieces of equipment that should be used to heat 10 mL of a liquid.
20. Give the letters of the pieces of equipment that should be used to observe a planarian feeding.
LIST OF EQUIPMENT
A. dissecting stereoscope I. coverslip
B. dissecting pan J. compound microscope
C. safety goggles K. small culture dish
D. dissecting kit L. test tube holder
E. Pyrex test tube M. eye dropper
F. 1 mL pipet N. Bunsen burner
G. microscope slide O. mortar & pestle
H. 10 mL graduated cylinder P. 10 mL pipet
Use the list of equipment provided to answer the follow
|

Station E: Measurement Using the instruments provided, obtain the requested information.
21. Measure the length of the critter from A to B.
graduations of the thermometer.
23. What is the temperature recorded on the thermometer?
24. What is the value of the numbered and unnumbered increments or graduations of the graduated cylinder?
25. What is the volume present in the graduated cylinder?
What is it's length in millimeters? in centimeters? 22. What is the value of the numbered and unnumbered increments or
|
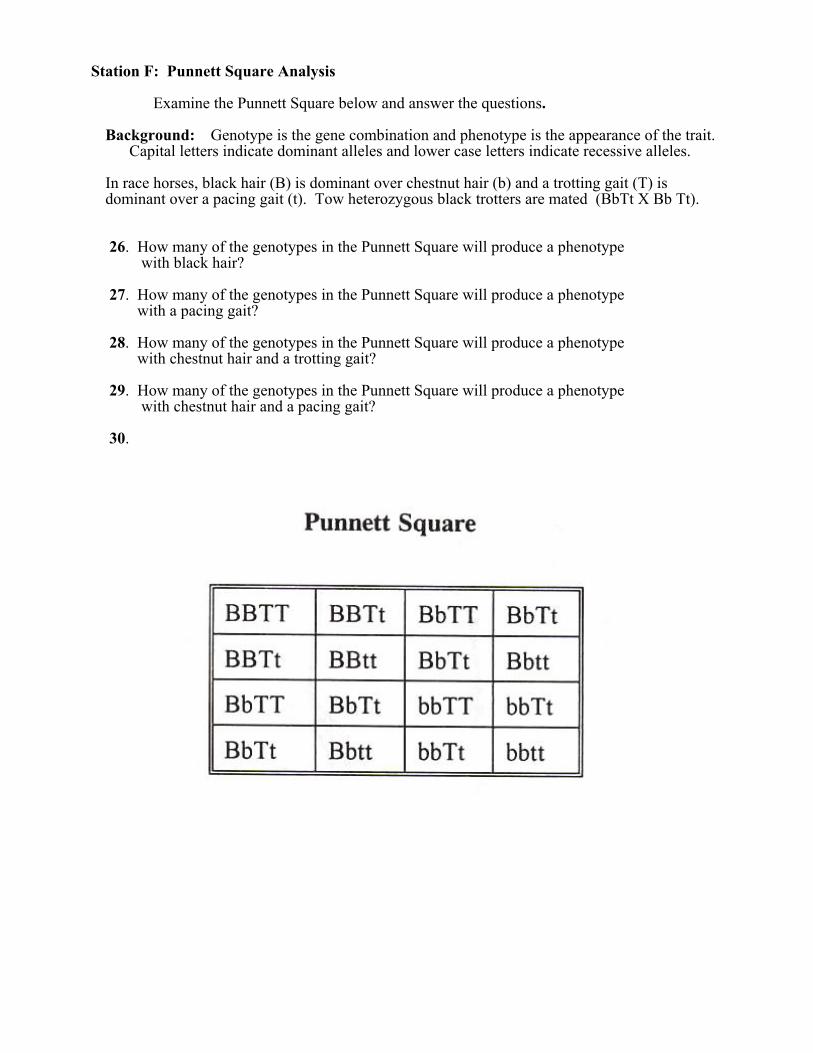
Station F: Punnett Square Analysis
Background: Genotype is the gene combination and phenotype is the appearance of the trait. Capital letters indicate dominant alleles and lower case letters indicate recessive alleles.
air (b) and a trotting gait (T) is dominant over a pacing gait (t). Tow heterozygous black trotters are mated (BbTt X Bb Tt).
26. How many of the genotypes in the Punnett Square will produce a phenotype
enotype
roduce a phenotype with chestnut hair and a trotting gait?
29. How many of the genotypes in the Punnett Square will produce a phenotype with chestnut hair and a pacing gait? 30.
Examine the Punnett Square below and answer the questions. In race horses, black hair (B) is dominant over chestnut h with black hair? 27. How many of the genotypes in the Punnett Square will produce a ph with a pacing gait? 28. How many of the genotypes in the Punnett Square will p
|

Station G: Evolution Use the diagrams of forearm (ulna & radius) structures to answer the following questions.
his
33. Which animal has the ulna long and straight with the radius small and straight? What is
34. These animals have similar anatomical structures modified for different structures. What
35. Birds and insects have wings for flight, but they are anatomically different. What term
RM OF THREE MAMMALS
dolphin horse bat
31. Which animal has the ulna and radius long, thin and light in weight? What is the function of this limb? 32. Which animal has both the ulna and radius short and thick? What is the function of t limb? the function the this limb? term describes this situation? describes this situation? DIAGRAMS OF FOREA
|

Station H: Experimental Design & Analysis
ontrol for all other jars in this experiment? What does it contain?
odine B. methyl red C. bromthymol blue D. glucose test-strip
39. Which organisms will use oxygen and produce carbon dioxide inside the jars?
inated, in which jar would the fish live the longest? Why?
LAB SETUP USING FISH AND ELODEA
e light..
Examine the experimental setup and answer the following questions. 36. Which jar is c 37. Which indicator can be used to show the carbon dioxide concentration of the water? A. i 38. Which tubes will have oxygen produced when the jar is placed in the light? 40. If the jars are sealed and illum Note: all jars contain pond water and are sealed as well as being placed in th
|

Station I: Inferences Inferences are logical conclusions based upon observations Visually examine, but do not touch the potted flowering geranium. Answer the following questions using this key.
B. Both are inferences.
41. The plant has leaves. The plant has roots.
42. The plant is absorbing water. Water is absorbed by the roots.
43. The plant has flowers. The stem is green.
44. Transpiration takes place in the leaves. The leaves have net veination.
Station J: Ecology -- Food Web
Examine the food web of a pond and answer the following questions.
46. What are the producers for this pond ecosystem? 47. Which organisms eat only the producers in this pond ecosystem? 48. What are the highest order consumers for this ecosystem? 49. How many food chains are present in this food web? 50. What are the decomposers listed in this food web?
A. Both are observations. C. The 1st is an observation; the second is an inference. D. The 1st is an inference; the second is an observation. 45. The soil is moist. The roots are filling the pot below the soil. Materials: a potted flowering geranium with roots below the soil.
|

ANSWER KEY: SAMPLE TOURNAMENT #3 SCHOOL NUMBER BIO-PROCESS LAB SCHOOL STATE STUDENT NAMES: (PLEASE PRINT) RAW SCORE 1. RANK 2. POINTS S T CLUDE APPROPRIATE UNITS WITH ALL ANSWERS!! BE URE O IN ! ST STATION F: 1. 5X 10X 40X 100X
ATION A: 26. 12 .
2. 50X to 1000X 27. 4 . 3. ~ 3.0 mm ~ 3000 mcm 28. 3 .
4. ~ 1.0 mm ~ 1000 mcm 29. 1 5. 12 cells 30. D. – 9:3:3:1
ST ION G: 6. electrical safety
ATION B: STAT 31. bat - flying .
7. poison safety 32. dolphin - swimming 8. B,C,E 33. horse - walking 9. A,D 34. homologous . 10. Tell instructor & obtain
35. analogous
approved first aide STATION C: STATION H:
ram
11. see diag 36. # 1 - pond water . 12. see diagram 37. C (bromthymol blue) .
tive 13. posi 38. # 4 and # 5 14. positive 39. fish and Elodea
grow - 15. roots won’t 40. #4- Elodea produces oxygen and food for the fish not enough gravity
ST STATION I:
ATION D:
16. F 41. C 17. B,C,D 42. B .
18. G,I,M 43. A 19. C,E,L,N 44. D 20. A,K,M(opt)
45. C .
STATION E: STATION J: 21. 124.0 mm 12.40 cm
|
46. pond plants & plankton 22. n = 10o C un = 1o C 47. snails & insects 23. 63.5o C 48. turtles & ducks 24. n = 5 mL un = 1 mL 49. 8 food chains . 25. 53.5 mL 50. none are listed on food web

B R E A
SAMPLE TOURNAMENT #4 IO B-P OC SS L
Examine the graph provided and answer the following questions
dividu l?
Station A: Experimental design
1. What is the independent variable for this study? 2. How many students in this class participated in this study?
3. What width range has the fewest in a
ys tubin conta s whic
(A) iodine (B) bromthymol blue (C) methyl red (D) Benedict's
f ts (D) tarch
on inside f the d alysis as a result of (A) active transport (B) phagocytosis (C) diffusion
(D) pinocytosis Materials needed: a starch solution placed in dialysis tubing and suspended in an iodine solution.
Station B: Using indicators.
l 4. The solution outside of the dia is g in h indicator? 5. Based upon the results of the indicator, the solution inside the dialysis tubing contains
) (A) sucrose (B) protein (C a s 6. The indicator reached the soluti o i tubing
|
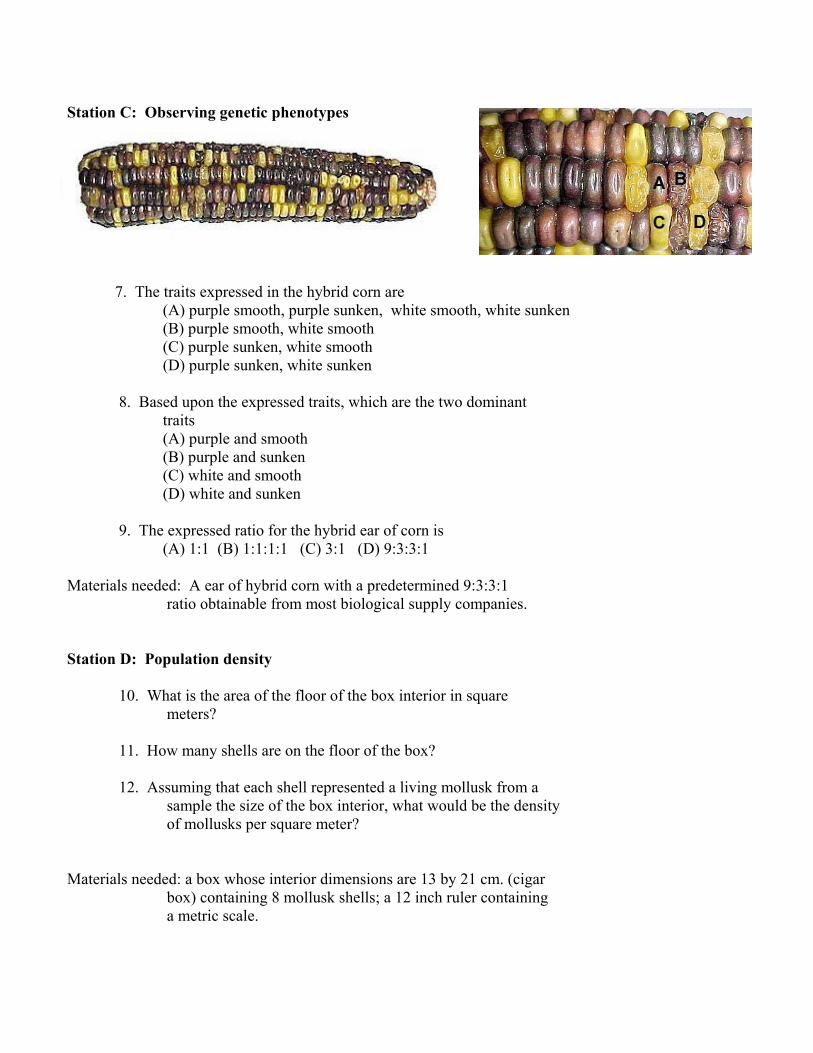
tation C: Observing genetic phenotypes
(A) purple smooth, purple sunken, white smooth, white sunken (B) purple smooth, white smooth (C) purple sunken, white smooth (D) purple sunken, white sunken
8. Based upon the expressed traits, which are the two dominant traits (A) purple and smooth (B) purple and sunken (C) white and smooth (D) white and sunken
9. The expressed ratio for the hybrid ear of corn is (A) 1:1 (B) 1:1:1:1 (C) 3:1 (D) 9:3:3:1
aterials needed: A ear of hybrid corn with a predetermined 9:3:3:1 ratio obtainable from most biological supply companies.
tation D: Population density
10. What is the area of the floor of the box interior in square
12. Assuming that each shell represented a living mollusk from a ity
ng 8 mollusk shells; a 12 inch ruler containing
S
7. The traits expressed in the hybrid corn are M S meters? 11. How many shells are on the floor of the box? sample the size of the box interior, what would be the dens of mollusks per square meter? Materials needed: a box whose interior dimensions are 13 by 21 cm. (cigar box) containi a metric scale.
|

Station E: Observing characteristics
White Pine Scotch pine 13. Based upon your observations, the pine or pines which have Red Pine two needles per cluster are (A) white pine (B) scotch and red pines (C) white pine (D) scotch pine (E) red and white pines 14. Based upon your observations, the pine or pines which have long (3 - 6 inches) needles are (A) white pine (B) red pine (C) scotch pine (D) red and white pines (E) white and scotch pines 15. An appropriate dichotomous key for identifying these pines would be (A) 1. 2 needles per cluster -------------2 1. 5 needles per cluster ----- red pine 2. needles long -------------white pine 2. needles short -----------scotch pine (B) 1. 2 needles per cluster -------------2 1. 5 needles per cluster ----white pine 2. needles short --------------red pine 2. needles long ------------scotch pine (C) 1. 2 needles per cluster -------------2 1. 5 needles per cluster ----white pine 2. needles short -----------scotch pine 2. needles long ---------------red pine (D) 1. 2 needles per cluster -------------2 1. 5 needles per cluster ---scotch pine 2. needles short ------------white pine 2. needles long ---------------red pine
| |
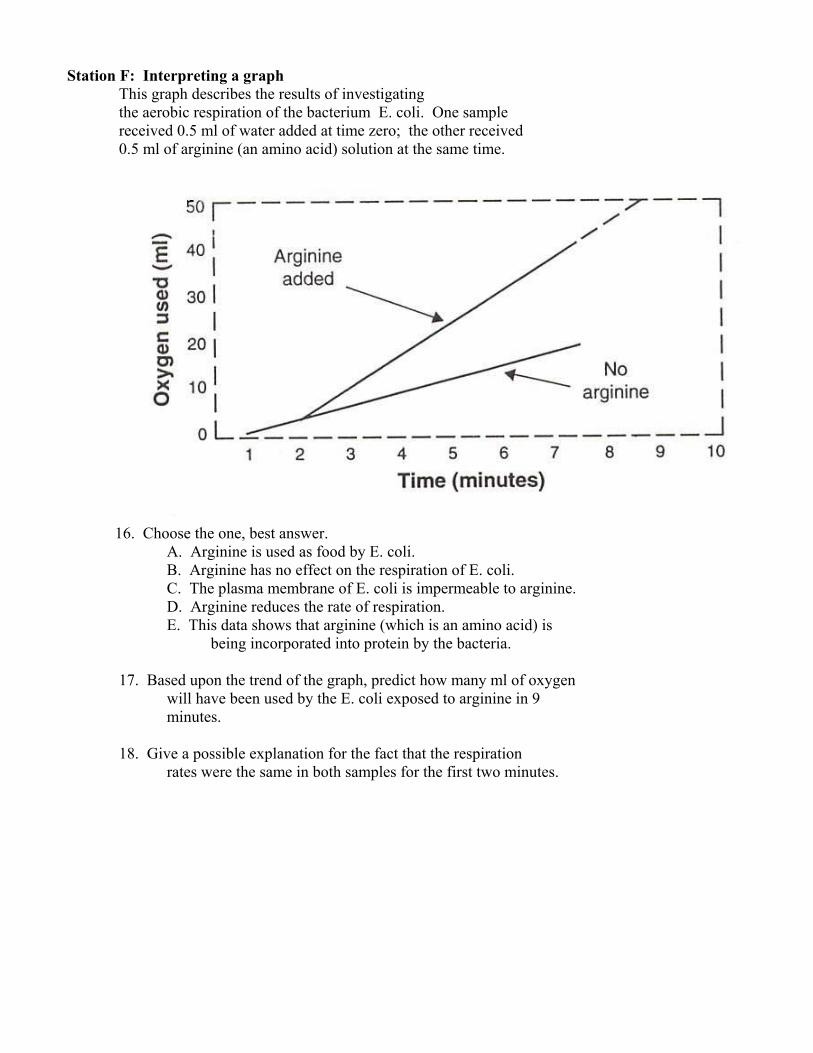
Station F: Interpreting a graph
This graph describes the results of investigating m E. coli. One sample
received 0.5 ml of water added at time zero; the other received 0.5 ml of arginine (an amino acid) solution at the same time.
B. Arginine has no effect on the respiration of E. coli. arginine.
E. This data shows that arginine (which is an amino acid) is being incorporated into protein by the bacteria.
17. Based upon the trend of the graph, predict how many ml of oxygen in 9
e respiration rates were the same in both samples for the first two minutes.
the aerobic respiration of the bacteriu
16. Choose the one, best answer. A. Arginine is used as food by E. coli. C. The plasma membrane of E. coli is impermeable to D. Arginine reduces the rate of respiration. will have been used by the E. coli exposed to arginine minutes. 18. Give a possible explanation for the fact that th
|

Station G: Analysis of data
ingle serving of this food in to the nearest 0.1 gram?
20. How many calories are in a single serving of this food?
bohydrate?
22. What is the most specific increment available with this balance?
23. W at is s it is equipped with the auxilliary weights) in grams
19. What is the net weight of a s
21. What percent of a single serving is car
Station H: Using a balance h the maximum capacity of this balance (a ?
24. U e the ct X in grams s balance to determine the weight of obje .
Mate
rials needed: a triple beam pan balance, a 500g and a 1000g auxiliary weight,
an ob ect we d to weigh 736.4 g j ighing over 610 grams and a bottle fille
|
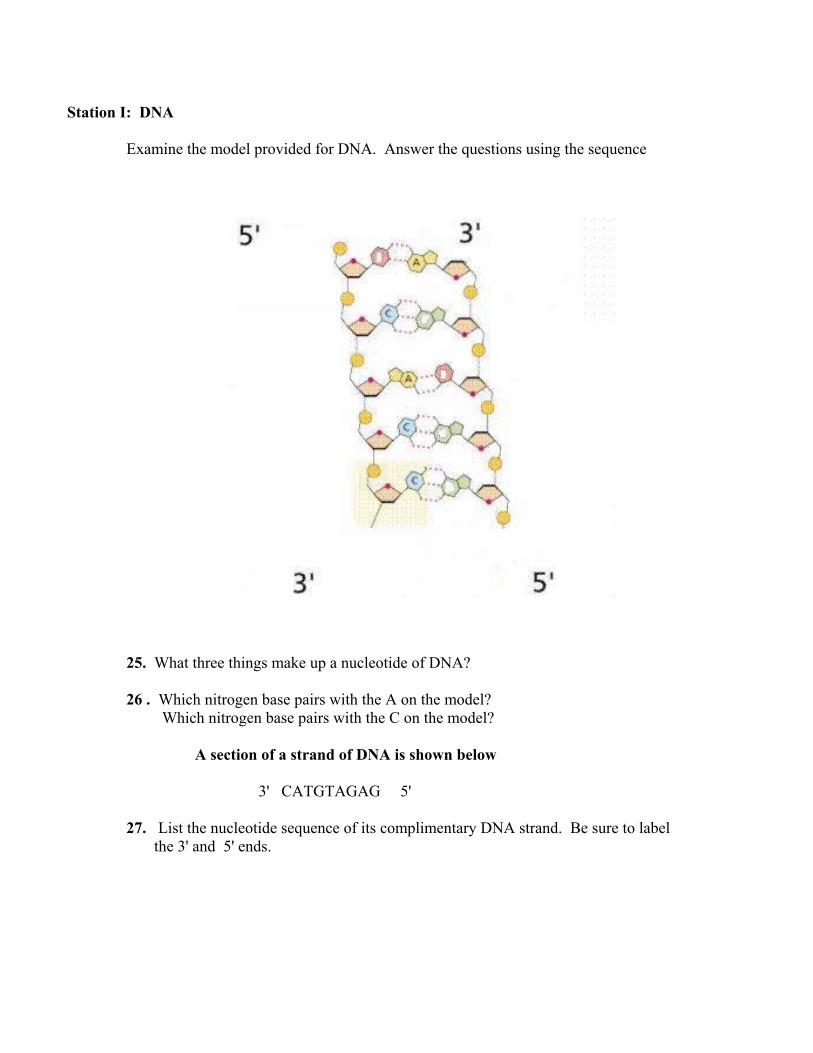
Station I: DNA Examine the model provided for DNA. Answer the question s using the sequence
25. What three things make up a nucleotide of DNA?
26 . Wase pairs with the C on the model?
3' CATGTAGAG 5' 27. List the nucleotide sequence of its complimentary DNA strand. Be sure to label the 3' and 5' ends.
hich nitrogen base pairs with the A on the model? Which nitrogen b A section of a strand of DNA is shown below
|

Station J: Using a microscope
(10X) power field.
28. What is the diameter of the low power field in micrometers
Using the transparent ruler, measure the diameter of the low
? 29. If a slide showing evenly distributed red blood cells is placed under high power of this microscope and you see 20 cells, how many might you expect to see under it's low power? (A) 20 (B) 90 (C) 300 (D) 600 (20 cells X 16 (area) = 320 cells.)
30. A student observes a specimen under high power of this microscope and then switches back to low power. How will the image appear under low power as compared to high power?
n a darker field of view n a brighter field of view
(A) smaller and i
(B) smaller and i (C) larger and in a darker field of view
(D) larger and in a brighter field of view
with a 10X ocular and objectives of 10X and 40X, a tranMaterials needed: A microscopemillimeter rule
sparent r.
|

|
BIO-PROCESS LAB
MPLE TOURNAMENT # 4 – ANSWER KEY
31 st
A. io e D. st h
. C. diffusion tation C . A. purple smooth, purple sunken, white smooth, white sunken . A. purple and smooth (9)
9. D. 9:3:3:1 tation D 0. .13m X .21m = .027 m2
1. 12 shells 2. 12 shells/.027 meters = 444 shells / m 2
tation E 3. B. scotch and red pines 4. D. red and white pines 5. Key C tation F 6. A. Arginine is used as food by E. coli. Respiration will increase. 7. 50 ml 8. It takes a couple of minutes for arginine to be incorporated into the E. coli and begin to use it for nergy tation G 9. Listed on the label = 165 grams 0. 70 grams (on the label) 1. g carbohydrate/ g per serving X 100 = % of a single serving that is carbohydrate. 15g/165g X 100 =
tion H .1 g
. 736. g
Suga d xy , guanine or cytosine) Thym n u n
. 5’ G A AT C 3 ’
mea. C. 3
0. D. larger and in a brighter field
SA
tation A S 1. Hand spread
. udents – Add numbers of individuals on the graph 2 3. 14 – 15 cm and 22 – 24 cm
tation B S 4. din5. arc 6S 7 8
S111S111S111eS1229%
ta S22. 23. 610 g + 500g + 1000 g = 2110 g 4 4 2
Station I ribose), phosphate, nitrogen base (adenine, thymine25. r ( eo
. i G26 e, a ine 7 T C TC2
Station J . rin micrometers = 1500 micrometers 28 su g = 1.5 mm converted to
9 0023