23689262 bio analysis and bio sensors for bio process monitoring 66
TRANSCRIPT

8/8/2019 23689262 Bio Analysis and Bio Sensors for Bio Process Monitoring 66
http://slidepdf.com/reader/full/23689262-bio-analysis-and-bio-sensors-for-bio-process-monitoring-66 1/236

8/8/2019 23689262 Bio Analysis and Bio Sensors for Bio Process Monitoring 66
http://slidepdf.com/reader/full/23689262-bio-analysis-and-bio-sensors-for-bio-process-monitoring-66 2/236
This volume is dedicated to Dr. Armin Fiechter, Professor Emeritus of Bio-technology at the ETH Zürich and former managing editor of Advances inBiochemical Engineering/Biotechnology and Journal of Biotechnology andeditor and member of Advisory Boards of several international periodicals onthe occasion of his 75th birthday.
Armin Fiechter is one of the pioneers in biotechnology – recognized world-wide for his important contributions to various fields of biotechnology. Profes-sor Fiechter’s research covers a broad area. He carried out pioneering work inseveral fields. From the beginning,he stressed the necessity of interdisciplinary and international cooperation. He especially promoted cooperation betweenengineering and biological research groups and helped to overcome the hurdlesand borders between these groups. His active role as a teacher of young
scientists led to the well known “Fiechter School”. Some well-known researchersin industry and science come from his laboratory. His more than 500 publica-tions document his research activities in different areas of biotechnology.
The quantitative evaluation of biological regulation was especially difficult,because reproducibility of the measurement of the dynamical processes wasunsatisfactory in the 1960s. One of the first long-term continuous cultivation of baker’s yeast in a chemostat system in combination with aseptic operation anduse of pH- redox- and oxygen-electrodes was realized by his group.The sterility was obtained by O-ring sealing. The sterilizable pH-, redox- and oxygen elec-trodes were developed in the industry with his co-operation. The sealing of the
stirrer shaft with a sliding sleeve and the use a marine propeller in combinationwith a draft tube (compact loop reactor, COLOR) for maintaining ideal mixingand for better mechanical foam control was also developed in cooperation withhis group.One of the key issue was the better process control by means of in situmonitored pH- and redox-values and dissolved oxygen concentration in the cul-tivation medium under aseptic operation.Various instruments (FIA, HPLC, GC,MS) were adapted for on-line monitoring of the concentrations of key compo-nents and computer programs were developed for automatic data evaluationand control. In this compact loop reactor and by means of advanced measuring
and control systems highly reproducible measurements became possible.Professor Fiechter succeeded to show using the improved chemostat tech-nique that glucose and oxygen influence various yeast stains differently. Besidethe catabolite repression (glucose effect) a second regulation type exists whichis controlled by the dynamic substrate flux (glucose).This causes different types
Laudatio

8/8/2019 23689262 Bio Analysis and Bio Sensors for Bio Process Monitoring 66
http://slidepdf.com/reader/full/23689262-bio-analysis-and-bio-sensors-for-bio-process-monitoring-66 3/236
of physiological phenomena such as diauxie, secondary monoauxie or atypicalchanges in growth and ethanol production continuous cultures.Sonnleitner andKaeppeli in his group developed an overflow model to explain these pheno-mena.Overflow reaction is common not only in yeast,but in bacteria as well. In
addition, they investigated the cell cycle by means of the analysis of stable syn-chronous growth, which was maintained in the high performance chemostatsystem. It was possible to recognize the trigger-function of trehalose for theonset of budding and the testing of the secretion and reuse of metabolitesduring the budding.
Investigations of the processes with different strains and reactor types underclose control are necessary for the transfer of biological processes from alaboratory to an industrial scale (scale up). Most of the early biochemicalengineering research was restricted to the investigation of oxygen transfer andcarried out with model media without micro-organisms. Systematic pilot plant
investigations were performed with various micro-organisms and differenttypes of reactors up to 3000 l volume in Hönggerberg by the Fiechter researchgroup. The reactor performances were compared and optimal processoperations were evaluated. The high process performance of the compact loopreactor was proved.
In addition to this technical oriented development, a broad field of appliedbiological research was at the center of interest in Fiechter’s laboratory. Thedevelopment of bioreactors, bioprocess monitoring and control served as ameans of obtaining more information on the biology of microorganisms and
improving the process performance.The investigation of the physiology of baker’s yeast was a central issue in thislaboratory. Evaluation of the details of the cell cycle and the importance of theoverflow phenomenon are discussed above. However, other microorganisms,such as the strictly respiratory yeast, Trichosporon cutaneum, and bacteria, suchas Escherichia coli, were investigated and applied for reactor characterization aswell. Zymomonas mobilis surpasses baker’s yeast with regard to alcohol pro-duction by a factor of five. In the high performance reactor under aseptic con-ditions extremely high ethanol productivities (250 ml l–1 h–1) were obtained inFiechter’s laboratory.
As early as 1983, a cell culture group was established and in the following10 years serum- and protein-free cultivation media were developed by means of a systematic analysis of key C-sources, intermediate and final metabolites andtheir influence on the growth and product formation. Lactate formation wasidentified as an overflow phenomenon caused by a respiratory bottleneck,incomplete medium composition, glucose excess, and stress factors. In con-tinuous cultivation of CHO cells with cell recycling generation times of 12 hwere obtained. By means of a Process Identification and Management System(PIMS), which was developed by his group, automatic on-line analysis and con-
trol of animal tissue cultivation became possible. In cooperation with Weiss-mann, recombinant Interferon was produced by Escherichia coli in a 3000 lreactor for clinical investigations in 1980.
Of his many research activities only few have been mentioned: In the frameof the SCP project, Cytochrome P-450 studies were carried out in connection
X Laudatio

8/8/2019 23689262 Bio Analysis and Bio Sensors for Bio Process Monitoring 66
http://slidepdf.com/reader/full/23689262-bio-analysis-and-bio-sensors-for-bio-process-monitoring-66 4/236
with the investigation of hydrocarbon metabolisms of yeasts. Enzymes fromthermophilic bacteria (Bac. stearothermophilus) were identified and isolated. Inconnection with biodegradation of lignin, new enzymes were identified andisolated. In the framework of the microbial-enhanced oil recovery project
Rhamnolipid biotensides were produced by genetically modified Pseudomonasaeruginosa. A process for the production of Lipoteichonacid (LTA) wasdeveloped and the anticarcinogenic compound was produced in a 3000 l reactor.Outside of industry, no other academic research group gained so many im-portant results on the pilot plant scale. These and many other results help us intransferring biotechnological processes from the laboratory to the industrialscale.
Because of his broad spectrum of activities and successful research he wasinvited into several countries and where he acted as visiting professor. Hebecame a member of the Supervisory Board of GBF (Central Biotechnology
Research Laboratory of Germany), Braunschweig, a member of the Board andInterim Director of the Institute of Surface- and Biotechnology of the Fraun-hofer-Society, Stuttgart, a member of the Swiss Academy of EngineeringSciences, a founding member of the European Federation of Biotechnology, amember of the IUPAC Commission on Microbiology, an honorary member of DECHEMA, president of the Swiss Microbial Society, etc.
We, his colleagues and former students thank him for his enthusiasm andcontinuous support in biotechnology also after his retirement. By dedicatingthis volume of Advances in Biochemical Engineering/Biotechnology to Professor
Fiechter, the authors of this volume and many other colleagues around the worldwant to honor his outstanding achievements in the broad field of biotechnology and wish him good health.
Hannover, July 1999 Karl Schügerl
Laudatio XI

8/8/2019 23689262 Bio Analysis and Bio Sensors for Bio Process Monitoring 66
http://slidepdf.com/reader/full/23689262-bio-analysis-and-bio-sensors-for-bio-process-monitoring-66 5/236
Preface
This special volume on “bioanalysis and biosensors for bioprocess monitoring”has a twofold target.
Firstly, it is dedicated to the 75th birthday of Armin Fiechter, who was a majordriving force among the pioneers to the progress of biochemical engineering.Not only the aseptic connection technique with septa and needles still used untiltoday was established by him, but also the development of the first sterilizablepH-electrodes with W Ingold is also credited to him. He made in-vivo bio-analysis a topic of general interest, for instance by setting up the first chemostatin Switzerland. It was again Armin Fiechter who pushed the use of non-invasiveexhaust gas analysis in the late 1960s and promoted development and exploita-tion of in-situ sensors and on-line analytical instruments in bioprocessing,among other means, by founding a spin-off company. In his laudatio, Karl
Schügerl extends the list of his merits and achievements.On the other hand,this volume is the first product of a core group working inthe first Task Group “synopsis of conventional and non-conventional bioprocessmonitoring” of the first Section of the EFB, namely the Section on BiochemicalEngineering Science. All the various monitoring techniques are so determinantand central that the EFB decided to found the Working Party on Measurementand Control, as one of the last Working Parties, as late as 1988. The Section,however, was founded in 1996 in order to facilitate communication and co-operation among biochemical engineers and scientists so far organized, orshould I say split up, into various different Working Parties. It was strongly felt
that the business of measurement (modeling) and control could not be confinedto the respective Working Party, it was and is so important for all the colleaguesassociated with bioreactor performance or down stream processing that abroadening of the horizon was actively sought.
Within the Section, several Task Groups are playing the role of workhorses.A synopsis of monitoring methods and devices was missing from the begin-
ning. The interest in obtaining up-to-date information and exchanging mutualexperience with older and up-to-date bioprocess monitoring tools becameobvious before,during and after several advanced courses organized and run by
the predecessors of the present Section. The conclusion soon became clear, butthe realization came later, and here is the first report from the Task Group!Certainly,these few contributions cover a great variety of achievements, bring
some success stories, discuss some potential pitfalls and discuss several prac-tical experiences.It is clear that this synopsis is non-exhaustive; it is also obvious

8/8/2019 23689262 Bio Analysis and Bio Sensors for Bio Process Monitoring 66
http://slidepdf.com/reader/full/23689262-bio-analysis-and-bio-sensors-for-bio-process-monitoring-66 6/236
that we have failed to include contributions specifically focused on down-stream processing and product qualification problems or targeted to bioreactorperformance characterization. However, it was important to show, with a firstreport, that there are people active in these fields and, hopefully, continuing to
be so and attracting more people to join them in this work.The contributions to this special volume were selected in order to show thepresent dynamics in the field of bioprocess monitoring. Some quite conventio-nal methods are addressed,other contributions focus on more fuzzy things suchas electronic noses or chemometric techniques. One contribution illustrates thepotential with a precise example of cephalosporin production. Three of themhave dared to “look” inside cells using different methods, one by the analysis of (microscopic) images, one by trying to estimate the physiological state, and thethird by analyzing the metabolic network. This gives a rough but good idea of how sophisticated analytical tools – (bio)chemical ones hand in hand with
mathematical ones, – give rise to a better understanding of living systems andbioprocesses.
Along with monitoring and estimation we also focus on modeling and con-trol of bioprocesses in the future. Perhaps, other Task Groups will evolve toaccomplish this.In the field of monitoring and estimation,we face the great chal-lenge of realizing an appropriate technology transfer of many scientific high-lights described in this volume into everyday industrial applications. A big gapin knowledge and experience still makes the decision between “must”and “niceto have” not easy. I hope that this special volume initiates many successful steps
towards this goal.
Winterthur, June 1999 B. Sonnleitner
XIV Preface

8/8/2019 23689262 Bio Analysis and Bio Sensors for Bio Process Monitoring 66
http://slidepdf.com/reader/full/23689262-bio-analysis-and-bio-sensors-for-bio-process-monitoring-66 7/236
Instrumentation of Biotechnological Processes
Bernhard Sonnleitner
University of Applied Sciences, Winterthur, SwitzerlandE-mail: [email protected]
Modern bioprocesses are monitored by on-line sensing devices mounted either in situ or ex-ternally. In addition to sensor probes, more and more analytical subsystems are being ex-ploited to monitor the state of a bioprocess on-line and in real time. Some of these subsystems
deliver signals that are useful for documentation only, other, less delayed systems generatesignals useful for closed loop process control. Various conventional and non-conventionalmonitoring instruments are evaluated; their usefulness, benefits and associated pitfalls arediscussed.
Keywords. Conventional and non-conventional sensors and analytical instruments, On-linebioprocess monitoring, Software sensors, Dynamics of measurements, Real time estimation,Interfacing aseptic sampling
1 Process Monitoring Requirements . . . . . . . . . . . . . . . . . . 3
1.1 Standard Techniques (State of Routine) . . . . . . . . . . . . . . . 3
1.2 Biomass . . . . . . . . . . . . . . . . . . . . . . . . . . . . . . . . . 41.3 Substrates . . . . . . . . . . . . . . . . . . . . . . . . . . . . . . . . 51.4 Products, Intermediates and Effectors . . . . . . . . . . . . . . . . 5
2 On-Line Sensing Devices . . . . . . . . . . . . . . . . . . . . . . . 6
2.1 In Situ Instruments . . . . . . . . . . . . . . . . . . . . . . . . . . 62.1.1 Temperature . . . . . . . . . . . . . . . . . . . . . . . . . . . . . . 62.1.2 pH . . . . . . . . . . . . . . . . . . . . . . . . . . . . . . . . . . . . 72.1.3 Pressure . . . . . . . . . . . . . . . . . . . . . . . . . . . . . . . . . 8
2.1.4 Oxygen . . . . . . . . . . . . . . . . . . . . . . . . . . . . . . . . . 102.1.4.1 Oxygen Partial Pressure (pO2) . . . . . . . . . . . . . . . . . . . . 102.1.4.2 Oxygen in the Gas Phase . . . . . . . . . . . . . . . . . . . . . . . 112.1.5 Carbon Dioxide . . . . . . . . . . . . . . . . . . . . . . . . . . . . 122.1.5.1 Carbon Dioxide Partial Pressure (pCO2) . . . . . . . . . . . . . . . 122.1.5.2 Carbon Dioxide in the Gas Phase . . . . . . . . . . . . . . . . . . . 132.1.6 Culture Fluorescence . . . . . . . . . . . . . . . . . . . . . . . . . . 142.1.7 Redox Potential . . . . . . . . . . . . . . . . . . . . . . . . . . . . . 152.1.8 Biomass . . . . . . . . . . . . . . . . . . . . . . . . . . . . . . . . . 16
2.1.8.1 Comparability of Sensors . . . . . . . . . . . . . . . . . . . . . . . 172.1.8.2 Optical Density . . . . . . . . . . . . . . . . . . . . . . . . . . . . . 172.1.8.3 Interferences . . . . . . . . . . . . . . . . . . . . . . . . . . . . . . 182.1.8.4 Electrical Properties . . . . . . . . . . . . . . . . . . . . . . . . . . 212.1.8.5 Thermodynamics . . . . . . . . . . . . . . . . . . . . . . . . . . . 21
Advances in Biochemical Engineering/Biotechnology,Vol. 66Managing Editor: Th. Scheper© Springer-Verlag Berlin Heidelberg 1999

8/8/2019 23689262 Bio Analysis and Bio Sensors for Bio Process Monitoring 66
http://slidepdf.com/reader/full/23689262-bio-analysis-and-bio-sensors-for-bio-process-monitoring-66 8/236
2.2 Ex Situ, i.e. in a Bypass or at the Exit Line . . . . . . . . . . . . . . 232.2.1 Sampling . . . . . . . . . . . . . . . . . . . . . . . . . . . . . . . . 232.2.1.1 Sampling of Culture Fluid Containing Cells . . . . . . . . . . . . . 242.2.1.2 Sampling of Culture Supernatant Without Cells . . . . . . . . . . 25
2.2.2 Interfaces . . . . . . . . . . . . . . . . . . . . . . . . . . . . . . . . 252.2.3 Flow Injection Analysis (FIA) . . . . . . . . . . . . . . . . . . . . . 252.2.4 Chromatography such as GC, HPLC . . . . . . . . . . . . . . . . . 282.2.5 Mass Spectrometry (MS) . . . . . . . . . . . . . . . . . . . . . . . 292.2.6 Biosensors . . . . . . . . . . . . . . . . . . . . . . . . . . . . . . . 312.2.6.1 Electrochemical Biosensors . . . . . . . . . . . . . . . . . . . . . . 322.2.6.2 Fiber Optic Sensors . . . . . . . . . . . . . . . . . . . . . . . . . . 332.2.6.3 Calorimetric Sensors . . . . . . . . . . . . . . . . . . . . . . . . . . 332.2.6.4 Acoustic/Mechanical Sensors . . . . . . . . . . . . . . . . . . . . . 342.2.7 Biomass . . . . . . . . . . . . . . . . . . . . . . . . . . . . . . . . . 34
2.2.7.1 Dynamic Range – Dilution . . . . . . . . . . . . . . . . . . . . . . 342.2.7.2 Electrical Properties . . . . . . . . . . . . . . . . . . . . . . . . . . 352.2.7.3 Filtration Properties . . . . . . . . . . . . . . . . . . . . . . . . . . 352.3 Software Sensors . . . . . . . . . . . . . . . . . . . . . . . . . . . . 352.4 Validation . . . . . . . . . . . . . . . . . . . . . . . . . . . . . . . . 36
3 Off-Line Analyses . . . . . . . . . . . . . . . . . . . . . . . . . . . 38
3.1 Flow Cytometry . . . . . . . . . . . . . . . . . . . . . . . . . . . . 383.2 Nuclear Magnetic Resonance (NMR) Spectroscopy . . . . . . . . . 39
3.3 Field Flow Fractionation (FFF) . . . . . . . . . . . . . . . . . . . . 413.4 Biomass . . . . . . . . . . . . . . . . . . . . . . . . . . . . . . . . . 413.4.1 Cell Mass Concentration . . . . . . . . . . . . . . . . . . . . . . . . 433.4.2 Cell Number Concentration . . . . . . . . . . . . . . . . . . . . . . 433.4.3 Viability . . . . . . . . . . . . . . . . . . . . . . . . . . . . . . . . . 453.4.4 Cellular Components or Activities . . . . . . . . . . . . . . . . . . 453.5 Substrates, Products, Intermediates and Effectors . . . . . . . . . 45
4 Real Time Considerations . . . . . . . . . . . . . . . . . . . . . . . 46
4.1 Dynamics of Biosystems . . . . . . . . . . . . . . . . . . . . . . . . 474.2 Continuous Signals and Frequency of Discrete Analyses . . . . . . 49
5 Relevant Pitfalls . . . . . . . . . . . . . . . . . . . . . . . . . . . . 49
5.1 a,b-d-Glucose Analyzed with Glucose Oxidase . . . . . . . . . . . 505.2 CO2 Equilibrium with HCO–
3 . . . . . . . . . . . . . . . . . . . . . 505.3 Some Remarks on Error Propagation . . . . . . . . . . . . . . . . 515.4 The Importance of Selecting Data To Keep . . . . . . . . . . . . . 52
6 Conclusions . . . . . . . . . . . . . . . . . . . . . . . . . . . . . . . 53
References . . . . . . . . . . . . . . . . . . . . . . . . . . . . . . . 54
2 B. Sonnleitner

8/8/2019 23689262 Bio Analysis and Bio Sensors for Bio Process Monitoring 66
http://slidepdf.com/reader/full/23689262-bio-analysis-and-bio-sensors-for-bio-process-monitoring-66 9/236
1Process Monitoring Requirements
Cellular activities such as those of enzymes, DNA, RNA and other components
are the primary variables which determine the performance of microbial orcellular cultures. The development of specific analytical tools for measurementof these activities in vivo is therefore of essential importance in order to achievedirect analytical access to these primary variables. The focus needs to be theminimization of relevant disturbances of cultures by measurements, i.e. rapid,non-invasive concepts should be promoted in bioprocess engineering science[110, 402]. What we can measure routinely today are the operating and secon-dary variables such as the concentrations of metabolites which fully depend onprimary and operating variables.
In comparison to other disciplines such as physics or engineering, sensors
useful for in situ monitoring of biotechnological processes are comparatively few; they measure physical and chemical variables rather than biological ones[248]. The reasons are manifold but, generally, biologically relevant variablesare much more difficult and complex than others (e.g. temperature, pressure).Another important reason derives from restricting requirements, namely
– sterilization procedures,– stability and reliability over extended periods,– application over an extended dynamic range,– no interference with the sterile barrier,
– insensitivity to protein adsorption and surface growth, and– resistance to degradation or enzymatic break down.
Finally, material problems arise from the constraints dictated by aseptic cul-ture conditions, biocompatibility and the necessity to measure over extendeddynamic ranges which often make the construction of sensors rather difficult.
Historically, the technical term “fermenters” is used for any reactor designused for microbial or cellular or enzymatic bioconversions and is basically synonymous with a vessel equipped with a stirring and aeration device. (Highperformance) bioreactors, however, are equipped with as large as possible a
number of sensors and connected hard- or software controllers. It is a necessary prerequisite to know the macro- and microenvironmental conditions exactly and to keep them in desired permissive (or even optimal) ranges for the bio-catalysts; in other words, the bioreaction in a bioreactor is under control [307,401].
1.1
Standard Techniques (State of Routine)
There are undoubtedly a few variables that are generally regarded as a must inbioprocess engineering. Among these are several physical, less chemical andeven less biological variables. Figure 1 gives a summary of what is nowadaysbelieved to be a minimum set of required measurements in a bioprocess. Sucha piece of equipment is typical for standard production of material, see, e.g.
Instrumentation of Biotechnological Processes 3

8/8/2019 23689262 Bio Analysis and Bio Sensors for Bio Process Monitoring 66
http://slidepdf.com/reader/full/23689262-bio-analysis-and-bio-sensors-for-bio-process-monitoring-66 10/236
[347]. However, the conclusion that these variables are sufficient to characterizethe microenvironment and activity of cells is, of course, questionable.
Besides some environmental and operational variables, the state variables of systems must be known, namely the amounts of active biocatalyst, of startingmaterials, of products, byproducts and metabolites.
1.2
Biomass
Biomass concentration is of paramount importance to scientists as well asengineers. It is a simple measure of the available quantity of a biocatalyst and isdefinitely an important key variable because it determines – simplifying – therates of growth and/or product formation. Almost all mathematical models
used to describe growth or product formation contain biomass as a most im-portant state variable. Many control strategies involve the objective of maxi-mizing biomass concentration; it remains to be decided whether this is alwayswise.
The measure of mass is important with respect to calculating mass balance.However, the elemental composition of biomass is normally ill defined.Anotherreason for determining biomass is the need for a reference when calculatingspecific rates (qi): qi = ri /x. An ideal measure for the biocatalysts in a bioreac-tion system of interest would be their activity, physiological state, morphology or other classification rather than just their mass. Unfortunately, these are evenmore difficult to quantify objectively and this is obviously why the biomass con-centration is still of the greatest interest.
4 B. Sonnleitner
Fig. 1. Common measurement and control of bioreactors as generally accepted as routineequipment

8/8/2019 23689262 Bio Analysis and Bio Sensors for Bio Process Monitoring 66
http://slidepdf.com/reader/full/23689262-bio-analysis-and-bio-sensors-for-bio-process-monitoring-66 11/236
1.3
Substrates
Cells can only grow or form products when sufficient starting material, i.e.
substrates, is available. The presence of substrates is the cause and growth orproduct formation is the effect. One can solve the inverse problem, namely con-clude that biological activities cease whenever an essential substrate is ex-hausted, and so omit the measurement of the substrate, provided the progressof growth (i.e. biomass) and/or product formation is known [215]. This is not aproper solution because there are many more plausible, and also probable,reasons for a decrease in bioactivities than just their limitation by depletion of a substrate. It is, for instance, also possible that too much of a substrate (or aproduct) inhibits or even intoxicates cellular activities. In such a situation, theabove conclusion that a substrate must be depleted when growth or product
formation ceases, no longer holds. One must, then, solve the direct problem,namely analyze the concentrations of relevant substrates, in order to pin-pointthe reasons for missing bioactivities. From an engineering point of view, thismeasure should be available instantaneously in order to be able to control theprocess (via the concentration of the inhibitory substrate). The technical termfor such an operating mode is nutristat: a well-controlled level of a relevantnutrient causes a steady state.
In environmental biotechnology, in particular, the objective of a bioprocesscan be to remove a “substrate”, e.g. a pollutant, as completely as possible ratherthan making a valuable product. In this case, the analytical verification of theintention is, of course, mandatory for validation.
The classical methods to determine substrate concentrations are off-linelaboratory methods. This implies that samples are taken aseptically, pre-treatedand transported to a suitable laboratory, where storage of these samples mightbe necessary before processing. The problems associated with these proceduresare discussed below. There is only one general exception to this, namely, thegaseous substrate oxygen, for which in situ electrodes are generally used.
1.4
Products, Intermediates and Effectors
The product is almost the only reason why a bioprocess is run. The main concernis in maximizing the profit which depends directly on the concentration and/orvolumetric productivity and/or of the purity of the product. It is therefore in-teresting to know the values which require measurement. The classical methodsto determine product concentrations are typically off-line laboratory methodsand the above statements for substrate determinations are valid here, too.
One may need to account for labile intermediates as found, for instance, in
penicillin production [196, 304]. Then, on-line analyses will best avoid artifactsdue to storage of materials even though the samples are cooled to 4 or 5°C.In summary, bioprocess science needs more quantitative measurements. It is
insufficient to know that something happens, we need to know why and how [260].
Instrumentation of Biotechnological Processes 5

8/8/2019 23689262 Bio Analysis and Bio Sensors for Bio Process Monitoring 66
http://slidepdf.com/reader/full/23689262-bio-analysis-and-bio-sensors-for-bio-process-monitoring-66 12/236
2On-Line Sensing Devices
On-line is synonymous for fully automatic. No manual interaction is necessary to obtain the desired results.However, this statement is not intended to promotea blind reliance on on-line measuring equipment. Depending on the site of in-stallation, one discriminates further between in situ, which means built-in, andex situ, which can mean in a bypass or in an exit line; in the latter case, thewithdrawn volumes are lost for the process (Fig. 2). Depending on the mode of operation of the sensing device, one can discriminate between continuous anddiscontinuous (or discrete) signal generation; in the latter case, a signal isrepeatedly generated periodically but, in between, there is no signal available.
2.1
In Situ Instruments
2.1.1
Temperature
Generally, the relationship between growth and temperature (approximated by the Arrhenius equation at suboptimal temperatures) is strain-dependent and
shows a distinct optimum. Hence, temperature should be maintained at thislevel by closed loop control. Industry seems to be satisfied with a control pre-cision of ± 0.4 K.
Temperature can be the variable most often determined in bioprocesses. Inthe range between 0 and 130 °C, this can be performed using thermoelements
6 B. Sonnleitner
Fig. 2. Terminology of types of signals and signal generation

8/8/2019 23689262 Bio Analysis and Bio Sensors for Bio Process Monitoring 66
http://slidepdf.com/reader/full/23689262-bio-analysis-and-bio-sensors-for-bio-process-monitoring-66 13/236
or by thermometers based on resistance changes, e.g. of a platinum wire (thenthis sensor is called a Pt-100 or Pt-1000 sensor; the resistance is either 100 or1000W at 0°C; Fig.3).This is, although not linear per se,one of the most reliablebut not necessarily most accurate measures in bioprocesses. The necessary calibration references (standards) are usually not available. Temperature ismost often controlled. With a sound control system it is possible to obtain aprecision of 1–10 mK in laboratory scale bioreactors [398].
2.1.2
pH
pH is one of the variables often controlled in bioprocesses operated in bioreac-tors because enzymatic activities and, therefore, metabolism is very sensitive topH changes. The acidification derives in most cases predominantly from theammonia uptake when ammonium ions are provided as the nitrogen source:
NH3 is consumed and the proton left over from the NH4
+
causes a drop in pH.In shake flask cultures, there is only one reasonable possibility to keep pHwithin a narrow range, namely the use of a very strong buffer, usually phosphatebuffer. This is the major reason why culture media often contain a tremendousexcess of phosphate. Insertion of multiple pH probes and titrant-addition tubesinto shakers has, however, been proposed and marketed [66].
The pH of process suspensions is measured potentiometrically using elec-trodes filled with liquid or gel electrolytes. A brief comparison of properties isgiven in the literature [123]. Glass electrodes develop a gel layer with mobilehydrogen ions when dipped into an aqueous solution. pH changes cause ion
diffusion processes generating an electrode potential. Lithium-rich glasses arewell suited for this purpose. The potential is measured in comparison to areference electrode which is usually a Ag/AgCl system since calomel would de-compose during sterilization (strictly speaking above 80°C). The electric circuitis closed via a diaphragm separating the reference electrolyte from the solution(Fig. 4).
Spoilage of the reference electrolyte is one of the major problems duringlong-term cultivations. Monzambe et al. [292] and Bühler (personal communi-cation) have reported discrepancies of one pH unit between in situ on-line and
off-line measurements which were caused by black clogging of the porousdiaphragm. Either acidification or pressurization of the electrolyte was suitableto restrain this.
Alternatives to the glass electrode are optical measurements of pH [4, 79] orexploitation of pH-sensitive field effect transistors, a so-called pH-FET [378]
Instrumentation of Biotechnological Processes 7
Fig. 3. Schematic design of temperature sensors. One or more thermoresistors are packedinto a stainless steel housing. 3- or 4-strand cabling is recommended

8/8/2019 23689262 Bio Analysis and Bio Sensors for Bio Process Monitoring 66
http://slidepdf.com/reader/full/23689262-bio-analysis-and-bio-sensors-for-bio-process-monitoring-66 14/236
(Fig. 5); however, these alternatives are not yet mature enough to be routinely
used. pH can be maintained within a few hundredths of a pH unit, providedmixing time is sufficiently small. Interestingly, many scientists “control” the pHby exclusively adding alkali. Addition of acid is often not foreseen. But if pH iswell controlled it is rewarding to monitor the pH controller output signal as wellbecause it reveals the activities of the culture with respect to production andconsumption of pH-active substances, i.e. (de)protonized molecules such asorganic acids or ammonium ion. This can be very valuable information whichusually remains unused.
In pH-controlled cultivations, the amount of titrant added to the culture canbe used to calculate the (specific) growth rate provided a useful model is avail-
able (a typical inverse problem). Bicarbonate affects the stoichiometry betweentitrant and biomass but does not prevent determination of growth rates [187].This approach works even though non-linear relationships hold between bio-mass and, for instance, lactic acid concentrations [3].
2.1.3
Pressure
The direct dependence of microorganisms on pressure changes is negligible
provided they do not exceed many bars [18, 186, 211, 474]. However, the partialpressure of dissolved gases and their solubility is indirectly affected and must,therefore, be at least considered if not controlled. A data sampling frequency inthe range of a few 100 ms is appropriate for direct digital pressure control(DDC) in laboratory scale bioreactors.
8 B. Sonnleitner
Fig. 4. Schematic design of a sterilizable pH electrode made of glass. The pH-sensitive glasswhich develops a gel layer with highest mobility for protons is actually only the tip (calotte)of the electrode. Electrolytes can contain gelling substances. Double (or so-called bridged)electrolyte electrodes are less sensitive to poisoning of the reference electrode (e.g. formationof Ag2S precipitates)

8/8/2019 23689262 Bio Analysis and Bio Sensors for Bio Process Monitoring 66
http://slidepdf.com/reader/full/23689262-bio-analysis-and-bio-sensors-for-bio-process-monitoring-66 15/236
Instrumentation of Biotechnological Processes 9
Fig. 5. Schematic design of a usual metal oxide field effect transistor (MOSFET; top) and of anion-sensitive field effect transistor (IsFET, bottom). The voltage applied to the gate – which isthe controlling electrode – determines the current that flows between source and drain. Thesubstrate is p-Si, source and drain are n-Si, the metal contacts are made from Al, and the in-sulators are Si3N4. Instead of a metallic gate, a pH-FET has a gate from nitrides or oxides, forinstance Ta2O5 . Depending on the pH of the measuring solution, the voltage at the interface
solution/gate-oxide changes and controls the source-drain current. Generally, in bio-FETs(which are also biosensors, of course) an additional layer of immobilized enzymes, wholecells, antibodies, antigens or receptor is mounted on top of the gate; the reaction must, of course, affect the pH by producing or consuming protons to be detectable with this trans-ducer. Note that the reference electrode is still necessary; this means that all problems as-sociated with the reference pertain also to such a semiconductor-based electrode
In addition, the reduction of infection risks by a controlled overpressure isadvantageous. During sterilization, pressure is of paramount interest for safety
reasons.A variety of sterilizable sensors exists, e.g. piezo-resistive, capacitive orresistance strain gauge sensors (Fig. 6), but not all of them are sufficiently tem-perature compensated.
Fig. 6. Schematic design of a pressure sensor.A flexible stainless steel membrane interfaces thepressure-sensitive elements (bridged piezo-resistors) from the measuring liquid. Some pro-ducts contain the amplifier electronics in the housing and are (somehow) temperature com-pensated. The shown 2-strand cabling mode resulting in a current signal is very convenient

8/8/2019 23689262 Bio Analysis and Bio Sensors for Bio Process Monitoring 66
http://slidepdf.com/reader/full/23689262-bio-analysis-and-bio-sensors-for-bio-process-monitoring-66 16/236
2.1.4
Oxygen
2.1.4.1
Oxygen Partial Pressure (pO 2 )
Oxygen solubility is low in aqueous solutions, namely 36 mg l–1 bar–1 at 30°C inpure water. Mass transfer is, therefore,determinant whether a culture suffers fromoxygen limitation or not. Several attempts to measure pO2 have been made in thepast,see,e.g. [46,106,163,315].Generally,oxygen is reduced by means of a cathodeoperated at a polarizing potential of 600–750 mV which is generated either exter-nally (polarographic method) or internally (galvanic method). A membrane sepa-rates the electrolyte from the medium to create some selectivity for diffusible sub-stances rather than nondiffusible materials (Fig. 7). The membrane is responsible
for the dynamic sensor characteristics which are diffusion controlled. Less sen-sitivity to membrane fouling and changes in flow conditions have been reportedfor transient measuring techniques, where the reducing voltage is applied in apulsed mode, a deviation from common continuous oxygen reduction [451].
A control loop for low pO2 (< 100 ppb) based on a fast but non-sterilizablesensor (Marubishi DY-2) was devised by Heinzle et al. [160].
10 B. Sonnleitner
Fig. 7. Schematic design of a Clark-type oxygen partial pressure (pO2) electrode. A (sand-wiched) membrane through which oxygen must diffuse separates the measuring solution fromthe electrolyte. Oxygen is reduced by electrons coming from the central platinum cathode
which is surrounded by a glass insulator. The anode is a massive silver ring usually mountedaround the insulator. This design, a so-called polarographic electrode,needs an external powersupply. For oxygen, the polarization voltage is in the order of 700 mV and the typical current foratmospheric pO2 is in the order of 10–7 A. A built-in thermistor allows automatic correction of the temperature-dependent drift of approximately 3% K–1 at around 30°C

8/8/2019 23689262 Bio Analysis and Bio Sensors for Bio Process Monitoring 66
http://slidepdf.com/reader/full/23689262-bio-analysis-and-bio-sensors-for-bio-process-monitoring-66 17/236
Merchuk et al. [276] investigated the dynamics of oxygen electrodes whenanalyzing mass transfer, and they reported whether and when an instantaneousresponse occurs. A semiempirical description of diffusion coefficients wasprovided by Ju and Ho [198]. Bacillus subtilis cultures change the product
concentration ratio between acetoin and butanediol rapidly in the range of pO2 ≈ 80–90 ppb [286]. This fact could be used for the characterization of the oxygen transport capabilities of bioreactors.
2.1.4.2
Oxygen in the Gas Phase
Measurements of oxygen in the gas phase are based on its paramagneticproperties. Any change in the mass concentration of O2 affects the density of amagnetic field and thus the forces on any (dia- or para)magnetic material in
this field. These forces on, for example, an electrobalance can be compensatedelectrically and the current can be converted into mass concentrations: furtherconversion into a molar ratio, e.g. % O2 , requires the knowledge of total pres-sure (Fig. 8).
Instrumentation of Biotechnological Processes 11
Fig. 8. Schematic design of a paramagnetic oxygen analyzer. A diamagnetic electrobalance isplaced in a permanent magnetic field. Whenever the paramagnetic oxygen enters this space,the field lines intensify and exert a force on the diamagnetic balance trying to move it out of the field. This force is compensated by powering the electric coils around the balance so muchthat it does not change its position in the field. The current is proportional to the mass of paramagnetic matter (i.e. oxygen) in the measuring cell, i.e. a concentration and not a(relative) fraction or content

8/8/2019 23689262 Bio Analysis and Bio Sensors for Bio Process Monitoring 66
http://slidepdf.com/reader/full/23689262-bio-analysis-and-bio-sensors-for-bio-process-monitoring-66 18/236
The effect of oxygen on metabolism is better known than the effects of othernutrients. For instance, Furukawa et al. [119] reported on a long-term adapta-tion of Saccharomyces cerevisiae to low oxygen levels and Pih et al. [325] ob-served a clear relationship between pO2 and catabolic repression, catabolic
inhibition, and inducer repression for b-galactosidase during growth of Escherichia coli. Wilson [459] based on-line biomass estimation on dynamicoxygen balancing.
Analysis of O2 as well as CO2 in exhaust gas is becoming generally acceptedand is likely to be applied as a standard measuring technique in bioprocessing.It is possible to multiplex the exhaust gas lines from several reactors in order toreduce costs. However, it should be taken into account that the time delay of measurements with classical instruments is in the order of several minutes,depending on the efforts for gas transport (active, passive) and sample pre-treatment (drying, filtering of the gas aliquot).
2.1.5
Carbon Dioxide
2.1.5.1
Carbon Dioxide Partial Pressure (pCO 2 )
CO2 affects microbial growth in various ways according to its appearance incatabolism as well as in anabolism. Morphological changes (e.g. [97]) and
variations in growth and metabolic rates [195, 310] in response to pCO2 have
12 B. Sonnleitner
Fig. 9. Schematic design of a carbon dioxide partial pressure (pCO2 ) electrode. CO2 diffusesthrough the membrane into or out of the electrolyte where it equilibrates with HCO3
– thusgenerating or consuming protons. The respective pH change of the electrolyte is sensed witha pH electrode and is logarithmically proportional to the pCO2 in the measuring solution.Since the electrolyte may become exhausted, one can replace it through in/out lines. Thesecan also be used to re-calibrate the pH electrode. Therefore, the electrode is retractable by means of a mechanical positioner

8/8/2019 23689262 Bio Analysis and Bio Sensors for Bio Process Monitoring 66
http://slidepdf.com/reader/full/23689262-bio-analysis-and-bio-sensors-for-bio-process-monitoring-66 19/236
been demonstrated. pCO2 can be measured indirectly: the pH value of a bi-carbonate buffer, separated from the medium by a gas-permeable membrane,drops whenever CO2 diffuses into this compartment and vice versa (Fig. 9); pHdepends on the logarithm of pCO2 [334]. Either a glass electrode or optical
principles [439] can be used for pH determination.The response of the pCO2 sensor is not exclusively CO2 dependent [91].Yegneswaran et al. [477] modeled the effect of changes in physical conditions onthe pCO2 signal. A step up in external pH resulted in a pCO2 downward spikeand vice versa. Pressure shifts in the range of 1– 2 bar caused pCO2 fluctuationsto an extent of >10%. Mass transfer is assumed to control the dynamics of CO2
equilibration. The bicarbonate buffer solution must be replaced regularly due toits limited capacity. Otherwise, the equilibration will be prolonged and base linedrifts occur. This was one of the reasons why Mettler Toledo (formerly Ingold)took this electrode off the market.
2.1.5.2
Carbon Dioxide in the Gas Phase
CO2 in the gas phase can be determined by means of its significant infrared ab-sorbance (Fig. 10) at wave lengths (l) <15 mm, particularly at 4.3 mm [289], orby acoustic means. Integrated photoacoustic spectroscopy and magnetoacou-stic (PAS/MA) technology for combined CO2 and O2 analysis has rapid responsetime and a small sample volume is sufficient. The acoustic methods are ac-
curate, stable over long periods and very simple to use.
Instrumentation of Biotechnological Processes 13
Fig. 10. Schematic design of a CO2 analyzer based on absorption of infrared (IR) radiation.An IR generator illuminates both the measuring and the reference cuvette. The latter is usedto adapt the measuring range and is often filled with just a noble gas (zero). The remainingradiation then passes a filter cuvette which can be filled with interfering gas that absorbs allradiation energy at the respective wavelength in both light paths equally. A light chopper(electrically driven with a few 100 Hz) lets the light alternatively pass from the measuring andfrom the reference path. A thermoanemometric detector quantifies the arriving IR radiationwhich is inversely proportional to the CO2 present in the cuvettes

8/8/2019 23689262 Bio Analysis and Bio Sensors for Bio Process Monitoring 66
http://slidepdf.com/reader/full/23689262-bio-analysis-and-bio-sensors-for-bio-process-monitoring-66 20/236

8/8/2019 23689262 Bio Analysis and Bio Sensors for Bio Process Monitoring 66
http://slidepdf.com/reader/full/23689262-bio-analysis-and-bio-sensors-for-bio-process-monitoring-66 21/236
Most investigators have measured NAD(P)H-dependent culture fluorescencebut other fluorophores are also interesting. Humphrey [182] gave a (non-exhaustive) survey of the historical evolution of fluorescence measurements forbioprocess monitoring. All these data have to be interpreted carefully. Quan-
tification appears difficult even though attempts at a theoretical analysis of involved effects have been made [411, 453]. Calibrations are tricky since thequenching behavior of cell material and the chemical composition of themedium contribute substantially and time-variably to the measured signal[363]. Further, the production of interfering fluorophores must be considered[179, 281]. Turbidity of the culture suspension should be low and the bubble dis-tribution should remain constant [29].
NAD(P)H-dependent culture fluorescence has mainly been exploited formetabolic investigations, e.g. [199, 227, 339– 341, 410]. The signal is sensitive tovariables such as substrate concentration or oxygen supply. Thus, all attempts to
exploit this signal as a biomass sensor [478] have been limited to conditionswhere no metabolic alterations occur [257, 395, 396]. It is well known that amechanistic or causal-analytical interpretation of the signal trajectory insecondary metabolite cultivations can be very difficult [303].
The outstandingly rapid principle of fluorescence measurements served ex-cellently for the controlled suppression of ethanol formation during continuousbaker’s yeast production [280].
2.1.7
Redox Potential
Bioprocess media and culture liquids contain many different componentswhich can exist in a reduced and an oxidized form as redox couples. The result-ing redox potential, as measured by a redox electrode, is related to an “overall
Instrumentation of Biotechnological Processes 15
Fig. 11. Schematic design of a fluorescence sensor.A strong light source creates radiation withlow wavelengths. Optics like lenses and filters extract and focus the desired excitation lightwhich is sent through the window into the measuring solution. Only a small fraction of the
fluorescent light arrives at the window, passes this, and is collected by appropriate optics andfed to a sensitive detector (usually a photomultiplier).Variations in the light source intensity can be compensated by a comparative measurement. When optical fibers are used inside theinstrument, the dichroitic mirror shown is obsolete

8/8/2019 23689262 Bio Analysis and Bio Sensors for Bio Process Monitoring 66
http://slidepdf.com/reader/full/23689262-bio-analysis-and-bio-sensors-for-bio-process-monitoring-66 22/236
availability of electrons” rather than to a specific compound. The extracellularredox measurement is very instructive, specifically under microaerobic con-ditions where the pO2 sensor signal becomes inaccurate [460]. The signalgeneration is faster than that of pO2 because the diffusion step is omitted [111].
Redox potential is measured potentiometrically with electrodes made of noble metals (Pt,Au) (Fig. 12). The mechanical construction is similar to that of pH electrodes. Accordingly, the reference electrode must meet the same re-quirements. The use and control of redox potential has been reviewed by Kjaergaard [218]. Considerations of redox couples, e.g. in yeast metabolism[47], are often restricted to theoretical investigations because the measurementis too unspecific and experimental evidence for cause–effect chains cannot begiven. Reports on the successful application of redox sensors, e.g. [26, 191], areconfined to a detailed description of observed phenomena rather than theirinterpretation.
The application of a redox sensor in a control loop has been reported by Memmert and Wandrey [274] who controlled xylanase production of Bacillusamyloliquefaciens by defined oxygen limitation: redox electrodes refer es-sentially to dissolved oxygen concentration below 10 mmol l–1 O2 . This property was also promoted to determine the quality of anaerobic processes [403].
2.1.8
Biomass
Since an on-line generated signal for biomass concentration is decisive for con-trol purposes a series of sensors and methods that can be automated have ap-peared in recent decades. Many of them rely on optical measuring principles,others exploit filtration characteristics, density changes of the suspension as aconsequence of cells, or (di)electrical properties of suspended cells. Some of the
16 B. Sonnleitner
Fig. 12. Schematic design of a redox electrode. It strongly resembles the pH glass electrode.The active measuring element is a noble metal, usually constructed as a ring around the tipof the electrode

8/8/2019 23689262 Bio Analysis and Bio Sensors for Bio Process Monitoring 66
http://slidepdf.com/reader/full/23689262-bio-analysis-and-bio-sensors-for-bio-process-monitoring-66 23/236
proposed methods have been used off-line, not on-line, as a standard. However,most of the approaches that are discussed below can be adapted for on-line ap-plication, either in situ or, more generally, ex situ by using a small samplestream of culture which is (then named bypass [69]) or is not returned to the
reactor (wasted), see Sect. 2.2.
2.1.8.1
Comparability of Sensors
A direct comparison of some representative sensors to estimate biomass in bac-terial and yeast cultures was made by Nipkow et al. [309], by Fehrenbach et al.[107], by Konstantinov et al. [219] and, more recently, by Wu et al. [465]. Thesestudies are of importance because the sensors were mounted in situ and used inparallel. Most of the sensors measured the optical density (OD), one the auto-
fluorescence of the cultures (fluorosensor) and another was a capacitance sen-sor (ßugmeter).
2.1.8.2
Optical Density
Current commercially available optical density (OD) sensors are based on thedetermination of either transmission, reflection or scatter of light, or a com-bination thereof.The theoretical background as to why these OD measurements
reflect the biomass concentration are rather manifold and complicated, andwould constrain the application tremendously if not many simplifications couldbe reasonably applied [345, 468].A direct a priori calculation of dry weight con-centration from any OD measurement cannot be expected to be realistic, butthe systems can be calibrated from case to case. Ries [345] derived some tech-nically relevant proposals: the primary beam of the light source should be nar-rowly focused and be of high power (laser source) because of the low ratio of intensities of scatter to primary light and a high fraction of the scatter shouldbe in a forward direction. Theoretically, for bacteria not exceeding a typicallength of 3 mm, the visible wavelength should be chosen, for larger organisms
the infrared. Large plant cells can also be estimated with turbidimetric methods[428] or insect cell cultures [21]. Tunable sensors are currently not yet routinely available and the wavelength choice of the vendors seems to be a compromisewhich also takes into account the fact that many media absorb increasingly withdecreasing wavelength: green filters, IR diodes, laser diodes or lasers between780 and 900 nm in others (Fig. 13).
Fiber sensors with high quality spectrophotometers outside the reactor ina protected room are a valuable but probably expensive alternative [74].Inexpensive variants can be made by using stabilized light emitting diodes
(LEDs emitting at around 850 nm) or arrays thereof [154]; modulation with afew 100 Hz (“light chopping”) should be used in order to minimize influencesfrom ambient light [479].
Instrumentation of Biotechnological Processes 17

8/8/2019 23689262 Bio Analysis and Bio Sensors for Bio Process Monitoring 66
http://slidepdf.com/reader/full/23689262-bio-analysis-and-bio-sensors-for-bio-process-monitoring-66 24/236
2.1.8.3
Interferences
Interferences from gas bubbles or particulate matter other than cells (Hong etal. [175] and Desgranges et al. [86] even report on a spectrophotometric cellmass determination in semi-solid cultivations) are common to almost all sen-sors but different methods are available to circumvent and minimize such pro-blems.
The FundaLux system, for instance, aspirates a liquid aliquot with a Teflonpiston into an external glass cell, allows a (selectable) time (typically 2 min) to
degas, measures transmission in comparison to an air blank, and releases thealiquot back to the reactor; an interesting feature – specific to this instrument –is the repetitive cleaning of the optical window by the moving Teflon piston.Some problems with infections have been communicated with this device sincethe measuring cell is external to the bioreactor and the sensor is probably in-sufficiently sterilized in situ.
Geppert and Thielemann [125] and Geppert et al. [126] have used a similarmethod but a different instrument to measure a suspension aliquot outside thebioreactor and reported a fairly good linear correlation between OD and bio-mass concentration for some bacteria and yeasts.
A sensor based on the same principle of sample degassing in a void volumebut mounted completely inside the reactor (Foxboro/Cerex; Fig. 14) has beendescribed by Hopkins and Hatch [178]. The minimal time interval between in-dividual measurements is 30 s. Both 90° scatter and transmission measurementscan be made simultaneously. A linear correlation between OD and Saccharo-myces cerevisiae density from 0.1 to 150 g l–1 has been claimed for this in-strument [152].
Simple transmission measurements with inexpensive components weremade to estimate the local specific interfacial area of a suspended phase (i.e. of
gas bubbles) in a bioreactor [473].The LT 201 (ASR/Komatsugawa/Biolafitte) instrument (Fig. 15) attempts tokeep gas bubbles out of the optical path by mounting a cylindrical stainless steelscreen around this region and positioning the sensor at a certain angle into aless turbulent zone in the reactor. Hibino et al. [168] and Yamane et al. [471, 472]
18 B. Sonnleitner
Fig. 13. Schematic design of the Aquasant probe. This is a sensor for optical density measuring the reflected light. Precision optics focus and collect the incident and the reflectedlight. Internally, light is guided through optical fibers. Left : cross section; right : front view

8/8/2019 23689262 Bio Analysis and Bio Sensors for Bio Process Monitoring 66
http://slidepdf.com/reader/full/23689262-bio-analysis-and-bio-sensors-for-bio-process-monitoring-66 25/236
Instrumentation of Biotechnological Processes 19
Fig. 14. Schematic design of the Cerex probe. This is a sensor for optical density and mounted
vertically in situ. Suspension enters the side drain ports deliberately and can be trappedinside the sensor by powering the solenoid coils: the magnetic plunger closes the side ports.In the meantime, the trapped dispersion degasses and bubbles disappear through the uppervent hole. After some time, the optical density reading is “declared representative”. The nextcycle starts with opening the side drain ports
Fig. 15. Schematic design of the Komatsugawa probe.This is a sensor for measuring light trans-mission. It is powered with a laser that has enough energy to also measure highly dense cul-tures.Optical fibers send and collect light.Around the measuring zone, a stainless steel grid bas-ket is mounted. Its function is to let cells pass and, at the same time, exclude gas bubbles. This iswhy the mesh size of the grid must be selected according to the type of cells being measured

8/8/2019 23689262 Bio Analysis and Bio Sensors for Bio Process Monitoring 66
http://slidepdf.com/reader/full/23689262-bio-analysis-and-bio-sensors-for-bio-process-monitoring-66 26/236
reported good experience with this or similar instruments and found the signalso reliable that they exploited it for automation and control of fed-batch pro-cesses [202].
Other OD sensors are totally subject to the interference of bubbles; however,
filters allow the signal noise (created by bubbles) to be dampened more or lesseffectively. Iijima et al. [183] have described a sensor that measures both trans-mission (1 fiber) and 90° scatter (2 fibers) which may allow a compensationmathematically. The MEX-3 sensor (BTG, Bonnier Technology Group; Fig. 16)compensates internally for errors due to deposition on the optical windows,temperature or aging of optical components; this is made possible by evaluatingquotients of intensities from four different light beams (straight and crossbeams from two emitters to two detectors; multiplexed). The Monitek sensorhas a special optical construction (prior to the receiver; so-called spatialfiltering system) to eliminate scattered light not originating from particles or
bubbles in the light path. The volume of particles in the medium is determinedby calculating the ratio of forward scattered to transmitted light. Other sensors– used in different industrial areas – are equipped with mechanical wipers.
20 B. Sonnleitner
Fig. 16. Schematic design of the MEX probe (top: top and front view). This is a sensormeasuring light transmission using four different light paths with two emitters and twodetectors. The emitters are alternately switched on and off. The electronics determine theratios of received intensities, Q1 and Q2 . The created signal is again a ratio of these valueswhich is virtually independent of fouling of the window surfaces. Alternative constructionsare shown below: a single-beam sensor and a variant allowing the comparison of the trans-mitted light with forward scattered light (Mettler sensor)

8/8/2019 23689262 Bio Analysis and Bio Sensors for Bio Process Monitoring 66
http://slidepdf.com/reader/full/23689262-bio-analysis-and-bio-sensors-for-bio-process-monitoring-66 27/236
Aquasant claims to have minimized interferences with depositions on theoptical window by a special design of the precision receiver optics of the AF 44 Ssensor (which can be confirmed by our own practical experiences).
In the various studies, the different sensors were found to be significantly dif-
ferent with respect to sensitivity, linearity and signal to noise ratio. None of thesensors lost sensitivity completely due to surface growth on the optical window.The signals never correlated perfectly linearly with biomass concentration.Only little disturbance was observed from changing environmental illumina-tion (artificial or sun light when used in glass reactors).
2.1.8.4
Electrical Properties
The measurement principle of the biomonitor (formerly called ßugmeter) relies
on the fact that the capacitance of a suspension at low radio frequencies is cor-related with the concentration of the suspended phase of fluid elements that areenclosed by a polarizable membrane, i.e. intact cells [11, 150, 213, 265, 266]. Thecapacitance range covered is from 0.1 to 200 pF, the radio frequency some 200 kHzto 10 MHz. A severe limit to this principle is the maximally acceptable conduc-tivity (of the liquid phase) of approximately 8 mS cm–1 in earlier versions whichhas been significantly improved (to the order of 24 mS cm–1) recently. This con-ductivity is,however,easily reached in the more concentrated media necessary forhigh cell density cultures. Noise is also created by gas bubbles.This could theore-
tically be reduced by using very rapid spike elimination algorithms. The methodof applying periodic cleaning pulses to the electrodes in order to remove (poten-tial) surface fouling (by attached organisms) in situ superimposed significant spi-kes to the signals of high impedance sensors mounted in the same reactor (suchas pH or redox electrodes) thus corrupting the respective controllers. Not clean-ing the electrodes results in fouling within some days even in defined media.
2.1.8.5
Thermodynamics
An elegant, completely non-invasive method is to exploit the heat generatedduring growth and other metabolic activities of organisms which is alsoproportional to the amount of active cells in a reaction system [36]. Under well-defined conditions, calorimetry can be an excellent tool for the estimation of total (active) biomass [31, 32, 258, 448], even for such slow growing organismsas hybridoma cells or for anaerobic bacteria growing with an extremely low biomass yield [373, 416, 447]. The method is so inherently sensitive that cellcycle dependent events can also be analyzed [13].
Bioreactions are exothermic. The net heat released during growth represents
the sum of the many enzymatic reactions involved. Reasonably, this measuredepends on both the biomass concentration and the metabolic state of the cells.Its general use in biotechnology has been reviewed by von Stockar and Marison[415]. A theoretical thermodynamic derivation for aerobic growth gives aprediction for the heat yield coefficient YQ/O of 460 kJ (mol O2)–1 and it was ex-
Instrumentation of Biotechnological Processes 21

8/8/2019 23689262 Bio Analysis and Bio Sensors for Bio Process Monitoring 66
http://slidepdf.com/reader/full/23689262-bio-analysis-and-bio-sensors-for-bio-process-monitoring-66 28/236
perimentally confirmed to be an excellent estimate because the average valuefound in many different experiments was 440 ± 33 kJ (mol O2 )–1 [31].
Three different approaches are chiefly applied: micro-, flow and heat fluxcalorimetry. Heat flux calorimetry is certainly the best choice for bioprocess
monitoring (Fig. 17) [264]. In a dynamic calorimeter, the timely change of temperature is measured and various heat fluxes (e.g. heat dissipated by stirrer,or lost due to vaporization of water) need to be known in order to calculate theheat flux from the bioreaction:
dT K P 1 4 = qR + q A – qL – qG (1)
dt
where K P (J K–1) is the total heat capacity of the system, qR is the reaction-
derived heat, q A derives from agitation and qL and qG are losses via surfaces andvaporization of water due to aeration. The fractions q A , qL and qG must beelectrically calibrated prior to inoculation. Unfortunately, the losses are unlikely to be constant. In a heat flux calorimeter, one needs to determine the timely change of the temperature difference between reactor and jacket T R – T J (K);random heat losses can be neglected and the systematic contributions to heatgeneration q A or removal qG can be determined prior to inoculation. The globalheat transfer coefficient kw(W K–1 m–2) can be simply determined by electrical
22 B. Sonnleitner
Fig. 17. Schematic design of a heat flux calorimeter. Both the temperature in the reactor andin the circuit (or jacket) are measured as sensitively and reproducibly as possible. A well-tuned temperature controller keeps the reactor temperature constant by feeding the circuitwith warmer or colder water or oil. The circulating water or oil can be taken from either achilled and a heated reservoir or, as shown, be heated or cooled via external heat exchangers.Calibration is made possible via an electric heater of known power

8/8/2019 23689262 Bio Analysis and Bio Sensors for Bio Process Monitoring 66
http://slidepdf.com/reader/full/23689262-bio-analysis-and-bio-sensors-for-bio-process-monitoring-66 29/236
calibration and the heat exchange area A (m2) is usually constant; both para-meters can be lumped together (kw A):
q = kw A (T R –T J ) (2)
where q (W) is the heat exchanged. The temperature controller needs ap-propriate tuning; van Kleeff [447] has reported practical tips for tuning a very simple system.
In flow calorimeters, samples of a culture grown in a bioreactor are con-tinuously pumped through the measuring cell of a microcalorimeter. The sen-sitivity of the differential signal between the reaction vessel and the referencevessel is comparable to that obtained from microcalorimetry, e.g. [193]. From apractical point of view, they are quite flexible because they can be connected toany reactor but, due to transfer times in the minute(s) range, gas and substratelimitations must be considered.
Heat flux calorimeters are bioreactors equipped with special temperaturecontrol tools. They provide a sensitivity which is approximately two orders of magnitude better than that of microcalorimeters, e.g. [33, 258]. The evaluationand description of microbial heat release is based on a heat balance; heat yieldsand the heat of combustion of biological components are central parameters forquantification [70]. Measurements obtained so far have been used to investigategrowth, biomass yield, maintenance energy, the role of the reduction degree of substrates, oxygen uptake [414] and product formation [272].
Approaches for practical exploitation have been made. Fardeau et al. [105]
proposed integrated thermograms as a measure for biodegradability andLovrien et al. [255] used microcalorimetric analysis of Klebsiella sp. growth forindirect sugar determination. The exploitation of calorimetry for biomassestimation has been compared with other methods [36]. Although oftenproposed, there are only a few reports on the control of processes based oncalorimetric data, e.g. by Silman [387]. Metabolic uncoupling in Saccharomycescerevisiae under various C/N ratios have also been investigated [231].
Entropy is closely related to heat (enthalpy) and energy. If all the ATP avail-able from catabolic processes were used for anabolism (chemical synthesis), upto ten times more cellular material could be produced. First investigations of
this large outflow of entropy from growing cells have been made by Bormann[40]; however, classical thermodynamics are hardly applicable to complex,non-equilibrium metabolic systems and must be extended [458].
2.2
Ex Situ, i. e. in a Bypass or at the Exit Line
2.2.1
Sampling
Samples removed from the reactor in some way can be analyzed with devicesthat are not (yet) suitable or available to be mounted in situ, but this is areasonable way around the problem. Depending on the analyte of interest, i.e.whether it is soluble or (in) the dispersed phase, one needs to sample either the
Instrumentation of Biotechnological Processes 23
8/8/2019 23689262 Bio Analysis and Bio Sensors for Bio Process Monitoring 66
http://slidepdf.com/reader/full/23689262-bio-analysis-and-bio-sensors-for-bio-process-monitoring-66 30/236
entire culture liquid or just the supernatant. The latter can be acquired using,for example, a filter. In this case, the filter is usually also the sterile barrier.
2.2.1.1
Sampling of Culture Fluid Containing Cells
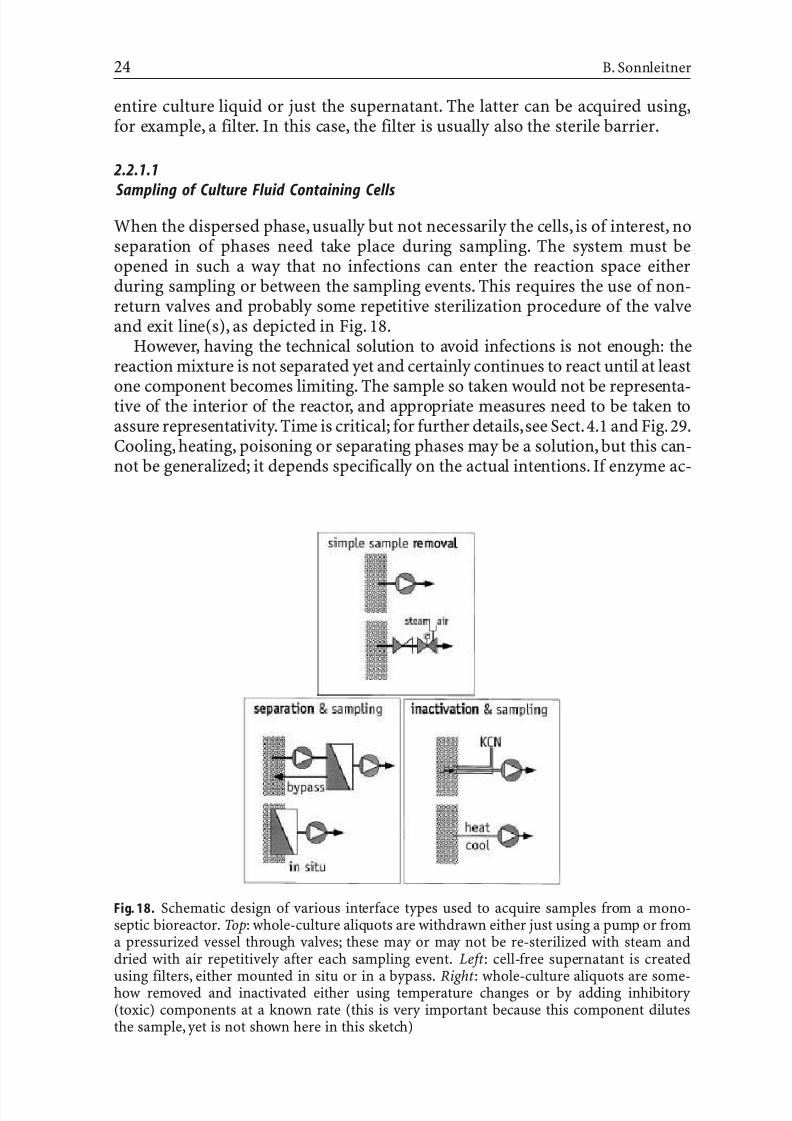
When the dispersed phase, usually but not necessarily the cells, is of interest, noseparation of phases need take place during sampling. The system must beopened in such a way that no infections can enter the reaction space eitherduring sampling or between the sampling events. This requires the use of non-return valves and probably some repetitive sterilization procedure of the valveand exit line(s), as depicted in Fig. 18.
However, having the technical solution to avoid infections is not enough: thereaction mixture is not separated yet and certainly continues to react until at least
one component becomes limiting. The sample so taken would not be representa-tive of the interior of the reactor, and appropriate measures need to be taken toassure representativity.Time is critical; for further details,see Sect.4.1 and Fig.29.Cooling, heating, poisoning or separating phases may be a solution, but this can-not be generalized; it depends specifically on the actual intentions. If enzyme ac-
24 B. Sonnleitner
Fig. 18. Schematic design of various interface types used to acquire samples from a mono-septic bioreactor. Top: whole-culture aliquots are withdrawn either just using a pump or froma pressurized vessel through valves; these may or may not be re-sterilized with steam anddried with air repetitively after each sampling event. Left : cell-free supernatant is createdusing filters, either mounted in situ or in a bypass. Right : whole-culture aliquots are some-how removed and inactivated either using temperature changes or by adding inhibitory (toxic) components at a known rate (this is very important because this component dilutesthe sample, yet is not shown here in this sketch)

8/8/2019 23689262 Bio Analysis and Bio Sensors for Bio Process Monitoring 66
http://slidepdf.com/reader/full/23689262-bio-analysis-and-bio-sensors-for-bio-process-monitoring-66 31/236
tivities are to be determined, heating may be the worst choice,if just biomass con-centration is to be determined, immediate filtering may be the best choice.
2.2.1.2
Sampling of Culture Supernatant Without Cells
Whenever the analyte of interest is soluble in the liquid phase or part of the gasphase, sample removal via a filtering device is the most reasonable solution.Filters mounted in situ are ideal provided they do not foul within an unreason-ably short period. If this is the case, a filter operating in bypass must be usedbecause this can be repeatedly exchanged with a freshly prepared one. In ourexperience, bypass filters should be operated with a high tangential flow, say ≥ 2 m s–1 of superficial liquid velocity. Then, a useful lifetime of a few weeks canbe achieved even in cultures of filamentous organisms.
Separation of phases by using flotation or gravitational (at 1 g) sedimenta-tion takes too much time to be useful and, furthermore, does not permit com-plete phase separation.
2.2.2
Interfaces
The interface between the reaction site, in the case of mono-cultures in bio-processing a monoseptic space,and the site of analysis is of decisive importance
for two reasons: (1) the monoseptic space must be protected from contamina-tion, and (2) the sample specimen must be “transported” to the analyticaldevice without significant change in composition; since transport always takessome finite time, one must – for the sake of representativity – assure that thereactions continuing during transport are negligible or, at least, well known.This goal can be achieved by various strategies with better or lesser effort/effectratio. Rapid sampling is, in any case, advantageous. A couple of methodsseparate catalysts from reactants and another approach is poisoning or in-activating the catalyst by either addition of a strongly inhibitory material (e.g.heparin or KCN, which both may well interfere with the analytical method) or
temperature variations such as heating or cooling [268]. These aspects are notrestricted to samples from monoseptic bioprocesses, they are equally importantfor environmental analyses [127].
Membranes do not only serve as the analytical interface. Schneider et al.[377] have demonstrated that hydrophobic membranes, for example, madefrom PTFE, mounted either in situ or in bypass, can also be used for prepara-tive removal of ammonium from an animal cell culture.
2.2.3
Flow Injection Analysis (FIA)
Ruzicka and Hansen [359] characterized flow injection analysis (FIA) as:“… in-formation gathering from a concentration gradient formed from an injected,well-defined zone of a fluid, dispersed into a continuous unsegmented stream
Instrumentation of Biotechnological Processes 25

8/8/2019 23689262 Bio Analysis and Bio Sensors for Bio Process Monitoring 66
http://slidepdf.com/reader/full/23689262-bio-analysis-and-bio-sensors-for-bio-process-monitoring-66 32/236

8/8/2019 23689262 Bio Analysis and Bio Sensors for Bio Process Monitoring 66
http://slidepdf.com/reader/full/23689262-bio-analysis-and-bio-sensors-for-bio-process-monitoring-66 33/236
sensors substantially even though improvements have been reported [94]. Nointerference with the sterile barrier is likely since the entire apparatus worksoutside the sterile space. Special emphasis must be given to the sampling deviceinterfacing the sterile barrier (see above).
FIA easily permits validation requirements to be met because alternativemeasuring principles can be run in parallel. This helps to exclude systematicerrors which might originate from the complex matrix. For instance, Carlsen etal. [54] reported an example in which two different FIA methods for penicillinV monitoring have been compared.
A comprehensive survey of various applications with bacteria, yeasts andfungi on a laboratory and pilot scale can be found in reports by Nielsen [302]or Decastro and Valcarcel [80]. FIA has been used for on-line determination of glucose, e.g. [122], or to estimate biomass directly [19, 305] or indirectly by means of an extended Kalman filter [441]. Schmitz et al. [376] even determined
chemical oxygen demand (COD) from waste water stream using FIA in therange of 30 to 23000 mg l–1 within only 3 to 7 min. Filippini et al. [113] com-pared FIA with an in situ enzyme electrode during continuous cultivation of Saccharomyces cerevisiae. FIA is also useful in environmental sciences such aswater monitoring [8, 464] and has become increasingly important in down-stream processing [59, 278]. FIA has been applied to detect microorganisms in-directly by measuring the concentration of a mediator which is reduced by theorganisms [89]. Amino acids, such as L-lysine, have been measured [53, 326]and even intracellular enzymes can be determined on-line [5,380].A separation
of peptides can be afforded by miniaturized capillary electrophoresis [99, 263].Rapid analyses of antibiotics have been realized by a combination of super-critical fluid extraction and FIA [44]. DNA and RNA have been quantified inextracts [49]. Metabolic studies of a lactic acid production based on glucose,lactose, galactose, lactate, and protein determinations after nutrient pulses havebeen reported by Nielsen et al. [305] and Shu et al. [385]. In addition, acetate hasrecently been determined on-line using an FIA technique [436]. An importantdevelopment is its combination with cytometry, see e.g. [237, 238, 360], or theestimation of nucleic acids [452].
Biosensors are being increasingly used as detectors in FIA systems [284, 285,
322, 379, 476]. The drawbacks of biosensors as direct in situ sensors, namely their low dynamic range, their lack of ability to survive sterilization, theirlimited lifetime, etc. are no longer valid ex situ because the analyzer interfacesthe biosensor which can be changed at any time and FIA can provide samplesin optimal dilution. The need for chemicals and reagents can be drastically reduced when employing biosensors, specifically when the entire system isminiaturized [48].
An outstanding property of FIA is its range of application. It can be viewedas a general solution-handling technique rather than a distinct sensor; this
causes high flexibility with respect to analytical methods. A high degree of automation is, however, necessary and desirable [171, 172]. FIA can be expectedto become one of the most powerful tools for quantitative bioprocess monito-ring in the near future provided that non-linear calibration models are alsoused and that data evaluation techniques improve [43, 114, 166, 185, 259]. Wu
Instrumentation of Biotechnological Processes 27

8/8/2019 23689262 Bio Analysis and Bio Sensors for Bio Process Monitoring 66
http://slidepdf.com/reader/full/23689262-bio-analysis-and-bio-sensors-for-bio-process-monitoring-66 34/236
and Bellgardt [466, 467] were able to detect faults in the analytical system auto-matically. The present tendency is towards using multi-channel FIA systemsthat work either in parallel or with sequential injection [20, 283, 446, 469],miniaturization of FIA devices [48,144,420,421],and automation [112,171,172,
321].Only recently, flow injection has been used as an interface to the first on-lineapplication of flow cytometry [480]. Gorlach et al. [137] used flow injection forhigh throughput mass spectrometric mapping.
Interestingly, FIA can also be operated without an injection and gives valu-able results. To this end we stained the DNA within yeast cells removed at aminute flux from a reactor and were able to quantify the amount of DNA on-line thus giving evidence for the cell-cycle dependence of oscillations [397].
2.2.4
Chromatography such as GC, HPLC
A review of chromatographic methods is beyond the scope of this contribution.Both liquid chromatography (LC) and gas chromatography (GC) have been ap-plied in numerous cases to off-line analyses of biotechnological samples but theon-line application has only recently been developed. The scope of chromato-graphic methods is the separation of the individual constituents of mixtures asthey pass through columns filled with suitable stationary phases (Fig. 20). The
28 B. Sonnleitner
Fig. 20. Schematic design of linking a chromatograph on-line to bioprocesses. In principle,
the design is almost identical to an FIA system.This is why FIA is often characterized as chro-matography without a column. However, degassing of the sample is essential, in particular,when no internal standard is added (as in this sketch). In addition, the technical designs of injection valves differ and the injector to a gas chromatograph is heated to 200 or 250 °Cwhich means it needs, therefore, a special construction

8/8/2019 23689262 Bio Analysis and Bio Sensors for Bio Process Monitoring 66
http://slidepdf.com/reader/full/23689262-bio-analysis-and-bio-sensors-for-bio-process-monitoring-66 35/236
retention in the column is determined by the interaction between the individualconstituents and the stationary phase. Miniaturized versions using micro-machined instruments [90] or array detectors [425] have recently been re-ported.
In the following, a non-exhaustive list of some examples is given to illustratethe versatility of these methods. Comberbach and Bu’lock [64] measuredethanol in the bioreactor head space every 6 min using an electro-pneumaticsampling system connected to a gas chromatograph. McLaughlin et al. [270]provided cell-free samples of a butanol/acetone bioreaction by means of a tan-gential flow ultrafiltration membrane; they determined the components also inthe head space using a gas chromatograph.Groboillot et al. [139] monitored thekinetics of acetaldehyde, ethanol, fuel alcohols and CO2 after gas chromato-graphic separation. DaPra et al. [75] used GC data to control the influx rate of highly polluted waste water to an anaerobic filter; HPLC is reported to compare
well with gas chromatographic results in anaerobic waste water treatment[482]. The first on-line capillary-GC monitoring of liquid cultivation sampleswas reported by Filippini et al. [111]; contrary to previous predictions, a capil-lary column survives many thousands of injections.
HPLC systems were helpful in monitoring cephalosporin production [174]and p-cresol degradation [392]. Other HPLC systems have been reported toserve for the control of penicillin production, namely via the precursor feed [62,288], 3-chlorobenzoate conversion [375] or naphthalenesulfonic acid reduction[279], as well as amino acids [444, 445]. HPLC is also found to be useful when
linked to biochemical assays [316]. Mailinger et al. [262] have discussed many important aspects of on-line HPLC systems.It is possible after some adaptation and modification to link such appara-
tuses to bioreactors (“intelligent analytical subsystems”).This trend towards in-creased automation is not restricted to chromatographic methods (cf. FIA).
2.2.5
Mass Spectrometry (MS)
Mass spectrometry (MS) has been applied mainly for the on-line detection
and quantification of gases such as pO2 , pCO2 , pN2 , pH2 , pCH4 and evenH2S [282] or volatiles (alcohols, acetoin, butanediol). The detection principleallows simultaneous monitoring and, consequently, control of important meta-bolites.
The principles, sampling systems, control of the measuring device and appli-cation of MS for bioprocesses have been summarized by Heinzle [157, 158] andHeinzle and Reuss [162]. Samples are introduced into a vacuum (<10–5 bar) viaa capillary (heated, stainless steel or fused silica, 0.3¥1000 mm or longer) or adirect membrane inlet, for example, silicon or Teflon [72, 412]. Electron impact
ionization with high energy (approx. 70 eV) causes (undesired) extensive frag-mentation but is commonly applied. Mass separation can be obtained either by quadrupole or magnetic instruments and the detection should be performed by (fast and sensitive) secondary electron multipliers rather than (slower and lesssensitive) Faraday cups (Fig. 21).
Instrumentation of Biotechnological Processes 29

8/8/2019 23689262 Bio Analysis and Bio Sensors for Bio Process Monitoring 66
http://slidepdf.com/reader/full/23689262-bio-analysis-and-bio-sensors-for-bio-process-monitoring-66 36/236
Capillary inlet MS is the “scientific exception” [52] but it is routinely appliedeven in industry; most scientific publications report on membrane inlet ap-plications. Almost all volatile substances can be analyzed from the gas phaseusing capillary inlet MS provided their partial pressure in the exhaust gas is≥1 mbar [313]. Software is necessary but is available only for a few special cases[291].
An important problem with membrane inlet systems is quantificationbecause the membrane behavior is more or less unpredictable [138, 352];however, the membrane inlet can be even more rapid [56, 57].
Entire mass spectra of complex supernatants also containing unknown com-pounds have been evaluated as typical fingerprints to characterize the process
30 B. Sonnleitner
Fig. 21. Schematic design of a mass spectrometer connected on-line to bioprocesses. Twoalternative uses are sketched and two alternative separation principles. Top: Pressure of a gas
is converted down to approximately 1 mbar on its way through a capillary through which itis sucked using a mechanical pump. A fraction of this low-pressure gas can enter the highvacuum system of the mass spectrometer via a frit or tiny hole (several 10 to a few 100 mmin diameter). The alternative inlet is a direct membrane inlet. A thin (only a few mm thick)tight membrane, mechanically re-enforced to withstand the pressure gradient, is both a pres-sure and sterile barrier; the membrane is mounted in situ and interfaces cultivation liquid tohigh vacuum. Molecules entering the high-vacuum system are ionized (here shown aselectron impact ionization) and electromagnetically focused into the mass separation spacewhich can be either a magnetic sector field (left ) or a quadrupole system (right ). After massseparation, the ions of interest are quantified using either a highly sensitive secondary electron multiplier (SEM) or an inexpensive Faraday cup detector. The high vacuum isusually achieved using a turbo-molecular pump (TMP) cascaded to a mechanical pump (notshown)

8/8/2019 23689262 Bio Analysis and Bio Sensors for Bio Process Monitoring 66
http://slidepdf.com/reader/full/23689262-bio-analysis-and-bio-sensors-for-bio-process-monitoring-66 37/236
state [159]. This comprehensive view of process data was also applied to pyro-lyzed samples [68, 135, 364]. The analysis of such data makes, however, com-putation power indispensable, e.g. [336].
A control loop based on H2 measurements has been set up by Lloyd and
Whitmore [243] and Whitmore et al. [457] in order to prevent inhibition of methanogenesis: they controlled the addition of the carbon source to a thermo-philic anaerobic digestion process. Even linked pO2 , pH and OUR control arereported based on direct mass spectrometric measurements [103, 312].
There are no reports currently available of an on-line application of the very powerful MALDI technique (matrix-assisted laser desorption/ionizationtime-of-flight mass spectrometry). However, this technique has become in-creasingly important for the analysis of complex molecules and quality control,for example, for glycosylated material [177] or peptides [104] or nucleotides[324].
Of course,mass spectrometry requires expensive equipment. But it should betaken into account that automatic multiplexing of different sample streams ispossible and, in addition, a great variety of different substances can be deter-mined simultaneously.
2.2.6
Biosensors
The rationale for using biosensors is to combine the high specificity of bio-
logical components with the capabilities of electronic tools (i.e. “usual” sen-sors). Biosensors consist of a sensing biological module of either catalytic (e.g.enzymes, organism) or affinity reaction type (e.g. antibodies, cell receptors) inintimate contact with a physical transducer. The latter finally converts thechemical into an electric signal [194]. Principles and typical examples are foundin Karube et al. [205–207, 209], Delaguardia [85] and Jobst et al. [192]. Co-im-mobilization of enzymes can be advantageous when compared with sequentialoperation [24]. In general, the bio-part of the biosensor cannot be sterilized but,however, there is one report of an ethylene oxide sterilizable, implantableglucose biosensor [314]. Because of the small size and the array-type of con-
struction of modern biosensors, it may well be that there is a carry-over of reaction product from one part of the array to the next thus falsifying theresults. Urban et al. [438] have eliminated this problem by adding a secondenzyme membrane layer containing catalase on top of the membrane con-taining oxidase enzymes (Fig. 22).
According to the diversity of possible applications many applications of biosensors have been published,e.g. [145, 317, 462, 463]. Often they concentrateespecially on a certain group of biosensors but high redundancy is obvious. Inthe following sections, different sensor types, ordered by the transduction prin-
ciple, are introduced.
Instrumentation of Biotechnological Processes 31

8/8/2019 23689262 Bio Analysis and Bio Sensors for Bio Process Monitoring 66
http://slidepdf.com/reader/full/23689262-bio-analysis-and-bio-sensors-for-bio-process-monitoring-66 38/236
2.2.6.1
Electrochemical Biosensors
Electrochemical transducers work based on either an amperometric, potentio-metric, or conductometric principle. Further, chemically sensitive semiconduc-tors are under development. Commercially available today are sensors for carbo-hydrates, such as glucose, sucrose, lactose, maltose, galactose, the artificialsweetener NutraSweet,for urea,creatinine,uric acid, lactate,ascorbate,aspirin, al-cohol,amino acids and aspartate.The determinations are mainly based on the de-tection of simple co-substrates and products such as O2 , H2O2 , NH3 , or CO2 [142].
Amperometric transducers measure the current (flux of electrons) caused by
oxidation or reduction of the species of interest when a voltage is appliedbetween the working and the reference electrode. Often, oxygen serves aselectron acceptor but interferences have encouraged development of new methods to avoid this, e.g. controlled oxygen supply and the application of mediators, such as ferrocene, e.g. [169]. Other determinations focus on the
32 B. Sonnleitner
Fig. 22. Schematic design of one example of a biosensor, here an optical biosensor or“opt(r)ode”. The general working principle is that a biological catalyst/recognition element istightly coupled with a so-called transducer. In this special case, the transducer is an opticalsystem, namely optical fibers connected to a light source and a detector (indicated with L and
D). On top of the transducer a biological sensing element is mounted; in this case a mem-brane containing an (immobilized) enzyme which catalyzes a reaction that requires NAD ascofactor. If substrate and co-substrate enter the membrane, substrate will be converted to theproduct and, stoichiometrically, to NADH which can be quantified by fluorescence measure-ment (co-factor must not be limiting). Substrate and co-substrate as well as product can dif-fuse into and out of the membrane and are assumed to equilibrate with the measuring solu-tion. This biosensor cannot be sterilized since the enzyme would not survive the procedure

8/8/2019 23689262 Bio Analysis and Bio Sensors for Bio Process Monitoring 66
http://slidepdf.com/reader/full/23689262-bio-analysis-and-bio-sensors-for-bio-process-monitoring-66 39/236
detection of H2O2 or NADH [9]. Sensors are currently being made smaller andsmaller [297, 298].
Potentiometric transducers measure the potential between the sensing elementand a reference element. Thus, in contrast to amperometric transducers, prac-
tically no mass transport occurs; the response depends on the development of thethermodynamic equilibrium. pH changes often correlate with the measured sub-stance because many enzymatic reactions consume or produce protons.
Conductometric transducers consist of two pairs of identical electrodes, oneof which contains an immobilized enzyme. As the enzyme-catalyzed reactioncauses concentration changes in the electrolyte the conductivity alters and canbe detected.
The conductivity of certain semiconductors such as field effect transistors(FETs) can be affected by specific chemicals. Ion-selective FETs (ISFETs) aremetal oxide semiconductor FETs (MOSFETs) [25]. A great advantage is the
small size (miniaturization) resulting in the possibility of combining several(identical or alternative) sensing units in multifunctional devices [206, 225] andhaving a reasonably short response time [386]. They have already been used forthe detection of urea, ATP, alcohol, glucose and glutamate [142, 378].
2.2.6.2
Fiber Optic Sensors
Optical biosensors typically consist of an optical fiber which is coated with the
indicator chemistry for the material of interest at the distal tip (Fig. 22). Thequantity or concentration is derived from the intensity of absorbed, reflected,scattered, or re-emitted electromagnetic radiation (e.g. fluorescence, bio- andchemiluminescence). Usually, enzymatic reactions are exploited, e.g. [463].
These sensors are ideal for miniaturization, are of low cost and the fiberoptics are sterilizable (even if the analyte is not!). The most limiting disad-vantages are actually interferences from ambient light and the comparatively small dynamic ranges. Applications so far reported in the literature appearedfor pH, e.g. [12], CO2 , e.g. [296], NH3 , e. g. [10], CH4 and metal ions, seeGuilbault and Luong [141], O2 , e.g. [323], glucose, H2O2 and lysine [333] and
even for biomass, e.g. [201].
2.2.6.3
Calorimetric Sensors
This type of biosensor exploits the fact that enzymatic reactions are exothermic(5–100 kJ mol–1). The biogenic heat can be detected by thermistors or tem-perature-sensitive semiconductor devices. A technical realization can be per-formed either by immobilizing enzymes on particles in a column around the
heat-sensing device or by direct attachment of the immobilized enzyme to thetemperature transducer. Applications to measure biotechnologically relevantsubstances have been: ATP, glucose, lactate, triglycerides, cellobiose, ethanol,galactose, lactose, sucrose, penicillin and others [30, 120, 142, 337]. Very sen-sitive thermopiles allow the limit of detection to be decreased significantly [17].
Instrumentation of Biotechnological Processes 33

8/8/2019 23689262 Bio Analysis and Bio Sensors for Bio Process Monitoring 66
http://slidepdf.com/reader/full/23689262-bio-analysis-and-bio-sensors-for-bio-process-monitoring-66 40/236
2.2.6.4
Acoustic/Mechanical Sensors
The piezo-electric effect of deformations of quartz under alternating current
(at a frequency in the order of 10 MHz) is used by coating the crystal with aselectively binding substance, e.g. an antibody.When exposed to the antigen, anantibody–antigen complex will be formed on the surface and shift the reso-nance frequency of the crystal proportionally to the mass increment which is,in turn, proportional to the antigen concentration. A similar approach is usedwith surface acoustic wave detectors [142] or with the surface plasmon reso-nance technology (BIAcore, Pharmacia).
Generally, biosensors are tricky to handle. Due to the vulnerable biologicalelement, e.g. an enzyme or a living microorganism [208, 209], they principally cannot be sterilized. They also suffer from changes in the environment, for ex-
ample, changes in pH or formation of aggressive chemicals such as H2O2 [342].They must therefore be used in a suitable environment, preferably after samplepreparation as in an FIA system. This, eventually, allows simultaneous com-pensation of endogenous interferences [357]. The long-term stability underworking conditions is often poor; however, suitably immobilized glucoseoxidase is useful for more than one year. Only limited experience has beenmade under technical process monitoring conditions.
2.2.7
Biomass
2.2.7.1
Dynamic Range – Dilution
High density cultures present a problem to optical density measurementsbecause of the inner filter effect (i.e. light intensity is lost due to absorbance andscatter by cells over the length of the light path). Lee and Lim [232] andThatipamala et al. [431, 432] have described a way to circumvent and eliminatethe dilution problem at higher cell densities. A larger dynamic range can be
achieved by using concentrically compartmented flow-through cells withdistilled water in the inner tube (which is called optical dilution) and the sus-pension to be measured in the outer tube (i.e. in the annular space). Variationof the diameter ratios of these tubes allows the OD readings to be kept between0 and 0.5. However, the variation is not straightforward because it impliesswitching from one cuvette to another; this is only reasonable when the sampleis run to waste and not returned to the reactor. A very elegant method to obtaina greater dynamic range for OD was used by Nielsen et al. [305]. They exploitedthe dilution equipment of flow injection analysis (FIA) and measured a steady state absorbance (not the transient as usual in FIA) which resulted in a reliableand reproducible signal. Cleaning of this analyte stream was found advan-tageous although deposits were not a problem when a small flow of highly diluted sample was used.
34 B. Sonnleitner

8/8/2019 23689262 Bio Analysis and Bio Sensors for Bio Process Monitoring 66
http://slidepdf.com/reader/full/23689262-bio-analysis-and-bio-sensors-for-bio-process-monitoring-66 41/236
2.2.7.2
Electrical Properties
Determination of conductivity (or impedance) of a culture is another way to
generate a signal which depends on biomass; of course, it also depends on otherfactors such as medium composition [67] more or less pronouncedly and is alsosubject to bubble interferences. Taya et al. [429] found little dependence on pHor sugar concentration and linear correlations with biomass concentrations of plant cells up to 10 g l–1. Ebina et al. [96] reported on similar experiences withyeasts. Henschke and Thomas [164] determined even very low concentrationsof cells in wine. Owens et al. [318] indirectly followed the growth of yeasts by absorbing the produced CO2 and conductometric analysis of this product. Sofar direct electrochemical determination of cells does not seem to be very reliable [361]. Fuel cells [22] can measure the redox potential of a culture [149]
but are comparably very slow and delayed.An electrochemical measurement of a mediator reduced by microbes in a flow injection system was reported by Ding and Schmid [89] to give good correlation with classical determinations,e.g. colony forming units (cfu), and to be rapid (a few minutes per analysis).This system was applied for on-line monitoring of an Escherichia coli culture.However, the dielectric properties of cells such as distinct deviations in thecapacity values have been shown to depend on the growth stage of a culture [267].
2.2.7.3
Filtration Properties
Lenz et al. [233] and Reuss et al. [344] have further developed an automaticfiltration device [300, 435] that allows the estimation of the biomass concentra-tion in a relatively large sample (approx. 100 ml) according to its filtrationproperties. Each sample is filtered through a fresh filter and the flux of the filtrateis monitored as well as the build-up of the filter cake. This information – to-gether with appropriate descriptive models – allows the calculation of the bio-mass concentration in fungal culture aliquots. Since yeasts or bacteria do notbuild up a comparably high filter cake, suspensions of these organisms are less
likely to be estimated accurately. To our knowledge, practically useful experiencehas so far been made only with Penicillium cultures and in the Pekilo process.
2.3
Software Sensors
Software sensors are virtual sensors which calculate the desired variable orparameter from related physical measurements [58]. In other words, there mustalways be a model available that relates reliably the measured variable with thetarget variable or parameter. Normally, measured variables are easily measur-able effects that are caused and influenced by the target. The most prominentsoftware sensor is the respiratory quotient (RQ-value) which characterizes thephysiological state of a culture. However, its determination can be tricky (seeSect. 5).
Instrumentation of Biotechnological Processes 35

8/8/2019 23689262 Bio Analysis and Bio Sensors for Bio Process Monitoring 66
http://slidepdf.com/reader/full/23689262-bio-analysis-and-bio-sensors-for-bio-process-monitoring-66 42/236
Generally, software sensors are typical solutions of so-called inverse pro-blems.A so-called forward problem is one in which the parameters and startingconditions of a system, and the kinetic or other equations which govern itsbehavior, are known. In a complex biological system, in particular, the things
which are normally easiest to measure are the variables, not the parameters. Inthe case of metabolism, the usual parameters of interest are the enzymatic rateand affinity constants, which are difficult to measure accurately in vitro andvirtually impossible in vivo [93, 118, 275, 384].Yet to describe, understand, andsimulate the system of interest we need knowledge of the parameters. In otherwords, one must go backwards from variables such as fluxes and metaboliteconcentrations, which are relatively easy to measure, to the parameters. Suchproblems, in which the inputs are the variables and the outputs the parameters,are known as system identification problems or as so-called inverse problems.
However, the situation is even more complicated since things develop in
relation to time. The estimation of the physiological state of a culture involvesmore than one (measurable) variable at a time and the recent history of this setof individual signal trajectories involved. In other words, physiological stateestimation requires recognition of complex patterns. Various algorithms usedfor this purpose, e.g. [7, 134, 220, 246, 290, 426], have in common that it is notthe present values alone that are evaluated, there is always the recent history of signal trajectories involved.
In some cases, the data describing the actual state and their recent history arecompared with so-called reference patterns: these are data from historical ex-
periments or runs which an expert has associated with a typical physiologicalstate. A physiological state is recognized either if the actual constellationmatches any one of the reference sets best – in this case, there is always an iden-tification made – or if the match exceeds a pre-defined degree of certainty, e.g.60% – then it can happen that no identification or association is possible witha too high limit selected. The direct association with reference data needsnormalization (amplitude scaling) and, probably, frequency analysis in order toeliminate dependencies on (time) shifts, biases or drifts.
In other cases, the data trajectories are translated into trend-qualities via shapedescriptors such as: glucose uptake rate is decreasing (concave down) while RQ is
increasing (linear up) and … These combinations of trends of the trajectories of various state variables or derived variables define a certain physiological state; theadvantage of this definition is that the association is no longer dependent on timeand on the actual numerical values of variables and rates [413].
2.4
Validation
On-line measurements produced with in situ sensors are difficult to validate.
The usual procedure for evaluating the quality of a measurement is restricted tocalibration/checking prior to and after a cultivation. A few sensors such as thepCO2 - or the Cranfield/GBF-glucose sensor [42] allow removal (at least of measuring buffer and also of the transducer itself) and, therefore, recalibrationof the transducer during a cultivation (Fig. 23).
36 B. Sonnleitner

8/8/2019 23689262 Bio Analysis and Bio Sensors for Bio Process Monitoring 66
http://slidepdf.com/reader/full/23689262-bio-analysis-and-bio-sensors-for-bio-process-monitoring-66 43/236
External chromatographs and FIA systems can be regularly recalibrated but thesterile interface cannot. Other sensors such as a pH or a pO2 probe can be mount-ed via a retractable housing which allows either sterile exchange or withdrawal for
external recalibration during a run. A further possibility to gain some informationabout the reliability of a measurement is to mount a number (>1) of identical sen-sors in easy to compare positions and to check the individual signals for equality.This opportunity has been exploited for many years in other technologies.
It is highly desirable to have alternative principles of measurement at handwhich operate simultaneously. For instance, both oxygen and carbon dioxidecan be determined in the exhaust gas using either the classical analyzers sen-sitive to infrared absorption (for CO2 ) and paramagnetic properties (for O2 ),respectively, or using a mass spectrometer. Stability of these instruments isreasonable and interference from other components is not very likely. The
partial pressures of both gases can be monitored with membrane-coveredprobes. The membranes are the weakest elements in this measuring chain andare exactly those that are the most difficult to validate experimentally. Theelectrodes or the mass spectrometer behind the membrane are just transducingelements and quite reliable. The measurements obtained from the gas and fromthe liquid phase quantify, of course, different state variables but they are tightly linked via gas-liquid mass transfer. Pattern recognition can help to generally identify malfunctioning sensors in some cases [247].
It is, however, interesting to realize that in the last few years more and more
industrialists are convinced that the risk of implementing on-line measure-ments coupled to controllers, for instance, for feed, pays back due to reprodu-cible and highly productive biotransformations with constantly high quality;for example, Rohner and Meyer [353] have implemented on-line FIA, HPLC andphotometry with the respective controllers on the 15 m3 production scale.
Instrumentation of Biotechnological Processes 37
Fig. 23. Schematic design of a biosensor that can be mounted in situ. The biosensor itself sits
in a housing and consists of a biocomponent such as one or more immobilized enzymes orcells on top of and in close contact with a suitable type of transducer. A buffer or diluentstream can help to extend the useful dynamic range of the biosensor. The analyte arrives atthe biosensor by passing a suitable membrane which enhances selectivity and protects thebiosensor. An additional mechanical shield in the form of a mesh, grid or frit may be neces-sary to assure mechanical stability in the highly turbulent zone

8/8/2019 23689262 Bio Analysis and Bio Sensors for Bio Process Monitoring 66
http://slidepdf.com/reader/full/23689262-bio-analysis-and-bio-sensors-for-bio-process-monitoring-66 44/236
3Off-Line Analyses
3.1
Flow Cytometry
Flow cytometry is a very versatile technique [223] which allows the analysis of more than 104 cells per second [369, 370]. This high number results in statisti-cally significant data and distributions of cell properties. Therefore, flow cyto-metry is a key technique to segregate biomass (into distinct cell classes) and tostudy microbial populations and their dynamics, specifically the cell cycle [76,87, 116, 200, 214, 221, 295, 329, 330, 409, 418]. Individual cells are aligned by means of controlled hydrodynamic flow patterns and pass the measuring cellone by one. One or more light sources, typically laser(s), are focused onto the
stream of cells and a detection unit(s) measure(s) the scattered and/or fluores-cent light (Fig. 24). Properties of whole cells such as size and shape can be
38 B. Sonnleitner
Fig. 24. Schematic design of a flow cytometer. The exciting light is created by one or morelaser sources which is focused by means of mirrors and lenses to a small measuring space(typically in the order of the particles to analyze) in the flow channel. Whenever a particlepasses this space, extinction, forward or side scatter of light, or emission of fluorescent lightoccurs. These different light qualities are separated by lenses and mirrors and quantified by detectors (usually photomultipliers) mounted in appropriate positions. The particles arehydrodynamically aligned in the thin flow channel so that only individual single particlespass the measuring zone sequentially. If necessary, a cell sorter can be appended: the on-lineexecuted data evaluation algorithms must classify every measured event in a short time sothat an appropriate voltage can be applied to the deflection plates as soon as the respectiveparticle arrives in this space. A tiny fraction of the liquid stream, most probably containingthe particle of interest, can be deflected into one container. This allows particles to be sortedaccording to individual properties determined by the flow cytometer. Since individualproperties can be quantitatively determined for each quality (e.g. forward scatter reflects thesize, various fluorescences reflect different intra-particle components), population distribu-tions can be analyzed

8/8/2019 23689262 Bio Analysis and Bio Sensors for Bio Process Monitoring 66
http://slidepdf.com/reader/full/23689262-bio-analysis-and-bio-sensors-for-bio-process-monitoring-66 45/236
estimated as well as distinct cellular components. The latter requires specificstaining procedures which normally do not allow this technique to be simply used on-line. So far, there has only been one report [480] of an on-line applica-tion.
Among the items that have been measured are: vitality, intracellular pH, DNAand RNA content, and specific plasmids [77, 408]. Besides nucleic acids [204],other intracellular components can also be analyzed, e.g. storage materials [2,82, 294], enzymes and protein content [6, 338], or the cell size [60, 61]. The phy-siological state can also be rapidly assessed [331]. Furthermore, this techniqueallows the separation of certain cells using a cell sorter, e.g. for strain improve-ment [28].The flow cytometry technique has also been used in connection withmolecular probes for identification and viability determination of microbialcommunities [98]. This application of viability estimation is becoming in-creasingly important [63, 136, 188, 454]. Unfortunately, the equipment is ex-
pensive and most of the measurements are tricky and laborious and not welldesigned for on-line application.
Jayat and Ratinaud [190] discuss the advantages of multi-parametric analy-ses taking DNA and other cellular components simultaneously into account; seealso, e.g. [73, 261]. Flow cytometry is also useful for identification of (new)species [78] or for biomass estimation [299, 349].
Hewitt et al. [167] have exploited flow cytometry to quantify the impact of fluid mechanical stress on bacterial cultures. A modified technique, called theslit-scan method, allows the determination of cell shapes and of intracellular
location of stained components [34]. Image cytometry and fluorescence micros-copy are variants for determination of the volume growth of cells or morphology changes and seem to have become increasingly important [60, 382, 461].
3.2
Nuclear Magnetic Resonance (NMR) Spectroscopy
Responses of atomic nuclei with net magnetic moments that are exposed to amagnetic field and irradiated by electromagnetic energy reveal a variety of information. Absorption of energy, i.e. resonance of exciting and nuclear
frequency, is typical for a nucleus in a certain molecular-electronic environ-ment. The resonance frequency is shifted according to the shielding effects of the physicochemical environment (other nuclei in the molecular vicinity) onthe local magnetic field (the so-called chemical shift which is measured;Fig. 25).
NMR spectroscopy has so far been suited for non-invasive investigation of biochemical structures, fluxes through pathways, distribution of marker-nucleiamong various cellular components and enzymatic mechanisms rather than forquantitative determination of small molecules. Biochemical applications have
involved NMR spectroscopy mainly for structural determination of complexmolecules, e.g. [27, 180], as well as inside the cells, i.e. in vivo [184, 189]. In bio-technology, the potential of determining intracellular components without celldisruption is increasingly used for in vivo studies of metabolism, e.g. [15,55, 88,121, 146, 197, 250–252, 271, 335], and effectors [419].
Instrumentation of Biotechnological Processes 39
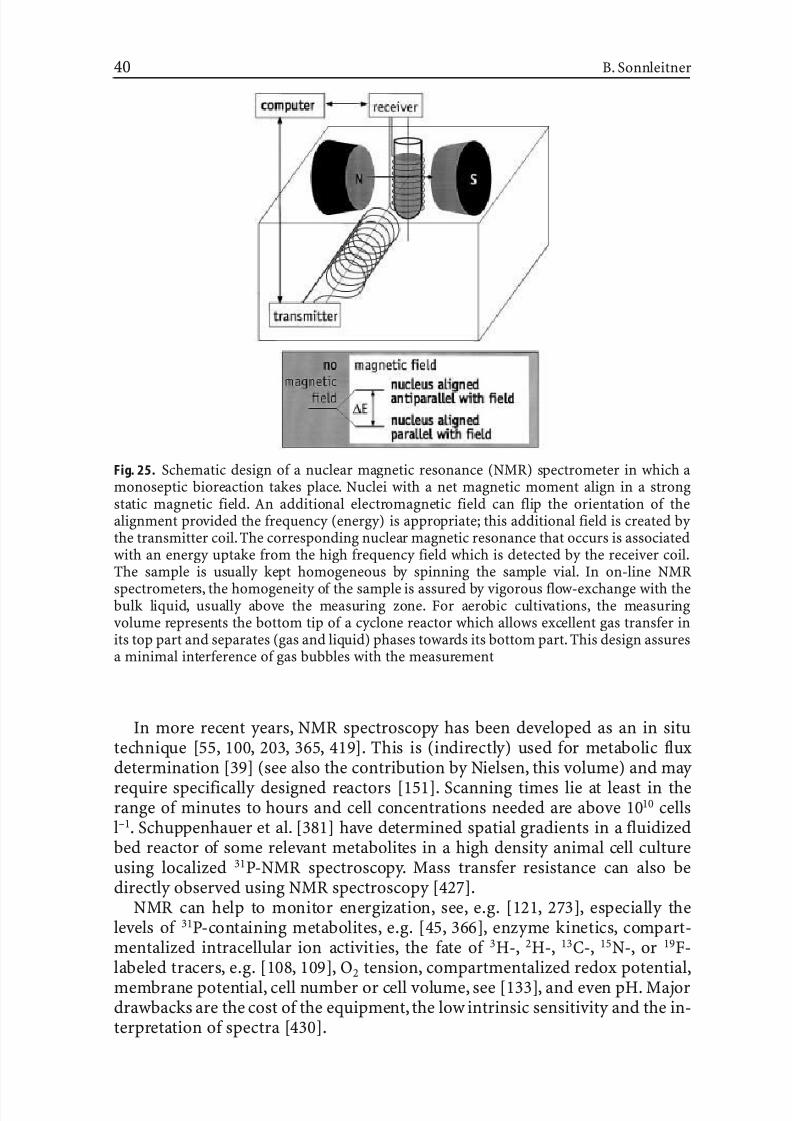
8/8/2019 23689262 Bio Analysis and Bio Sensors for Bio Process Monitoring 66
http://slidepdf.com/reader/full/23689262-bio-analysis-and-bio-sensors-for-bio-process-monitoring-66 46/236
In more recent years, NMR spectroscopy has been developed as an in situtechnique [55, 100, 203, 365, 419]. This is (indirectly) used for metabolic flux
determination [39] (see also the contribution by Nielsen, this volume) and may require specifically designed reactors [151]. Scanning times lie at least in therange of minutes to hours and cell concentrations needed are above 1010 cellsl–1. Schuppenhauer et al. [381] have determined spatial gradients in a fluidizedbed reactor of some relevant metabolites in a high density animal cell cultureusing localized 31P-NMR spectroscopy. Mass transfer resistance can also bedirectly observed using NMR spectroscopy [427].
NMR can help to monitor energization, see, e.g. [121, 273], especially thelevels of 31P-containing metabolites, e.g. [45, 366], enzyme kinetics, compart-
mentalized intracellular ion activities, the fate of 3
H-,2
H-,13
C-,15
N-, or19
F-labeled tracers, e.g. [108, 109], O2 tension, compartmentalized redox potential,membrane potential, cell number or cell volume, see [133], and even pH. Majordrawbacks are the cost of the equipment, the low intrinsic sensitivity and the in-terpretation of spectra [430].
40 B. Sonnleitner
Fig. 25. Schematic design of a nuclear magnetic resonance (NMR) spectrometer in which amonoseptic bioreaction takes place. Nuclei with a net magnetic moment align in a strongstatic magnetic field. An additional electromagnetic field can flip the orientation of thealignment provided the frequency (energy) is appropriate; this additional field is created by the transmitter coil. The corresponding nuclear magnetic resonance that occurs is associatedwith an energy uptake from the high frequency field which is detected by the receiver coil.
The sample is usually kept homogeneous by spinning the sample vial. In on-line NMRspectrometers, the homogeneity of the sample is assured by vigorous flow-exchange with thebulk liquid, usually above the measuring zone. For aerobic cultivations, the measuringvolume represents the bottom tip of a cyclone reactor which allows excellent gas transfer inits top part and separates (gas and liquid) phases towards its bottom part. This design assuresa minimal interference of gas bubbles with the measurement

8/8/2019 23689262 Bio Analysis and Bio Sensors for Bio Process Monitoring 66
http://slidepdf.com/reader/full/23689262-bio-analysis-and-bio-sensors-for-bio-process-monitoring-66 47/236
3.3
Field Flow Fractionation (FFF)
Field flow fractionation (FFF) is an elution technique suitable for molecules witha molecular weight >1000 up to a particle size of some 100mm. Separating, driv-ing, external field forces are applied perpendicular to a liquid carrier flow, caus-ing different species to be placed in different stream lines (Fig. 26). Useful fieldsare gravity, temperature, cross flow, electrical charge, and others [128–131].
The range of the (molecular) size of the analytes usually exceeds that whichcan be determined by classical laboratory analytical methods such as sizeexclusion chromatography, etc. [351]. Reports on investigated substances arewidespread and cover applications such as the separation and characterization
of proteins [450] and enzymes [240, 241], of viruses [132], the separation of human and animal cells [50, 51], the isolation of plasmid DNA [367], and themolecular weight and particle size distribution of polymers [216, 217]. The ap-proach is relatively new in biotechnology; therefore, practical experiences arenot yet abundant. Langwost et al. [229] have provided a comprehensive survey of various applications in bio-monitoring.
3.4
Biomass
The classical way to determine biomass concentration is typically an off-linemethod, namely to harvest a known aliquot of the culture suspension, separatecells by centrifugation, wash the cells and dry them to constant weight at a few degrees above the boiling point of the solvent (i.e. aqueous medium, usually
Instrumentation of Biotechnological Processes 41
Fig. 26. Schematic design of field flow fractionation (FFF) analysis. A sample is transportedalong the flow channels by a carrier stream after injection and focusing into the injector zone.Depending on the type and strength of the perpendicular field, a separation of molecules orparticles takes place: the field drives the sample components towards the so-called ac-cumulation wall. Diffusive forces counteract this field resulting in discrete layers of analytecomponents while the parabolic flow profile in the flow channels elutes the various analyte
components according to their mean distance from the accumulation wall. This is called “nor-mal mode”. Particles larger than approximately 1 mm elute in inverse order: hydrodynamiclift forces induce steric effects: the larger particles cannot get sufficiently close to the ac-cumulation wall and, therefore, elute quicker than smaller ones; this is called “steric mode”.In asymmetrical-flow FFF, the accumulation wall is a mechanically supported frit or filterwhich lets the solvent pass; the carrier stream separates asymmetrically into the eluting flow and the permeate flow which creates the (asymmetrical) flow field

8/8/2019 23689262 Bio Analysis and Bio Sensors for Bio Process Monitoring 66
http://slidepdf.com/reader/full/23689262-bio-analysis-and-bio-sensors-for-bio-process-monitoring-66 48/236
105 °C). After gravimetric determination of the dry mass in the vial or on afilter, the mass concentration in the original sample volume can easily be cal-culated if there are neither particulate components in the fresh medium norprecipitates formed during cultivation.
What does the cell dry weight concentration mean and teach us about theprogress and behavior of a bioprocess? The analytical value reflects only thecellular mass and does not allow a distinction between structural or storagematerials and biocatalytically active components of the cells on the one hand,or between live and dead cellular material on the other.
Cell populations are normally viewed as unstructured and unsegregated;their only property is to have mass. We also abbreviate biomass with X – thegreat unknown. Substantial losses occur in the bioprocess industry each yeardue to this unknown factor, specifically, the variability in inoculum culturesand, hence, in yields and productivities of production cultures [455].
There are alternatives for this measure, such as total and/or viable cell num-ber concentration; this is determined by counting cells in a given culturevolume aliquot. Its determination is quite laborious and error-prone. The resultis available more rapidly, but this is the only obvious advantage. However, bothmeasures for cells are not equivalent under transient culture conditions. So-called standard cells are cells with a constant individual cell mass but these arethe exception rather than the rule, see Rodin et al. [350] and references citedtherein, as well as Schuster in this volume.
Both methods (mass and number concentration estimations) cannot reflect
the biocatalytic activity sufficiently. This derives from the fact that (microbial)biomass is not a homogeneous continuum but a very large, however finite,population of individual cells with individual properties. These may changesignificantly, e.g. depending on the microenvironmental conditions, on thehistory of a single cell proliferation, on the position in the cell cycle, or on theinteraction with other cells or surfaces. The only good reason to neglect theindividual character of cells is the statistically relevant high number of indi-viduals in a process population. This is also why strongly simplifying growthmodels, such as the Monod model with the biomass concentration as the only state variable besides substrate concentration, have been so successful.
The classical ways to quantify a population density by either a mass or anumber concentration can be sufficiently accurate and precise but, then, they are accordingly laborious and time-consuming. This does not hinder goodscientific research (although not convenient) but is a severe obstacle to processcontrol: the signal must be generated on-line and should not be prone to delays.The signal may be discontinuous but the discrete time intervals between up-dates must be sufficiently small. On-line estimation of the biomass concen-tration is no longer a matter of comfort, it is essential for any functional con-troller.
The latter requirement and the concomitant improvement of comfort led tothe exploitation of alternative methods to estimate the biomass concentration.All of them have in common: (1) that they are indirect measures, and (2) thatmodels are mandatory to relate these measures to biomass concentration. Themodels are of the descriptive rather than the mechanistic type which means
42 B. Sonnleitner
8/8/2019 23689262 Bio Analysis and Bio Sensors for Bio Process Monitoring 66
http://slidepdf.com/reader/full/23689262-bio-analysis-and-bio-sensors-for-bio-process-monitoring-66 49/236
that: (1) they must be experimentally verified for each single application, i.e.separately calibrated for each biological and reaction system, and (2) they mustnot be misused for extrapolation outside the data space that serves for calibra-tion [215, 394].Most of the indirect methods cannot be used generally; applica-
tion is subject to several constraints typical for the cells (growing singly or infilaments or aggregated) and the culture liquid (color, particulate substancesother than cells, viscosity or another immiscible liquid phase).
3.4.1
Cell Mass Concentration
Off-line determination of biomass concentration by classical gravimetricmethods requires cell separation, washing steps and drying to constant weight.The separation of cells can be made either by centrifugation or by filtration.
The first method is cheaper with respect to consumables but has somegeneral disadvantages. (1) The required volume is high: a significant amount of biomass must be accumulated because the dead weight of the centrifugationvial is relatively high; since dry weight is calculated from the difference of thevials with and without cells, error propagation relative to this (small) differenceincreases with decreasing cell mass. (2) Conditioning of the vials prior toweighing is decisive since vial surfaces are generally large. A considerableamount of water (from ambient air) can adsorb to the surface especially whenglass vials are used. Plastic vials can lose considerable amounts of plasticizers.
This increases the error. (3) Inactivation of cellular activities is not performedduring centrifugation without further precautions. This can result in continua-tion of mass increase (growth) or decrease (due to mobilization of storagematerials) of cells and, consequently, non-representative values. Although theseerrors are not expected to exceed the standard error of the gravimetric methodby much, it might be decisive in scientific research, see e.g. Kätterer [212]. (4)The washing step requires skilled personnel in order to avoid losses of cellsduring withdrawal of supernatant and the washing step(s).
In contrast, the filtration method is more expensive (filters cannot be re-used) but works with smaller net weights (i.e. sample volumes) and is usually
more rapid, provided the cells are not slimy and do not clog the filter. Nylon orPVDF filters withstand the pre-drying procedure excellently whereas modifiedcellulose filters lose their mechanical robustness.
In any case, a strict standard operating procedure (SOP) must be followed toassure at least reproducibility. Figure 27 shows a useful SOP which might re-quire some modifications depending on the characteristic properties of cellsuspensions. Wet weight determinations are by far less accurate since a definedwater content is not easy to arrange reproducibly.
3.4.2Cell Number Concentration
Determination of the cell number concentration (cell counting) requires thatcells are suspended singly. If this is not the case in the culture,an additional step
Instrumentation of Biotechnological Processes 43

8/8/2019 23689262 Bio Analysis and Bio Sensors for Bio Process Monitoring 66
http://slidepdf.com/reader/full/23689262-bio-analysis-and-bio-sensors-for-bio-process-monitoring-66 50/236
of disintegration of aggregates (e.g. by sonification) or of suspending attachedcells (e.g. by trypsinization) is necessary [117, 165].A further dilution step may be required to achieve the necessary resolution of single cells in either themicroscopic picture or in a Coulter counter, e.g. [224], or in a flow cytometer[153]. Inactivation is not a decisive factor unless the population to be quantifiedis highly synchronized and close to the cell cycle phase of cell separation.
In a few cases, biomass is estimated as colony forming units (cfu’s); however,this method is employed nearly exclusively in hygienic analyses of water, waste
water, soil and sludge samples. An appropriately diluted, concentrated orsuspended homogeneous aliquot of the sample is plated on solid medium andincubated for a predetermined time. Then, the visible colonies are counted anda potential viable cell concentration is calculated based on the assumption thatany one colony has proliferated from a single viable cell or spore originally present in the plated volume. This naturally results in a notorious underestima-tion of cells in the sample because the assumption seldom holds 100% true anda fraction of the live cells may not proliferate to a visible colony within theincubation period. On the other hand, an overestimation of active cells must
occur when the organisms are sporulated in the original sample and the in-cubation time is sufficient to allow germination and sufficient growth.
44 B. Sonnleitner
Fig. 27. Standard operating procedure (SOP) for determination of cell dry weight

8/8/2019 23689262 Bio Analysis and Bio Sensors for Bio Process Monitoring 66
http://slidepdf.com/reader/full/23689262-bio-analysis-and-bio-sensors-for-bio-process-monitoring-66 51/236
3.4.3
Viability
Viability – widely used to characterize animal cell cultures – is estimated ac-
cording to the ability of individual cells to catalyze a biochemical reaction, e.g.the reduction of Methylene Blue or Trypan Blue to the respective leuko-form[65, 332]; after staining, blue cells are distinguished microscopically from non-colored cells. This method may give a significant overestimation of cell viability because lysed or lysing dead cells are not accounted for. Flow cytometric ap-proaches are mentioned above (see Sect. 3.1).
LDH activity in the supernatant can be an excellent indicator for dead ornon-viable cells as demonstrated for CHO cells [343]. This method is muchfaster than all of the counting techniques (and is again a solution of an inverseproblem).
3.4.4
Cellular Components or Activities
The trick for analyzing a biocatalytic activity must also be exploited wheneverthe medium contains particulate matter because this, of course, would falsify any direct gravimetric determination. Herbert [165] also gives an overview of many different indirect methods. One such often-used method is the measure-ment of dehydrogenase activity, for example, INT dehydrogenase [117, 253,254]. An extension is the determination of substances that are typical for eithervegetative cells or spores such as ATP [92, 173, 277, 393], NAD(P)H, DNA [236,277, 434], phospholipids or dipicolinic acid [176, 456]; see [37, 400] or [328] forapplication even in sewage sludge characterization. These methods have incommon that they are very laborious, time-consuming, difficult to calibrate andquestionable to validate. Some are not precise which is either caused by thechemical instability of the extracts and/or the low relaxation times of the intra-cellular compounds in comparison with the required sample preparation time.One must also bear in mind that the macromolecular composition of cells may change during a cultivation [71] and even organelles underlie certain dynamics
[391]. Physiological state based on the cellular level is extensively treated by Schuster in this volume.
Properties such as cell volume, morphology or cell size are nowadays deter-mined using flow cytometers or image analysis, e.g. [35, 95, 181, 440], or by insitu microscopy, e.g. [422]. Biomass quantification by image analysis is treatedextensively by Pons and Vivier in this volume.
3.5
Substrates, Products, Intermediates and Effectors
These important substances do deserve individual consideration but, from ananalytical point of view, have already been covered in previous sections underthe various techniques discussed.
Instrumentation of Biotechnological Processes 45

8/8/2019 23689262 Bio Analysis and Bio Sensors for Bio Process Monitoring 66
http://slidepdf.com/reader/full/23689262-bio-analysis-and-bio-sensors-for-bio-process-monitoring-66 52/236
4Real Time Considerations
A notorious underestimation of the dynamic properties of microbial and cel-
lular populations results from matching the duration of the respective batchcultivations to the relevant time constant of the biosystem under investigation.However, metabolic regulation of enzyme activities and fluxes often takes placeon a time scale of seconds rather than days although the latter may also be true.It is therefore in the scope of promoting biotechnological research to adopt anddevelop appropriate experimental concepts, methodologies and equipment[397].
What is fast? What is slow? What is relevant? The relaxation time concept of Harder and Roels [148] (Fig. 28) maps typical time constants of microbial andcellular control on the level of modification of enzymes (activation, inhibition,
dis/association of subunits, covalent modification or digestion) to the range of ms to s, on the level of regulation of gene expression (induction, repression orderepression of transcription) to min, on the level of population selection andevolution to days and larger units. The examples discussed below will clear uphow bioengineering is facing the individual time constants.
A typical bioprocess, if operated in batch mode, extends over several hoursor a few days. If operated in continuous mode, it is not reasonable to acceptoperating times of less than a month (see, e.g. Heijnen et al. [156]). If an or-ganism has special physiological features, such as baker’s yeast, a transition
from one to the other domain (e.g. from low to high dilution rates or, in otherwords, from purely oxidative to oxido-reductive growth) may also result in con-siderable changes in the time required to approach a new steady state. Axelssonet al. [14] reported a rough estimate for this case: the time constant for ex-periments at low dilution rates (D < DR , where DR = D at which the regulatory switch between oxidative and oxido-reductive metabolism occurs) is, as expec-ted, in the order of the mean residence time (t= D–1) but, above DR , the time
46 B. Sonnleitner
Fig. 28. Concept of relevant relaxation times (according to [148]). Note that the time scale islogarithmic

8/8/2019 23689262 Bio Analysis and Bio Sensors for Bio Process Monitoring 66
http://slidepdf.com/reader/full/23689262-bio-analysis-and-bio-sensors-for-bio-process-monitoring-66 53/236

8/8/2019 23689262 Bio Analysis and Bio Sensors for Bio Process Monitoring 66
http://slidepdf.com/reader/full/23689262-bio-analysis-and-bio-sensors-for-bio-process-monitoring-66 54/236
lifetimes, e.g. molecules representing the energy currency of cells such as ATPand other nucleotides. Rizzi et al. [348] and Theobald et al. [433] have shownthat the energy charge response to a pulse challenge of a yeast culture is a mat-ter of a few seconds only. However, the responses can differ considerably when
pulses or shifts are applied to cultures of different recent history [399, 404, 405].Larsson [230] and Neubauer et al. [301] found that substrate oscillations greatly affected the growth performance of Escherichia coli. Short-term, i.e. less than2 min, glucose excess and starvation were investigated in a looped system of astirred tank and a plug flow reactor (a so-called compartmented reactor).Similar observations have also been made for yeast [115, 124].
Two other paradigms demonstrate that the band width of relaxation times isextremely broad: the time required to achieve a new steady state in a chemostatculture is approximately determined by (mmax –D)–1. The time required by aculture to consume a considerable fraction of small amounts of residual
48 B. Sonnleitner
Fig. 29. Origin of systematic errors in spite of potentially error-free analysis. On-line sam-pling setups (top) and time trajectories of limiting substrate concentration during samplepreparation in the two paradigmatic setups depending on the actual culture density (bot-tom). Either a filter in bypass loop is used for the preparation of cell-free supernatant (upper part in top insert ) or an aliquot of the entire culture is removed using an automatic samplervalve and a sample bus for further inactivation and transport of the samples taken (lower part ). Both methods require some finite time for sample transportation from the reactoroutlet (at z = 0) to the location where separation of cells from supernatant or inactivation by adding appropriate inactivators (at z = L) takes place. During transport from z = 0 to z = L,
the cells do not stop consuming substrate. A low substrate concentration in the reactor(namely s ~Ks ) and a maximal specific substrate consumption rate of 3 g g–1 h–1 were as-sumed in the simulation example to reflect the situation of either a fed-batch or a continuousculture of an industrially relevant organism such as yeast. The actual culture density (in g l–1)marks some trajectories in the mesh plot. Note that the time scale is in seconds

8/8/2019 23689262 Bio Analysis and Bio Sensors for Bio Process Monitoring 66
http://slidepdf.com/reader/full/23689262-bio-analysis-and-bio-sensors-for-bio-process-monitoring-66 55/236
substrate during sampling – and thus systematically falsify the analytical resultsif no appropriate inactivation takes place – depends, among others, on the celldensity and can also be in the order of a few seconds only (Fig. 29).
Even simple static models are very valuable for compensation of systematic
errors built into automated analytical procedures. One important example iswhen sampling requires a well-known but non-negligible time, e.g. when per-formed using a filter separator operated in bypass or using a sample bus system.A bypass behaves as a plug flow type reactor fraction where flow-dependentspatial gradients develop and where no inactivation can take place because thebulk of the bypassed aliquots is returned to the reactor. The cells continue toconsume substrate while they are being transported from the exit of the reactorto the filter.The permeate recovered there is representative for the filter site butnot for the reactor. Knowing the transport time and some basic kinetic para-meters one can easily compensate on-line for such errors provided that a useful
estimate of the actual biomass concentration is available. Even though a bypasscan be tuned to be operated at a mean residence time of 5 s or less, this can beenough for a significant decrease in substrate concentration in high density cul-tures (see Fig. 29). Sample buses need a minimal (dead) time for transportationof the sample and in situ filters tend to fail in high density cultures due to rapidfouling. Hence, the problem is real and must not be ignored.
4.2
Continuous Signals and Frequency of Discrete Analyses
Sensors based on either electrical, optical or electromagnetic principles nor-mally deliver a continuous signal which is very useful. The dynamics of theanalyzed system can be resolved according to the time constants of the respec-tive electronic equipment. In the general case, however, these data will nowa-days be digitized but the information loss can normally be neglected because12- or 16-bit converters are state of performance today.
Further,data are stored in a computer in distinct time intervals resulting in dis-cretion with respect to time and concomitantly in a possible loss of information.Adata reduction algorithm should therefore be applied which must account for this
fact: raw data should be scanned with high frequency and the essential data – i.e.only recording when important changes take place – may be stored with the ne-cessary frequency, i.e. variably or not equidistant with respect to time.
Analytical instruments based on either physicochemical separation methodsor relying on (bio)chemical reactions require a finite time to run; these instru-ments are usually operated in repetitive, non-overlapping batch mode and deli-ver results with a certain non-negligible dead time. Generally, data density islow, for instance, in the order of 1 min–1 for FIA or 2 h–1 for HPLC.
5Relevant Pitfalls
Sampling and sample preparation usually impose systematic errors on the re-sults of analytical procedures. It is, therefore, important to be able to reproduce
Instrumentation of Biotechnological Processes 49

8/8/2019 23689262 Bio Analysis and Bio Sensors for Bio Process Monitoring 66
http://slidepdf.com/reader/full/23689262-bio-analysis-and-bio-sensors-for-bio-process-monitoring-66 56/236
5.2
CO2 Equilibrium with HCO3–
Even error-free determination of CO2 in the exhaust gas does not necessarily as-sure correct determination of CO2 production (rate) or carbon recovery if thesolubility and reactivity of CO2 at neutral or alkaline pH is not taken into con-sideration [311]. CO2 dissolves in water to hydrated CO2 , namely H2O.CO2 ,
these errors and to determine them as accurately as possible, as discussedabove,in order to compensate by appropriate calculations.Good sampling tech-niques, such as rapid automatic sampling, fast cooling, heating or immediatechemical inactivation, help to minimize these errors. One needs to be aware of
the possible artifacts inherent to individual measuring techniques and under-lying assumptions; some general reflections and simple examples can be foundin Locher et al. [244, 245]. In the following sections, three randomly selectedexamples are discussed in more detail.
5.1a ,b-D-Glucose Analyzed with Glucose Oxidase
A generally ignored pitfall is associated with some glucose analyses, specifically with those methods using glucose oxidase. Such methods are very commonsince the enzyme is relatively inexpensive and very stable. This enzyme isknown to react with b-d-glucose but not with a-d-glucose (Merck Index).
In aqueous solution, a mutarotational equilibrium of the two anomers isreached spontaneously – but not instantaneously – in which the ratio a/b is36:64 at a temperature of approximately 30°C. In water, the rate is much lowerthan in buffer(ed medium) [354].The enzyme mutarotase accelerates mutarota-tion considerably. The rate at which the equilibrium is reached spontaneously depends greatly on pH, temperature and other solution components.
The numerical values of the time constants summarized in Table 1 confirm
that there is no particular time for significant mutarotation to take place inrapid on-line analyses. If glucose uptake is anomerically specific, as has beenshown by Benthin et al. [23], analytical results obtained with a glucose oxidasemethod must be corrected accordingly. The same holds true for analyses of rapid biological transients and for any spiking method (if the spiking solutionhappens to be freshly prepared).
50 B. Sonnleitner
Table 1. Values for kmut, the kinetic parameter describing mutarotational equilibration of a,b-d-glucose
Solvent Not specified Pure water PO4-buffer
kmut (h–1) 2.8 – 11.4 1.2 ± 0.02 12 ± 1Ref [23] [354] [354]

8/8/2019 23689262 Bio Analysis and Bio Sensors for Bio Process Monitoring 66
http://slidepdf.com/reader/full/23689262-bio-analysis-and-bio-sensors-for-bio-process-monitoring-66 57/236
which is in equilibrium with the unstable H2CO3 . This, in turn, is in practically instantaneous equilibrium with HCO3
– , determined by the pH of the solution:
k1 spontaneousCO2 + H 2O æÆ H 2CO3 ¨æææÆ HCO3
– + H + (3)¨æ k2
with the following kinetics:
b · 10–pH
r c > b = k1 · c – k2 · [H 2CO3 ] = k1 · c – k2 · 04 (4)K b
where r c > b is the net reaction rate, c is the concentration of dissolved CO2 , b isthe concentration of bicarbonate (HCO3
–) and K b is the dissociation parameterof carbonic acid to bicarbonate. k1 and k2 are rate parameters for which quitedifferent sets of numerical values are found in the literature (Table 2). This is
most probably associated with the different acidity of H2O.CO2 and H2CO3 ; thelatter is the stronger acid.Important is the conclusion that a significant amount of CO2 may not be
found in the exhaust gas but rather trapped in the culture liquid in the form of bicarbonate or even carbonate (in alkalophilic cultures). For example, Ponti[327] estimated that up to 25% of total carbon mineralized in sewage sludgetreatment was captured as bicarbonate and not released via the gas phase.Disregarding this fact must result in systematically erroneous determinationsof respiratory quotient (RQ), carbon dioxide production rate (CPR) and carbonrecovery. However, taking all these factors into account allows the determina-
tion of the RQ-value, even in mammalian cell cultures, with reasonable accu-racy even though bicarbonate and low gas turnover rates hamper the measure-ments [38].
5.3
Some Remarks on Error Propagation
Elemental balancing permits the determination of (other) metabolic ratesprovided the stoichiometry is known. Carbon balances are the most useful but
the carbon lost via the exhaust gas (as CO2 ) and culture liquid (as HCO3
–
) mustbe measured.Heinzle et al. [161] determined that the state predictions based onexperiments with a small quadrupole mass spectrometer were not useful due tounacceptable error propagation; for instance,a 1% relative offset calibration er-ror could result in a prediction error for an intracellular storage material (PHB)
Instrumentation of Biotechnological Processes 51
Table 2. Parameters describing the CO2–bicarbonate equilibrium
k1 (h–1) k2 (h–1) K b(M 1–1) Ref
209 2160 6.8 ¥ 10–4 [356]
134 134 4.7 ¥ 10–7 [311]– – 4.26 ¥ 10–7 a
a Handbook of chemistry and physics.

8/8/2019 23689262 Bio Analysis and Bio Sensors for Bio Process Monitoring 66
http://slidepdf.com/reader/full/23689262-bio-analysis-and-bio-sensors-for-bio-process-monitoring-66 58/236
of > 50%. Using a highly accurate and precise instrument (absolute errors<0.02% gas composition) together with automatic, repetitive recalibration re-sulted,however, in reasonable estimation of substrates, PHB and biomass.Thesefindings have also been experienced by others, e.g. [245].
The physiological states expressed in yeast fed-batch cultures could berecognized on-line by fuzzy inference based on error vectors. The error vectorhas been newly defined in a macroscopic elemental balance equation. Thephysiological states for cell growth and ethanol production can be character-ized by error vectors using many experimental data and fuzzy membershipfunctions, constructed from the frequency distributions of the error vectors,allow state recognition by fuzzy inference. In particular, unusual physiologicalstates during yeast cultivations can be recognized accurately [383].
The variability of replicate measurements of soluble protein or enzymeactivities was investigated by Dehghani et al. [83]. The variability of the assays
depended on the measured concentrations and the standard deviation wasfound to be roughly proportional to the actual values.
5.4
The Importance of Selecting Data To Keep
Automated measurement and control of bioprocesses, presently an art butroutine in the near future, generates a tremendous amount of data [249]. Thisrequires judgment of the importance of these data for documentation and to
reduce data effectively without loss of valuable information. The reductionalgorithm must not be based on an intention to make one or the other variablea parameter, it must rather keep a true image of the real data. We adopted asimple algorithm to achieve this goal (Fig. 30): all data – independent of whether measured or calculated – are treated as variables and kept in a circularbuffer (holding some 50 h) in the frequency with which they were generated.This volatile data base serves as a rapid graphical review of the short history.However, only values (data points) of variables that change significantly withtime are written into the archive. The significance of a change is judged by areasonably defined window for each variable – including all intended culture
parameters – the width of which is usually determined by the noise on therespective signal. In any instance, every “first” data point (of an experiment) isarchived, together with a time stamp. The next entry into the archive is madeonly if the variable moves outside the respective window which has been cen-tered around the last archived value; concomitantly, the window is re-centeredaround the new entry, and so on. This technique assures that all relevant chan-ges – including those not intended – of any considered variable are trapped andthat the dynamics of all signal trajectories is fully documented. The only draw-backs to this data treatment are that there is a need to time stamp every data
entry individually, resulting in non-equidistant data vectors. The benefits are adata-to-archive reduction of usually between 10–2 and 10–4 and the assurancethat no important data are lost.
52 B. Sonnleitner

8/8/2019 23689262 Bio Analysis and Bio Sensors for Bio Process Monitoring 66
http://slidepdf.com/reader/full/23689262-bio-analysis-and-bio-sensors-for-bio-process-monitoring-66 59/236
6
Conclusions
The undelayed evaluation of state of a culture by using software sensors andcomputers, based on the quantitative analytical information provided by hard-ware sensors and intelligent analytical subsystems, constitutes an excellentbasis for targeted process control. Experts – either human or computer – havethe data and the deterministic knowledge to trace observed behavior back tothe physical, chemical and physiological roots thereby gaining a qualitative im-provement of bioprocess control, a quantum leap: process control can act on thecauses of effects rather than just cure symptoms. A simple standard operating
procedure [398] has proven useful, namely:
– measure everything that can be measured at the very beginning of processdevelopment,
– decide whether or not a variable is relevant,
Instrumentation of Biotechnological Processes 53
Fig. 30. Schematic design of a simple but very useful and efficient data reduction algorithm.Data representing the time trajectory of an individual variable are only kept (= recorded,stored) when the value leaves a permissive window which is centered around the last stored
value. If this happens, the new value is appended to the data matrix and the window is re-centered around this value. This creates a two-column matrix for each individual variablewith the typical time stamps in the first column and the measured (or calculated) values inthe second column. In addition, the window width must be stored since it is typical for anindividual variable. This algorithm assures that no storage space is wasted whenever thevariable behaves as a parameter (i.e. does not change significantly with time, is almost con-stant) but also assures that any rapid and/or singular dynamic behavior is fully documented.No important information is then lost

8/8/2019 23689262 Bio Analysis and Bio Sensors for Bio Process Monitoring 66
http://slidepdf.com/reader/full/23689262-bio-analysis-and-bio-sensors-for-bio-process-monitoring-66 60/236
– determine the relevant variables to be measured, controlled and/or docu-mented, and
– collect all raw data at any time and distinguish on-line between variable andparameter behavior, organize an archive of all these data accordingly and do
not discard seemingly useless data since they contribute to the treasure of experience.
If it is, as some people say, correct that today’s bioengineering with all its toolsand methodologies is too slow and not efficient enough, then it is all the moreurgent to improve the performance of the methods, tools and equipment cur-rently available and to invent new and better ones. In essence, techniques of instrumentation, operation, and causal-analytical interpretation of measure-ments need massive impulses.
Acknowledgements. Financial support of this work by the Swiss Priority Program in Biotechnology is greatly acknowledged.
References
1. Aberl F, Modrow S, Wolf H, Koch S, Woias P (1992) Sensors and Actuators B 6:1862. Ackermann JU, Muller S, Losche A, Bley T, Babel W (1995) J Biotechnol 39: 93. Acuna G, Latrille E, Beal C, Corrieu G, Cheruy A (1994) Biotechnol Bioeng 44: 11684. Agayn VI, Walt DR (1993) Bio/Technology 11:726
5. Ahlmann N, Niehoff A, Rinas U, Scheper T, Schügerl K (1986) Anal Chim Acta 190:2216. Alberghina L, Porro D (1993) Yeast 9:8157. Albiol J, Campmajo C, Casas C, Poch M (1995) Biotechnol Prog 11:888. Andrew KN, Blundell NJ, Price D, Worsfold PJ (1994) Anal Chem 66: A9169. Arnold MA, Meyerhoff ME (1988) CRC Crit Rev Anal Chem 20:149
10. Arnold MA, Ostler TJ (1986) Anal Chem 58:113711. Asami K, Yonezawa T (1995) BBA-Gen Subjects 1245: 9912. Attridge JW, Leaver KD, Cozens JR (1987) J Phys E Sci Instrum 20: 54813. Auberson LCM, Kanbier T, Stockar U von (1993) J Biotechnol 29: 20514. Axelsson JP, Münch T, Sonnleitner B (1992) In: Karim N (ed) Computer applications in
fermentation technology – modelling and control of bioprocesses. Pergamon, p 383
15. Bailey JE, Shanks JV (1991) Bioprocess Eng 6: 27316. Barnbot SB, Lakowicz JR, Rao G (1995) TIBTECH 13:10617. Bataillard P, Steffgen E, Haemmerli S, Manz A, Widmer HM (1993) Biosens Bioelectron
8:8918. Bavouzet JM, Lafforguedelorme C, Fonade C, Goma G (1995) Enzyme Microb Technol
17:71219. Baxter PJ, Christian GD, Ruzicka J (1995) Chem Anal 40:45520. Beck HP, Wiegand C (1995) Fresenius J Anal Chem 351:70121. Bedard C, Jolicoeur M, Jardin B,Tom R, Perret S, Kamen A (1994) Biotechnol Tech 8: 60522. Bennetto HP, Box J, Delaney GM, Mason JR, Roller SD, Stirling JL, Thurston CF (1987)
Redox-mediated electrochemistry of whole microorganisms: from fuel cells to bio-sensors. Oxford Scientific Publishers, Oxford, p 291
23. Benthin S, Nielsen J, Villadsen J (1992) Biotechnol Bioeng 40:13724. Berger A, Blum LJ (1994) Enzyme Microb Technol 16: 97925. Bergveld P (1989) J Phys E Sci Instr 22: 67826. Berovic M (1987) In: Otocec YU (ed) Bioreactor engineering course. Boris Kidric and
Slov Chemical Society, p 327
54 B. Sonnleitner

8/8/2019 23689262 Bio Analysis and Bio Sensors for Bio Process Monitoring 66
http://slidepdf.com/reader/full/23689262-bio-analysis-and-bio-sensors-for-bio-process-monitoring-66 61/236
27. Berrada R, Dauphin G, David L (1987) J Org Chem 52:238828. Betz JW, Aretz W, Härtel W (1984) Cytometry 5:14529. Beyeler W, Einsele A, Fiechter A (1981) Eur J Appl Microbiol Biotechnol 13:1030. Birnbaum S, Bülow L, Hardy K, Danielsson B, Mosbach K (1986) Anal Biochem 158:1231. Birou B, Marison IW, Stockar U von (1987) Biotechnol Bioeng 30: 650
32. Birou B, Marison IW, Stockar U von (1987) Biotechnol Bioeng 30: 65033. Birou B, Stockar U von (1989) Enzyme Microb Technol 11:1234. Block DE, Eitzman PD, Wangensteen JD, Srienc F (1990) Biotechnol Progr 6 :50435. Bloem J, Veninga M, Shepherd J (1995) Appl Environ Microbiol 61: 92636. Boe I, Lovrien R (1990) Biotechnol Bioeng 35:137. Bomio M, Sonnleitner B, Fiechter A (1989) Appl Microbiol Biotechnol 32:35638. Bonarius HPJ, Degooijer CD, Tramper J, Schmid G (1995) Biotechnol Bioeng 45: 52439. Bonarius HPJ, Timmerarends B, deGooijer CD, Tramper J (1998) Biotechnol Bioeng
58:25840. Bormann EJ (1988) J Theor Biol 133: 21541. Botrè C, Botrè F (1990) Anal Biochem 185: 254
42. Bradley J, Turner APF, Schmid RD (1989) GBF Monographs 13: 8543. Brandt J, Hitzmann B (1993) Am Biotechnol Lab 11: 7844. Brewster JD, Maxwell RJ, Hampson JW (1993) Anal Chem 65: 213745. Briasco CA, Ross DA, Robertson CR (1990) Biotechnol Bioeng 36: 87946. Brookman JSG (1969) Biotechnol Bioeng 6:32347. Bruinenberg PM (1986) Antonie v Leeuwenhoek 52: 41148. Busch M, Schmidt J, Rothen SA, Leist C, Sonnleitner B,Verpoorte S (1996) Proc 2nd Int
Symp Miniaturized Total Analysis Systems (TAS96), 19–22 Nov 1996, Basel, (AnalyticalMethods and Instrumentation, Special Issue 1996, Widmer HM, Verpoorte E, Barnard S(eds), p 120
49. Caldarone EM, Buckley LJ (1991) Anal Biochem 199:137
50. Caldwell KD (1986) Abstr Pap Am Chem Soc 192 Meet ISEC 4651. Caldwell KD, Cheng ZQ, Hradecky P, Giddings JC (1984) Cell Biophys 6: 23352. Camelbeeck JP, Comberbach DM, Goossens J, Roelants P (1988) Biotechnol Tech 2:18353. Campmajo C, Cairo JJ, Sanfeliu A, Martinez E,Alegret S, Godia F (1994) Cytotechnology
14:17754. Carlsen M, Johansen C, Min RW, Nielsen J, Meier H, Lantreibecq F (1993) Anal Chim Acta
279:5155. Castro CD, Meehan AJ, Koretsky AP, Domach MM (1995) Appl Environ Microbiol
61:444856. Chauvatcharin S, Konstantinov KB, Fujiyama K, Seki T, Yoshida T (1995) J Ferment
Bioeng 79:46557. Chauvatcharin S, Seki T, Fujiyama K, Yoshida T (1995) J Ferment Bioeng 79: 26458. Chéruy A (1997) J Biotechnol 52:19359. Chong K, Loughlin T, Moeder C, Perpall HJ, Thompson R, Grinberg N, Smith GB,
Bhupathy M, Bicker G (1996) J Pharm Biomed Anal 15:11160. Christensen H, Bakken LR, Olsen RA (1993) FEMS Microbiol Ecol 102:12961. Christensen H, Olsen RA, Bakken LR (1995) Microbiol Ecol 29:4962. Christensen LH, Mandrup G, Nielsen J, Villadsen J (1994) Anal Chim Acta 296:5163. Comas J,VivesRego J (1998) J Microbiol Meth 32: 4564. Comberbach DM, Bu’lock JD (1983) Biotechnol Bioeng 25: 250365. Combrier E, Metezeau P, Ronot X, Gachelin H, Adolphe M (1989) Cytotechnology 2: 2766. ComTec GmbH, Technologiezentrum Jülich (1997) BioWorld 2/97: 22 and 3/97:3967. Connolly P, Lewis SJ, Corry JEL (1988) Int J Food Microbiol 7:31
68. Cook PD, Gao YP, Smith R, Toube TP, Utley JHP (1995) J Mater Chem 5: 41369. Copella SJ, Wang DIC (1990) Biotechnol Tech 4:16170. Cordier JL, Butsch BM, Birou B, Stockar U von (1987) Appl Microbiol Biotechnol 25:30571. Cortassa S, Aon JC,Aon MA (1995) Biotechnol Bioeng 47:19372. Cox RP (1987) Mass Spectrom Biotechnol Process Anal Contr 63
Instrumentation of Biotechnological Processes 55

8/8/2019 23689262 Bio Analysis and Bio Sensors for Bio Process Monitoring 66
http://slidepdf.com/reader/full/23689262-bio-analysis-and-bio-sensors-for-bio-process-monitoring-66 62/236
73. Crissman HA, Steinkamp JA (1993) Europ J Histochem 37:12974. Danigel H. (1995) Opt Eng 34: 266575. DaPra E, Schneider K, Bachofen R (1989) Experientia 45:102476. Darzynkiewicz Z (1994) In: Celis JE (ed) Cell biology. A laboratory handbook, vol 1.
Academic Press, San Diego, p 261
77. Darzynkiewicz Z. (1994) In: Darzynkiewicz Z,Robinson JP, Crissman HA (eds) Methodsin cell biology, vol 41. Academic Press
78. Davey HM, Jones A, Shaw AD, Kell DB (1999) Cytometry 35:16279. Deboux BJC, Lewis E, Scully PJ, Edwards R (1994) Optical Fibre Sensors Conference,
Glasgow, p 680. Decastro MDL,Valcarcel M (1995) In: Hurst WJ (ed) Automation in the laboratory. VCH81. Decristoforo G (1988) Methods Enzymol 137:19782. Degelau A, Scheper T, Bailey JE, Guske C (1995) App Microbiol Biotechnol 42: 65383. Dehghani M, Bulmer M, Gregory ME, Thornhill NF (1995) Bioprocess Eng 13:23984. de Koning W, vanDam K (1992) Anal Biochem 204:11885. Delaguardia M (1995) Mikrochim Acta 120: 243
86. Desgranges C, Georges M, Vergoignan C, Durand A (1991) Appl Microbiol Biotechnol35:206
87. Dien BS, Srienc F (1991) Biotechnol Prog 7: 29188. Dijkema C, Vries SC de, Booij H, Schaafsma TJ, Kammen A van (1988) Plant Physiol
88:133289. Ding T, Schmid RD (1990) Anal Chim Acta 234: 24790. Doherty SJ, Winniford WL (1994) LC-GC12: 84691. Donaldson TL, Palmer HJ (1979) AIChE 25:14392. Droste RL, Sanchez WA (1983) Water Res 17: 97593. Duggleby RG (1991) TIBS FEB 91: 5194. Dullau T, Reinhardt B, Schügerl K (1989) Anal Chim Acta 225: 253
95. Durant G, Cox PW, Formisyn P, Thomas CR (1994) Biotechnol Tech 8: 75996. Ebina Y, Ekida M, Hashimoto H (1989) Biotechnol Bioeng 33:129097. Edwards AG, Ho CS (1988) Biotechnol Bioeng 32:198. Edwards C, Diaper J, Porter J, Deere D, Pickup R (1994) In: Ritz K, Dighton J, Giller KE
(eds) Beyond the biomass. Wiley, Chichester, p 5799. Effenhauser CS, Manz A, Widmer HM (1993) Anal Chem 65:2637
100. Eggeling L, Graaf A de, Sahm H, Eikmanns B, Marx A, Wiechert W (1995) ECB7, Nice,France, MAC66
101. Englbrecht U, Schmidt HL (1992) J Chem Technol Biotechnol 53 :397102. Englbrecht U, Schmidt HL (1995) J Chem Technol Biotechnol 62: 68103. Eyer K, Oeggerli A, Heinzle E (1995) Biotechnol Bioeng 45:54104. Fang LL, Zhang R, Williams ER, Zare RN (1994) Anal Chem 66: 3696105. Fardeau ML, Plasse F, Belaich JP (1980) Eur J Appl Microbiol Biotechnol 10 :133106. Fatt I (1976) Polarographic oxygen sensors. CRC Press Inc, Cleveland, OH, USA107. Fehrenbach R, Comberbach M, Pêtre JO (1992) J Biotechnol 23: 303108. Fernandez EJ, Clark DS (1987) Enzyme Microb Technol 9:259109. Fernandez EJ, Mancuso A, Clark DS (1988) Biotechnol Prog 4:173110. Fiechter A, Sonnleitner B (1994) Adv Microb Physiol 36:145111. Filippini C, Moser JU, Sonnleitner B, Fiechter A (1991) Anal Chim Acta 255: 91112. Filippini C, Sonnleitner B, Fiechter A (1992) Anal Chim Acta 265: 63113. Filippini C, Sonnleitner B, Fiechter A, Bradley J, Schmid RD (1991) J Biotechnol
18:153114. Forster RJ, Diamond D (1992) Anal Chem 64:1721
115. Frandsen S,Nielsen J,Villadsen J (1994) In: Alberghina L, Frontali L, Sensi P (eds) ECB6:Proceedings of the 6th European Congress on Biotechnology. p 887
116. Fredrickson AG, Hatzis C, Srienc F (1992) Cytometry 13:423117. Fry JC (1990) Methods Microbiol 22: 41118. Fuhrmann GF, Völker B (1992) J Biotechnol 27:1
56 B. Sonnleitner

8/8/2019 23689262 Bio Analysis and Bio Sensors for Bio Process Monitoring 66
http://slidepdf.com/reader/full/23689262-bio-analysis-and-bio-sensors-for-bio-process-monitoring-66 63/236
119. Furukawa K, Heinzle E, Dunn IJ (1983) Biotechnol Bioeng 25: 2293120. Galaev IY, Mattiasson B (1993) Enzyme Microb Technol 15:354121. Galazzo JL, Shanks JV, Bailey JE (1990) Biotechnol Bioeng 35:1164122. Garn M, Gisin M, Thommen C, Cevey P (1989) Biotechnol Bioeng 34: 423123. Gary K, Meier P, Ludwig K (1988) Canbiocon 1988 Biotechnol Res Appl:155
124. George S, Larsson G, Enfors SO (1994) In: Alberghina L, Frontali L, Sensi P (eds) ECB6:Proceedings of the 6th European Congress on Biotechnology, vol 2, p 883
125. Geppert G, Thielemann H (1984) Acta Biotechnol 4: 361126. Geppert G, Thielemann H, Langkopf G (1989) Acta Biotechnol 9 :541127. Gere DR, Knipe CR, Castelli P, Hedrick J, Frank LGR, Schulenbergschell H, Schuster R,
Doherty L, Orolin J, Lee HB (1993) J Chromatogr Sci 31: 246128. Giddings JC (1995) Anal Chem A 67: 592129. Giddings JC (1989) J Chromatogr 470: 327130. Giddings JC (1993) Science 260:1456131. Giddings JC, Moon MH (1991) Anal Chem 63:2869132. Giddings JC,Yang FJ, Myers MN (1977) J Virol 21:131
133. Gillies RJ, MacKenzie NE, Dale BE (1989) Bio/Technology 7: 50134. Gollmer K, Posten C (1995) In: Munack A, Schügerl K (eds) CAB6 preprints, Garmisch-
Partenkirchen, D:41135. Goodacre R, Trew S, Wrigleyjones C, Saunders G, Neal MJ, Porter N, Kell DB (1995) Anal
Chim Acta 313:25136. Gorczyca W, Melamed MR, Darzynkiewicz Z (1998) In: Jaroszeski MJ, Heller R (eds)
Flow cytometry protocols, vol 91. p 217137. Gorlach E, Richmond R, Lewis I (1998) Anal Chem 70:3227138. Griot M, Heinzle E, Dunn IJ, Bourne JR (1987) Mass Spectrom Biotechnol Process Anal
Contr 75139. Groboillot A, Pons MN, Engasser JM (1989) Appl Microbiol Biotechnol 32: 37
140. Gschwend K, Beyeler W, Fiechter A (1983) Biotechnol Bioeng 25:2789141. Guilbault GG, Luong JH (1988) J Biotechnol 9:1142. Guilbault GG, Luong JHT (1989) Selective Electrode Rev 11:3143. Gurev IA, Zyuzina LF, Lazareva OP (1995) J Anal Chem Engl Tr 50:765144. Haemmerli S, Schaeffler A, Manz A, Widmer HM (1992) Sens Actuators B 7:404145. Hall EAH (1986) Enzyme Microb Technol 8:651146. Hammer BE, Heath CA, Mirer SD, Belfort G (1990) Bio/Technol 8: 327147. Hansen EH (1995) Anal Chim Acta 308: 3148. Harder A, Roels JA (1982) Adv Biochem Eng 21:56149. Harris CM, Kell DB (1985) Biosensors 1:17150. Harris CM, Todd RW, Bungard SJ, Lovitt RW, Morris JG, Kell DB (1987) Enzyme Microb
Technol 9:181151. Hartbrich A, Schmitz G, Weusterbotz D, Degraaf AA, Wandrey C (1996) Biotechnol
Bioeng 51:624152. Hatch RT, Veilleux BG (1995) Biotechnol Bioeng 46:371153. Hatch RT, Wilder C, Cadman TW (1979) Biotechnol Bioeng Symp 9: 25154. Hauser PC, Rupasinghe TWT, Cates NE (1995) Talanta 42: 605155. Hayward MJ, Kotiaho T, Lister AK, Cooks RG, Austin GD, Narayan R (1990) Anal Chem
62:1798156. Heijnen JJ, Terwisscha van Scheltinga AH, Straathof AJ (1992) J Biotechnol 22: 3157. Heinzle E (1987) Adv Biochem Eng/Biotechnol 35:1158. Heinzle E (1992) J Biotechnol 25: 81159. Heinzle E, Kramer H, Dunn IJ (1985) Biotechnol Bioeng 27:238
160. Heinzle E, Moes J, Griot M, Sandmeier E, Dunn IJ, Bucher R (1986) Ann NY Acad Sci469:178
161. Heinzle E, Oeggerli A, Dettwiler B (1990) Anal Chim Acta 238:101162. Heinzle E, Reuss M (eds) (1987) Mass spectroscopy in biotechnological analysis and
control
Instrumentation of Biotechnological Processes 57

8/8/2019 23689262 Bio Analysis and Bio Sensors for Bio Process Monitoring 66
http://slidepdf.com/reader/full/23689262-bio-analysis-and-bio-sensors-for-bio-process-monitoring-66 64/236
163. Hemert P van, Kilburn DG, Righelato RC, Wezel AL van (1969) Biotechnol Bioeng 6: 549164. Henschke PA, Thomas DS (1988) J Appl Bacteriol 64:123165. Herbert RA (1990) Methods Microbiol 22:1166. Hernandez O, Jimenez AI, Jimenez F, Arias JJ (1995) Anal Chim Acta 310: 53167. Hewitt CJ, Boon LA, McFarlane CM, Nienow AW (1998) Biotechnol Bioeng 59: 612
168. Hibino W, Kadotani Y, Kominami M, Yamane T (1993) J Ferment Bioeng 75 :169. Higgins IJ, Cardosi MF, Turner APF (1988) NATO ASI SerA 128, Perspectives Biotechnol
p 55170. Hirose Y (1986) Prog Ind Microbiol 24: 67171. Hitzmann B, Lammers F, Weigel B, Putten A van (1993) BioForum 16: 450172. Hitzmann B, Lohn A, Reinecke M, Schulze B, Scheper T (1995) Anal Chim Acta 313: 55173. Holm-Hansen O (1973) Bull Ecol Res Comm (Stockholm) 17: 215174. Holzhauer-Rieger K, Zhou W, Schügerl K (1990) J Chromatogr 499: 609175. Hong K, Tanner RD, Malaney GW, Wilson DJ (1987) Proc Biochem 22:149176. Hooijmans CM,Abdin TA, Alaerts GJ (1995) Appl Microbiol Biotechnol 43:781177. Hooker AD, Goldman MH, Markham NH, James DC, Ison AP, Bull AT, Strange PG,
Salmon I, Baines AJ, Jenkins N (1995) Biotechnol Bioeng 48: 639178. Hopkins D, Hatch RT (1990) Abstr Pap Am Chem Soc 199 Meet, part 1, BIOT115179. Horvath JJ, Enriquez-Ortiz AB, Semerjian HG (1989) Abstr Pap Am Chem Soc 198 Meet,
MBTD65180. Huang Z, Poulter CD, Wolf FR, Somers TC, White JD (1988) J Am Chem Soc 110:3959181. Huller R, Glossner E, Schaub S,Weingartner J, Kachel V (1994) Cytometry 17:109182. Humphrey AE (1988) Aust J Biotechnol 2 :141183. Iijima S, Yamashita S, Matsunaga K, Miura H, Morikawa M, Shimizu K, Matsubara M,
Kobayashi T (1987) J Chem Technol Biotechnol 40:203184. Inoue Y, Sano F, Nakamura K,Yoshie N, Saito Y, Satoh H, Mino T, Matsuo T, Doi Y (1996)
Polym Int 39:183
185. Isaacs SH, Soeberg H, Christensen LH,Villadsen J (1992) Chem Eng Sci 47:1591186. Isenschmid A, Marison IW, Stockar U von (1995) J Biotechnol 39:229187. Iversen JJL, Thomsen JK, Cox RP (1994) Appl Microbiol Biotechnol 42: 256188. Jacobsen CN, Fremming C, Jakobsen M (1997) J Microbiol Meth 31: 75189. Jan S, Roblot C, Courtois J, Courtois B, Barbotin JN, Seguin JP (1996) Enzyme Microb
Technol 18:195190. Jayat C, Ratinaud MH (1993) Biology of the Cell 78:15191. Jee HS, Nishio N, Nagai S (1987) J Gen Appl Microbiol 33: 401192. Jobst G, Urban G, Jachimowicz A, Kohl F, Tilado O, Lettenbichler I, Nauer G (1993)
Biosens Bioelectron 8:123193. Jolicoeur C, To TC, Beaubien A, Samson R (1988) Anal Chim Acta 213:165194. Jones JG, Zhou DM (1994) Biotechnol Adv 12: 693195. Jones RP, Greenfield PF (1982) Enzyme Microb Technol 4 :210196. Jorgensen H, Nielsen J, Villadsen J, Mollgaard H (1995) Biotechnol Bioeng 46:117197. Joy RW, Mcintyre DD, Vogel HJ, Thorpe TA (1996) Physiol Plant 97 :149198. Ju LK, Ho CS (1988) Biotechnol Bioeng 31:995199. Ju LK, Yang X, Lee JF, Armiger WB (1995) Biotechnol Progr 11:545200. Juan G, Darzynkiewicz Z (1998) In: Celis JE (ed) Cell biology. A laboratory handbook.
Academic Press, San Diego, p 261201. Junker BH, Wang DIC, Hatton TA (1988) Biotechnol Bioeng 32: 55202. Kadotani Y, Miyamoto K, Mishima N, Kominami M, Yamane T (1995) J Ferment Bioeng
80:63203. Kalnenieks U, Degraaf AA, Bringermeyer S, Sahm H (1993) Arch Microbiol 160:74
204. Kapuscinski J. (1995) Biotech Histochem 70:220205. Karube I, Nomura Y, Arikawa Y (1995) TRAC 14: 295206. Karube I, Sode K, Tamiya E (1989) Swiss Biotech 7 :25207. Karube I, Sode K, Tamiya E, Gotoh M, Kitagawa Y, Suzuki H (1988) 8th Int Biotechnol
Symp, part 1, p 537
58 B. Sonnleitner

8/8/2019 23689262 Bio Analysis and Bio Sensors for Bio Process Monitoring 66
http://slidepdf.com/reader/full/23689262-bio-analysis-and-bio-sensors-for-bio-process-monitoring-66 65/236
208. Karube I, Tamiya E, Sode K, Yokoyama K, Kitagawa Y, Suzuki H (1988) Anal Chim Acta213:69
209. Karube I, Yokoyama K, Sode K, Tamiya E (1989) Anal Lett 22:791210. Kasthurikrishnan N, Cooks RG (1995) Talanta 42:1325211. Kato C, Sato T, Horikoshi K (1995) Biodiversity and Conservation 4:1
212. Kätterer L (1983) PhD thesis 7172, ETH Zürich213. Kell D, Markx GH, Davey CL, Todd RW (1990) TRAC 9:190214. Kell DB, Ryder HM, Kaprelyants AS,Westerhoff HV (1991) Antonie v Leeuwenhoek Int J
Gen Molec Microbiol 60:145215. Kell DB, Sonnleitner B (1995) TIBTECH 13:481216. Kirkland JJ, Rementer SW, Yau WW (1988) Anal Chem 60:610217. Kirkland JJ, Yau WW (1991) J Chromatogr 550:799218. Kjaergaard L (1977) Adv Biochem Eng 7:131219. Konstantinov K, Chuppa S, Sajan E, Tsai Y, Yoon S, Golini F (1994) TIBTECH 12:324220. Konstantinov KB, Yoshida T (1992) Biotechnol Bioeng 39:479221. Kromenaker SJ, Srienc F (1991) Biotechnol Bioeng 38: 665
222. Kroner KH (1988) Fresenius Z Anal Chem 329: 718223. Kruth HS (1982) Anal Biochem 125:225224. Kubitschek HE (1969) Methods Microbiol 1: 593225. Kullick T, Beyer M, Henning J, Lerch T, Quack R, Zeitz A, Hitzmann B, Scheper T,
Schügerl K (1994) Anal Chim Acta 296:263226. Kuriyama H, Mahakarnchanakul W, Matsui S, Kobayashi H (1993) Biotechnol Lett
15:189227. Kwong SCW, Randers L, Rao G (1993) App Environ Microbiol 59: 604228. Lacoursiere A, Thompson BG, Kole MM, Ward D, Gerson DF (1986) Appl Microbiol
Biotechnol 23 :404229. Langwost B, Kresbach GM, Scheper T, Ehrat M, Widmer HM (1995) ECB7, Nice, France,
poster230. Larsson G (1990) PhD thesis, Royal Institute of Technology, Stockholm231. Larsson C, Stockar U von, Marison I, Gustafsson L (1995) Thermochim Acta 251:99232. Lee C, Lim H (1980) Biotechnol Bioeng 22:639233. Lenz R, Boelcke C, Peckmann U, Reuss M (1986) In: Johnson,A (ed) Proc 1st Modelling
Contr Biotechnol Process, Helsinki, Pergamon Press, Oxford, p 85234. Li J, Gomez P, Humphrey A (1990) Biotechnol Tech 4:293235. Liden G, Jacobsson V, Niklasson C (1993) App Biochem Biotechnol 38: 27236. Liebeskind M, Dohmann M (1994) Water Sci Technol 29:7237. Lindahl B, Gullberg B (1991) Anticancer Research 11: 397238. Lindberg W, Ruzicka J, Christian GD (1993) Cytometry 14: 230239. L’Italien Y, Thibault J, LeDuy A (1989) Biotechnol Bioeng 33 :471240. Litzen A, Garn MB, Widmer HM (1994) J Biotechnol 37: 291241. Litzen A,Wahlund KG (1991) J Chromatogr 548: 393242. Ljunggren E, Karlberg B (1995) J Autom Chem 17:105243. Lloyd D, Whitmore TN (1988) Lett Appl Microbiol 6: 5244. Locher G, Hahnemann U, Sonnleitner B, Fiechter A (1993) J Biotechnol 29: 57245. Locher G, Hahnemann U, Sonnleitner B, Fiechter A (1993) J Biotechnol 29: 75246. Locher G, Sonnleitner B, Fiechter A (1990) Bioproc Eng 5:181247. Locher G, Sonnleitner B, Fiechter A (1992) J Biotechnol 25: 55248. Locher G, Sonnleitner B, Fiechter A (1992) J Biotechnol 25: 23249. Locher G, Sonnleitner B, Fiechter A (1992) Proc Contr Qual 2 :257250. Lohmeier-Vogel EM, Hahn-Hägerdahl B, Vogel HJ (1986) Appl Microbiol Biotechnol
25:43251. Lohmeier-Vogel EM, Hahn-Hägerdal B,Vogel HJ (1995) App Environ Microbiol 61:1414252. Lohmeier-Vogel EM, Skoog K, Vogel H, Hahn-Hägerdahl B (1989) Appl Environ
Microbiol 55:1974253. Lopez JM, Koopman B, Bitton G (1986) Biotechnol Bioeng 28:1080
Instrumentation of Biotechnological Processes 59

8/8/2019 23689262 Bio Analysis and Bio Sensors for Bio Process Monitoring 66
http://slidepdf.com/reader/full/23689262-bio-analysis-and-bio-sensors-for-bio-process-monitoring-66 66/236
254. Lopez JM, Koopman B, Bitton G (1986) J Environ Eng 109: 915255. Lovrien RE, Williams KK, Ferrey ML, Ammend DA (1987) Appl Environ Microbiol
53:2935256. Lüdi H, Garn MB, Bataillard P, Widmer HM (1990) J Biotechnol 14 :71257. Luong JHT, Carrier DJ (1986) Appl Microbiol Biotechnol 24 :65
258. Luong JHT, Volesky B (1982) Eur J Appl Microbiol Biotechnol 16:28259. Maclaurin P, Worsfold PJ, Norman P, Crane M (1993) Analyst 118: 617260. Maddox J (1994) Nature 368: 95261. Maftah A, Huet O, Gallet PF, Ratinaud MH (1993) Biology of the Cell 78: 85262. Mailinger W, Schütz M, Reuss M (1993) BIOforum 16:336263. Manz A, Verpoorte E, Effenhauser CS, Burggraf N, Raymond DE, Harrison DJ, Widmer
HM (1993) HRC – J High Resolut Chromatogr 16:433264. Marison I, Stockar U von (1989) Adv Biochem Eng/Biotechnol 40: 93265. Markx GH, Davey CL, Kell DB (1991) J Gen Microbiol 137:735266. Markx GH, Kell DB (1995) Biotechnol Prog 11:64267. Matanguihan RM, Konstantinov KB,Yoshida T (1994) Bioprocess Eng 11: 213
268. Mattiasson B, Hakanson H (1993) TIBTECH 11:136269. Mcgown LB, Hemmingsen SL, Shaver JM, Geng L (1995) Appl Spectrosc 49: 60270. McLaughlin JK, Meyer CL, Papoutsakis ET (1985) Biotechnol Bioeng 27:1246271. Meehan AJ, Eseky CJ, Koretsky AP, Domach MM (1992) Biotechnol Bioeng 40:1359272. Meierschneiders M, Grosshans U, Busch C, Eigenberger G (1995) Appl Microbiol
Biotechnol 43:273. Melvin BK, Shanks JV (1996) Biotechnol Progr 12: 257274. Memmert K, Wandrey C (1987) Ann NY Acad Sci 506:631275. Mendes P, Kell DB, Welch GR (1995) In: Brindle K (ed) Enzymology in vivo (Advanced
molecular cell biology), vol 11. JAI Press, London, p 1276. Merchuk JC,Yona S, Siegel MH, Zvi AB (1990) Biotechnol Bioeng 35:1161
277. Merten OW, Palfi GE, Steiner J (1986) Adv Biotechnol Processes 6:111278. Mesaros JM, Gavin PF, Ewing AG (1996) Anal Chem 68: 3441279. Meschke J, Bennemann H, Herbst H, Dormeier S, Hempel DC (1988) Bioprocess Eng
3:151280. Meyer C, Beyeler W (1984) Biotechnol Bioeng 26: 916281. Meyer HP, Beyeler W, Fiechter A (1984) J Biotechnol 1:341282. Meyerjens T, Matz G, Märkl H (1995) App Microbiol Biotechnol 43:341283. Min RW, Nielsen J, Villadsen J (1995) Anal Chim Acta 312:149284. Mizutani F, Yabuki S (1994) Biosens Bioelectro 9:411285. Mizutani F, Yabuki S, Katsura T (1993) Sens Actuators B 13/14: 574286. Moes J,Griot M, Keller J,Heinzle E, Dunn IJ,Bourne JR (1985) Biotechnol Bioeng 27: 482287. Molin G (1983) Eur J Appl Microbiol Biotechnol 18: 214288. Möller J, Hiddessen R, Niehoff J, Schügerl K (1986) Anal Chim Acta 190:195289. Molt K (1992) GIT 36:107290. Montague G, Morris AJ (1994) Trends Biotechnol 12:312291. Montesinos JL, Campmajo C, Iza J, Valero F, Lafuente J, Sola C (1993) Biotechnol Tech
7:429292. Monzambe KM, Naveau HP, Nyns EJ, Bogaert N, Bühler H (1988) Biotechnol Bioeng
31:659293. Moskvin LN, Simon J (1994) Talanta 41:1765294. Muller S, Losche A, Bley T, Scheper T (1995) App Microbiol Biotechnol 43: 93295. Münch T, Sonnleitner B, Fiechter A (1992) J Biotechnol 24:299296. Munkholm C, Walt DR, Milanovich FP (1988) Talanta 35:109
297. Nagata R, Clark SA, Yokoyama K, Tamiya E, Karube I (1995) Anal Chim Acta 304:157298. Nagata R, Yokoyama K, Clark SA, Karube I (1995) Biosens Bioelectron 10: 261299. Natarajan A, Boxrud D, Dunny G, Srienc F (1999) J Microbiol Meth 34: 223300. Nestaas E, Wang DIC (1983) Biotechnol Bioeng 25:1981301. Neubauer P, Haggstrom L, Enfors SO (1995) Biotechnol Bioeng 47:139
60 B. Sonnleitner

8/8/2019 23689262 Bio Analysis and Bio Sensors for Bio Process Monitoring 66
http://slidepdf.com/reader/full/23689262-bio-analysis-and-bio-sensors-for-bio-process-monitoring-66 67/236

8/8/2019 23689262 Bio Analysis and Bio Sensors for Bio Process Monitoring 66
http://slidepdf.com/reader/full/23689262-bio-analysis-and-bio-sensors-for-bio-process-monitoring-66 68/236
349. Robertson BR, Button DK, Koch AL (1998) Appl Environ Microbiol 64: 3900350. Rodin JB, Lyberatos GK, Svoronos SA (1991) Biotechnol Bioeng 37:127351. Roessner D, Kulicke WM (1994) J Chromatogr A 687: 249352. Rohner M, Locher G, Sonnleitner B, Fiechter A (1988) J Biotechnol 9:11353. Rohner M, Meyer HP (1995) Bioprocess Eng 13: 69
354. Rothen SA, Saner M, Meenakshisundaram S, Sonnleitner B, Fiechter A (1996) JBiotechnol 50 :1
355. Rothen SA, Sauer M, Sonnleitner B, Witholt B (1998) Biotechnol Bioeng 58: 92356. Royce PN (1992) Biotechnol Bioeng 40:1129357. Rui CS, Sonomoto K, Ogawa HI, Kato Y (1993) Anal Biochem 210:163358. Ruzicka J (1994) Analyst 119:1925359. Ruzicka J, Hansen EH (1981) Flow injection analysis. Wiley, New York360. Ruzicka J, Lindberg W (1992) Anal Chem 64:A537361. Sakato K, Tanaka H, Samejima H (1981) Ann NY Acad Sci 369:321362. Salmon JM (1987) Biotechnol Tech 1:7363. Samson R, Beaumier D, Beaulieu C (1987) J Biotechnol 6:175
364. Sandmeier EP, Dunn IJ, Bourne JR, Heinzle E (1987) Eur Congr Biotechnol 3 :137365. Santos H (1995) ECB7, Nice, France, MAC65366. Sattur AP, Karanth NG, Divakar S (1988) Biotechnol Tech 2: 73367. Schallinger LE, Gray JE, Wagner LW, Knowlton S, Kirkland JJ (1985) J Chromatogr
342:67368. Scheper T (1991) Bioanalytik. Vieweg, Braunschweig369. Scheper T, Hitzmann B, Rinas U, Schügerl K (1987) J Biotechnol 5 :139370. Scheper T, Hoffmann H, Schügerl K (1987) Enzyme Microb Technol 9 :399371. Scheper T, Lorenz T, Schmidt W, Schügerl K (1987) Ann NY Acad Sci 506: 431372. Scheper T, Schügerl K (1986) J Biotechnol 3: 221373. Schill N, Stockar U von (1995) Thermochim Acta 251:71
374. Schmid RD, Künnecke W (1990) J Biotechnol 14: 3375. Schmidt E (1988) Appl Microbiol Biotechnol 27: 347376. Schmitz A, Eberhardt R, Spohn U, Weuster-Botz D, Wandrey C (1992) DECHEMA
Biotechnology Conferences 5:1117377. Schneider M, Marison IW, Stockar U von (1994) Enzyme Microb Technol 16:957378. Schügerl K (1991) Analytische Methoden in der Biotechnologie. Vieweg, Braun-
schweig379. Schügerl K, Hitzmann B, Jurgens H, Kullick T, Ulber R, Weigal B (1996) Trends Biotech
14:21380. Schulze U, Larsen ME,Villadsen J (1995) Anal Biochem 228:143381. Schuppenhauer MR, Kühne G, Tiefenauer L, Smala A, Dunn IJ (1994) 13th Meeting
European Society Animal Cell Technology (ESACT),Veldhoven, NL, p 5382. Scudder KM, Christian GD, Ruzicka J (1993) Exp Cell Res 205:197383. Shimizu H, Miura K, Shioya S, Suga K (1995) Biotechnol Bioeng 47:165384. Shiraishi F (1994) Enzyme Microb Technol 16:349385. Shu HC, Hakanson H, Mattiasson B (1995) Anal Chim Acta 300: 277386. Shulga AA, Gibson TD (1994) Anal Chim Acta 296:163387. Silman RW (1988) Abstr Pap Am Chem Soc 196 Meeting, MBTD81388. Simutis R, Havlik I, Dors M, Lübbert A (1993) Proc Contr Qual 4: 211389. Simutis R, Havlik I, Lübbert A (1993) J Biotechnol 27:203390. Simutis R, Havlik I, Schneider F, Dors M, Lübbert A (1995) CAB6, Garmisch-
Partenkirchen May 1995, preprints, p 59391. Smeraldi C, Berardi E, Porro D (1994) Microbiology-UK 140, part 11, p 3161
392. Smolenski W, Suflita JM (1987) J Microbiol Methods 6: 71393. Sonderhoff SA, Kilburn DG, Piret JM (1992) Biotechnol Bioeng 39: 859394. Sonnleitner B (1989) BTF – Biotech Forum 6:156395. Sonnleitner B (1991) Bioprocess Eng 6:187396. Sonnleitner B (1991) Antonie v Leeuwenhoek Int J Gen Molec Microbiol 60 :133
62 B. Sonnleitner

8/8/2019 23689262 Bio Analysis and Bio Sensors for Bio Process Monitoring 66
http://slidepdf.com/reader/full/23689262-bio-analysis-and-bio-sensors-for-bio-process-monitoring-66 69/236
397. Sonnleitner B (1993) In: Mortensen U, Noorman HJ (eds) Bioreactor performance.Biotechnology Research Foundation, Lund, Sweden, p 143
398. Sonnleitner B (1996) Adv Biochem Eng/Biotechnol 54 :155399. Sonnleitner B (1998) J Biotechnol 65: 47400. Sonnleitner B, Bomio M (1990) Biodegradation 1:133
401. Sonnleitner B, Fiechter A (1988) Anal Chim Acta 213:199402. Sonnleitner B, Fiechter A (1992) Adv Biochem Eng/Biotechnol 46:143403. Sonnleitner B, Fiechter A, Giovannini F (1984) Appl Microbiol Biotechnol 19 :326404. Sonnleitner B, Hahnemann U (1994) J Biotechnol 38: 63405. Sonnleitner B, Rothen SA, Kuriyama H (1997) Prog Biotechnol 13: 8406. Soper SA, Legendre BL,Williams DC (1995) Anal Chem 67:4358407. Spinnler HE,Bouillanne C, Desmazeaud MJ,Corrieu G (1987) Appl Microbiol Biotechnol
25:464408. Srienc F, Campbell JL, Bailey JE (1986) Cytometry 7:132409. Srienc F, Dien BS (1992) Biochemical Engineering VII Ann of NY Acad Sci 665:59410. Srinivas SP, Mutharasan R (1987) Biotechnol Letters 9 :139
411. Srinivas SP, Mutharasan R (1987) Biotechnol Bioeng 30:769412. Srinivasan N, Kasthurikrishnan N, Cooks RG, Krishnan MS, Tsao GT (1995) Anal Chim
Acta 316:269413. Stephanopoulos G, Locher G, Duff M (1995) In: Munack A, Schügerl K (eds) CAB6
preprints. Garmisch-Partenkirchen, D:195414. Stockar U von, Birou B (1989) Biotechnol Bioeng 34:86415. Stockar U von, Marison IW (1989) Adv Biochem Eng/Biotechnol 40: 93416. Stockar U von, Marison IW, Birou B (1988) 1st Swiss-Japanese joint meeting on bio-
process development, Interlaken, Switzerland417. Stöcklein W, Schmid RD (1990) Anal Chim Acta 234: 83418. Strässle C, Sonnleitner B, Fiechter A (1989) J Biotechnol 9:191
419. Strohhacker J, Degraaf AA, Schoberth SM, Wittig RM, Sahm H (1993) Arch Microbiol159:484420. Suda M, Sakuhara T, Karube I (1993) Appl Biochem Biotechnol 41: 3421. Suda M, Sakuhara T, Murakami Y, Karube I (1993) Appl Biochem Biotechnol 41:11422. Suhr H,Wehnert G, Schneider K,Bittner C,Scholz T, Geissler P, Jahne B,Scheper T (1995)
Biotechnol Bioeng 47:106423. Suleiman AA, Villarta RL, Guilbault GG (1993) Anal Lett 26:1493424. Suzuki T, Yamane T, Shimizu S (1986) J Ferment Technol 64 :317425. Svendsen CN (1993) Analyst 118:123426. Takiguchi N, Shimizu H, Shioya S (1997) Biotechnol Bioeng 55:170427. Tallarek U, vanDusschoten D,VanAs H, Guiochon G, Bayer E (1998) Angew Chem Int Ed
Engl 37:1882428. Tanaka H, Aoyagi H, Jitsufuchi T (1992) J Ferment Bioeng 73:130429. Taya M, Hegglin M, Prenosil JE, Bourne JR (1989) Enzyme Microb Technol 11:170430. Tellier C, Guillou-Charpin M, Grenier P, Botlan D le (1989) J Agric Food Chem 37: 988431. Thatipamala R, Rohani S, Hill GA (1994) J Biotechnol 38: 33432. Thatipamala R, Rohani S, Hill GA (1991) Biotechnol Bioeng 38:1007433. Theobald U, Mailinger W, Reuss M, Rizzi M (1993) Anal Biochem 214:31434. Thomanetz E (1982) Stuttgarter Berichte zur Siedlungswasserwirtschaft 74435. Thomas DC, Chittur VK, Cagney JW, Lim HC (1985) Biotechnol Bioeng 27: 729436. Tservistas M, Weigel B, Schügerl K (1995) Anal Chim Acta 316:117437. Ukeda H,Wagner G, Bilitewski U, Schmid RD (1992) J Agric Food Chem 40:2324438. Urban G, Jobst G, Aschauer E, Tilado O, Svasek P, Varahram M, Ritter C, Riegebauer J
(1994) Sens Actuators B 18 –19 :592439. Uttamlal M, Walt DR (1995) BioTechnology 13:597440. Vaija J, Lagaude A, Ghommidh C (1995) Antonie v Leeuwenhoek Int J Gen Molec
Microbiol 67:139441. Valero F, Lafuente J, Poch M, Sola C (1990) App Biochem Biotechnol 24/25: 591
Instrumentation of Biotechnological Processes 63

8/8/2019 23689262 Bio Analysis and Bio Sensors for Bio Process Monitoring 66
http://slidepdf.com/reader/full/23689262-bio-analysis-and-bio-sensors-for-bio-process-monitoring-66 70/236

8/8/2019 23689262 Bio Analysis and Bio Sensors for Bio Process Monitoring 66
http://slidepdf.com/reader/full/23689262-bio-analysis-and-bio-sensors-for-bio-process-monitoring-66 71/236
Electronic Noses for Bioreactor Monitoring
Carl-Fredrik Mandenius
Department of Physics and Measurement Technology; Linköping University,S-581 83 Linköping, SwedenE-mail: [email protected]
Electronic noses provide new possibilities for monitor the state of a cultivation non-in-vasively in real-time. The electronic nose uses an array of chemical gas sensors that monitorsthe off-gas from the bioreactor. By taking advantage of the off-gas components’ different af-
finities towards the sensors in the array it is possible with the help of pattern recognitionmethods to extract valuable information from the culture in a way similar to the human nose.For example, with artificial neural networks, metabolite and biomass concentration can bepredicted,the fermentability of a medium before starting the fermentation estimated, and thegrowth and production stages of the culture visualized. In this review these and other recentresults with electronic noses from monitoring microbial and cell cultures in bioreactors aredescribed.
Keywords. Artificial nose, Chemical multisensor array, Artificial neural network, Bioprocessmonitoring, Bioprocess control
1 Introduction . . . . . . . . . . . . . . . . . . . . . . . . . . . . . . . . 66
2 Methodology . . . . . . . . . . . . . . . . . . . . . . . . . . . . . . . . 67
2.1 Sensor Types . . . . . . . . . . . . . . . . . . . . . . . . . . . . . . . . 672.2 Sensor Array Systems . . . . . . . . . . . . . . . . . . . . . . . . . . . 692.3 Bioreactor Interface . . . . . . . . . . . . . . . . . . . . . . . . . . . . 692.4 Evaluation Methods . . . . . . . . . . . . . . . . . . . . . . . . . . . . 71
3 Application to Bioreactor Monitoring . . . . . . . . . . . . . . . . . . 73
3.1 Prediction of Metabolites and Other State Variables . . . . . . . . . . 743.2 Prediction of Media Quality . . . . . . . . . . . . . . . . . . . . . . . . 773.3 Visualization of Bioreactor State . . . . . . . . . . . . . . . . . . . . . 77
4 Conclusion . . . . . . . . . . . . . . . . . . . . . . . . . . . . . . . . . 81
References . . . . . . . . . . . . . . . . . . . . . . . . . . . . . . . . . . . . 81
List of Symbols and Abbreviations
ANN artificial neural networkCHO Chinese hamster ovary CP conductive polymer
Advances in Biochemical Engineering/Biotechnology,Vol. 66Managing Editor: Th. Scheper© Springer-Verlag Berlin Heidelberg 1999

8/8/2019 23689262 Bio Analysis and Bio Sensors for Bio Process Monitoring 66
http://slidepdf.com/reader/full/23689262-bio-analysis-and-bio-sensors-for-bio-process-monitoring-66 72/236
hGH human growth hormonehCAII human carboanhydrase IIhFVIII human blood coagulation factor VIIIMOS metal oxide semiconductor gas sensor
MOSFET metal oxide semiconductor field effect transistorPCA principal component analysisPLS partial least squareRMSE root mean square errorQCM quartz crystal microbalance
1Introduction
The quality of bioprocess products could be improved substantially by using
non-invasive real-time monitoring methods that could provide additional andnew information on the state of the culture in the bioreactor. The electronicnose technique provides such an opportunity. The concept of electronic nosewas introduced in 1982 by Persaud and Dodd [1]. They demonstrated how anarray of chemical gas sensors could be used to improve the capacity of analysisby taking advantage of the redundancy of information that is enclosed in theresponses from several sensors, all slightly different in affinity to the analyte(s).Furthermore, they analyzed the responses by using the powerful artificialneural networks (ANN) method allowing non-linear modeling of the complex
response pattern of the sensor array with training from known analyte con-centrations. In this way their system operated similarly to the human olfactory sensory organs with their molecular receptors linked to neurons that interpretthe signals on higher perception level, thereby justifying the term “electronicnose”.
Subsequently, other researchers developed the electronic nose idea with avariety of chemical gas sensor arrays using different pattern recognitiontechniques for improving the interpretation of responses [2–5].
The electronic nose arrays have today successfully been used in a vastnumber of applications. The electronic noses are particularly appealing in food
analysis since they resemble the traditional way of controlling the quality of foodstuffs. The electronic nose is already applied as a complement to sensory test panels in the food industry for product quality classification. Examples of applications are classification of grains [6] and beer [7]. Examples of otherconsumables tested are tobacco [8] and perfumes [9]. Applications in otherareas such as environmental control and pulp and paper quality are also re-ported in over five hundred references currently found in the literature onelectronic noses.
Although it would seem reasonable to apply the electronic noses for mea-
suring biological variables such as metabolic products and microbial activity,only a limited number of studies have been described. Of these, the followingcan be mentioned: detection of infection bacteria activity in ulcers [10], mi-crobial contamination in meat [11], classification of microbial strains [12, 13],and monitoring of bioreactors [14].
66 C.-F. Mandenius

8/8/2019 23689262 Bio Analysis and Bio Sensors for Bio Process Monitoring 66
http://slidepdf.com/reader/full/23689262-bio-analysis-and-bio-sensors-for-bio-process-monitoring-66 73/236
In this review, it is described how the electronic noses are applied to on-linebioreactor monitoring for meeting the requirement of non-invasive real-timemeasurement and facilitating rapid and safe data generation from microbialand cell cultivations.
2Methodology
Particularly when applied to bioreactor monitoring the electronic noses requirehigh quality sensors with long and stable operation, efficient signal processingand evaluation methods, and practical interfacing with the bioreactor. The cur-rently used sensor types and evaluation methods are summarized below.
2.1
Sensor Types
A variety of chemical gas sensors are or could be used in electronic nose in-struments. So far, successful results have been reached with conductive polymer(CP) sensors, metal oxide semiconductor (MOS) sensors, metal oxide semicon-ductor field effect transistor (MOSFET) sensors, quartz crystal microbalance(QCM) sensors, and infrared sensors.
The MOS sensors [15] are based on reactions taking place on electrochemi-cally active metal oxide surfaces (e.g. tin oxide, copper oxide). The selectivity
and sensitivity of the surface are modulated by oxide composition, amounts of trace elements, e.g. palladium, gold or rhodium, and operating temperatures,normally in the 100– 400 °C range. The MOS sensors exhibit varying sensitivity towards organic compounds and the analyte affinity to the surface is more orless affected by its chemical properties. Examples of typical analytes to whichselectivity can be attained are hydrogen,carbon monoxide, ammonia,hydrogensulfide, nitrogen oxide, sulfurous compounds, alcohols, and hydrocarbons.Sensitivity is in the 10–10,000 ppm range depending on the analyte. The MOSsensors are manufactured by several commercial vendors for diverse practicalpurposes such as smoke alarms, methane detection in mines, and combustion
control (e.g. Figaro Inc., Japan; Capture Ltd., UK; F I S Inc., Japan).By covering a silicon oxide field effect transistor with a thin film of a catalytic
metal, analytical properties of the transistor device can be obtained [16]. Anumber of organic and inorganic compounds can be catalytically decomposedon such a surface resulting in dipoles that cause shifts in the capacitance of thesemiconductor device. The selectivity of the MOSFET sensors is modulated by using different catalytic metals, e.g. palladium, iridium, platinum, thereby rendering them sensitive to hydrogen, ammonia, alcohols, aldehydes, sulfides,and other degradable molecules. Typical range of sensitivity is 1–1000 ppm.
CP sensors [17] exploit the electrochemical properties of compounds such aspolypyrrole and polyindole. Films of the polymers are deposited on electricalconductor components. When analyte molecules are absorbed into the film theconductivity changes. The activity of CP films is fine-tuned by derivatizing thepolymer with different functional groups thereby rendering the CP sensors
Electronic Noses for Bioreactor Monitoring 67

8/8/2019 23689262 Bio Analysis and Bio Sensors for Bio Process Monitoring 66
http://slidepdf.com/reader/full/23689262-bio-analysis-and-bio-sensors-for-bio-process-monitoring-66 74/236
selective to numerous chemical compounds. Films of CP such as poly(N -me-thylpyrrole), poly(5-carboxyindole), and poly(3-methylthiophene) have beenshown to discriminate between electron-rich and electron-deficient species.Hundreds of different CPs have been synthesized and used in electronic noses.
The QCM sensors [5] have gained popularity because they are operated atroom temperature and allow combinations of selective layers different to thoseof MOS, MOSFET and PC sensors. The QCM measures physical mass of theanalyte by recording the change in frequency of a quartz crystal when theanalyte binds to it.Layers of gas chromatographic stationary phases and naturalor synthetic lipids can discriminate between alcoholic drinks, perfume andflavor odorants.
In a few cases, small optical infrared absorption monitors have been inte-grated into electronic nose sensors [11], mostly for detection of the carbondioxide evolution from cells. The 3000– 4000 nm filters are normally used.
Figure 1 depicts the frequently used sensors in electronic noses.
68 C.-F. Mandenius
Fig.1a–d. a Two possible designs of metal oxide semiconductor (MOS) sensors where thesensitive metal oxide is either applied on a heated wire or on a heated ceramic substrate;b a typical design of a MOSFET sensor with a silicon substrate covered by a thin layer of sili-
con oxide and on top of that a thin layer of catalytic metal, e.g. palladium; c a quartz crystalmicrobalance (QCM) sensor design with a 10 mm quartz oblate to which a gold electrode isattached that is coated with a selective adsorbing layer; d the design of a conducting polymer(CP) sensor where a integrated circuit with electrode components is coated with a thin poly-mer film
a b
d
c

8/8/2019 23689262 Bio Analysis and Bio Sensors for Bio Process Monitoring 66
http://slidepdf.com/reader/full/23689262-bio-analysis-and-bio-sensors-for-bio-process-monitoring-66 75/236
2.2
Sensor Array Systems
The sensors of the electronic nose are assembled in an array. The array is nor-mally a small electronic unit that integrates the different sensors into a practicalcircuit card or another appropriate system that is easy to insert into the elec-tronic nose instrument. If the array is to be used in a flow injection setup theunit also comprises a flow cell compartment with minimal volume. The system
depicted in Fig. 2 shows how MOS and MOSFET arrays are integrated in a flow injection system [11]. Larger arrays can be integrated into silicon chips, asdescribed for CP sensors where, for example an ASIC chip with 32 sensors hasbeen fabricated with BiCMOS technology and having an area of 7¥ 7 mm [18].If the array is be inserted in the headspace volume of a bioreactor, the technicalsolution is a remote array probe that can be placed in a gas sample container [19].
An advantage of the array arrangement is that all sensors can be in operationduring monitoring and subsequently be selected at the mathematical evaluationbased on selection methods described below. If a signal is not useful for the pat-tern recognition procedure, it is simply disregarded in the calculation.
Today, several companies sell commercial electronic nose systems with theirfavorite sensor configurations [20–22]. The commercial systems have thedrawback that the types of sensors used in the array cannot be changed. If theseconfigurations are not the appropriate ones for the analytes to be measured, itbecomes necessary to combine different commercial instruments. Alternatively,a research instrument may be used.
2.3
Bioreactor Interface
Liquid samples can be collected from the bioreactor sampling port and intro-duced into the electronic nose instrument manually. More appealing in bio-processing is to sample on-line. An electronic nose system monitors non-in-vasively by sampling from the off-gas port of the bioreactor [23]. The humidity
Electronic Noses for Bioreactor Monitoring 69
Fig. 2. The principle configuration of an electronic nose system where the analyte mixture iscontacted with a chemical sensor array that produces raw data which subsequently aretreated with a pattern recognition algorithm that delivers the predicted result

8/8/2019 23689262 Bio Analysis and Bio Sensors for Bio Process Monitoring 66
http://slidepdf.com/reader/full/23689262-bio-analysis-and-bio-sensors-for-bio-process-monitoring-66 76/236
of the off-gas is normally 100% of saturation in aerobic cultivations. Thismeans that, at constant reactor temperature, the chemical composition of theoff-gas is unaffected by physical conditions and the only cause of sensorresponse is the activity of the culture. The supply of off-gas is quite sufficient in
relation to the amount required for the electronic nose analysis in an aerobicculture. An anaerobic culture may however, at least on a small laboratory scale,produce insufficient off-gas and thus need to be augmented with an inert gas,e.g. nitrogen, to supply the electronic nose with sufficient sample.
A typical sensor array system interfaced to a bioreactor representative of thestudies described in this paper is shown in Fig. 3. The bioreactor off-gas is con-ducted to a container by its overpressure.At sample injection the gas in the con-tainer is withdrawn by a suction pump placed in the electronic nose in-strument. The sample gas passes the sensor array, which is distributed overthree serially coupled units. In the example in Fig. 3 the first unit contains ten
MOSFET sensors, the second six MOS sensors and the third unit an infraredsensor. After injection, a valve is switched to a reference carrier gas, taken fromthe ambient air or from a gas flask with a controlled composition.
The sample gas is injected into the reference, or carrier, gas flow. Thereference needs to have the same composition as the sample with regard tohumidity and chemical background in order to give responses which only reflect the bioreactor composition. Thus, the reference gas has to be humidified
70 C.-F. Mandenius
Fig. 3. An electronic nose interfaced for on-line monitoring of a bioreactor. The electronicnose unit is preceded by a compensator bottle from which the necessary analyte gas volumeis sampled. The bottle serves as a compensator for minor variation in the gas compositionand a liquid trap. Reference gas in sampled from the aeration inlet to the bioreactor with thesame type of compensator bottle before the nose unit

8/8/2019 23689262 Bio Analysis and Bio Sensors for Bio Process Monitoring 66
http://slidepdf.com/reader/full/23689262-bio-analysis-and-bio-sensors-for-bio-process-monitoring-66 77/236
before being mixed with the sample gas. This is done with a humidifier asshown in Fig. 3.
During bioreactor monitoring regular recalibration or checking of perform-ance is necessary.
2.4
Evaluation Methods
The response signals from the array when arranged in a flow injection systemhave each a general curve shape as shown in Fig.4. The signals’ rise and fall timeand their plateau values contain information specific to the analyte or analytemixture. Integration and derivation of the curve add more information. Thus,one injection produces at least five parameters that can be used for the predic-tion. An array with, for example twenty sensors, consequently generates one
hundred response parameters.One of the best methods of analyzing the responses from the array is ANN
[24]. The common back-propagation ANN with one input per sensor variable,one hidden layer and one or more output nodes for the predicted parameter(s)are mostly used.A sigmoidal transfer function is applied on the input responses:
n –1
yi = –T1 + exp  xiwi j + q jY (1)i = 1
where y i is the output signal, xi an input signal, w ij a weight coefficient and q a
Electronic Noses for Bioreactor Monitoring 71
Fig. 4. Electronic nose signal in flow injection instrumentation. The arrow (inject) indicateswhen the sample is injected into the array. The on-integral and off-integral represent chosentimes over which the rise of the signal is integrated, and the on-derivative and off-derivativechosen times where the signal rise and fall are derivated. The response is the plateau value of the response. All of the signal values are mean values of at least 20 data points

8/8/2019 23689262 Bio Analysis and Bio Sensors for Bio Process Monitoring 66
http://slidepdf.com/reader/full/23689262-bio-analysis-and-bio-sensors-for-bio-process-monitoring-66 78/236
72 C.-F. Mandenius
Fig. 5a, b. Illustration of the computation principles for (a) artificial neural networks withinput signals (array signals), hidden nodes chosen during the training of the net, and outputsignals (the parameters to be predicted); and (b) principal component analysis with two prin-cipal components (PC 1 and PC 2) based on three sensor signals (represented by the x, y andz axes). Normally reduces from approximately 100 signals down to two or three PCs
a
b

8/8/2019 23689262 Bio Analysis and Bio Sensors for Bio Process Monitoring 66
http://slidepdf.com/reader/full/23689262-bio-analysis-and-bio-sensors-for-bio-process-monitoring-66 79/236
Electronic Noses for Bioreactor Monitoring 73
threshold value of neuron j. The topology of the back-propagation network isbased on a multilayer feed forward network, where the input layer receivesinformation from the sensor array, the output layer provides information to theuser and one or more hidden layers connect the input and output layers with
different weights (Fig. 4). In the training (or learning calibration) processweights are changed according to an error feedback method which first updatesthe values of all neurons corresponding to input data based on current weightsand then determines new weights my minimizing the output error. An updatealgorithm, such as Levenberg-Marquardt, is useful:
wnew = wold – ( Z T Z + lI )–1 Z T e(wold ) (2)
where l governs the step size, e is an output error vector and Z the Jacobeanmatrix of derivatives of each error with respect to each weight w.
Also very useful for evaluating the electronic nose response pattern is PCA
[25]. PCA is a linear supervised pattern recognition technique that can be usedto reduce the dimensionality of the array data. The calculation results inprincipal components, where the nth principal component describes the direc-tion of the nth largest variation in the array data set. The result is often presentedin a plot where the two or three most important principal components are plot-ted against each other, either as a score plot describing how the samples relateto each other or as a loading-plot describing the relation between the variables.In addition, PCA can be used for regression analysis of the array data. Standardalgorithms for PCA are included in many software packages, for example the
MATLAB chemometric toolbox.Partial least square (PLS) regression has been used with some success foridentifying electronic nose responses [26]. Comparison between the abovemethods seems to favor ANN but is case dependent.
In many cases, the number of response variables from the array needs to bereduced. There can be several reasons for making a variable selection. Eli-mination of irrelevant variables can improve the prediction performance, fewervariables give statistically better prediction models, and some of the variablesmight have a high correlation which can cause problems in the model calcula-tion. Depending on the problem and the prediction model type, different types
of variable selection schemes can be applied. One method that has been suc-cessfully applied to several gas sensing problems is the forward selectionprocedure, which is especially well suited for a feed-forward ANN [27]. In orderto find the best sensors to use for a particular problem, variables are added oneat a time based on their contribution to the error from a multi-linear regressionmodel [27]. The method can also be applied to select suitable variables to use inconjunction with other data processing tools, e.g. PCA or PLS [25].
3
Application to Bioreactor Monitoring
How can the off-gas emission from a culture in a bioreactor provide any usefulinformation about culture state? Under favorable conditions, an experiencedpractitioner can identify the type and stage as well as detect contamination with

8/8/2019 23689262 Bio Analysis and Bio Sensors for Bio Process Monitoring 66
http://slidepdf.com/reader/full/23689262-bio-analysis-and-bio-sensors-for-bio-process-monitoring-66 80/236
his own nose from the odor of a culture. The electronic nose could thus beexpected to provide the same type of information if its sensors are at least assensitive as the human nose and the integrated array system has the sameability to learn by training. By applying pattern recognition methods in a smart
way to the responses even more information can be extracted. Either theelectronic nose can (1) identify defined chemical components contained in theoff-gas, such as ethanol, acetic acid or volatile fatty acids,using ANN predictionor other pattern recognition techniques; or (2) relate soluble components in themedium, for example biomass, to volatiles in the off-gas that are in proportionto the component to be predicted; or (3) predict variables where the volatilecompounds in the off-gas in some more indirect way can be modeled by ANNor other methods. In addition, the pattern recognition methods can be used foridentifying stages or conditions in the cultivation irrespectively of consideringthe components per se. In the following paragraphs examples of these types of
application are given.
3.1
Prediction of Metabolites and Other State Variables
The ethanol concentration in the medium of a Saccharomyces cerevisiae culti-vation can be monitored from its content in the gas phase by directly recordingthe current from a chemical MOS sensor [28]. The accuracy of such a measure-ment was significantly improved by using an electronic nose with five sensors
in the array and recognizing the response pattern with ANN [29, 30]. Thesensors were a combination of MOS and MOSFET sensors selected from a PCAloading plot. Data sets from three cultivations were used to train the ANN.When the trained net was applied on new cultivations the ethanol was predictedwith a mean square error (RMSE) of 4.6% compared to the off-line determinedethanol (Fig. 6). With only one sensor the RMSE was 18%.
In a subsequent study an extended electronic nose with twenty sensors in thearray (MOS, MOSFET, IR) monitored a 34-h batch cultivation of S. cerevisiae ina semisynthetic medium [31, 32]. The bioreactor was also monitored with anon-line high performance liquid chromatography (HPLC) system measuring
the content of glucose, acetate, acetaldehyde and glycerol. Biomass wasmeasured off-line with dry-weight sampling. The responses from the electronicnose from repeated cultivations were used for training ANNs versus the HPLCand dry weight biomass values. Each component required a separate ANN forattaining the best accuracy. Up to six training cultivations were used in thetraining and subsequently validated on one or two new cultivations. The RMSEfor ethanol and biomass was 2.7–4%. These components appeared in the cul-tivation at relatively high concentrations and where smelled either directly (ethanol) or as a result of by-products (biomass). The non-odorant glucose was
however also predicted with good accuracy (1.7–3.9%) probably because it isdirectly related with the biomass and ethanol emission. Components present atmuch lower concentrations (approximately twenty-five-fold less) were pre-dicted as well. Acetaldehyde was predicted with an accuracy of 3.5% and ace-tate and glycerol with 8.3–10 % (Table 1).
74 C.-F. Mandenius

8/8/2019 23689262 Bio Analysis and Bio Sensors for Bio Process Monitoring 66
http://slidepdf.com/reader/full/23689262-bio-analysis-and-bio-sensors-for-bio-process-monitoring-66 81/236
Electronic Noses for Bioreactor Monitoring 75
Fig. 6. Prediction of the ethanol concentration in a yeast cultivation.The open circles show thepredicted ethanol concentration using a three layer ANN. The filled circles show off-lineanalyses of ethanol using a reference method (from [29] with permission from Elsevier)
Table 1. Prediction of components in a S. cerevisiae culture usingANN (from [31] with permission)
State variable Accuracy [%]
Ethanol 2.7–5.2Biomass 1.5–3.8Glucose 1.7–3.9Glycerol 10Acetate 8.3Acetaldehyde 3.5
A generically different microorganism, an Escherichia coli producing recom-binant human carboanhydrase II (hCAII), was monitored with the same elec-tronic nose as above [23]. The biomass concentration was predicted from nineof the sensors after training in four batch cultivations. The induction of hCAIIdid not affect the result of the training. The validation was exhibiting an RMSE
of 1.46% compared to the dry weight measurements of cell mass (Fig. 7). Theodor from E. coli was easily identified by the experimenter although an accurateestimation of the quantitative value cannot be done. The specific growth ratewas also predicted but from another selection of sensor responses in the samecultivations. The prediction was slightly less accurate with 2.8%.

8/8/2019 23689262 Bio Analysis and Bio Sensors for Bio Process Monitoring 66
http://slidepdf.com/reader/full/23689262-bio-analysis-and-bio-sensors-for-bio-process-monitoring-66 82/236
76 C.-F. Mandenius
Fig. 7. Prediction of biomass and specific growth rate in a recombinant E. coli cultivationproducing CAII. The upper diagram shows prediction of the biomass value predicted with a
9–8-1 ANN compared to dry weight values. The lower diagram shows prediction of thespecific growth rate with a 12 –7-1 ANN compared with calculated values from the dry weightvalues (from [23] with permission from Elsevier)

8/8/2019 23689262 Bio Analysis and Bio Sensors for Bio Process Monitoring 66
http://slidepdf.com/reader/full/23689262-bio-analysis-and-bio-sensors-for-bio-process-monitoring-66 83/236

8/8/2019 23689262 Bio Analysis and Bio Sensors for Bio Process Monitoring 66
http://slidepdf.com/reader/full/23689262-bio-analysis-and-bio-sensors-for-bio-process-monitoring-66 84/236
78 C.-F. Mandenius
Fig. 8a, b. a PCA classification of lignocellulose hydrolysates from pine, spruce, aspen andbirch using a combination of MOS, MOSFET and CP sensors. b Prediction of the ferment-ability of the same hydrolysates expressed as specific ethanol production rate using ANNs
with topologies adapted to the sensor array (from [34] with permission of ACS)
a
b

8/8/2019 23689262 Bio Analysis and Bio Sensors for Bio Process Monitoring 66
http://slidepdf.com/reader/full/23689262-bio-analysis-and-bio-sensors-for-bio-process-monitoring-66 85/236
The idea was first demonstrated on a 14-L fed-batch cultivation producingrecombinant human growth hormone (hGH) with E. coli in a complex medium[36]. The cultivation lasted for 33-h and had typical lag, exponential and statio-nary phases. The expression of the hGH occurred in the stationary phase. ThePCA plot from the electronic nose responses separated the phases clearly in atwo-dimensional PCA from MOS, MOSFET, and infrared signals as well as in aPCA where also the dissolved oxygen signal was included (Fig. 9). Fusion of thedissolved oxygen signal to the electronic nose signals altered the shape of thePCA plot but gave in principle equivalent information.
The methodology was applied to fed-batch baker’s yeast production on a
200-m3 scale [33]. The typical phases in a baker’s yeast cultivation were visu-alized including lag phase, formation and consumption of ethanol and increaseand decrease of cell mass. Fusion of signals from external sensors for volume,aeration flow rate and dissolved ethanol resulted in different character of thetrajectory in the PCA but with the same principal information.
The visualization method also worked with a 500-L perfusion reactor systemfor production of recombinant human coagulation factor VIII (hFVIII) inChinese hamster ovary (CHO) cells [36, 37]. Despite the diluted concentrationof CHO cells and low titer of hFVIII in the medium, the nose could differentiate
between the batch phase, medium replacement phase, and the high and low productivity phases during the five-week long cultivations (Fig. 10). The low concentration of hFVIII makes it credible to believe that there are other com-ponents associated with the product formation that the electronic noseresponds to.
Electronic Noses for Bioreactor Monitoring 79
Fig. 9. PCA trajectory of a fed-batch E. coli cultivation producing recombinant hGH. Thetrajectory mirrors the lag phase directly after inoculum ( A), the exponential growth phase (B)and the stationary hGH production phase (C ) (from [36] with permission from Elsevier)

8/8/2019 23689262 Bio Analysis and Bio Sensors for Bio Process Monitoring 66
http://slidepdf.com/reader/full/23689262-bio-analysis-and-bio-sensors-for-bio-process-monitoring-66 86/236
Of particular interest to note is that a bacterial infection of the CHO culturewas clearly seen in the PCA plot (Fig. 10). The PCA revealed the infection atleast one day before the in-process analysis. From the above experience of thenose in E. coli, it is reasonable to believe that the culture with the two organismsproduces a different response pattern that the pure CHO culture.
The same effect of bacterial contaminations was observed with an electronicnose equipped with CP sensors in an antibiotic fermentation with Micro-
monospora carbonacea [34]. Infections of E. coli and Gram-positive bacteria canbe discriminated in the plot. The same culture also exhibited characteristicresponse patterns at the different fermentation stages over a nine-day period.The character of the trajectory in the PCA mirrored the growth phase, the anti-biotic synthesis phase as well as the declination phase.The starting point of thetrajectory almost coincided with the end point.
It is tempting to speculate if metabolic shifts and shifts in the physiologicalstate of the culture can be more precisely monitored with the electronic nose.Physiologically important odorant metabolites in antibiotic strains such as
geosmin and oxolone have been analyzed with conventional methods in thefermentation off-gas [38]. Recently, responses from electronic noses have beenpossible to relate to plasmid copy number [39]. Other types of intracellularshifts, such as viral infection, inclusion body formation or increase in mRNAlevel, could challenge the capacity of electronic noses.
80 C.-F. Mandenius
Fig. 10. PCA plot of a perfusion culture with CHO cells producing recombinant hFVIII. Thedata points in the plot mirror inoculum of the bioreactor and a phase of batch growth (c),transfer from growth to production medium (D), production phase of rFVIII (demarcatedwith dotted lines) and the deviation of a bacterial infection of the cell culture (E) (fromBachinger et al.[37], with permission)

8/8/2019 23689262 Bio Analysis and Bio Sensors for Bio Process Monitoring 66
http://slidepdf.com/reader/full/23689262-bio-analysis-and-bio-sensors-for-bio-process-monitoring-66 87/236
4Conclusion
Electronic noses allow non-invasive, real-time monitoring of bioreactors. There
are two principally different ways of using them in bioreactor monitoring:(1) to predict defined state variables in the bioreactor such as metabolite con-centrations or other components in the culture as well as typical bioengineer-ing variables such as production rates, or (2) to visualize the course of a cultiva-tion by identifying the response pattern in relation to cultivation stages or otherconditions in the culture. The limitation of solely monitoring the off-gas fromthe cultivation could be circumvented by fusing the electronic nose responseswith conventional on-line bioreactor variables such dissolved oxygen or reactorvolume.With the electronic nose tool, process development could be enhanced,quality control and safety of bioreactor production improved and process con-
trol realized more efficiently. Ongoing development of solid state sensors andsignal processing methods could, in combination with other new non-invasivechemical sensors, extend further the usefulness of electronic noses for bioreac-tor monitoring.
Acknowledgements. Thanks are due to Thomas Bachinger, Helena Lidén,Tomas Eklöv, Hans Sundgren, Per Mårtensson, Fredrik Winquist, and IngemarLundström for their valuable contributions to the development of the elec-tronic nose for bioreactor monitoring. The financial support by the Swedish
National Board for Technical and Industrial Development is gratefully acknow-ledged.
References
1. Persaud K, Dodd GH (1982) Nature 299: 3522. Gardner JW, Bartlett PN (1992) In: Gardner JW, Bartlett PN (eds) Sensors and sensory
systems for electronic nose. Kluwer Academic Publisher, London, p 1613. Slater JM, Watt EJ (1991) Analyst 116:11254. Gardner JW (1991) Sens Actuators B 4:109
5. Kress-Rogers E (1997) Handbook of biosensors and electronic noses, medicine, food andenvironment, CRC Press, New York
6. Börjesson T, Eklöv T, Jonsson A, Sundgren H, Schnurer J (1996) Cereal Chem 73:4577. Pearce TC, Gardner JW, Friel S, Bartlett PN, Blair N (1993) Analyst 118:3718. Shurmer HV, Gardner JW, Chan HT (1989) Sens Actuators 18: 3619. Nakamoto T, Fukuda A, Moriizumi T (1993) Sens Actuators B 10: 85
10. Parry AD, Chadwick PR, Simon D,Oppenheimer BA, McCollum CN (1995) J Wound Care4:404
11. Winquist F, Hörnsten G, Sundgren H, Lundström I (1993) Meas Sci Technol 4:149312. Gibson TD, Prosser O, Hulbert JN, Marshall RW, Corcoran P, Lowery P, Ruck-Keene EA,
Heron S (1997) Sens Actuators B 44:413
13. Gardner JW, Craven M, Dow C, Hines EL (1998) Meas Sci Technol 9:12014. Mandenius CF, Lundström I, Bachinger T (1996) 1st Eur Symp Biochem Eng Sci, p 10415. Yamazoe N, Miura N (1992) In: Sberveglieri G (ed) Gas sensors. Kluwer, Andrecht, p 116. Spetz A,Winquist F, Sundgren H, Lundström I (1992) In: Sberveglieri G (ed) Gas sensors.
Kluwer Academic Publishers, Andrecht, p 219
Electronic Noses for Bioreactor Monitoring 81

8/8/2019 23689262 Bio Analysis and Bio Sensors for Bio Process Monitoring 66
http://slidepdf.com/reader/full/23689262-bio-analysis-and-bio-sensors-for-bio-process-monitoring-66 88/236
17. Pelosi P, Persaud, KC (1988) In: Dario P (ed) Sensors and sensory systems for advancedrobots, NATO ASI Series F Computer and system science. Springer, New York, p 361
18. Hatfield JV, Neaves P, Hicks PJ, Persaud K, Travers P (1994) Sens Actuators B 18 –19 :22119. Shurmer HV, Gardner JW, Corcoran P (1990) Sens Actuators B 1: 25620. Nordic Sensor Technologies AB, Linköping, Sweden
21. AromaScan plc, Crewe, UK22. AlphaMos SA, Toulouse, France23. Bachinger T, Mårtensson P, Mandenius CF (1998) J Biotechnol 60:5524. Bishop CM (1995) Neural networks for pattern recognition. Oxford University Press25. Jolliffe IT (1986) Principal component analysis. Springer, New York26. Sundgren H, Winqusit F, Lukkari I, Lundström I (1991) Meas Sci Technol 2:46427. Eklöv T, Mårtensson P, Lundström I (1999) Anal Chim Acta 381:22128. Bach HP, Woehrer W, Roehr M (1978) Biotechnol Bioeng 20: 79929. Lidén H, Mandenius, CF, Gorton L, Meinander N, Lundström I, Winquist F (1998) Anal
Chim Acta 361:22330. Lidén H (1998) PhD thesis, Lund University, Sweden
31. Bachinger T, Lidén H, Mårtensson P, Mandenius CF (1998) Seminars Food Analysis 3: 8532. Lidén H, Bachinger T, Gorton L, Mandenius CF (1998) Submitted to Anal Chem33. Mandenius CF, Eklöv T, Lundström I (1997) Biotechnol Bioeng 55: 42734. Namdev PK,Alroy Y, Singh V (1998) Biotechnol Prog 14:7535. Mandenius CF, Lidén H, Eklöv T, Taherzadeh M, Lidén G (1999) Biotechnol Prog (in press)36. Mandenius CF, Hagman A, Dunås F, Sundgren H, Lundström I (1998) Biosens Bioelectron
13:19337. Bachinger T, Riese U, Eriksson R,Mandenius CF (1999) J Biotechnol (accepted for publica-
tion)38. Rezanka T, Libalova D,Votruba J,Viden I (1994) Biotechnol Lett 16:7539. Bachinger T, Bayer K, Mandenius CF (1999) (to be submitted)
82 C.-F. Mandenius

8/8/2019 23689262 Bio Analysis and Bio Sensors for Bio Process Monitoring 66
http://slidepdf.com/reader/full/23689262-bio-analysis-and-bio-sensors-for-bio-process-monitoring-66 89/236
Advances in Biochemical Engineering/Biotechnology,Vol. 66Managing Editor: Th. Scheper© Springer-Verlag Berlin Heidelberg 1999
Rapid Analysis of High-Dimensional BioprocessesUsing Multivariate Spectroscopies and AdvancedChemometrics
A.D. Shaw 1, M.K. Winson,A.M. Woodward, A.C. McGovern, H.M. Davey,N. Kaderbhai, D. Broadhurst, R.J. Gilbert, J. Taylor, É.M. Timmins, R. Goodacre,D.B. Kell2
Institute of Biological Sciences, University of Wales,Aberystwyth, Ceredigion SY23 3DD, UK1 E-mail: [email protected], 2 E-mail: [email protected]
B.K. Alsberg, J.J. RowlandDept. of Computer Science, University of Wales, Aberystwyth, Ceredigion SY23 3DD, UK
There are an increasing number of instrumental methods for obtaining data from bio-chemical processes, many of which now provide information on many (indeed many hundreds) of variables simultaneously. The wealth of data that these methods provide, how-ever, is useless without the means to extract the required information. As instrumentsadvance, and the quantity of data produced increases, the fields of bioinformatics andchemometrics have consequently grown greatly in importance.
The chemometric methods nowadays available are both powerful and dangerous,and thereare many issues to be considered when using statistical analyses on data for which there are
numerous measurements (which often exceed the number of samples). It is not difficult tocarry out statistical analysis on multivariate data in such a way that the results appear muchmore impressive than they really are.
The authors present some of the methods that we have developed and exploited inAberystwyth for gathering highly multivariate data from bioprocesses, and some techniquesof sound multivariate statistical analyses (and of related methods based on neural andevolutionary computing) which can ensure that the results will stand up to the most rigorousscrutiny.
Keywords. Vibrational spectroscopy, Mass spectrometry, Dielectric spectroscopy, Flow Cytometry, Chemometrics
1 General Introduction – Multivariate Analyses in thePost-Genomic Era . . . . . . . . . . . . . . . . . . . . . . . . . . . . 84
2 Mass Spectrometric Measurements on Bioprocesses . . . . . . . . . 85
3 Monitoring Bioprocesses by Vibrational Spectroscopies . . . . . . 87
3.1 Infrared Analysis . . . . . . . . . . . . . . . . . . . . . . . . . . . . . 873.1.1 Advantages of NIR Application to Bioprocess Monitoring . . . . . 87
3.1.2 Instrumentation and Standardisation . . . . . . . . . . . . . . . . . 883.1.3 Interpreting Spectra in Quantitative Terms . . . . . . . . . . . . . . 883.1.4 Applications . . . . . . . . . . . . . . . . . . . . . . . . . . . . . . . 893.2 MIR Analysis . . . . . . . . . . . . . . . . . . . . . . . . . . . . . . . 903.3 Monitoring Bioprocesses Using Raman Vibrational Spectroscopy . . 92

8/8/2019 23689262 Bio Analysis and Bio Sensors for Bio Process Monitoring 66
http://slidepdf.com/reader/full/23689262-bio-analysis-and-bio-sensors-for-bio-process-monitoring-66 90/236
4 Measurement of Biomass . . . . . . . . . . . . . . . . . . . . . . . . 94
4.1 Dielectrics of Biological Samples – Linear or Nonlinear? . . . . . . 954.1.1 The Nonlinear Dielectric Spectrometer . . . . . . . . . . . . . . . . 964.1.2 Nonlinear Dielectrics of Yeast Suspensions . . . . . . . . . . . . . . 984.1.3 Multivariate Analysis . . . . . . . . . . . . . . . . . . . . . . . . . . 984.1.4 Electrode Polarisation and Fouling . . . . . . . . . . . . . . . . . . . 1004.1.5 Electrode Coating . . . . . . . . . . . . . . . . . . . . . . . . . . . . 1014.1.6 Genetic Programming . . . . . . . . . . . . . . . . . . . . . . . . . . 1024.1.7 Other Microbial Systems . . . . . . . . . . . . . . . . . . . . . . . . 103
5 Flow Cytometry . . . . . . . . . . . . . . . . . . . . . . . . . . . . . 103
6 Data Analysis . . . . . . . . . . . . . . . . . . . . . . . . . . . . . . . 104
6.1 Data Pre-processing . . . . . . . . . . . . . . . . . . . . . . . . . . . 1046.2 Model Simplification . . . . . . . . . . . . . . . . . . . . . . . . . . . 1056.3 Data Partitioning . . . . . . . . . . . . . . . . . . . . . . . . . . . . . 1066.3.1 Training and Testing . . . . . . . . . . . . . . . . . . . . . . . . . . . 1076.3.2 The Extrapolation Problem . . . . . . . . . . . . . . . . . . . . . . . 107
7 Concluding Remarks . . . . . . . . . . . . . . . . . . . . . . . . . . 108
References . . . . . . . . . . . . . . . . . . . . . . . . . . . . . . . . . . . . 108
1General Introduction – Multivariate Analyses in the Post-Genomic Era
“But one thing is certain: to understand the whole you must look at the whole” – Kacser H(1986). On parts and wholes in metabolism. In: Welch GR, Clegg JS (eds) The organisation of cell metabolism, Plenum Press, New York, p 327
As we enter the post-genomic era [1, 2], there is a growing realisation that the
search for gene function in complex organisms is likely to require analyses not just of one or two genes or other variables in which an experimenter happensto have an interest but of everything that is going on inside a cell and its sur-roundings. Such analyses are now occurring at the level of the transcriptome(e.g. [3, 4]), the proteome (e.g. [5–7]) and the metabolome [2], to define,respectively the expressed performance of the genome at the level of transcrip-tion, translation and small molecule transactions. However, the present level of analysis of such data is comparatively rudimentary [8].
The bioprocess analyst has long realised that the more (useful) measure-
ments we can make the more likely are we to understand our bioprocesses, andwe ourselves have long sought to increase the number of non-invasive, on-lineprobes available [9, 10]. Classical methods, monitoring factors such as pH, dis-solved oxygen tension, and so on, however, are in essence univariate methods,and only give information on individual determinands.
84 A.D. Shaw et al.

8/8/2019 23689262 Bio Analysis and Bio Sensors for Bio Process Monitoring 66
http://slidepdf.com/reader/full/23689262-bio-analysis-and-bio-sensors-for-bio-process-monitoring-66 91/236
The strategy that we have therefore sought to follow is to exploit multivariatemethods which can measure many variables simultaneously. The resulting datafloods necessitate the use of robust, multivariate chemometric methods. Thesetoo are now available in many flavours, with different strengths and weaknesses.
The purpose of the present review, then, as requested by the Editor, is to re-view some of the types of method we have developed and exploited inAberystwyth for the rapid, precise, quantitative, and – where possible – non-in-vasive measurement of bioprocesses. Our website http://gepasi.dbs.aber.ac.ukmay also be consulted.We start with mass spectrometry.
2Mass Spectrometric Measurements on Bioprocesses
Whilst on-line desorption chemical ionisation mass spectrometry (MS) has
been used to analyse fermentation biosuspensions for flavones [11], the major-ity of MS applications during fermentations have been for the analysis of gasesand volatiles produced over the reactor [12–15], or by employing a membraneinlet probe for volatile compounds dissolved in the biosuspensions [16–22]. Itis obvious that more worthwhile information would be gained by measuring thenon-volatile components of fermentation biosuspensions, particularly whenthe product itself is non-volatile, which is usually the case.
The introduction of non-volatile components into an MS has typically beenvia the pyrolysis of whole fermentation liquors. Pyrolysis is the thermal degra-
dation of a material in an inert atmosphere or a vacuum. It causes molecules tocleave at their weakest points to produce smaller, volatile fragments calledpyrolysate [23]. An MS can then be used to separate the components of thepyrolysate on the basis of their mass-to-charge ratio (m/z ) to produce a pyroly-sis mass spectrum, which can then be used as a “chemical profile”or fingerprintof the complex material analysed [24].
Figure 1 gives typical pyrolysis mass spectra of Penicillium chrysogenum andof penicillin G, indicating the rich structural and process information that isavailable from highly multivariate methods of this type.
Pyrolysis MS (PyMS) has been applied to the characterisation and identifi-
cation of a variety of microbial systems over a number of years (for reviews see:[25– 27]) and, because of its high discriminatory ability [28–30], presents apowerful fingerprinting technique applicable to any organic material. Whilstthe pyrolysis mass spectra of complex organic mixtures may be expressed in thesimplest terms as sub-patterns of spectra describing the pure components of the mixtures and their relative concentrations [24], this may not always be truebecause during pyrolysis intermolecular reactions can take place in the pyroly-sate [31–33]. This leads to a lack of superposition of the spectral componentsand to a possible dependence of the mass spectrum on sample size [31].
However, suitable numerical methods (or chemometrics) can still be employedto measure the concentrations of biochemical components from pyrolysis massspectra of complex mixtures.
Heinzle et al. [34] were able to characterise the states of fermentations usingoff-line PyMS, and this technique was extended to on-line analysis [35].
Rapid Analysis of High-Dimensional Bioprocesses Using Multivariate Spectroscopies 85

8/8/2019 23689262 Bio Analysis and Bio Sensors for Bio Process Monitoring 66
http://slidepdf.com/reader/full/23689262-bio-analysis-and-bio-sensors-for-bio-process-monitoring-66 92/236
However, they were not very satisfied with their system because there was nosuitable data processing for the PyMS spectra. Although Heinzle and colleaguescontinued to use mass spectrometry for the analysis of volatiles producedduring fermentation [13, 36], the analysis of non-volatiles by PyMS has not beeninvestigated further by these authors.
With the advent of user-friendly chemometric software packages, PyMS cannow be used for gaining accurate and precise quantitative information aboutthe chemical constituents of microbial (and other) samples [37–39]. Withinbiotechnology the combination of PyMS with chemometrics has the potentialfor the screening and analysis of microbial cultures producing recombinantproteins; for instance this technique has permitted the amount of mammaliancytochrome b5 [40] or a2-interferon [41] expressed in E. coli to be predicted ac-curately. Chemometrics, and in particular artificial neural networks (ANNs),have also been applied to the quantitative analysis of the pyrolysis mass spectraof whole fermentor biosuspensions [31]. Initially a model system consisting of
mixtures of the antibiotic ampicillin with either Escherichia coli or Staphy-lococcus aureus (to represent a variable biological background) was studied. Itwas especially interesting that ANNs trained to predict the amount of ampicil-lin in E. coli (having seen only mixtures of ampicillin and E. coli) were able togeneralise so as to predict the concentration of ampicillin in an S. aureus back-ground to approximately 5%, illustrating the very great robustness of ANNs torather substantial variations in the biological background. (Genetic algorithmscan also be used to simplify analyses of these data [42].) Samples from fermen-tations of a single organism in a complex production medium were also ana-
lysed quantitatively for a drug of commercial interest, and this could be exten-ded to a variety of mutant producing strains cultivated in the same medium,thus effecting a rapid screening for the high-level production of desired sub-stances [31]. In related studies Penicillium chrysogenum fermentation bio-suspensions were analysed quantitatively for penicillins using PyMS [43] and
86 A.D. Shaw et al.
Fig. 1. a Normalised pyrolysis mass spectra of Penicillium chrysogenum; this complex‘fingerprint’can be used to type this organism. b Normalised pyrolysis mass spectra of 200mgpure Penicillin G; this somewhat simpler ‘biochemical profile’ is one of the range of penicil-lins produced by Penicillium chrysogenum
a b

8/8/2019 23689262 Bio Analysis and Bio Sensors for Bio Process Monitoring 66
http://slidepdf.com/reader/full/23689262-bio-analysis-and-bio-sensors-for-bio-process-monitoring-66 93/236

8/8/2019 23689262 Bio Analysis and Bio Sensors for Bio Process Monitoring 66
http://slidepdf.com/reader/full/23689262-bio-analysis-and-bio-sensors-for-bio-process-monitoring-66 94/236
employed as a non-destructive process requiring little or no sample preparationand the sample may be re-introduced into the bioreactor. This is advantageousin a process environment where time is an important factor in the analysis [50].
3.1.2Instrumentation and Standardisation
Modern NIR equipment is generally robust and precise and can be operatedeasily by unskilled personnel [51]. Commercial instruments which have beenused for bioprocess analyses include the Nicolet 740 Fourier transform infraredspectrometer [52, 53] and NIRSystems, Inc. Biotech System [54, 55]. Off-linebioprocess analysis most often involves manually placing the sample in acuvette with optical pathlengths of 0.5 mm to 2.0 mm, although automaticsampling and transport to the spectrometer by means of tubing pump has been
used (Yano and Harata, 1994). A number of different spectral acquisitionmethods have been successfully applied, including reflectance [55], absorbance[56], and diffuse transmittance [51].
At-line sampling may involve a flow-through cell in the NIR spectrometer; inone process a glass-lined steel reaction vessel was used in combination with afibre optic probe for measurements in a full scale chemical plant reactor [57].Fibre optic bundles can be used to transmit NIR radiation to the reactionmatrix and take signal back to the spectrometer. NIR is notoriously sensitive tochanges in temperature and methods for keeping the temperature constant
must be incorporated into the instrumentation.
3.1.3
Interpreting Spectra in Quantitative Terms
Broad superimposed bands are observed in NIR spectroscopic measurementsand in most instances the peaks are not directly proportional to sample con-centration. Statistical approaches are therefore required for modelling thebehaviour of spectra for quantification. In the application of NIR to real worldbioprocess samples, which are highly turbid scattering matrices, quantification
of a constituent of interest can be particularly difficult.Vibrations are often ob-served that are common both to the determinand and the medium and cells infermentations. Qualitative interpretation, and selection of unique spectral win-dows for calibration is therefore not always possible. One approach in thedetermination of wavelengths that can be used to quantify the constituent levelsin bioprocess samples is to collect the spectra of raw materials alone and incombination, and then overlay spectra for isolation of unique bands. Secondderivative pre-processing of spectral data can enhance spectral features and inaddition baseline differences are often eliminated by this calculation; as cell
density increases, the effective pathlength traversing through the sample in-creases because of light scattering by the cells, producing baseline offset [58].Brimmer and Hall, [55] derived a Multiple Least squares Regression (MLR)equation that compensated for scattering differences attributable to changesin the biomass of the fermentation process. This was accomplished by using
88 A.D. Shaw et al.

8/8/2019 23689262 Bio Analysis and Bio Sensors for Bio Process Monitoring 66
http://slidepdf.com/reader/full/23689262-bio-analysis-and-bio-sensors-for-bio-process-monitoring-66 95/236
a reference wavelength at which the spectral data varies with penetration depthin a reproducible manner. Background information such as that attributable towater or the sample holder may be subtracted or used as a ratio [53, 59], how-ever, in some instances this correction does not appear to affect the modelling
ability of the algorithms [56]. NIR can be applied to whole cells, supernatantand aqueous mixtures of constituent samples, which may be also used to formcalibration models [60].
Multivariate calibration methods. These are capable of extracting meaningfulinformation from seemingly uninterpretable NIR spectra of bioprocesssamples; however for these methods measurements made using other tech-niques must be available for training. It may be necessary to form a model fordifferent times in the bioprocess e.g. for the start-up period and for later stageswhen inhibitors are accumulating and substrates are depleting in the fermenta-
tion.
Transferability of spectral data and models in NIR spectroscopy. This subject isan issue that is pertinent to the future use of NIR for bioprocess monitoring.Pre-processing to remove baseline shifts and noise in spectra from individualmachines or direct standardisation by data transformation with a represen-tative subset can be used to calibrate across instruments [61].
3.1.4
Applications
NIR spectroscopy continues to be applied to on-line fermentation and bio-transformation monitoring, for example, of ethanol and biomass in richmedium in a yeast fermentation [62, 63], lactic acid production [64, 65], bio-conversion of glycerol to 1,3-dihydroxyacetone [66] and nutrient and productconcentrations in commercial antibiotic fermentations [67,68]. Hall,Macaloney and colleagues [51, 58] reported NIR spectroscopic monitoring of industrialfed-batch E. coli fermentation of varying levels of acetate, ammonium, glyceroland biomass which they had previously studied in shake flasks [54], while Yano
and colleagues [56] used NIR spectroscopy to determine with good precisionthe concentrations of ethanol and acetate in rice vinegar fermentations. Thespectral signature of biomass with respect to wavelength regions was found tobe essentially identical when groups of industrially-important microorganisms[69] were analysed. The concentration of many species may be determined fromone spectroscopic measurement, as long as their concentration is 1 mM orgreater [59].
New methods of variable selection include evolutionary methods based onDarwinian principles including Genetic Algorithms and Genetic Programming
[70] and as such help to deconvolute whole spectral models in terms of whichvariables are important in the modelling procedure. When applied to a NIRglucose sensor, fewer than 25 variables were selected to produce errors statisti-cally equivalent to those yielded by the full set containing 500 wavelengths andthe algorithm correctly chose the glucose absorption peak areas as the in-
Rapid Analysis of High-Dimensional Bioprocesses Using Multivariate Spectroscopies 89

8/8/2019 23689262 Bio Analysis and Bio Sensors for Bio Process Monitoring 66
http://slidepdf.com/reader/full/23689262-bio-analysis-and-bio-sensors-for-bio-process-monitoring-66 96/236
formation-carrying spectral regions [71], and these approaches, coupled todigital filtering, appear to be the methods of choice [72, 73].
It is important that calibration models are rigorously validated and in thefirst instance that all variations are accounted for in the model using diverse
samples that are expected to be observed in future bioprocess runs. Some in-vestigators attempt to keep process conditions very reproducible but such con-ditions are uncommon in an industrial environment. In addition, multivariatecalibration models will work well if identical media (composition) and processconditions are used on each successive run. Simple modifications such as use of a different media supplier can affect the spectral background. The predictiveability of the models will then be affected as they will be challenged with sam-ples which they have not been trained to recognise [74].
3.2
MIR Analysis
The higher level of spectral resolution in the MIR range often allows peaks tobe assigned to specific medium components or chemical entities. Although ana-lysis of bioprocesses in the MIR range would be especially useful for monitoringproducts of interest because of the feature rich spectra between 4000–200 cm–1,application to on-line aqueous systems at an industrial level is hindered by thebroad water absorption across most of the so-called ‘fingerprint’ spectral range.For off-line analysis this can be overcome simply by drying samples; however,
for on-line analysis success with mid-IR monitoring of bioprocesses has beenlimited to use of transmission cells with extremely short pathlengths orAttenuated Total Reflectance (ATR) spectroscopy.ATR utilises the phenomenonof total internal reflection. ATR can be used essentially as an ‘in-line’ method,where the sample interface is located in the process line itself, thus eliminatingthe requirement for an independent sampling system. The sample to be ana-lysed is placed in direct contact with a crystal made from zinc selenide, ger-manium, thallium/iodide, sapphire, diamond or zirconium. Quantitative moni-toring by FT-IR spectroscopy of the enzymatic hydrolysis of penicillin V to6-aminopenicillanic acid and phenoxyacetic acid using a 25 ml flow through cell
with a zinc selenide crystal demonstrated that the IR method allowed betterprediction of the process termination time than the standard method based onmonitoring the addition of sodium hydroxide [75].
On-line MIR ZnSe ATR analysis of microbial cultures has been usedprimarily for non-invasive monitoring of alcoholic or lactic fermentations.Alberti et al. [76] reported the use of a ZnSe cylindrical ATR crystal to monitoraccurately substrate and product concentrations from a fed-batch fermentationof Saccharomyces cerevisiae. Picque et al. [77] also used a ZnSe ATR cell formonitoring fermentations and found that whereas NIR spectra obtained from
alcoholic or lactic fermentation samples contained no peaks or zones whoseabsorbance varied significantly, both transmission and ATR MIR could be usedsuccessfully to measure products. Fayolle et al. [78] have employed MIR for on-line analysis of substrate, major metabolites and lactic acid bacteria in afermentation process (using a germanium window flow-through cell), and
90 A.D. Shaw et al.

8/8/2019 23689262 Bio Analysis and Bio Sensors for Bio Process Monitoring 66
http://slidepdf.com/reader/full/23689262-bio-analysis-and-bio-sensors-for-bio-process-monitoring-66 97/236
studied the effects of temperature on the ability to quantify the substrates(glucose and fructose) and metabolites (glycerol and ethanol) in an alcoholicfermentation using a ZnSe ATR crystal. Hayakawa et al. [79] described the useof a remote ZnSe ATR probe for determining glucose, lactic acid and pH simul-
taneously in a lactic acid fermentation process using Lactobacillus casei. Thebenefits of the ATR method of analysis are generally those that would be con-sidered advantageous for any on-line system, being non-destructive, requiringno sample preparation or reagents and only a short analysis time, with minimalexpertise necessary in the industrial environment. Practical drawbacks for thetechnique,particularly for microbial fermentations,centre on the need to purgethe flow cell or clean the ATR probe to prevent surface contamination throughbiofilm formation. Some ATR crystal materials are toxic, limiting certain ap-plications to the use of sapphire, diamond or zirconia. Sapphire crystals arenon-transmitting below 2000 cm–1 which means that the MIR fingerprint re-
gion cannot be investigated with this device [80]. Developments in optical fibredesign and coupling to spectrometers makes IR analysis a practical con-sideration for industrial reactors, as the IR spectrometer can be kept remotefrom the sampling probe, although at present chalcogenide fibres can only beused over short distances.
Off-line analysis of bioprocesses is clearly less desirable for a rapid response.However, MIR analysis of fermentation samples off-line does offer certainadvantages over other techniques. A method we have introduced and calledDRASTIC (Diffuse Reflectance-Absorbance IR Spectroscopy Taking in
Chemometrics) [81] for MIR analysis of bioprocess samples has been success-fully applied to the estimation of drug concentrations in biological samples, in-cluding fermentations from a microbial strain development programme [82,83]. In this technique fermentation samples (5 ml) were applied to wells in analuminium plate or aluminium-coated plastic 384-well microtitre plate, dried,mounted on a motorised mapping stage and analysed by the diffuse reflectance-absorbance method using a Bruker IFS28 FT-IR spectrometer. This allows rapidnon-destructive analysis of samples (typically 1 per second) at a high signal tonoise ratio. We were thus able to predict concentrations of ampicillin in a bio-logical background of E. coli (see Fig. 2 for example spectra) and Staphylococcus
aureus cells, and we used spectral data obtained from analysis of fermentationsof Streptomyces citricolor to predict the concentrations of the carbocyclicnucleosides aristeromycin and neplanocin A. PLS routine was used to create atraining set using the MIR spectral data and information provided from HPLCanalysis of samples. This method can be fully automated and allows for a par-ticularly high sample throughput rate.
The use of multivariate spectral information is particularly advantageouswhere quantification of a particular metabolite in a complex biological back-ground is being attempted and application of the technique necessitates the use
of chemometric processing techniques for quantification of components.
Rapid Analysis of High-Dimensional Bioprocesses Using Multivariate Spectroscopies 91

8/8/2019 23689262 Bio Analysis and Bio Sensors for Bio Process Monitoring 66
http://slidepdf.com/reader/full/23689262-bio-analysis-and-bio-sensors-for-bio-process-monitoring-66 98/236
3.3
Monitoring Bioprocesses Using Raman Vibrational Spectroscopy
Recent exploitation of biotechnological processes for pharmaceutical andfood industries has necessitated rapid screening and quantitative analysis of the specific components. Therefore, there is continuing need for developingon-line methods for monitoring such biological processes [84– 86]. The idealmethod [87] would be rapid, non-invasive, reagentless, precise and cheap,although to date, with the possible exception of near-IR spectroscopy almostno such single method has been found. Generally these bioprocesses progressfrom translucent to increasingly opaque matrices as the microbial cells multiply and become highly light scattering and rich in molecular vibrational infor-mation. The use of specific molecular vibrations allowing specific finger-
printing of singular or multi-components for identification and quantificationusing the vibrational FT-IR and Raman spectroscopies for monitoring thesebioprocesses can provide suitable alternatives to the present day processmonitoring.
Raman spectroscopy relies on vibrational signals generated by focusing alaser beam onto the sample to be analysed, where most of the incident photonsare either transmitted through the sample, absorbed by it, or scattered (elasticscattering). In a very few cases, approximately 1 in 109, the vibrations and rota-tions of the scattering molecules cause energy quanta to be transferred between
molecules and photons in the collision process (inelastic scattering). A mono-chromator and a detector are then used to measure these inelastically scatteredphotons to give a Raman spectrum.
Raman spectroscopy can be used to analyse aqueous biological and bio-organic samples e.g., bacteria, spores, diseased tissues, neurotransmitters,
92 A.D. Shaw et al.
Fig. 2. MIR diffuse reflectance spectra of Escherichia coli cells without ( A) and with (B)20 mM ampicillin

8/8/2019 23689262 Bio Analysis and Bio Sensors for Bio Process Monitoring 66
http://slidepdf.com/reader/full/23689262-bio-analysis-and-bio-sensors-for-bio-process-monitoring-66 99/236
protein structures, membrane lipids, biochemical assays,drug-nucleotide inter-actions, constituents of oils, water for toxic analytes and bioprocesses.
During the last few years there has been a renaissance in Raman instrumen-tation suitable for the analysis of biological systems, initially with the develop-
ment of Fourier Transform (FT)-Raman instruments in which the wavelength of the exciting laser is in the near-infrared laser (usually a Nd:YAG (neodymiumdoped yttrium-aluminium garnet) at 1064 nm) rather than in the visible region,an arrangement which therefore avoids the background fluorescence typical of biological samples illuminated in the visible [47, 88–104]. In addition, and atleast as importantly, exceptional Rayleigh light rejection has come from the de-velopment of holographic notch filters [105–108], and a recent innovation is theuse of Hadamard-transform-based spectrometers [109, 110].
Although the FT approach to both infrared and Raman spectroscopy posses-ses well-known advantages of optical throughput [47, 111], there are still
problems for FT-Raman with many aqueous biological samples as water may absorb both the exciting laser radiation at 1064 nm and the Raman scatteredlight. In addition, it is often necessary to co-add many hundreds of spectra toproduce high-quality data from biological systems, and acquisition times arefrequently 15–60 min. More recently, therefore, it has been recognised thatcharge coupled device (CCD) array detectors are ideal elements for use indispersive (non-FT) Raman spectroscopy. However, they normally have very low quantum efficiency at 1064 nm photons. Thus holographic notch filters andCCD array detectors have been combined with a dispersive instrument, using
diode laser excitation at 780 nm (a wavelength which suppresses fluorescencefrom most samples but which penetrates water well). The cooled CCD is amulti-channel device which has exceptional sensitivity and very low intrinsicnoise (dark current), so that the signal:noise ratio is improved by at least 2 or-ders of magnitude (compared with an uncooled CCD) and data acquisition iscorrespondingly fast [89]. These and other major technical advances [112, 113]now make Raman a very promising tool for the rapid, non-invasive and multi-parameter analysis of aqueous biological systems, including the estimation of metabolite concentrations in ocular tissue [114, 115].
In 1987, Shope and colleagues [116] used attenuated total reflectance (ATR)
Raman spectroscopy for the on-line monitoring of the fermentation by yeast of sucrose to ethanol, using the argon ion laser line at 514.5 nm. Gomy et al. [117,118] monitored their alcoholic fermentation using the same laser with a fiberoptic probe attached to a Raman spectrometer but analysed the ethanol levelsonly at higher wavenumber (2600– 3800 cm–1) . This was because the Ramanmonitoring of these processes using 514.5 nm excitation gave significantfluorescence in the lower wavenumber region,as can be observed in the spectrashown in these papers.
Although fluorescence has been a major hindrance for the use of Raman
spectroscopy in biology, Shope and colleagues [116] clearly showed that thenarrow Raman peaks were distinct from the broad features of fluorescence andproposed the use of full widths at half-height of the peaks for chemical quanti-tation from Raman spectra. Shope et al. [116] used a least squares fit to analysethe Raman spectra for quantification of the production of ethanol during the
Rapid Analysis of High-Dimensional Bioprocesses Using Multivariate Spectroscopies 93

8/8/2019 23689262 Bio Analysis and Bio Sensors for Bio Process Monitoring 66
http://slidepdf.com/reader/full/23689262-bio-analysis-and-bio-sensors-for-bio-process-monitoring-66 100/236
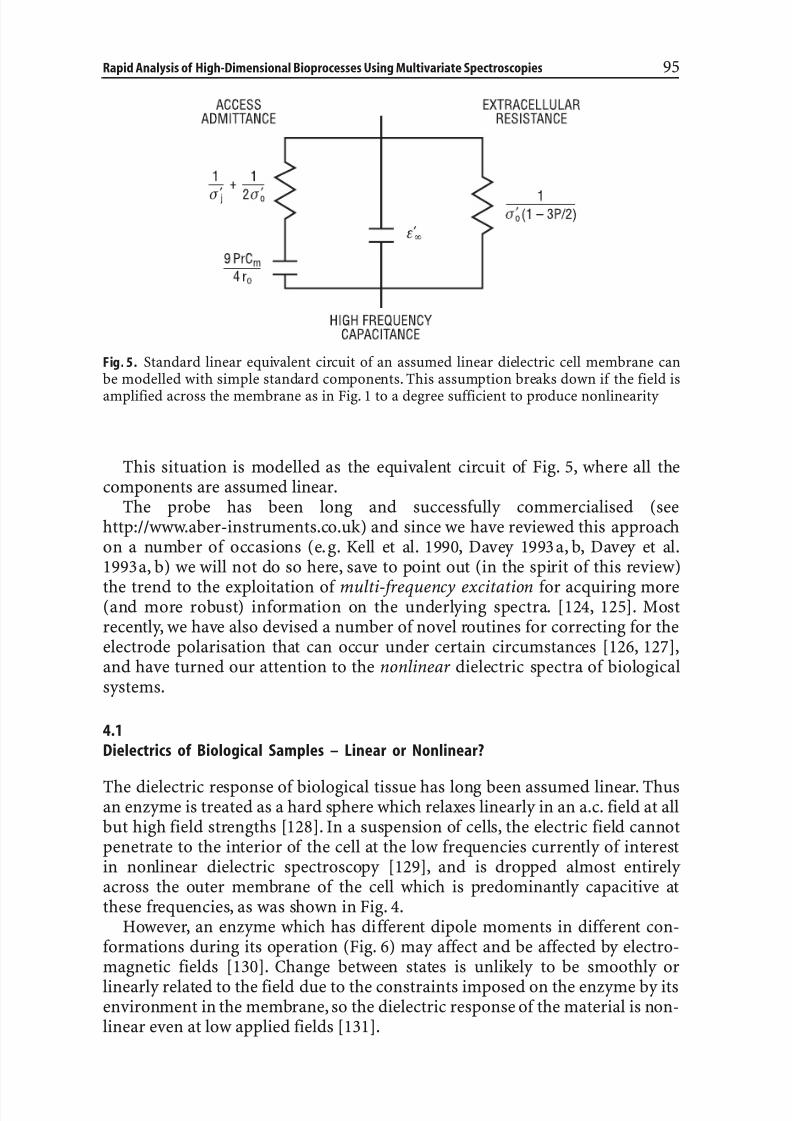
8/8/2019 23689262 Bio Analysis and Bio Sensors for Bio Process Monitoring 66
http://slidepdf.com/reader/full/23689262-bio-analysis-and-bio-sensors-for-bio-process-monitoring-66 101/236
This situation is modelled as the equivalent circuit of Fig. 5, where all thecomponents are assumed linear.
The probe has been long and successfully commercialised (seehttp://www.aber-instruments.co.uk) and since we have reviewed this approachon a number of occasions (e.g. Kell et al. 1990, Davey 1993a, b, Davey et al.
1993a, b) we will not do so here, save to point out (in the spirit of this review)the trend to the exploitation of multi-frequency excitation for acquiring more(and more robust) information on the underlying spectra. [124, 125]. Mostrecently, we have also devised a number of novel routines for correcting for theelectrode polarisation that can occur under certain circumstances [126, 127],and have turned our attention to the nonlinear dielectric spectra of biologicalsystems.
4.1
Dielectrics of Biological Samples – Linear or Nonlinear?
The dielectric response of biological tissue has long been assumed linear. Thusan enzyme is treated as a hard sphere which relaxes linearly in an a.c. field at allbut high field strengths [128]. In a suspension of cells, the electric field cannotpenetrate to the interior of the cell at the low frequencies currently of interestin nonlinear dielectric spectroscopy [129], and is dropped almost entirely across the outer membrane of the cell which is predominantly capacitive atthese frequencies, as was shown in Fig. 4.
However, an enzyme which has different dipole moments in different con-
formations during its operation (Fig. 6) may affect and be affected by electro-magnetic fields [130]. Change between states is unlikely to be smoothly orlinearly related to the field due to the constraints imposed on the enzyme by itsenvironment in the membrane, so the dielectric response of the material is non-linear even at low applied fields [131].
Rapid Analysis of High-Dimensional Bioprocesses Using Multivariate Spectroscopies 95
Fig. 5. Standard linear equivalent circuit of an assumed linear dielectric cell membrane can
be modelled with simple standard components. This assumption breaks down if the field isamplified across the membrane as in Fig. 1 to a degree sufficient to produce nonlinearity

8/8/2019 23689262 Bio Analysis and Bio Sensors for Bio Process Monitoring 66
http://slidepdf.com/reader/full/23689262-bio-analysis-and-bio-sensors-for-bio-process-monitoring-66 102/236
The equivalent circuit of Fig. 5 is no longer very useful since its individual
components are no longer linear. This behaviour shows up as the generation by the tissue of harmonics of the applied frequency [129].A nonlinear dielectric spectrometer has been designed around a standard
IBM PC; and realised almost completely in software, with a minimum of extra-neous hardware [129].
4.1.1
The Nonlinear Dielectric Spectrometer
A sinusoidal (or otherwise) signal is generated by the PC and applied to the
outer terminals of a 4-terminal electrode system. The resulting signal across theinner electrodes is fed back differentially to the PC. This signal is then trans-formed into its power spectrum and the harmonics studied (Fig. 7).
Of course things are never quite this simple. At the low frequencies (a few Hzto a few kHz) studied so far, there is a strong polarisation layer around thedriver electrodes. The i/V relation of this layer is both strongly nonlinear andhighly variable with time, and its effects must be removed from the (weak)harmonics generated by the biology, if direct visualisation of the harmonicspectra is needed.
A reference spectrum (dB power spectrum) is taken using the supernatant of the suspension under test. This is the polarisation signature. This is then sub-tracted from the equivalent spectrum from the whole suspension. This pro-cedure deconvolves the polarisation harmonics from those produced by thetissue nonlinearity (Fig. 8).
96 A.D. Shaw et al.
Fig. 6. Enzyme transporting ion across membrane via conformational change. If the differentconformations have different dipole moments, the enzyme will be sensitive to electric fieldsand will be detectable by its effect on these fields

8/8/2019 23689262 Bio Analysis and Bio Sensors for Bio Process Monitoring 66
http://slidepdf.com/reader/full/23689262-bio-analysis-and-bio-sensors-for-bio-process-monitoring-66 103/236
Fig. 7. Dielectric spectrometer schematic: Two standard four-terminal electrode chambersare connected to A/D converters and on into a PC. Fourier analysis is done by the PC to pro-duce the nonlinear dielectric spectra
Fig. 8. Reference, suspension, and difference spectra of resting yeast. Predominently odd har-monics only are produced in this metabolic state signifying a symmetric system in equilibrium

8/8/2019 23689262 Bio Analysis and Bio Sensors for Bio Process Monitoring 66
http://slidepdf.com/reader/full/23689262-bio-analysis-and-bio-sensors-for-bio-process-monitoring-66 104/236
4.1.2
Nonlinear Dielectrics of Yeast Suspensions
In a suspension of Saccharomyces cerevisiae, an inhibitor study along with use of mutant strains showed that the predominant source of the nonlinear signaturein this organism is the membrane-located H+ ATPase. The harmonics are highly voltage- and frequency-windowed, with the peak of the frequency window forthe resting enzyme coinciding neatly with its kcat value. In a resting state, at equi-
librium, the suspension generates almost entirely odd-numbered harmonics, asin Fig. 8, suggesting symmetry about the equilibrium of the ATPase. If glucose isaddded to the suspension to fuel proton transport by the ATPase, then the shiftaway from equilibrium breaks the symmetry and even-numbered harmonics ap-pear, giving a measure of the activity or inactivity of this enzyme and the con-sequent metabolic state of the yeast cells as shown in Fig. 9.
Analysing the behaviour of the harmonics over a range of frequencies/volta-ges allows the rapid collection of a very large amount of metabolism-dependentinformation.
4.1.3
Multivariate Analysis
Recently, work has focused on the use of multivariate methods to form modelscapable of predicting the factors causing responses. Much of this work has cen-tred on the prediction of glucose levels in yeast fermentations from the cellularresponses. A major practical advantage of multivariate methods is that there isno requirement for a reference sample to be taken.
Initial experiments used principal component analysis (PCA) to investigate
the multivariate response. PCA is a non-parametric method which outputslinear combinations of the input values (the “principal components”), such thatthe majority of variation is concentrated in the first few components.
PCA does not attempt to relate cause and effect; it merely serves to highlightthe larger variations in the data. Nevertheless, the results obtained from PCA
98 A.D. Shaw et al.
Fig. 9. Difference spectrum of metabolising yeast cells Even harmonics appear under theseconditions showing an activation of the ATPase signifying the disturbance of the equilibriumof Fig. 5

8/8/2019 23689262 Bio Analysis and Bio Sensors for Bio Process Monitoring 66
http://slidepdf.com/reader/full/23689262-bio-analysis-and-bio-sensors-for-bio-process-monitoring-66 105/236
proved promising, showing large variations which could be due to the cells’activity in response to glucose.
Subsequent work has used partial least squares regression (PLS) to formpredictive models of glucose concentration during batch fermentations asshown in Fig. 10 (where object number = sample number and gives a measureof the progress of the fermentation). PLS produces models by projecting thelarge number of response X-variables (the harmonics in the NLDS spectra) intoa smaller number of ‘Latent’ variables, while retaining as much relevantvariability as possible. The variables in this space are then used to form a
regression onto the predicted Y-variables (the actual glucose levels measured by a reference method). This “two-way’” modeling tends to form much more ac-curate models than other simple linear multivariate methods (e.g. principalcomponent regression and multiple linear regression) as it automatically detects relevant X-variables and preferentially forms the model on these. Theprecision of the prediction is assessed by the commonly used Root Mean SquareError of Prediction (rmsep) [132]. Three independent datasets are required;one to form the model, one to validate the model, and one which the modellingprocess has not seen to test the model against ‘unknown’ data
Examination of the “residual” unmodelled variation in these experimentsindicates that there is a nonlinearity in the relationship between the X and Yvariables. This detracts from the models’ accuracy. To this end the inherently nonlinear capabilities of ANNs have been employed with an improved predic-tive capability resulting in the prediction of Fig. 11.
Rapid Analysis of High-Dimensional Bioprocesses Using Multivariate Spectroscopies 99
Fig. 10. PLS based prediction of glucose levels in one yeast batch fermentation by a modelformed and validated on glucose levels in two other independent fermentations. The rmsepis 41% of the mean value of the data

8/8/2019 23689262 Bio Analysis and Bio Sensors for Bio Process Monitoring 66
http://slidepdf.com/reader/full/23689262-bio-analysis-and-bio-sensors-for-bio-process-monitoring-66 106/236
The current area of interest is in trying to reduce the electrode instabilitieswhich are responsible for large baseline offsets when a model based on one fer-mentation is used to predict results from another. This can be done in eitherhardware, by coating the electrode to stabilise the interface [133],or in software,by using more powerful modelling methods such as Genetic Programming(GP) to automatically remove the effect of these instabilities from the model[134].
4.1.4
Electrode Polarisation and Fouling
In biological NLDS work, electrode polarisation is a serious problem at the low frequencies (up to a few tens of Hz) where the biology typically reacts moststrongly to the electric field; and its fluctuations can be similar in size to, or big-ger than, the small changes due to biological activity (e.g. upon glucose meta-bolism). It is therefore vital to control electrode polarisation insofar as is pos-sible. To obtain nonlinear electrochemical reproducibility, electrode surfaces
must be scrupulously clean, and this is very difficult to achieve. If any conta-mination is present, the biologically relevant signal may be unstable, distortedor concealed completely [135].
Electrode cleaning to ensure repeatable nonlinear dielectric spectra is a com-plex and empirical task, due to the lack of knowledge of the exact form of the
100 A.D. Shaw et al.
Fig. 11. Neural net prediction of glucose levels in one yeast batch fermentation by a modelformed and validated on glucose levels in two other independent fermentations. This experi-ment uses uncoated gold electrodes. The rmsep is 19%

8/8/2019 23689262 Bio Analysis and Bio Sensors for Bio Process Monitoring 66
http://slidepdf.com/reader/full/23689262-bio-analysis-and-bio-sensors-for-bio-process-monitoring-66 107/236
causative mechanisms operating in the electrode/electrolyte interface. Norepeatable and certain ways of obtaining a quiet and repeatable reference signalfrom an individual electrode surface have been found but simple abrasionworks best. Once clean, electrodes may stay stable for days, or become unstable
within a few minutes. Continual control readings, performed as indicatedabove, are vital during any series of experiments to be sure the electrode sur-face behaviour has not substantially altered during the experiments, in whichcase the results must be abandoned and the experiments repeated. ThisByzantine process can make the process of obtaining a lengthy series of resultswith continually clean electrodes a nightmare.
4.1.5
Electrode Coating
To prevent a protein from adhering to a metal surface, the surface can be coatedwith a sheet of poloxamers. These are a triblock copolymer consisting of PEO-PPO-PEO, in which two polyethylene oxide (PEO) chains are attached to ahydrophobic polyproylene oxide (PPO) anchor. This prevents the proteinbinding by steric repulsion overpowering the attraction between the proteinand the coating layer [136]. This coating layer stabilises the electrode interfaceslightly and prevents protein fouling, allowing the electrodes to be used after asimple cleaning and coating procedure. They then stay useable for a month.
The coating allows three independent datasets leading to the prediction of
PLS prediction of Fig. 12 (to be compared with that of Fig. 10) to be obtained
Rapid Analysis of High-Dimensional Bioprocesses Using Multivariate Spectroscopies 101
Fig. 12. PLS prediction of glucose levels in one yeast batch fermentation by a model formedand validated on glucose levels in two other independent fermentations. This experimentuses polymer coated electrodes. The rmsep is 35%

8/8/2019 23689262 Bio Analysis and Bio Sensors for Bio Process Monitoring 66
http://slidepdf.com/reader/full/23689262-bio-analysis-and-bio-sensors-for-bio-process-monitoring-66 108/236
rapidly and conveniently, without the prohibitive electrode problems discussedabove. It is also found that the coating linearises the data and allows PLS to per-form better in relation to nonlinear modelling methods.
4.1.6Genetic Programming
Genetic programming [137] is an evolutionary technique which uses the con-cepts of Darwinian selection to generate and optimise a desired computationalfunction or mathematical expression. It has been comprehensively studiedtheoretically over the past few years, but applications to real laboratory data asa practical modelling tool are still rather rare. Unlike many simpler modellingmethods, GP model variations that require the interaction of several measurednonlinear variables, rather than requiring that these variables be orthogonal.
An initial population of individuals, each encoding a potential solution to theoptimisation problem, is generated randomly and their ability to reproduce thedesired output is assessed. New individuals are generated either by mutation(the introduction of one or more random changes to a single parent individual)or by crossover (randomly re-arranging functional components between two ormore parent individuals). The fitness of the new individuals is then assessed,and the fitter individuals from the total population are more likely to becomethe parents of the next generation. This process is repeated until either the de-sired result is achieved or the rate of improvement in the population becomes
zero. It has been shown [137] that if the parent individuals are chosen according
102 A.D. Shaw et al.
Fig. 13. Genetic Program prediction of the data of Figures 7 and 8. The rmsep is 9%

8/8/2019 23689262 Bio Analysis and Bio Sensors for Bio Process Monitoring 66
http://slidepdf.com/reader/full/23689262-bio-analysis-and-bio-sensors-for-bio-process-monitoring-66 109/236
to their fitness values, the genetic method can approach the theoretical opti-mum efficiency for a search algorithm.
This technique allows the prediction of Fig. 10 and 11 to be improved to pro-duce Fig. 13.
Given the very heavy computational load of GP, it would not be the method of choice for problems which yield to simpler approaches. However the above datashow that it can be very beneficial on problems that have defeated other methods.
4.1.7
Other Microbial Systems
NLDS has also been successfully applied in this laboratory to measurements of photosynthesis in Rhodobacter capsulatus [138]; of glucose levels in erythro-cytes, both invasively and non-invasively [135]. It has also been used success-
fully to detect the subtle interaction of weak low-frequency magnetic fields withmembrane proteins of aggregating amoebal cells of Dictyostelium discoideum.Using PCA, a significant distinction was shown between cells previously ex-posed to pulsed magnetic fields (PMF) of 0.4 mT and 6 mT and their respectivecontrols. Significant distinction was also shown between cells exposed to 50 Hzsinusoidal magnetic fields of 9 mT and 90 mT and their respective controls.NLDS was able to demonstrate a dose response with respect to both duration of exposure and field strength. In all cases significant changes in intracellular bio-chemistry had also been shown. There is some evidence to support a hypothesis
that voltage gated calcium channels are involved in the response of Dictyoste-lium to PMFs [139, 140].
5Flow Cytometry
Flow cytometry [141, 142] is a technique that allows the measurement of multiple parameters on individual cells. Cells are introduced in a fluid streamto the measuring point in the apparatus. Here, the cell stream intersects a beamof light (usually from a laser). Light scattered from the beam and/or cell-as-
sociated fluorescence are collected for each cell that is analysed. Unlike themajority of spectroscopic or bulk biochemical methods it thus allows quantifi-cation of the heterogeneity of the cell sample being studied. This approach of-fers tremendous advantages for the study of cells in industrial processes, sinceit not only enables the visualisation of the distribution of a property within thepopulation, but also can be used to determine the relationship betweenproperties. As an example, flow cytometry has been used to determine the size,DNA content, and number of bud scars of individual cells in batch and con-tinuous cultures of yeast [143, 144]. This approach can thus provide informa-
tion on the effect of the cell cycle on observed differences between cells thatcannot be readily obtained by any other technique.Flow cytometry has been applied to the study of the formation of the bio-
polymer poly-b-hydroxybutyrate (PHB). While the formation of the polymercan be detected by changes in the light scattering behaviour of cells [145], its ac-
Rapid Analysis of High-Dimensional Bioprocesses Using Multivariate Spectroscopies 103

8/8/2019 23689262 Bio Analysis and Bio Sensors for Bio Process Monitoring 66
http://slidepdf.com/reader/full/23689262-bio-analysis-and-bio-sensors-for-bio-process-monitoring-66 110/236
cumulation has also been analysed using the hydrophobic fluorescent dye NileRed [146]. PHB is produced commercially for use in the manufacture of bio-degradable plastic materials and this approach has enabled researchers todetermine the effect of changes in nutrient limitation conditions on the pro-
duction and storage of PHB in individual cells [147].While these examples illustrate the role of flow cytometry in bioprocessmonitoring, the analyses have been conducted off-line thus making their use inbioprocess control impractical. Recently, a portable flow cytometer – theMicrocyte – [148] has been described, which due to its small size and lower cost(compared to conventional machines) allows flow cytometry to be used as anat-line technique [149]. Rønning showed that this instrument had a role to play in the determination of viability of starter cultures and during fermentation.The physiological status of each individual cell is likely to be an importantfactor in the overall productivity of the culture and is therefore a key parameter
in optimising production conditions.The problems of converting flow cytometry into an on-line technique are
discussed by Degelau and colleagues [150], however, more recently a flow in- jection flow cytometer for on-line monitoring of bioreactors has been developedby Zhao and colleagues [151]. In the system described a sample is removed fromthe fermentor under computer control. The sample is degassed prior to passinginto a microchamber where it is automatically diluted if necessary prior to theaddition of stains or other reagents. Following an appropriate incubation in themicrochamber the sample is delivered to the flow cytometer for analysis.This in-
strument has been used successfully to monitor both the production of greenfluorescent protein (Gfp) in E. coli and to determine the distribution of DNAcontent of a S. cerevisiae population without the necessity for operator input.With continuing decrease in costs and increase in automation flow cytometry islikely to play an increased role in bioprocess monitoring and control.
6Data Analysis
Whilst modern instruments may provide much more accurate data than those
of years ago, new types of instrument are being developed which provide dataof somewhat lesser accuracy, but which have other advantages (e.g. speed,throughput, on-line).Advances in computing methods help in the extraction of meaningful information from such data, which in the past would have been im-possible, and so bioinformatics has become an essential part of the experimen-tal procedure.
6.1
Data Pre-processing
Before carrying out any statistical analysis on multivariate data, it is importantto ensure that the data are valid, and in a suitable format. This means:
– Ensuring that there are no errors in the data– Normalising, when necessary
104 A.D. Shaw et al.

8/8/2019 23689262 Bio Analysis and Bio Sensors for Bio Process Monitoring 66
http://slidepdf.com/reader/full/23689262-bio-analysis-and-bio-sensors-for-bio-process-monitoring-66 111/236

8/8/2019 23689262 Bio Analysis and Bio Sensors for Bio Process Monitoring 66
http://slidepdf.com/reader/full/23689262-bio-analysis-and-bio-sensors-for-bio-process-monitoring-66 112/236
The belief is that the statistical method used (such as PLS, PCR, MLR, PCA,ANNs) will extract from the data those variables which are most important, anddiscard irrelevant information. Statistical theory shows that this is incorrect. Inparticular, the principle of parsimony states that a simple model (one with fewer
variables or parameters), if it is just as good at predicting a particular set of dataas a more complex model, will tend to be better at predicting a new, previously unseen data set [153–155]. Our work has shown that this principle holds.
There have been a number of methods of data reduction proposed, some of which are briefly described here.
One method is to use a variable ranking system, in which the best n variables(where n ranges from 1 to the total number of variables), are tested. Thevariables used for the value of n at which the best model is formed will then betaken to be the optimal. This method has proved very successful, particularly for relatively low noise NMR data from olive oils [156–158], the results clearly
showing that the use of all variables in model creation does not yield an optimalresult in most cases, and for Raman data [159], where the variables are peakheight, width, area and position, the peaks initially chosen being representativeof certain bonds within the substance being analysed. It has the advantage of being relatively quick (only n models need be formed), and simple to under-stand. It can also be a great aid to understanding the data being analysed.However, it does not take account of collinearity in the data, nor the possibility that two variables may be additively, but not individually, important
Taking Fourier transforms of spectra (e.g. [160, 161]) and selecting a suitable
cut-off will eliminate most of the noise whilst retaining most of the infor-mation. The precise point of the cut-off is not easy to determine, as there is atrade-off between eliminating noise and losing data. It is also likely that many of the remaining variables will be collinear (essentially saying the same thing),and therefore make the model unnecessarily complicated.
Using the first n principal components (where n is determined by somemetric which attempts to remove components containing only noise) also suf-fers from the problem of this trade-off, but does have the advantage that novariables remaining will be collinear (therefore they all contribute different in-formation to the model).
Genetic programming , described earlier, picks only certain variables from themodel. The rules, which may be in the form of a computer language such asLisp, or easily interpretable equations, produce a formula from which a resultcan be calculated (e.g. if (measurement_1> 2.37 and measurement_2 < 0.53) ormeasurement_3 > 4.28 then sample is adulterated else sample is clean) [162–165]. Rather than being a pre-processing step before statistical analysis, thismethod combines the variable selection and model formation stages into one.
6.3
Data Partitioning
It is,at this point, important to understand the difference between unsupervised methods and supervised methods. With the former, there is no indication givento the model creation program (e.g. PCA,self-organising maps) of where any of
106 A.D. Shaw et al.

8/8/2019 23689262 Bio Analysis and Bio Sensors for Bio Process Monitoring 66
http://slidepdf.com/reader/full/23689262-bio-analysis-and-bio-sensors-for-bio-process-monitoring-66 113/236
the data should lie,or its class or value.With such a technique, therefore, one setof data is sufficient. However, if variable selection is being used to produce theoptimum variables for the model, it is better to use two data sets, using one forestablishing the best number of variables, and the second for producing the
results.The remainder of this section deals with supervised methods.
6.3.1
Training and Testing
In order to create a prediction, the data must be divided up into a training set (on which the model is formed) and a query or test set (using which the modelis tested, and the best number of factors or epochs established).
Since most supervised methods of forming a model will use the query set in
order to establish the optimal number of factors (or epochs, in the case of anartificial neural network), a completely independent validation set is required,to ensure that the model is valid. This data set will not have been seen by themodel in any form at any time. The only reason for not using a third data set iswhere there are insufficient objects to form a meaningful model if the data aredivided into three. In such cases, it must be remembered that the results may appear better than they really are, and this fact should be noted in any results.Other methods of forming a model are able to establish the optimal factors orepochs from the training set alone, for example by dividing the training set into
two and alternately training the model on one section and testing on the other.In such cases, two data sets are probably sufficient.Replicates should always be kept in the same data set; not to do so would
definitely classify as ‘cheating’. If one of two replicates were in the training set,it would be expected that its partner in the validation set would be predictedwith accuracy.
6.3.2
The Extrapolation Problem
Statistical models are not in general able to extrapolate; that is to say, if for agiven variable, the training set data are in the range 3 to 4, there is no way ameaningful prediction can be made if the validation data contains a 5. Thismeans that the training set should encompass the whole of the query andvalidation sets.
For quantification (e.g. prediction of concentration in a solution), the solu-tion is easy: objects should be placed alternately in the training, query and(where there are sufficient objects) validation sets, ensuring that the objectswith the lowest and highest value in the target being predicted are in the
training set.For classification (e.g. identification of country of origin or variety of asample,or the bacterial strain), it is not quite so straightforward,as it is difficultto know within a class (country of origin, etc.) which data lie at the edge of thespectrum. This may, however, be achieved, by examining the data for each
Rapid Analysis of High-Dimensional Bioprocesses Using Multivariate Spectroscopies 107

8/8/2019 23689262 Bio Analysis and Bio Sensors for Bio Process Monitoring 66
http://slidepdf.com/reader/full/23689262-bio-analysis-and-bio-sensors-for-bio-process-monitoring-66 114/236
object within a group, and determining how the variables lie with respect tothose of other objects in the same class.With n variables, this means looking inn dimensional space; clearly not a task that is possible for the mere human. Tofacilitate this, a program called MultiPlex has been written by Dr. Alun Jones of
UWA (an extension of the duplex algorithm described in [166]). Using this pro-gram will ensure that the objects are divided between training, query and, if desired, validation, sets appropriately. Provided that any replicates in thesamples are correctly identified, it will also ensure that replicates are placed inthe same set.
7Concluding Remarks
“Organisms are not billiard balls, struck in deterministic fashion by the cue of natural
selection and rolling to optimal positions on life’s table. They influence their own destiny ininteresting, complex and comprehensible ways.” – S. J. Gould (1993) Evolution of organisms.In: Boyd CAR, Noble D (eds) The logic of life. Oxford University Press, p 5
Biological systems are indeed complex (and this differs from ‘complicated’ –[167]), but many of their most important features that are of interest to us forspecific purposes are in fact of low dimensionality. The key to understandingthem then lies in acquiring large amounts of the right kind of data which canact as the inputs to intelligent and sophisticated data processing and machinelearning algorithms. These approaches alone – especially those based on in-
duction – will help us unravel their workings [168].
Acknowledgments. We thank the BBSRC, the EPSRC and HEFCW for financialsupport of our collaborative programme in Analytical Biotechnology, Spectro-metry, Chemometrics and Machine Learning.
References
1. Kell D (1998) Trends in Biotechnology 16: 4912. Oliver SG, Winson MK, Kell DB, Baganz F (1998) Trends in Biotechnology 16: 3733. DeRisi JL, Iyer VR, Brown PO (1997) Science 278: 6804. de Saizieu A, Certa U, Warrington J, Gray C, Keck W, Mous J (1998) Nature Biotechnol
16:455. Humphery-Smith I, Cordwell SJ, Blackstock WP (1997) Electrophoresis 18:12176. Wilkins MR, Williams KL, Appel RD, Hochstrasser DF (1997) Proteome research: new
frontiers in functional genomics. Springer, Berlin Heidelberg New York7. Blackstock WP, Weir MP (1999) Tibtech 17:1218. Eisen MB, Spellman PT, Brown PO, Botstein D (1998) Proc Natl Acad Sc 95:14 8639. Kell DB (1980) Process Biochemistry 15:18
10. Clarke DJ, Kell DB, Morris JG, Burns A (1982) Ion-Selective Electrode Rev 4: 75
11. Lee MS, Hook DJ, Kerns EH,Volk KJ,Rosenberg IE (1993) Biological Mass Spectrometry 22:84
12. Heinzle E, Moes J, Griot M, Kramer H, Dunn IJ, Bourne JR (1984) Analytical ChimicaActa 163:219
13. Heinzle E, Oeggerli A, Dettwiler B (1990) Analytica Chimica Acta 238:101
108 A.D. Shaw et al.

8/8/2019 23689262 Bio Analysis and Bio Sensors for Bio Process Monitoring 66
http://slidepdf.com/reader/full/23689262-bio-analysis-and-bio-sensors-for-bio-process-monitoring-66 115/236
14. Matz G, Loogk M, Lennemann F (1998) Journal of Chromatography A 819: 5115. Namdev PK, Alroy Y, Singh V (1998) Biotechnology Progress 14: 7516. Bohatka S, langer G, Szilagyi J, Berecz I (1983) International Journal of Mass
Spectrometry 48:27717. Dongre AR, Hayward MJ (1996) Analytica Chimica Acta 327:1
18. Heinzle E, Kramer H, Dunn IJ (1985) Biotechnology and Bioengineering 2719. Lauritsen FR, Choudhury TK, Dejarme LE, Cooks RG (1992) Analytica Chimica Acta
266:120. Lauritsen FR, Nielsen LT, Degn H, Lloyd D, Bohatka S (1991) Biological Mass
Spectrometry 20:25321. Lloyd D, Ellis JE, Hillman K, Williams AG (1992) Journal of Applied Bacteriology 7322. Weaver JC (1982) Continuous monitoring of volatile metabolites by a mass spectro-
meter. In: Cohen JS (ed) Noninvasive Probes of Tissue Metabolism. J Wiley, New York23. Irwin WJ (1982) Analytical Pyrolysis: A Comprehensive Guide. Marcel Dekker, New York24. Meuzelaar HLC, Haverkamp J, Hileman FD (1982) Pyrolysis Mass Spectrometry of
Recent and Fossil Biomaterials. Elsevier,Amsterdam
25. Goodacre R, Kell DB (1996) Current Opinion in Biotechnology 7:2026. Magee JT (1993) Whole-organism fingerprinting.In: Goodfellow M,O’Donnell AG (eds).Handbook of New Bacterial Systematics.Academic Press, London, p 383
27. Tas AC, Vandergreef J (1994) Mass Spectrometry Reviews 13:15528. Goodacre R, Berkeley RCW (1990) FEMS Microbiology Letters 71:13329. Goodacre R, Berkeley RCW, Beringer JE (1991) Journal of Analytical and Applied
Pyrolysis 22:1930. Goodacre R, Rooney PJ, Kell DB (1998) Journal of Antimicrobial Chemotherapy 41:2731. Goodacre R, Trew S, Wrigley-Jones C, Neal MJ, Maddock J, Ottley TW, Porter N, Kell DB
(1994) Biotechnology and Bioengineering 44:120532. Schulten H-R, Lattimer RP (1984) Mass Spectrometry Reviews 3: 231
33. Van de Meent D, de Leeuw JW, Schenck PA, Windig W, Haverkamp J (1982) Journal of Analytical and Applied Pyrolysis 4:13334. Heinzle E,Kramer H, Dunn IJ (1985) Analysis of biomass and metabolites using pyroly-
sis mass spectrometry. In: Johnson A (ed) Modelling and Control of BiotechnologicalProcesses. Pergamon, Oxford
35. Sandmeier EP, Keller J, Heinzle E, Dunn IJ, Bourne JR (1988) Development of an on-linepyrolysis mass spectrometry system for the on-line analysis of fermentations. In:Hienzle E, Reuss M (eds). Mass Spectrometry in Biotechnological Process Analysis andControl. Plenum, New York, p 209
36. Heinzle E (1992) Journal of Biotechnology 25:8137. Goodacre R, Edmonds AN, Kell DB (1993) Journal of Analytical and Applied Pyrolysis
26:9338. Goodacre R, Kell DB (1993) Analytica Chimica Acta 279:1739. Goodacre R, Neal MJ, Kell DB (1994) Analytical Chemistry 66:107040. Goodacre R, Karim A, Kaderbhai MA, Kell DB (1994) Journal of Biotechnology 34:18541. McGovern AC, Ernill R, Kara BV, Kell DB, Goodacre R (1999) Journal of Biotechnology
72:157–16742. Broadhurst D, Goodacre R, Jones A, Rowland JJ, Kell DB (1997) Anal. Chim. Acta 348: 7143. Goodacre R, Trew S, Wrigley-Jones C, Saunders G, Neal MJ, Porter N, Kell DB (1995)
Analytica Chimica Acta 313:2544. McGovern AC, Broadhurst D, Taylor J, Gilbert RJ, Kaderbhai N, Small DAP, Kell DB,
Goodacre R (1999) (in preparation)45. Kang SG, Lee DH, Ward AC, Lee KJ (1998) Journal of Microbiology and Biotechnology
8:52346. Kang SG, Kenyon RGW, Ward AC, Lee KJ (1998) Journal of Biotechnology 62:147. Schrader B (1995) Infrared and Raman spectroscopy: methods and applications. Verlag
Chemie, Weinheim.48. Ingle Jr JD, Crouch SR (1988) Spectrochemical Analysis, Prentice-Hall, London
Rapid Analysis of High-Dimensional Bioprocesses Using Multivariate Spectroscopies 109

8/8/2019 23689262 Bio Analysis and Bio Sensors for Bio Process Monitoring 66
http://slidepdf.com/reader/full/23689262-bio-analysis-and-bio-sensors-for-bio-process-monitoring-66 116/236
49. Martin KA (1992) Applied spectroscopy reviews 27:32550. Howard WW, Sekulic S, Wheeler MJ, Taber G, Urbanski FJ, Sistare FE, Norris T, Aldridge
PK (1998) Applied Spectroscopy 52:1751. Macaloney G, Draper I, Preston J, Anderson KB, Rollins MJ, Thompson BG, Hall JW,
McNeil B (1996) Food and Bioproducts Processing 74:212
52. Yano T, Harata M (1994) Journal of Fermentation and Bioengineering 77: 65953. Marquardt LAA, M.A. Small,G.W. (1993) Anal chemistry 65: 327154. Macaloney G, Hall JW, Rollins MJ, Draper I, Thompson BG, McNeil B (1994)
Biotechnology Techniques 8:28155. Brimmer PJ, Hall JW (1993) Canadian Journal of Applied Spectroscopy 38:15556. Yano T, Aimi T, Nakano Y, Tamai M (1997) Journal of fermentation and bioengineering
84:46157. Norris T, Aldridge PK (1996) Analyst 121:100358. Hall JW, McNeill B, Rollins MJ, Draper I, Thompson BG, Macaloney G (1996) Applied
Spectroscopy 50:10259. Riley MR, Rhiel M, Zhou X, Arnold MA (1997) Biotechnology and Bioengineering 55:11
60. McShane MJ, Cote GL (1998) Applied Spectroscopy 52:107361. Swierenga H, Haanstra WG, deWeijer AP, Buydens LMC (1998) Applied Spectroscopy 52:762. Cavinato AG, Mayes DM, Ge ZH, Callis JB (1990) Analytical Chemistry 62:197763. Ge ZC,AG Callis, JB (1994) Analytical Chemistry 66:135464. Vaccari G, Dosi E, Campi AL, Gonzalezvara A, Matteuzzi D, Mantovani G (1994)
Biotechnology and Bioengineering 43:91365. Vaccari G, Dosi E, Campi AL, Mantovani G (1993) Zuckerindustrie 118: 26666. Varadi M, Toth A, Rezessy J (1992) Application of NIR in a fermentation process. VCH
Publishers, New York67. Hammond SV (1992) NIR Analysis of Antibiotic Fermentations. In: Murray I, Cowe IA
(eds) Making Light Work: Advances in Near-Infrared Spectroscopy. VCH Publishers,
New York, p 58468. Hammond SV (1992) Near-Infrared Spectroscopy – A Powerful Technique for At-Lineand Online Analysis of Fermentations. In: Bose A (ed) Harnessing Biotechnology for the21st Century: Proceedings of the Ninth International Symposium and Exhibition.American Chemical Society, Washington D.C., p 325
69. Validyanathan S, Macaloney G, McNeill B (1999) Analyst 124:15770. Koza JR (1995) Proceedings of Wescon 95:E2. Neural-Fuzzy Technologies and Its
Applications71. McShane MJ, Cote GL, Spiegelman C (1997) Applied Spectroscopy 51:155972. Bangalore AS, Shaffer RE, Small GW, Arnold MA (1996) Analytical Chemistry 68: 420073. Shaffer RE, Small GW, Arnold MA (1996) Analytical Chemistry 68: 266374. Hassell DC, Bowman EM (1998) Applied Spectroscopy 52:A1875. Guzman M, deBang M, Ruzicka J, Christian GD (1992) Process Control and Quality
2:11376. Alberti JC, Phillips JA, Fink DJ, Wacasz FM (1985) Biotechnology and Bioengineering
Symp. 15: 68977. Picque D, Lefier D, Grappin R, Corrieu G (1993) Analytica Chimica Acta 279: 6778. Fayolle P, Picque D, Corrieu G (1997) Vibrational Spectroscopy 14: 24779. Hayakawa K, Harada K, Sansawa H (1997) Abstracts of the 8th European Congress on
Biotechnology 27580. Wilson RH, Holland JK, Potter J (1994) Chemistry in Britain 30: 99381. Winson MK, Goodacre R, Timmins ÉM, Jones A, Alsberg BK, Woodward AM, Rowland
JJ, Kell DB (1997) Analytica Chimica Acta 348: 27382. Kell DB, Winson MK, Goodacre R, Woodward AM, Alsberg BK, Jones A, Timmins ÉM,
Rowland JJ (1998) DRASTIC (Diffuse Reflectance Absorbance Spectroscopy Taking InChemometrics). A novel, rapid, hyperspectral, FT-IR-based approach to screening forbiocatalytic activity and metabolite overproduction. In: Kieslich K (ed) New Frontiers inScreening for Microbial Biocatalysts. Elsevier Science B.V., The Netherlands, p 61
110 A.D. Shaw et al.

8/8/2019 23689262 Bio Analysis and Bio Sensors for Bio Process Monitoring 66
http://slidepdf.com/reader/full/23689262-bio-analysis-and-bio-sensors-for-bio-process-monitoring-66 117/236
83. Winson MK, Todd M, Rudd BAM, Jones A, Alsberg BK, Woodward AM, Goodacre R,Rowland JJ, Kell DB (1998) A DRASTIC (Diffuse Reflectance Absorbance Spectroscopy Taking in Chemometrics) approach for the rapid analysis of microbial fermentationproducts: quantification of aristeromycin and neplanocin A in Streptomyces citricolor broths. In: Kieslich, K (ed) New Frontiers in Screening for Microbial Biocatalysts.
Elsevier Science B.V., The Netherlands, p 18584. Kell DB, Sonnleitner B (1995) Trends Biotechnol. 13:48185. Montague GA (1997) Monitoring and control of fermenters, Institute of Chemical
Engineers London86. Pons M-N (1991) Bioprocess monitoring and control. Hanser, Munich87. Kell DB, Markx GH, Davey CL, Todd RW (1990) Trends in Analytical Chemistry 9:19088. Adar F, Geiger R, Noonan J (1997) Applied Spectroscopy Reviews 32: 4589. Chase B (1994) Appl Spectrosc 48 :14 A90. Gerrard DL (1994) Analytical Chemistry 66: R 54791. Góral J, Zichy V (1990) Spectrochimica Acta 46 A:25392. Graselli JG, Bulkin BJ (1991) Analytical Raman spectroscopy, John Wiley, New York
93. Hendra P, Jones C, Warnes G (1991) Fourier Transform Raman Spectroscopy. EllisHorwood, Chichester94. Hendra PJ, Wilson HMM, Wallen PJ,Wesley IJ, Bentley PA, Arruebarrena Baez M, Haigh
JA, Evans PA, Dyer CD, Lehnert R, Pellow-Jarman MV (1995) Analyst 120: 98595. Hirschfeld T, Chase B (1986) Appl Spectrosc 40:13396. Keller S, Schrader B, Hoffmann A, Schrader W, Metz K, Rehlaender A, Pahnke J, Ruwe M,
Budach W (1994) J Raman Spectrosc 25:66397. Naumann D, Keller S, Helm D, Schultz C, Schrader B (1995) Journal of Molecular
Structure 347:39998. Parker SF (1994) Specrochim. Acta 50 A:184199. Puppels GJ, Colier W, Olminkhof JHF, Otto C, Demul FFM, Greve J (1991) Journal of
Raman Spectroscopy 22:217100. Puppels GJ, Greve J (1993) Adv Spectrosc 20 A:231101. Puppels GJ, Schut TCB, Sijtsema NM, Grond M, Maraboeuf F, Degrauw CG, Figdor CG,
Greve J (1995) Journal of Molecular Structure 347: 477102. Schrader B, Baranovic G, Keller S, Sawatzki J (1994) Fresenius Journal of Analytical
Chemistry 349:4103. Treado PJ, Morris MD (1994) Applied spectroscopy reviews 29:1104. Twardowski J, Anzenbacher P (1994) Raman and infrared spectroscopy in biology and
biochemistry. Ellis Horwood, Chichester105. Carrabba MM, Spencer KM, Rich C, Rauh D (1990) Appl Spectrosc 44 :1558106. Kim M, Owen H, Carey PR (1993) Applied Spectroscopy 47:1780107. Puppels GJ, Huizinga A, Krabbe HW, Deboer HA, Gijsbers G, Demul FFM (1990) Review
of Scientific Instruments 61:3709108. Tedesco JM, Owen H, Pallister DM, Morris MD (1993) Analytical Chemistry 65: A 441109. Treado PJ, Morris MD (1990) Spectrochimica Acta Reviews 13: 355110. Turner JF, Treado PJ (1996) Applied Spectroscopy 50:277111. Griffiths PR, de Haseth JA (1986) Fourier transform infrared spectrometry. John Wiley,
New York112. Williams KPJ, Pitt GD, Batchelder DN, Kip BJ (1994) Applied spectroscopy 48: 232113. Williams KPJ, Pitt GD, Smith BJE, Whitley A, Batchelder DN, Hayward IP (1994) Journal
of Raman Spectroscopy 25:131114. Erckens RJ, Motamedi M, March WF, Wicksted JP (1997) Journal Of Raman
Spectroscopy 28:293115. Wicksted JP, Erckens RJ, Motamedi M, March WF (1995) Applied Spectroscopy 49: 987116. Shope TB,Vickers TJ, Mann CK (1987) Applied Spectroscopy 41: 908117. Gomy C, Jouan M, Dao NQ (1988) Analytica Chimica Acta 215: 211118. Gomy C, Jouan M, Dao NQ (1988) Comptes Rendus De L Academie Des Sciences Serie
Ii-Mecanique Physique Chimie Sciences De L Univers Sciences De La Terre 306:417
Rapid Analysis of High-Dimensional Bioprocesses Using Multivariate Spectroscopies 111

8/8/2019 23689262 Bio Analysis and Bio Sensors for Bio Process Monitoring 66
http://slidepdf.com/reader/full/23689262-bio-analysis-and-bio-sensors-for-bio-process-monitoring-66 118/236
119. Spiegelman CH, McShane MJ, Goetz MJ, Motamedi M, Yue QL, Cote GL (1998) AnalChem 70:35
120. Harris CM, Todd RW, Bungard SJ, Lovitt RW, Morris JG, Kell DB (1987) EnzymeMicrobial Technol 9:181
121. Kell DB (1987) The principles and potential of electrical admittance spectroscopy: an
introduction. In: Turner APF, Karube I, Wilson GS (eds). Biosensors; fundamentals andapplications. Oxford University Press, Oxford, p 427
122. Pethig R, Kell DB (1987) Phys Med Biol 32 :933123. Kell DB, Kaprelyants AS, Weichart DH, Harwood CL, Barer MR (1998) Antonie van
Leeuwenhoek 73:169124. Kell DB, Davey CL (1992) Bioelectrochemistry and Bioenergetics 28: 425125. Nicholson DJ, Kell DB, Davey CL (1996) Bioelectrochemistry and Bioenergetics 39:185126. Davey CLK, D. B. (1998) Bioelectrochemistry and Bioenergetics 46: 91127. Davey CL, Kell DB (1998) Bioelectrochemistry and Bioenergetics 46:105128. Debye P (1929) Polar Molecules. Dover Press, New York129. Woodward AM, Kell DB (1990) Bioelectrochemistry and Bioenergetics 24:83
130. Davey CL, Kell D B (1990) The dielectric properties of cells and tissues what can they tellus about the mechanisms of field/cell interactions. In: O’Connor ME, Bentall RHC,Monahan JC (eds). Emerging Electromagnetic Medicine. Springer, Berlin HeidelbergNew York, p 19
131. Kell DB, Astumian RD, Westerhoff HV (1988) Ferroelectrics 86:59132. Martens H, Næs T (1989) Multivariate calibration. John Wiley, Chichester133. Woodward AM, Gilbert RJ, Kel DB (1999) Bioelectrochemistry and Bioenergetics (in
press)134. Woodward AM, Davies EA, Denyer S, Olliff C, Kell DB (1999) Submitted for publication
in Journal of Electroanalytical Chemistry 135. Woodward AM,Jones A,Zhang X-Z, Rowland JJ, Kell DB (1996) Bioelectrochemistry and
Bioenergetics 40:99136. Jeon SI, Lee JH, Andrade JD, de Gennes PG (1991) Journal of Colloidal and InterfaceScience 142:149
137. Koza JR (1992) Gentic programming: on the programming of computers by means of natural selection, MIT press Cambridge, MA
138. McShea A, Woodward AM, Kell DB (1992) Bioelectrochemistry and Bioenergetics29:205
139. Davies EA, Olliff C, Wright I, Woodward AM, Kell DB (1999) Bioelectrochemistry andBioenergetics (in press)
140. Davies EA, Woodward AM, Kell DB (1999) Bioelectromagnetics (in press)141. Davey HM, Kell DB (1996) Microbiol Rev 60:641142. Shapiro HM (1995) Practical flow cytometry, 3rd edn. Alan R. Liss, New York143. Münch T, Sonnleitner B, Fiechter A (1992) Biotechnology 22:329144. Münch T, Sonnleitner B, Fiechter A (1992) Journal of Biotechnology 24:299145. Srienc F, Arnold B, Bailey JE (1984) Biotechnology and Bioengineering 26:982146. Müller S, Lösche A, Bley T, Scheper T (1995) Applied Microbiology and Biotechnology
43:93147. Müller S, Lösche A, Bley T (1993) Acta Biotechnol 13:289148. Gjelsnes O, Tangen R (1994) Norway patent WO 94/29695149. Rønning Ø (1999) Genetic Engineering News 19:18150. Degelau A, Freitag R, Linz F, Middendorf C, Scheper T, Bley T, Müller S, Stoll P, Reardon
KF (1992) Journal of Biotechnology 25:115151. Zhao R, Natarjan A, Srienc F (1999) Biotechnology and Bioengineering 62: 609152. Neal MJ, Goodacre R, Kell DB (1994) On the analysis of pyrolysis mass spectra using
artificial neural networks. Individual input scaling leads to rapid learning. inProceedings of the World Congress on Neural Networks. International Neural NetworkSociety San Diego
153. de Noord OE (1994) Chemometrics and Intelligent Laboratory Systems 23: 65
112 A.D. Shaw et al.

8/8/2019 23689262 Bio Analysis and Bio Sensors for Bio Process Monitoring 66
http://slidepdf.com/reader/full/23689262-bio-analysis-and-bio-sensors-for-bio-process-monitoring-66 119/236
154. Flury B, Riedwyl H (1988) Multivariate Statistics: A Practical Approach. Chapman andHall, London
155. Seasholtz MB, Kowalski B (1993) Analytica Chimica Acta 277:165156. Shaw AD, di Camillo A, Vlahov G, Jones A, Bianchi G, Rowland J, Kell DB (1996)
Discrimination of Different Olive Oils using 13C NMR and Variable Reduction. in Food
Authenticity '96. Norwich, UK157. Shaw AD, di Camillo A, Vlahov G, Jones A, Bianchi G, Rowland J, Kell DB (1997)
Analytica Chimica Acta 348: 357158. Vlahov G, Shaw AD, Kell DB (1999) Accepted for publication in Journal of the American
Oil Chemists Society 159. Shaw AD, Kaderbhai N, Jones A, Woodward A, Goodacre R, Rowland J, Kell DB (1999)
Accepted for publication in Applied Spectrometry 160. Boschelle O, Giomo A, Conte L, Lercker G (1994) La Rivista Italiana delle Sostanze Grasse
71:57161. Hazen KHA, MA Small, GW (1994) Applied spectroscopy 48:477162. Gilbert RJ, Goodacre R, Woodward AM, Kell DB (1997) Analytical Chemistry 69: 4381
163. Gilbert RJ, Goodacre R, Shann B, Taylor J, Rowland JJ, Kell DB (1998) GeneticProgramming based Variable Selection for High Dimensional Data in Proceedings of Genetic Programming 1998. Morgan Kaufmann, Madison, Wisconsin, USA
164. Taylor J, Winson MK, Goodacre R, Gilbert RJ, Rowland JJ, Kell DB (1998) GeneticProgramming in the Interpretation of Fourier Transform Infrared Spectra:Quantification of Metabolites of Pharmaceutical Importance in Genetic Programming1998. Morgan Kaufmann, Madison, Wisconsin, USA
165. Taylor J, Goodacre R, Wade W, Rowland JJ, Kell DB (1998) FEMS Microbiology Letters160:237
166. Snee RD (1977) Technometrics 19:415167. Bialy H (1999) Nature Biotechnology, in the press
168. Kell DB, Mendes P (1999) Snapshots of systems: metabolic control analysis and bio-technology in the post-genomic era. In: Cornish-Bowden A, Cardenás ML (eds).Technological and Medical Implications of Metabolic Control Analysis (in press) (andsee http://gepasi.dbs.aber.ac.uk/dbk/mca99.htm). Plenum Press, New York
Rapid Analysis of High-Dimensional Bioprocesses Using Multivariate Spectroscopies 113

8/8/2019 23689262 Bio Analysis and Bio Sensors for Bio Process Monitoring 66
http://slidepdf.com/reader/full/23689262-bio-analysis-and-bio-sensors-for-bio-process-monitoring-66 120/236
Advances in Biochemical Engineering/Biotechnology,Vol. 66Managing Editor: Th. Scheper© Springer-Verlag Berlin Heidelberg 1999
On-line and Off-line Monitoring of the Productionof Cephalosporin C by Acremonium chrysogenum
G. Seidel, C. Tollnick, M. Beyer and K. Schügerl*
Institut für Technische Chemie der Universität Hannover, Callinstr. 3, D-30167 Hannover,Germany * E-mail: [email protected]
Process monitoring of cephalosporin C formation by Acremonium chrysogenum in laboratory investigations is considered. The goal of these investigations is the identification of bottlenecks in the biosynthesis and the improvement of the process performance. Based on
reports of other research groups and own experience the key parameters were selected, whichinfluence the process performance. They are: dissolved oxygen and pH values. In addition theconcentrations of biomass, DNA, glucose and reducing sugars (glucose, maltose, maltotrioseand oligosaccharides), methionine, other nitrogen sources (ammonium ion, other aminoacids), organic acids, phosphate, sulfate, dissolved organic carbon, proteins, product andprecursors in the cell free cultivation medium are monitored. In addition the intracellularconcentrations of RNA, DNA, proteins, amino acids as well as the activities of the enzymes of the biosynthesis of cephalosporin C are determined.The influence of these parameters on thebiosynthesis is discussed.
Keywords. Cephalosporin C, Acremonium chrysogenum Extracellular components, Intra-
cellular components,Enzyme activities of biosynthesis, Bottleneck of biosynthesis
1 Introduction . . . . . . . . . . . . . . . . . . . . . . . . . . . . . . . 115
2 Analysis of Extracellular Components . . . . . . . . . . . . . . . . . 118
2.1 Off-Line Monitoring of Medium Components . . . . . . . . . . . . 1182.2 On-Line Monitoring of Medium Components . . . . . . . . . . . . . 1182.3 On-Line and Off-Line HPLC Monitoring . . . . . . . . . . . . . . . 119
2.3.1 On-Line Product and Precursor Analysis . . . . . . . . . . . . . . . 1202.3.2 Off-Line Amino Acid and ACV Analysis . . . . . . . . . . . . . . . . 1222.3.3 On-Line Carboxylic Acid Analysis . . . . . . . . . . . . . . . . . . . 123
3 Analysis of Intracellular Components . . . . . . . . . . . . . . . . . 124
3.1 Cell Disintegration . . . . . . . . . . . . . . . . . . . . . . . . . . . . 1243.2 Measurement of RNA . . . . . . . . . . . . . . . . . . . . . . . . . . 1253.3 Preconditioning,Amino Acid Concentrations and Enzyme
Activity Measurement . . . . . . . . . . . . . . . . . . . . . . . . . . 126
4 2D-Fluorescence Spectroscopy . . . . . . . . . . . . . . . . . . . . . 127
5 Morphology . . . . . . . . . . . . . . . . . . . . . . . . . . . . . . . 127

8/8/2019 23689262 Bio Analysis and Bio Sensors for Bio Process Monitoring 66
http://slidepdf.com/reader/full/23689262-bio-analysis-and-bio-sensors-for-bio-process-monitoring-66 121/236
6 Discussion . . . . . . . . . . . . . . . . . . . . . . . . . . . . . . . . 128
7 Conclusion . . . . . . . . . . . . . . . . . . . . . . . . . . . . . . . . 130
References . . . . . . . . . . . . . . . . . . . . . . . . . . . . . . . . . . . . 130
List of Symbols and Abbreviations
AA amino acidAAA a-amino adipinic acidACV d-(a-aminoadipyl-l-cysteinyl-d-valineACVS ACV synthase
Arg arginineAsp asparagineCPR carbon dioxyde formation rateCPC cephalosporin CCys cysteinDAC deacetylcephalosporin CDAOC deacetoxycephalosporin CDAOCS DAOC synthaseDNA desoxyribonucleic acidDO dissolved oxygen concentrationFIA flow injection analysisGlu glutamateGln glutamineGly glycineGOD glucose oxidaseHPLC high performance liquid chromatography His histidinIle isoleucine IIeIPN isopenicillin N
IPNS IPN synthaseLeu leucineLys lysineNAD(P)H nicotinamid-adenin-dinucleide(phosphate)OPA o-phtalaldehydeOTR oxygen transfer ratePEN penicillin NPhe phenylalaninePro prolineRNA ribonucleic acidSer serineTrp tryptophanTyr tyrosineVal valine
116 G. Seidel et al.

8/8/2019 23689262 Bio Analysis and Bio Sensors for Bio Process Monitoring 66
http://slidepdf.com/reader/full/23689262-bio-analysis-and-bio-sensors-for-bio-process-monitoring-66 122/236
1Introduction
Process monitoring is a prerequisite for the improvement of process per-
formance,that means the identification of bottlenecks in biosynthesis, to improvethe process strategy and to use suitable process control. In situ and fast on-linemonitoring is needed for process control, but no fast analysis is necessary foridentification of bottlenecks and for evaluation of the optimal process strategy.
For the production process only the monitoring of the main key parametersare needed when the optimal process has been evaluated in laboratory or inpilot plant.
In the present paper the process monitoring of cephalosporin C (CPC)formation by Acremonium chrysogenum in laboratory investigations are con-sidered. The goal of these investigations was the identification of bottlenecks in
the biosynthesis and the improvement of process performance by maximizingthe product concentration and yield coefficient and by minimizing the by-products, which impair the product purification.
Based on reports of other groups and own experience key parameters wereselected, which influence the process performance. Easily-utilized carbon sour-ces such as glucose have been known for long time ago to exert negative effectson b-lactam biosynthesis [1–4]. Methionine markedly stimulates CPC andpenicillin N (PEN) formation by A. chrysogenum [5, 6] and influences themorphology [7].
The biosynthesis of b-lactam antibiotics is subject to nitrogen source regula-tion [8, 9], so ammonium ions repress b-lactam synthetases, especially ex-pandase in A. chrysogenum [10] and ammonium sulfate represses both ACVSand expandase [11]. Excess of phosphate exerts its negative effect indirectly by increasing the rate of glucose consumption, thus enhancing carbon sourceregulation [12].However, Martin et al. [13] found that phosphate interferes withCPC and PEN production in absence of glucose in the same fungus. ACVS,cyclase and expandase are repressed by higher concentration of phosphate [14].The dissolved oxygen concentration (DO) level strongly influences the bio-synthesis of CPC. At low DO PEN concentration increases and CPC production
is repressed [4, 15–17]. In contrast to this the growth rate is only moderately influenced because of the alternative (cyanide resistant) respiration of thisfungus, which becomes active at low DO values [18–20]. The cephalosporinconcentration is considerably influenced by the amount of peanut flour [21] aswell as by the amount of corn steep liquor [22]. At the end of the cultivation asignificant amount of deacetycephalosporin C (DAC) is formed. The deviationof the pH value of the cultivation medium from its optimum enhances thedecomposition of CPC to DAC (unpublished results). Bottlenecks of the bio-synthesis of CPC were investigated using low producing A. chrysogenum strains
[23, 24]. Morphological differentiation is important for the product formation:arthrospore and product formation are closely connected [25–27]. The effectsof various ions on the activity of the enzymes of biosynthesis were investigatedby several research groups: Mg2+ on ACVS [28] Fe 2+ on cyclase [29] Fe 2+ onexpandase/hydrolase [10, 30], Mg2+ on acyltransferase [31, 32].
On-line and Off-line Monitoring of the Production of Cephalosporin C by Acremonium chrysogenum 117

8/8/2019 23689262 Bio Analysis and Bio Sensors for Bio Process Monitoring 66
http://slidepdf.com/reader/full/23689262-bio-analysis-and-bio-sensors-for-bio-process-monitoring-66 123/236
The key components for process monitoring were selected according to thesedata and some additional information. The in situ monitoring of the DO as wellas the oxygen and carbon dioxide concentrations in the off gas allowed theevaluation of the oxygen transfer rate (OTR), the CO2 production rate (CPR)
and the respiratory quotient (RQ). The control of the pH-value and the DO wasthe prerequisite for the maintenance of the optimal growth and product for-mation conditions.
2Analysis of Extracellular Components
2.1
Off-Line Monitoring of Medium Components
Before and after the sampling, the sampling valve of the bioreactor wassterilized with wet steam. It was necessary to determine the pH of the samplesto calibrate the pH values monitored in situ with the installed electrodes,because of the their drift during the wet steam sterilization of the whole reactor.
The biomass determination by weight of the sediment after centrifugation at3500 rpm at 10 min and drying at 110 °C for 48 h was not possible because of the solid content of the cultivation medium. However, the solid medium com-ponents were consumed gradually, thus after 100 h the sediment amount wasidentical to the biomass one. The variation of the sediment amount with the
time in the first 100 h gave only a qualitative picture on the increase of the bio-mass amount.Protein was analyzed according to Bradford [33] from the supernatant of
3¥2 ml samples after storage at –18 °C. DNA concentration was determinedaccording to the method of Dische modified by Burton [34]. One of theC-source was dry glucose syrup consisting of 1.5% glucose, 35% maltose, 21%maltotriose and 42.5% oligosaccharides. The sample was treated with amylo-glucosidase and the glucose formed was determined by p-hydroxybenzoic acidhydrazide (pHBAH) as described by Lever [35] and Schmidt [36]. The test set of Merck (Spectroquant P14848) was used for the determination of phosphate
concentration. The method of the German Industrial Standard (DIN 1983) wasapplied for the measurement of the ammonium ion concentration. To renderthe carbon balance, the dissolved organic carbon (DOC) and dissolved in-organic carbon (DIC) were measured with a TOCOR 3-Analyzer (Maihak Co).
2.2
On-Line Monitoring of Medium Components
The samples for on-line analysis were taken through a polysulfone membrane
[37]. The seven channel automatic analyzer system consisted of six air-segment-ed continuous flow-wet chemical analyzers (Skalar analytics) to measure theconcentration of ammonia with ion selective electrode (Philips IS-570), phos-phate with ammonium molybdate at 880 nm, reducing sugar with pHBAH at410 nm, methionine with Na-nitroprusside at 505 nm, cephalosporin C with
118 G. Seidel et al.

8/8/2019 23689262 Bio Analysis and Bio Sensors for Bio Process Monitoring 66
http://slidepdf.com/reader/full/23689262-bio-analysis-and-bio-sensors-for-bio-process-monitoring-66 124/236
cephalosporinase at 254 nm, sulfate with methylthymolblue complex at 450 nm[38, 39].
The glucose was determined enzymatically (Yellow Springs Instruments).The response time of the complete analyzer system was ca. 37 min, of which
5 min are due to the transfer distance of 3 m between the reactor, filtrationmodule and analyzer system. The continuous air segmented flow analyzers havethe disadvantage that after 3– 4 days operation, microorganisms growth wasdetected in the non aseptic analyzer system.
Better experience was gained with flow injection analyzers (FIAs), in whicha small amount of sample is injected into the carrier stream of reagent and thereaction product concentration is monitored in a flow through detector [40]. If detectors with short response time are used and depending on the type of analyte and matrix, there is a capacity for 15–20 measurements per hour.Biosensors are especially suitable as detectors. On-line determination of
cephalosporin C was determined with a b-lactamase field effect transistor(FET)-FIA [41] and urea with a urease FET-FIA [42]. Glucose was determinedby a glucose oxydase (GOD) FET-FIA. During the reaction gluconic acid isformed and the concentration is determined by the pH sensitive FET [43].Because this detector is sensitive to the buffer capacity of the sample as well,dif-ferent fluoride sensitive FETs were applied [44]. The hydrogen peroxyde formedduring the reaction of glucose with GOD reacts with 4-fluoroaniline in presenceof peroxidase (POD) and forms a fluoride ion which is detected by the fluoridesensitive FET [44].
Another FIA system uses a cartridge of 1 ml volume with immobilizedenzyme, e.g. glucose oxidase (GOD) which converts glucose to gluconic acid.This reaction produces hydrogen peroxide and consumes oxygen, the concen-tration of which is measured by a mini oxygen electrode. The concentration of several other sugars can be measured with this method after they were conver-ted enzymatically to glucose, glucopyranose, xylopyranose, galactopyranose,etc. [45] which are converted by the corresponding oxidases to gluconic acid orketo-sugars and hydrogen peroxide. These reactions consume oxygen as well.Also alcohols, amino acids, lactate were measured by means of the cor-responding oxidases [46].
2.3
On-Line and Off-Line HPLC Analyses
The biosynthesis of CPC is well known. The first step of CPC synthesis is the for-mation of the tripeptide d-(l-a-aminoadipyl)-l-cysteinlyl-d-valine (LLD-ACV)from l-a-aminoadipinic acid (AAA), l-cystein (CYS ) and d-valine (VAL) by theLLD-ACV synthetase (ACVS). LLD-ACV is converted with the enzyme isopenicil-lin N -synthetase (cyclase) to isopenicillin N (IPN) and then with isopenicillin N -
epimerase to penicillin N (PEN). The 6-ring is formed by deacetoxycephalosporinC-synthase (expandase). Deacetoxycephalosporin C (DAOC) is converted withdeacetoxycephalosporin C-hydroxylase to decacetylcephalosporin C (DAC) andthe latter with deacetylcephalosporin C-acyltransferase to CPC (Fig. 1). Exceptthe amino acid and ACV, all others were monitored by on-line HPLC.
On-line and Off-line Monitoring of the Production of Cephalosporin C by Acremonium chrysogenum 119

8/8/2019 23689262 Bio Analysis and Bio Sensors for Bio Process Monitoring 66
http://slidepdf.com/reader/full/23689262-bio-analysis-and-bio-sensors-for-bio-process-monitoring-66 125/236

8/8/2019 23689262 Bio Analysis and Bio Sensors for Bio Process Monitoring 66
http://slidepdf.com/reader/full/23689262-bio-analysis-and-bio-sensors-for-bio-process-monitoring-66 126/236
detectable change in composition. Before the analyses the samples weredeproteinated with methanol,stored on ice overnight and then centrifuged. Theproduct and precursor analysis was performed with an automated HPLC-system (Fig. 3), even the later described amino acid detection was carried outwith an equal scheme.
The system consisted of an autosampler (Gilson XL 222, Abimed), pump
(Irica), injection valve (Valco), precolumn, column (Macherey and Nagel),thermostate (Julabo), two channel UV-detector (Gynkotek), interface (CSI-box)for control of sampling and data monitoring and a PC (486 DX66) containingthe APEX-chromatography Workstation (Autochrom inc. Version 2.11). Areversed-phase Nucleosil 5 R C18 packed column with 12.5 or 25 cm length wasused for the separation of the substances. Methanol containing aqueous phos-phate buffer supplemented with tetrabutylammoniumhydrogen sulfate wasapplied as eluent. The detection was performed at 260 and 220 nm and chro-matograms were monitored and evaluated by APEX workstation. The furtherevaluation of the analysis results were carried out with Program Origin 5.0(MicroCal Software). Figure 4 shows a typical chromatogram of the productand precursors.
On-line and Off-line Monitoring of the Production of Cephalosporin C by Acremonium chrysogenum 121
Fig. 2. Modules for on-line sampling of cell-free cultivation medium
a
b
c

8/8/2019 23689262 Bio Analysis and Bio Sensors for Bio Process Monitoring 66
http://slidepdf.com/reader/full/23689262-bio-analysis-and-bio-sensors-for-bio-process-monitoring-66 127/236
2.3.2
Off-Line Amino Acid and ACV Analyses
The method recommended by Cooper et al [47] was applied for the analysis of the amino acids: Asp,Glu,AAA, Asn, Ser, Tyr, Met,Val,Trp, Phe, Ile, Leu and Lys.The HPLC-system consisted of an autosampler with injection valve (PharmaciaBiosystems), pump (Irica), degaser (Gastorr), thermostat (Julabo), precolumnand column (Waters), fluorescence detector (Shimadzu) and a PC (486 DX66)
122 G. Seidel et al.
Fig. 3. HPLC for amino acid and b-lactam detection
Fig. 4. Separation of the four main products appearing during the cultivation of Acremoniumchrysogenum at 220 nm

8/8/2019 23689262 Bio Analysis and Bio Sensors for Bio Process Monitoring 66
http://slidepdf.com/reader/full/23689262-bio-analysis-and-bio-sensors-for-bio-process-monitoring-66 128/236
containing the APEX-chromatography Workstation (Autochrom Inc. Version2.11). The separation was performed on a Resolve TMC18 90 A, 5 mm column(Waters) at 30 °C. Amino acid standard (Sigma) was applied for the evaluationof the chromatograms. Samples of cell free extract were deproteinated with
methanol diluted with borate buffer. The precolumn derivatization with OPAwas performed in the autosampler (Pharmacia Biosystems). Linear gradient of eluent A (sodium acetate, sodium dihydrophosphate and tetrahydrofuran) andeluent B (54% methanol) were applied. The concentration measurement wascarried out with fluorescence detector and the evaluation with APEX software.
The Gln, His, Gly and Thr separation could be impaired by increasingamount of antibiotics. The separation of Cys and ACV was carried out ac-cording to Holzhauer-Rieger [48]. The chromatographic separation was per-formed after reduction and methylation of the sample. After automatic pre-column OPA derivatization the same gradient/eluents were used as for amino
acid analysis. The gradient control was performed by Autochrom CIM Interface.The concentrations were measured with fluorescence detector and the datamonitoring carried out with Autochrom CSI2 Interface. Figure 5 shows a typicalchromatogram after reduction and methylation.
2.3.3
On-Line Carboxylic Acid Analyses
The organic acids were analyzed with an HPLC system consisting of degassing
unit (Gastorr GT-103), pump (Pharmacia LKB), autosampler (Pharmacia, LKB),precolumn (Shodex R Spak KC-LG), separation column (Shodex R Spak KC-811), water bath (Julabo U3) and a UV detector (Soma Optics LTD S-3702). Thedata monitoring was performed using a PC-chromatography data systemAndromeda 1.6 (Techlab).
On-line and Off-line Monitoring of the Production of Cephalosporin C by Acremonium chrysogenum 123
Fig. 5. A typical chromatogram of the analysis of amino acids after treating the samples withmethyliodide (necessary for the detection of ACV and CYS)

8/8/2019 23689262 Bio Analysis and Bio Sensors for Bio Process Monitoring 66
http://slidepdf.com/reader/full/23689262-bio-analysis-and-bio-sensors-for-bio-process-monitoring-66 129/236
The cell free samples were mixed with perchloric acid/perchlorate and storedat low temperature for 48 h, at 6000 rpm centrifuged, decanted, stored at –22 °Cfor a week and centrifuged again for deproteination. The separation wasperformed on an ion exclusion polystyrene/divinylbenzene column at 40 °Cwith 15 mM sulfuric acid as eluent and detection at 205 nm. For the quantifica-tion a standard was applied. A typical chromatogram is shown in Figure 6.Pyruvate, succinate, lactate, formate and acetate were detected in the cultivationmedium.
3Analysis of Intracellular Components
3.1
Cell Disintegration
For measurement of intracellular components it is necessary to stop the meta-bolism very quickly and to disintegrate the cells quantitatively. This was aproblem in the past when using ultrasonic modules – because of the differentmorphological structures is was nearly impossible to destroy all the structures
in one step. Our recent investigations showed that there are really great dif-ferences according to which method is used for cell disruption. The best resultswere obtained by treatment of the samples with a French Press [49] or with amortar under liquid nitrogen [22]. The mortar method was applied for routinecell disintegration. The frozen sediments were placed in a cooled mortar with
124 G. Seidel et al.
Fig. 6. A typical chromatogram of the analysis of organic acids detected in the cultivationmedium

8/8/2019 23689262 Bio Analysis and Bio Sensors for Bio Process Monitoring 66
http://slidepdf.com/reader/full/23689262-bio-analysis-and-bio-sensors-for-bio-process-monitoring-66 130/236
liquid nitrogen and then treated for 5–10 min. It is very important that there isno warm up of the samples because of handling after cell disintegration.After disintegration, the cell powder is placed in a reaction tube and slowly warmed up. After centrifugation (3500 rpm, 3 min, 2 °C) the assays could be
carried out.
3.2
Measurement of RNA
The determination of RNA was carried out with a method according to Kuenzi[50]. The method depends on the reaction of DNA and RNA with alkalihydro-xide. According to the pH-value only the RNA-monomers could be detectedquantitatively in solution at 260 nm. By using a standard solution of RNA fromTorula utilis it is possible to calibrate the system for a reproducible process andan optimal dilution. To eliminate the dimming effects of the solution anothermaximum at 320 nm is detected. The evaluation is performed on the spectro-meter by using a simple equation, namely ODsample = E260 – E320 , the conversionfactor depends on the standard solution. Fig. 7 shows the typical correlationbetween RNA and biomass.
On-line and Off-line Monitoring of the Production of Cephalosporin C by Acremonium chrysogenum 125
Fig. 7. Correlation between RNA, biomass and intracellular protein

8/8/2019 23689262 Bio Analysis and Bio Sensors for Bio Process Monitoring 66
http://slidepdf.com/reader/full/23689262-bio-analysis-and-bio-sensors-for-bio-process-monitoring-66 131/236
3.3
Preconditioning, Amino Acid Concentrations and Enzyme Activity Measurement
For the separation on the HPLC System it was necessary to prepare the samples,
because they contained glycerol from the disintegration buffer, which causessome trouble with measuring the enzyme activities, especially for deter-mination of AVCS-activity. The samples were centrifuged (14000 pm, 2 °C andthen filtered over a Sephadex Gel column (NAP™-10/Pharmacia) with aneluent containing TRIS/HCl, KCl, MgSO4 and DTT. After that the samples couldbe stored at –80 °C for weeks.
For measurement of the intracellular amino acid concentrations the sameHPLC-system and method were used as described in Sect. 2.3.2. The only dif-ferences were the very low concentrations. It was possible to detect all aminoacids but not over the whole cultivation time, because of the detection level. In
this case a extrapolation program (Origin 5.0, MicroCal) was used.The main aspect for monitoring intracellular components was to find the
bottlenecks in cephalosporin synthesis. For this it was important to measure theactivities of the relevant enzymes in the biosynthesis.After tests in the past [49,51] and new investigations [22] it was known that the use of protease inhibitorsin the disintegration buffer was necessary for routine analysis of activities incrude material. The expense for such measurements was very high and so themain point was the detection of ACVS- and IPNS-activity. But all other im-portant activities were monitored as well.
The measurement of the ACVS-activity has its origin in a method describedby Banko et al. [52]. The assay contained AAA, Val, Cys as substrate for theenzyme and DTT, MgSO4 , TRIS/HCl, ATP, EDTA and protease inhibitors asbuffer system. The sample was added and the reaction stopped after 60 min,25 °C by methanol (0°C).After that the ACV-concentration could be detected by the method described in Sect. 2.3.2.
The detection of the IPNS-activity was first described by Kupka et al. [53],this method is for simultaneous measurement of IPN and PEN. The assay contained ACV as substrate and DTT, FeSO4 , KCl, MgSO4 , ascorbic acid andTRIS/HCl as buffer. After a reaction time of 20 min, 25°C the reaction was
stopped with cool methanol. The determination of the PEN-concentration,which was created during the test, could be done by using a similar method asdescribed in Sect. 2.3.1.
For monitoring the activity of the expandase/hydroxylase-system a methoddescribed by Jensen et al. [54] and modified by the authors of [49] was used. Theassays contained PEN DAOC as substrate and a system with DTT, FeSO4 , KCl,MgSO4 , ascorbic acid,a-ketoglutarate and TRIS/HCl as buffer. After 25 min, at25 °C, the reaction can be stopped by cool methanol. Also protease inhibitorswere used as well and some disadvantages were observed.The PEN was difficult
to locate because there are some inhibitor peaks at the same retention time,there was even DTT and some cosubstrates leaving the column at the sametime. However, it is possible to measure the activity over the whole cultivationtime if many tests are done. The detection of DAOC and DAC was carried outwith the same method as the cultivation byproducts.
126 G. Seidel et al.

8/8/2019 23689262 Bio Analysis and Bio Sensors for Bio Process Monitoring 66
http://slidepdf.com/reader/full/23689262-bio-analysis-and-bio-sensors-for-bio-process-monitoring-66 132/236
Matsuyama et al. [55] described a method for measuring the acetyltrans-ferase-activity which was used. The essay contained DAC as substrate andMgSO4 , acetyl-CoA and TRIS/HCl as buffer. After 20 min, at 25 °C, the reactionwas stopped with methanol (0°C).The detection of CPC formed was carried out
with the same method as the cultivation main product.The evaluations of the activities were done by extracting the necessary product concentration out of the chromatogram, calculating conversion of theenzymatic reaction, and using the intracellular protein concentration,measured by the method of Bradford [33].
42D-Fluorescence Spectroscopy
Fluorescence sensors have been used since 1957 to measure cell internalNAD(P)H at 450 nm. Later on they were applied for in situ determination of thecell concentration. However, the culture fluorescence intensity is not only in-fluenced by the cell concentration, but also by the physiological state of the cells[56] and, in addition to that, there are several other compounds that participatein the fluorescence emission besides NAD(P)H. To identify the fluorophores inthe cells and cultivation medium, the excitation and the emission wave lengthsare varied in a broad range [57, 58]. Two instruments were applied for the 2D-fluorescence spectroscopy: Model F-4500 (Hitachi) and the BioView Sensor(Delta light & Optics). Each of them uses an excitation range of 250– 560 nm,an
emission range of 260/300–600 nm and the measuring time of 1 min [59, 60].The application of this technique for CPC production was performed by Lindemann [61].
The evaluation of the measurements, the correlation between the mediumcomponents and the various ranges of the 2D-fluorescence spectrum was per-formed by Principal Component Analysis (PCA), Self Organized Map (SOM)and Discrete Wavelet Transformation (DWT), respectively. Back PropagationNetwork (BPN) was used for the estimation of the process variables [62]. By means of the SOM the courses of several process variables and the CPC con-centration were determined.
5Morphology and Rheology
Nash and Huber [63] reported that submerged cultures of A. chrysogenum insynthetic media showed four distinct morphological states: hyphae, swollenhyphal fragments, conidia and germlings. Queener and Ellis [64] reported thatdifferentiation of swollen hyphal fragments into spherical unicellular arthros-pores accompanied the synthesis of CPC in complex medium. Masazumi et al.
[65] and Natsume and Marumo[66] investigated the relationship betweenmorphological differentiation and CPC synthesis in synthetic media. Accordingto them,the depletion of glucose in the media caused hyphal fragmentation andproduction of CPC. A one-to-one correspondence was observed between thefinal percentage of spherical arthrospores and the final titer of CPC. Moreover
On-line and Off-line Monitoring of the Production of Cephalosporin C by Acremonium chrysogenum 127

8/8/2019 23689262 Bio Analysis and Bio Sensors for Bio Process Monitoring 66
http://slidepdf.com/reader/full/23689262-bio-analysis-and-bio-sensors-for-bio-process-monitoring-66 133/236

8/8/2019 23689262 Bio Analysis and Bio Sensors for Bio Process Monitoring 66
http://slidepdf.com/reader/full/23689262-bio-analysis-and-bio-sensors-for-bio-process-monitoring-66 134/236
vation medium and amino acid supplement the cultivation time was reducedand the productivity was increased. The best yield coefficient was obtained by considerable dilution of the medium and supplementing the amino acid . Thisprocedure increased the cultivation time and reduced the productivity. By
means of amino acid supplements the CPC concentration was increased by 50%and the byproducts reduced. However, it was not possible to find out the basisfor this positive effect on the biosynthesis.
The determination of the intracellular enzyme activities is impaired by theproteases and hydrolases, which are released by the disintegration of the cells.The suppression of these enzymes by protease/hydrolase inhibitors influencesthe activity of the investigated enzyme as well.
The determination of the activity of the bottleneck enzyme ACVS is especi-ally difficult, because the activity of the successive enzyme IPNS is higher by two orders of magnitude. Again, the suppression of the IPNS impairs the
activity of ACVS as well. Therefore, it is not possible to evaluate the true enzymeactivities. However, these investigations show qualitatively how the enzymeactivities vary during the cultivation (Fig. 8). ACVS activity is low and it attainsa maximum at 60 h and then gradually diminishes. IPNS activity is intermediateand nearly constant up to 95 h and then decreases. EXP activity is high and thatof HYD intermediate. EXP activity is nearly constant in the range 40–100 h.HYD activity is nearly constant and increases after 80 h. ATC activity is very high and obtains its maximum during 60–90 h. A comparison of CPC andprecursor formation rates with the activities of these enzymes showed that
CPC formation rate obtains a maximum at 70–80 h, somewhat later than the
On-line and Off-line Monitoring of the Production of Cephalosporin C by Acremonium chrysogenum 129
Fig. 8. Comparison of the detected enzyme activities during the cultivation of Acremoniumchrysogenum

8/8/2019 23689262 Bio Analysis and Bio Sensors for Bio Process Monitoring 66
http://slidepdf.com/reader/full/23689262-bio-analysis-and-bio-sensors-for-bio-process-monitoring-66 135/236
ACVS. PEN formation rate has a maximum at 110 h, and at 115 h it increasesagain. The formation rates of all other precursors increase with the cultivationtime. This clearly indicates, that the low ACVS activity and its dramatic reduc-tion after 90 h caused the bottleneck in the biosynthesis. By maintaining a high
CPC formation rate after 80 h due to keeping the ACVS activity at high levelafter 90 h, the CPC concentration and productivity could be increased con-siderably.
7Conclusions
The investigations indicated that the productivity in complex media is muchhigher than in synthetic and semi synthetic media. With 100 g l–1 PF, the pro-
duct concentration in the stirred tank was twice as high as with 30 g l
–1
PF andthree times as high as one without PF. With another medium, the CPC concen-tration was twice as high with CSL than without it. The maximum CPC con-centration was obtained with CSL and amino acid supplement. The mediumcompositions for optimal CPC concentration, CPC yield coefficient and CPCspace time yield are different. ACVS is the bottleneck in the biosynthesis in thefirst phase of the cultivation. After 100 h, the expandase/hydroxylase becomesthe bottleneck. In this phase, DAC and PEN concentrations considerably in-crease, but the CPC concentration varies only slightly. By the suppression of thePEN formation the production of DAOC, which impairs the purification of CPC,
is reduced as well.
References
1. Demain AL,Kennel YM,Aharonowitz Y (1979) Carbon catabolite regulation of secondary metabolites. pp 163–185.In: Bull AT, Ellwood DC, Ratledge C (eds) Microbial technology:Current state, future prospects, vol 29. Cambridge University Press, Cambridge.
2. Martin JF, Aharonowitz Y (1983) Regulation of biosynthesis of b-lactam antibiotics.pp 229–254. In: Demain AL, Solomon NA (eds) Antibiotics containing the b-lactam
structure, Part I. Springer, Berlin Heidelberg New York3. Matsumura M, Imanaka T, Yoshida T, Taguchi H (1978) J Ferment Technol 56:3454. Scheidegger A, Küenzi MT, Fiechter A, Nüesch J (1988) J Biotechnol 7:1315. Zhang JS, Demain AL (1991) Biotech Adv 9:6236. Matsumura M, Imanaka T, Yoshida T, Taguchi H (1989) J Ferment Technol 58:2057. Karaffa L, Sandor E, Szentirmai A (1997) Proc Biochem 32:4958. Aharonowitz Y, Demain AL (1979) Can J Microbiol 25: 619. Aharonowitz Y (1980) Ann Rev Microbiol 34: 209
10. Shen YQ, Heim J, Solomon NA, Demain AL (1984) J Antibiot 37:50311. Zhang J, Wolfe S, Demain AL (1987) J Antibiot 40:174612. Kuenzi MT (1980) Arch Microbiol 128:7813. Martin JF, Revilla G, Zanca DM, Lopez-Nieto MJ (1982) pp 258–268. In: Umezewa H,
Demain AL, Hata T, Hutchinson CR (eds) Trends in antibiotic research. Jap Antibiot ResAssoc, Tokyo
14. Zhang J, Wolfe S, Demain AL (1988) Appl Microbiol Biotechnol 29: 24215. Rollins MJ, Jensen SE, Wolfe S,Westlake DWS (1990) Enzyme Microb Technol 12:4016. Bainbridge ZA, Scott RI, Perry D (1992) J Chem Technol Biotechnol 55:233
130 G. Seidel et al.

8/8/2019 23689262 Bio Analysis and Bio Sensors for Bio Process Monitoring 66
http://slidepdf.com/reader/full/23689262-bio-analysis-and-bio-sensors-for-bio-process-monitoring-66 136/236
17. Zhou W, Holzhauer-Rieger K, Dors M, Schügerl K (1992) Enzyme Microb Technol 14:84818. Kozma J, Lucas L, Schügerl K (1991) Biotechnol Lett 13: 89919. Kozma J, Lucas L, Schügerl K (1993) Appl Microbiol Biotechnol 40: 46320. Kozma J, Karaffa L (1996) J Biotechnol 48: 5921. Zhou W, Holzhauer-Rieger K, Dors M, Schügerl K (1992) J Biotechnol 23:315
22. Seidel G (1999) PhD thesis, University Hannover23. Malmberg LH, Hu WS (1992) Appl Microbiol Biotechnol 38:12224. Malmberg LH, Sherman DH, Hu WS (1992) Ann New York Acad Sci 665:1625. Matsumura M, Imanaka T, Yoshida T, Taguchi H (1980) J Ferment Technol 58 :19726. Natsume M, Marumo S (1984) Agric Biol Chem 48: 56727. Batoshevich YuE, Zaslavskaya PI, Novak MJ, Yudina OD (1990) J Basic Microbiol 30:31328. Lopez-Nieto MJ, Ramos FR, Luengo FR, Martin JF (1985) J Appl Microbiol Biotechnol
22:34329. Baldwin JE, Abraham E (1988) The biosynthesis of penicillins and cephalosporins. Nat
Prod Rep pp 129–14530. Lübbe C, Wolfe S, Demain AL (1985) Enzyme Microb Technol 7:353
31. Fujisawa Y, Kanazaki T (1975) Agric Biol Chem 39: 204332. Felix HR, Nüesch J, Wehrli W (1980) FEMS Microbiol Lett 8: 5533. Bradford M (1976) Anal Biochem 72: 24834. Burton K (1956) J Biochem 62: 31535. Lever M (1972) Anal Biochem 47: 27336. Schmidt WJ, Meyer HD, Schügerl K (1984) Anal Chim Acta 163:10137. Lorenz T, Schmidt W, Schügerl K (1987) Chem Eng J 35:B1538. Bayer T, Herold T, Hiddessen R, Schügerl K (1986) Anal Chim Acta 190: 21339. Bayer T, Zhou W., Holzhauer K, Schügerl K (1989) Appl Microbiol Biotechnol 30: 2640. Ruzicka J, Hansen EH (1988) Flow Injection Analysis. 2nd edn. Wiley, New York41. Ulber R (1996) PhD Thesis University Hannover
42. Wieland M (1995) Master’s Thesis, University Hannover43. Brand U, Reinhardt B, Rüther F, Scheper T, Schügerl K (1990) Anal Chim Acta 238: 20144. Menzel C, Lerch T, Scheper T, Schügerl K (1995) Anal Chim Acta 317: 25945. Weigel B, Hitzmann B, Kretzmer G, Schügerl K, Huwig A, Giffhorn F (1996) J Biotechnol
50:9346. Jürgens H, Kabus R, Plumbaum T, Weigel B, Kretzmer G, Schügerl K, Andres K, Ignatzek
E, Giffhorn F (1994) Anal Chim Acta 298:14147. Cooper JHD, Odgen G, Mcintosh J, Turnell DC (1984) Anal Biochem 142:9848. Holzhauer-Rieger K, Zhou W, Schügerl K (1990) J Chromatogr 499:60949. Beyer M, PhD thesis (1996), University Hannover50. Kuenzi MT (1979) Biotechnol Lett 1:12751. Tollnick C, PhD thesis (1996), University Hannover52. Banko G, Wolfe S., Demain A.L (1986) Biochem Biophys Res Commun 137:52853. Kupka J, Shen Y (1983) Can J Microbiol 29 :48854. Jensen SE, Westlake, DWS., Wolfe, S (1982) J Antibiot 35, 48355. Matsuyama K, Matsumoto H., Matsuda A, Sugiura H,Komatsu K Ichikawa, S (1992) Biosc
Biotech Biochem 56:141056. Reardon KF, Scheper T (1991) Determination of cell concentration and characterization
of cells. In: Schügerl K (ed) Biotechnology 2nd edn, vol 4. Measuring, Modelling andControl.VCH, Weinheim, pp 179
57. Tartakovsky B, Sheintuch M, Hilmer JM, Scheper T (1996) Biotechnol Progr 12:12658. Tartakovsky B, Sheintuch M, Hilmer JM, Scheper T (1997) Bioproc Eng 16:32359. Marose S, Lindemann C, Scheper T (1998) Biotechnol Progr 14:63
60. Schügerl K, Lindemann C, Marose S, Scheper T (1998) Two-dimensional fluorescencespectroscopy for on-line bioprocess monitoring. In: Berovic (ed) Bioprocess EngineeringCourse. Supetar, Croatia, Natl Inst of Chem, pp 400–415
61. Lindemann C (1998) PhD Thesis, University Hannover62. Wei J (1998) PhD Thesis, University Hannover
On-line and Off-line Monitoring of the Production of Cephalosporin C by Acremonium chrysogenum 131

8/8/2019 23689262 Bio Analysis and Bio Sensors for Bio Process Monitoring 66
http://slidepdf.com/reader/full/23689262-bio-analysis-and-bio-sensors-for-bio-process-monitoring-66 137/236

8/8/2019 23689262 Bio Analysis and Bio Sensors for Bio Process Monitoring 66
http://slidepdf.com/reader/full/23689262-bio-analysis-and-bio-sensors-for-bio-process-monitoring-66 138/236
Advances in Biochemical Engineering/Biotechnology,Vol. 66Managing Editor: Th. Scheper© Springer-Verlag Berlin Heidelberg 1999
Biomass Quantification by Image Analysis
Marie-Noëlle Pons*, Hervé Vivier
Laboratoire des Sciences du Génie Chimique, CNRS-ENSIC-INPL, rue Grandville,BP 451, F-54001 Nancy cedex, France* E-mail: [email protected]
Microbiologists have always rely on microscopy to examine microorganisms. When micro-scopy, either optical or electron-based, is coupled to quantitative image analysis, the spec-trum of potential applications is widened: counting, sizing, shape characterization, physiol-
ogy assessment, analysis of visual texture, motility studies are now easily available forobtaining information on biomass. In this chapter the main tools used for cell visualizationas well as the basic steps of image treatment are presented. General shape descriptors can beused to characterize the cell morphology, but special descriptors have been defined for fila-mentous microorganisms. Physiology assessment is often based on the use of fluorescentdyes. The quantitative analysis of visual texture is still limited in bioengineering but thecharacterization of the surface of microbial colonies may open new prospects, especially for cultures on solid substrates. In many occasions, the number of parameters extractedfrom images is so large that data-mining tools, such as Principal Components Analysis,are useful for summarizing the key pieces of information.
Keywords. Image analysis, Microscopy, Visualization, Morphology, Physiology, Motility, Visualtexture, Data mining
1 Introduction . . . . . . . . . . . . . . . . . . . . . . . . . . . . . . . . 135
2 Visualization . . . . . . . . . . . . . . . . . . . . . . . . . . . . . . . . 137
2.1 Microscopes . . . . . . . . . . . . . . . . . . . . . . . . . . . . . . . . 1372.2 Mode of Operation . . . . . . . . . . . . . . . . . . . . . . . . . . . . . 140
3 Image Capture . . . . . . . . . . . . . . . . . . . . . . . . . . . . . . . 142
4 Basic Treatment . . . . . . . . . . . . . . . . . . . . . . . . . . . . . . 144
5 Size and Shape Description . . . . . . . . . . . . . . . . . . . . . . . . 150
6 The Special Case of Filamentous Species . . . . . . . . . . . . . . . . 158
7 Shape Classification . . . . . . . . . . . . . . . . . . . . . . . . . . . . 166
8 Densitometry and Visual Texture . . . . . . . . . . . . . . . . . . . . 168
8.1 Physiology Assessment . . . . . . . . . . . . . . . . . . . . . . . . . . 1688.2 Visual Texture . . . . . . . . . . . . . . . . . . . . . . . . . . . . . . . 174

8/8/2019 23689262 Bio Analysis and Bio Sensors for Bio Process Monitoring 66
http://slidepdf.com/reader/full/23689262-bio-analysis-and-bio-sensors-for-bio-process-monitoring-66 139/236
9 Motility . . . . . . . . . . . . . . . . . . . . . . . . . . . . . . . . . . . 177
10 Conclusions and Perspectives . . . . . . . . . . . . . . . . . . . . . . 178
References . . . . . . . . . . . . . . . . . . . . . . . . . . . . . . . . . . . . 179
List of Symbols and Abbreviations
BCEF-AM 2¢,7¢-bis(carboxyethyl)-5-carboxyfluorescein-acetoxyl methylCAM Calcein acetoxy methyl esterCCD Charge-Coupled DeviceCF 5-carboxyfluorescein and 6-carboxyfluoresceinCID Charge-Injection DeviceCMD Charge Modulated DeviceCMOS Complementary Metal Oxide SiliconCSLM Confocal Laser Scanning Microscopy DAPI 4¢6-diamino-2-phenylindoleEDM Euclidian Distance MapESEM Environmental Scanning Electron Microscopy FDA Fluorescein DiacetateFISH Fluorescence In-Situ HybridizationGFP Green Fluorescent Protein
HSI Hue-Saturation-Intensity color modelINT 2-( p-iodophenyl-)3)(p-nitrophenyl)-5-phenyl tetrazoliumchloride
MPN Most Probable NumberOMA Oval Major AxisRGB Red – Green – Blue color modelSEM Scanning Electron Microscopy SGLDM Spatial Gray Level Dependence Matrix
A projected area AC projected area of the convex bounding polygonb brightness histogram of EDMcij frequency of occurrenceC i Fourier shape descriptorC co-occurrence matrixDeq equivalent diameterDh hyphal diameterF lengthF
l exfree fluorescence signal at zero calcium concentration
F l exsat fluorescence signal at maximal calcium concentration
h thresholdIC A index of concavity in surfaceIC P index of concavity in length
M 2 X , M 2Y , M XY second order momentsN total number of pixels in the image
134 M.-N. Pons · H.Vivier

8/8/2019 23689262 Bio Analysis and Bio Sensors for Bio Process Monitoring 66
http://slidepdf.com/reader/full/23689262-bio-analysis-and-bio-sensors-for-bio-process-monitoring-66 140/236
N i number of pixels of gray-level iP perimeterP C perimeter of the convex bounding polygon
pi probability for a pixel to have a gray-level equal to i
R roughnessR(s) contour signatureRc core radiusR g gyration radiusRm fluorescence ratioRmin fluorescence ratio at zero calcium concentrationRmax fluorescence ratio at maximal calcium concentrations normalized curvilinear abscissas¢ curvilinear abscissaV volumeW widthw0 probability for a pixel to have a gray-level less than hw1 probability for a pixel to have a gray-level greater than hx g x-coordinate of object centroid
y g y-coordinate of object centroida directionl step length for fractal dimension calculationlem , lex emission and excitation wavelengthslmin , lmax minimal and maximal eigenvalues of the inertia matrix
wi number of erosionsW2 reduced size of the largest concavity m gray-level probability functionf histogram entropy S XY inertia matrix
1Introduction
The basic aim of biotechnological processes is to make use of microbial bio-mass to produce various substances of pharmaceutical, nutritional, or moregenerally, economical interest. It is of uttermost importance to be able toquantify its content, and in some cases its nature. For control purposes, it has tobe done if possible in-situ or on-line, and if not, off-line with a lag compatiblewith the characteristic time constant of the process. Since the 17th century,when they were first seen through a “flea-glass” [1] microorganisms have fasci-nated microbiologists. Their early description relied heavily on drawings butthe advent of photography in the 19th century, then of video-cameras and digi-
tal imaging has increased the tracking of the “animalcules” as they were calledby A.van Leeuwenhoek,the first one to describe spermatozoids,yeast and bloodcells. If spermatozoids are still of interest [2], the automated analysis of biomassnow covers the whole spectrum of micro-organisms: bacteria, yeast, fungi, plantand mammalian (human and animal) cells, protozoa as well as sub-parts of
Biomass Quantification by Image Analysis 135

8/8/2019 23689262 Bio Analysis and Bio Sensors for Bio Process Monitoring 66
http://slidepdf.com/reader/full/23689262-bio-analysis-and-bio-sensors-for-bio-process-monitoring-66 141/236

8/8/2019 23689262 Bio Analysis and Bio Sensors for Bio Process Monitoring 66
http://slidepdf.com/reader/full/23689262-bio-analysis-and-bio-sensors-for-bio-process-monitoring-66 142/236
charomyces cerevisiae cells was investigated early on by Lord and Wheals [7–9].Motility experiments are now facilitated by the use of CCD cameras and digital
video-recorders which can register sequences of images for several minuteswhich are then analyzed later.
Image analysis, as applied to microorganisms or to inert particles such ascrystals [10] consists in a series of steps which are relatively independent of thekind of objects considered (Fig. 1). In this chapter the basics of visualization asapplied to microorganisms will be presented first. The general procedure of image treatment illustrated by bioapplications will follow. Finally, quantifica-tion of size and physiology, motility and visual texture will be discussed.
2Visualization
The first step of automated image analysis of microorganisms is the visualiza-tion. Considering their size range, microscopes (or for the largest objects,microviewers) have to be used. Two aspects should be discussed:
– the type of microscope: optical/electron– the device for image capture/treatment: off-line/on-line/in-situ
2.1Microscopes
Since A. van Leeuwenhoek, optical microscopes have been routinely used formicrobial observations [11]. Due to the transparency of the cells, phase-con-trast lenses allow diascopic visualization at the highest magnifications (¥ 400and above) (Fig. 2a). Cells are surrounded by a halo which can give sometrouble for the subsequent treatment of images. Episcopy is largely used in com-bination with fluorescent dyes (Fig. 2b). Halos around the cells, photo-
bleaching, which can make the observation difficult, and fluorescence of thebackground due to some remaining broth elements or to an excess of dye aretypical problems met in epifluorescence microscopy [12].A compromise shouldbe found between the excitation intensity and the emitted light. Fresh or driedslides can be examined. Inverted microscopes avoid the use of a cover glass.
Biomass Quantification by Image Analysis 137
Fig. 1. The main steps of image analysis of microbes

8/8/2019 23689262 Bio Analysis and Bio Sensors for Bio Process Monitoring 66
http://slidepdf.com/reader/full/23689262-bio-analysis-and-bio-sensors-for-bio-process-monitoring-66 143/236
This is interesting for fragile objects such as mammalian cells [13], whichshould not be squeezed between glass surfaces, and for motility experiments asthe displacement of the cells is not limited vertically. The largest available ma-gnification, depending upon the ocular-lens combination is about ¥1500. Thisvalue limits the observation of the smallest cells such as non filamentousbacteria (E. coli) or plankton.
Confocal Laser Scanning Microscopy (CLSM) is particularly adapted to thestudy of 3D structures such as aggregates of cells, cells entrapped in or coloni-zing a support or biofilms, etc. [14]. It combines a traditional epifluorescence
microscope with a laser light source and a special scanning equipment, whichpermits one to obtain optical sections (2D-images), without risk of damagingthe structure by dehydration and/or slicing (Fig. 3) [15]. The key features of thesystem are the high-capacity storage systems and the powerful software neces-sary to reconstruct the 3-dimensionnal shape from the array of 2D-images.
138 M.-N. Pons · H.Vivier
Fig. 2. Saccharomyces cerevisiae cells observed by phase-contrast microscopy (a) andStreptomyces ambofaciens filament observed by epifluorescence microscopy (after PropidiumIodide staining) (b)
a
b

8/8/2019 23689262 Bio Analysis and Bio Sensors for Bio Process Monitoring 66
http://slidepdf.com/reader/full/23689262-bio-analysis-and-bio-sensors-for-bio-process-monitoring-66 144/236
Proper alignment of the system is of course necessary. Differences in systemsfrom various manufacturers are not so much in the technique itself but more in
the user-friendliness of the system. The main fields of CLSM applications inbioengineering concern bacteria growing in soils [16, 17], on non-transparentsupports such as leaves [18], in biofilms [19– 21], in particular for wastewatertreatment or biofouling studies [22], and mammalian cells growing on micro-carriers [23, 24] or in aggregates [25, 26].
Electron microscopes give higher magnifications than optical systems: very small bacteria such as E. faecalis (≈1 mm) [27] or even phages (≈ 200 nm) [28]can be observed. However the preparation of the samples is difficult: dehydra-tion (because of the high-vacuum in the chamber) and metal-plating (to make
the sample conductive) are required by most Scanning Electron Microscopes(SEM). The water content of cells being very high, the dehydration and fixation(usually with osmium tetraoxide) should be conducted very carefully to limitthe morphological changes [29]. In the best cases, if the general shape is main-tained, shrinkage is observed, making size assessment difficult [30–32] (Fig. 4).A size decrease of 35% was observed by Huls et al. [29] on Saccharomyces cere-visiae cells. Environmental Scanning Electron Microscopes (ESEM) operate un-der less stringent conditions: the gas ionization detector tolerates a pressure of about 100 Pa at 277 K, when standard SEM works under about 1 Pa. The mainadvantages of SEM is to provide three-dimensional visualization of the cells or
Biomass Quantification by Image Analysis 139
Fig. 3. Principle of CLSM microscopy
Fig. 4. CHO cells on a microcarrier: a optical microscopy (contrast enhancement by CrystalViolet staining) and b scanning electron microscopy
a b

8/8/2019 23689262 Bio Analysis and Bio Sensors for Bio Process Monitoring 66
http://slidepdf.com/reader/full/23689262-bio-analysis-and-bio-sensors-for-bio-process-monitoring-66 145/236
cells aggregates [18, 30, 33], which may be useful to explain bi-dimensionnalimages. Transmission electron microscopes work on very thin samples: drops of broth are deposited on a grid, air-dried and stained [34, 35]. When the cells orcell aggregates are too thick, they should be embedded into a resin and thin
sections are cut [36]. Although not used on a routine basis for process control,electron microscopes are valuable visualization systems for the smallest micro-organisms or for components of larger cells [37].
2.2
Mode of Operation
Most of the actual routine image analysis applications on microorganisms arerun off-line and are operator-assisted for manual sampling in the bioreactor,slide preparation (including staining) and image capture. The last step is easily automated: stage motion, focus, selection of lens, brightness can be computer-controlled. The off-line mode implies a delay between the time of sampling inthe fermenter and the time the data are effectively available for monitoring andcontrolling the bioprocess. The acceptable delay is a function of the characteri-stic time constant of the bioreaction. A delay of 1 to 2 h can be considered of little importance for a 200-h process (fungi, filamentous bacteria) but will beunacceptable for fast-growing microorganisms (E. coli, S. cerevisiae). In suchcases on-line and even in-situ systems are necessary.
On-line systems involve circulation loops to bring the sample to the micro-
scope. The depth-of-focus is limited and the cells should be maintained close tothe focus plane by forcing them through a capillary [38] or a flow cell [39]. ForBacillus thuriengiensis, the best results were obtained by Lichtfield et al. [38]with 20 mm thick glass channels. Stop flow cells have been tested by Zalewskiand Buchholz [40] for yeast cells and by Treskatis et al. [41] for S. tendae pellets,combined with an inverted microscope. Specific cells have been designed toinvestigate the effect of osmotic shifts [42] and high pressure [43] on yeast cells.As in any automated sampling system for bioprocesses, there are risks of tubingclogging and fouling of the transparent optical surfaces.
If the machinery for on-line visualization seems sophisticated, the develop-
ment of in-situ microscopes is even more complex. It is, however, the only way to see cells without the stress of the sampling and slide preparation.A device forthe observation of Saccharomyces cerevisiae cells has been proposed by Suhr etal. [44]. The cells were illuminated by a laser beam and were made visible by thefluorescence of their NADH content. The quality of the highly blurred imageswas such that the subsequent treatment was complex and was limiting theanalysis rate to an average of one cell/min. The response time was estimated to20 min to get reliable statistics on the cell number. The highest cell number wasaround 109 cells/ml. However the technique combines sizing and physiology as-
sessment as the NADH content varies according to the cell metabolism.Lately another in-situ microscope has been proposed by Bittner et al. [45]. Asmall volume of broth (≈ 2 ¥10–8 ml) is automatically isolated within the reac-tor. The quality of images is greatly improved and similar to what can be obtain-ed off-line (Fig. 5). The treatment is faster because the images are “simpler” to
140 M.-N. Pons · H.Vivier

8/8/2019 23689262 Bio Analysis and Bio Sensors for Bio Process Monitoring 66
http://slidepdf.com/reader/full/23689262-bio-analysis-and-bio-sensors-for-bio-process-monitoring-66 146/236
Biomass Quantification by Image Analysis 141
Time = 0 Time = 6 h Time = 13 h
Fig. 5. a In-situ microscope proposed by Bittner et al.; b Saccharomyces cerevisiae cellsobserved by in-situ microscopy in function of culture time (by permission of T. Schepper)
b
a
analyze than in the previous system.The cell number can vary between 106 and109 cells/ml, which corresponds to a cell concentration of 0.01 to 12 g/l. Thesample time is rather fast (20 s for 256¥ 224-pixels images) for a response timeof 13 min, due to the necessity of counting a significant number of cells. Theauthors promise a decrease of the response time down to 2 min if more power-ful computing systems are used. This device could be extended for cells largerthan the tested Saccharomyces cells, e.g. filamentous species, although there, acompromise should be found between the size of the object (filament, en-

8/8/2019 23689262 Bio Analysis and Bio Sensors for Bio Process Monitoring 66
http://slidepdf.com/reader/full/23689262-bio-analysis-and-bio-sensors-for-bio-process-monitoring-66 147/236
tanglements or pellets) and the size of the hyphae. The analysis of bacteria suchas E. coli seems more problematic due to their size (the spatial resolution shouldprobably be increased, at the expense of larger images to deal with) and theirability to escape from the plane-of-focus.
3Image Capture
The analog image seen through the ocular of the optical microscope is firsttransformed into an electronic image by a camera. Monochrome camerasmeasure the intensity of the transmitted or reflected light. The bulky tubecameras are progressively replaced by solid-state systems built around a chipmade of an array of semi-conducting detectors (Fig. 6a): they are largely usednowadays and are easily affordable at least for the monochrome versions.Detectors are available at various costs and with different performances: CCD(Charge Coupled Device), CID (Charge Injection Device), CMOS (Comple-mentary Metal Oxide Silicon), CMD (Charge Modulated Device). The criticalcharacteristics are the spatial resolution (size of the array and number of picture elements or pixels), the sensitivity to light (expressed in lux), and thenoise [46]. The number of elements goes from about 300,000 for standard videocameras to a few millions for high performance devices. The sensitivity depends upon the wavelength range: silicon, which is the basis material of mostCCDs is more sensitive to longer wavelengths in the red region.The noise is due
to the dark current, i.e. the signal that the detector collects in the absence of light over time. CMD detectors are noisier than CMOS ones, which, are in turn,noisier than CCDs.
The first motivation for processing color images is that human beings aresensitive to thousands of shades and intensities, in comparison to about thirty
142 M.-N. Pons · H.Vivier
Fig. 6. Solid-state technology: a monochrome chip; b mono-chip for color imaging; c set-upfor 3-CCD color imaging
a
b
c

8/8/2019 23689262 Bio Analysis and Bio Sensors for Bio Process Monitoring 66
http://slidepdf.com/reader/full/23689262-bio-analysis-and-bio-sensors-for-bio-process-monitoring-66 148/236
gray-levels. The second motivation is that color, especially in physiological ap-plications, is a powerful descriptor. A color is defined by its hue (H), saturation(S) and intensity (I) (Fig. 7a). The hue is associated with the dominant wave-length of the captured light wave. The saturation is inversely proportional to the
amount of white light mixed with a hue. The HSI model of color is the closestto the human perception of color and it is usually easier to analyze color imagesusing this model [47]. However color cameras acquire images according to theRGB model which is based on the Cartesian coordinate system formed by theprimary spectral components of Red, Green and Blue (Fig. 7b). Most imageanalyzers easily convert color images from one model to the other.
Mono-CCD color cameras contain basically the same image sensor as mono-chrome CCD ones, except that the matrix elements have being covered by colormicro-filters (Fig. 6b): a color image results from the combination of threeprimary images (Red, Green and Blue). The sensitivity is only slightly reducedbut the spatial resolution is strongly decreased. Due to the high sensitivity of human beings to green, there are more green filters than red and blue ones. Thefilters induce a general decrease of sensitivity with respect to monochromecameras. The much-more expensive 3-CCD color cameras contain three matrixelements (Fig.6c).A beam splitter sends the light beam toward the three detect-ing units. The spatial resolution is high but the sensitivity is generally strongly reduced (filters and beam splitter). It is important to note that not all objectsvisualized in color need really color imaging. A image with a single hue can becaptured by a monochrome camera (staining with Propidium Iodide, Neutral
Red, Methylene Blue for example). However, the complex spectrum of AcridineOrange (yellow, red, green) requires a color camera.In fluorescence and especially in bioluminescence [48, 49], the emitted light
levels are usually low and normal cameras might not be sensitive enough.Intensifying cameras are available for those special applications [12]: thesignal-to-noise is improved by thermoelectrically cooling the camera with aPeltier element. They are still rather expensive and cheaper solutions can befound by adjusting the integration time of normal CCD cameras for many
Biomass Quantification by Image Analysis 143
Fig. 7. Representation of color by the HSI model (a) and the RGB model (b)
a b

8/8/2019 23689262 Bio Analysis and Bio Sensors for Bio Process Monitoring 66
http://slidepdf.com/reader/full/23689262-bio-analysis-and-bio-sensors-for-bio-process-monitoring-66 149/236
routine fluorescence applications. When densitometric analysis of the cell isrequired (especially for physiological applications), the auto-gain of the camerashould be switched off.
The video analog signal output by the tube and solid-state cameras (and by
the electron microscopes) is digitized in the computer by a specialized grabbingboard. The spatial resolution of the imaging system results from the combina-tion microscope magnification-camera-grabber. Most of the actual grabbersgenerates rectangular images of about 586 lines of 756 pixels although somesystems provide square images of 512 lines of 512 pixels. Pixels are nowadaysmostly square. Older grabbers produced rectangular pixels with an aspect ratioX/Y =1.5, requiring interpolation to restore a grid of square pixels. The inten-sity of the transmitted or emitted light by the surface element corresponding tothe pixel on the initial analog image is nowadays transformed into a numbercoded on 8 bits for monochrome images and 3 ¥ 8 bits for color images: the 256gray or brighness levels goes from black (0) to white (255). Costello and Monk[50] used only 256 ¥ 256 images with 64 gray-levels for one of the first routineapplication of image analysis to count Saccharomyces cerevisiae cells in themid-1980s. A larger range may be necessary especially for fluorescence andluminescence applications: some systems use 4096 gray-levels, coded on 12 bits.
It would seem a better solution to directly output a digital signal from asolid-state camera as the pixelization is already done at the level of the detector.This is effectively the trend. Digital cameras are becoming available but thehigh-performance ones requested for scientific applications are still very ex-
pensive. The data readout is rather slow which can make focusing tedious.
4Basic Treatment
A basic treatment of bio-images can be proposed. Its main objective is to reducethe total amount of information contained in the gray-level or color images tofocus the quantification on the key features: the result of this treatment will bea binary image containing only the silhouettes of the cells of interest (their pixel
values are set to 1) and the background (its pixel values are set to 0). The sizeand shape measurements will be later conducted on these silhouettes, and thedensitometric or color analysis will use them as masks to consider only theregions of interest.
There are traditionally two ways of treating the images:
– one can consider images as 2D signals and apply the techniques used clas-sically in 1D-signal processing to analyze images (convolutions, Butterworthfilters, Hadamard and Fast Fourier Transforms, etc.) [51– 53];
– the second way relies on mathematical morphology [54] and manages sets of
points or pixels. The basic operations of mathematical morphology are theerosion and the dilation: in an erosion (dilation) any pixel belonging to anobject which has a neighbor belonging to the background will be set to 0(to 1). Initially defined to work on binary images, the theory has been ex-tended to gray-level images, providing tools for their enhancement.
144 M.-N. Pons · H.Vivier

8/8/2019 23689262 Bio Analysis and Bio Sensors for Bio Process Monitoring 66
http://slidepdf.com/reader/full/23689262-bio-analysis-and-bio-sensors-for-bio-process-monitoring-66 150/236
Microorganisms being individualized objects or sets of pixels, the second ap-proach would appear more appropriate. However the initial enhancement of thegray-level image may benefit from the first approach. There is no definite solu-tion and generally a balance between the two is used. It means also that there is
no unique treatment of an image and that the final solution will depend uponthe expert in charge with the development of the procedure.Halos, light inhomogeneities, necessity to enhance the contours of cells are
among the reasons for applying different algorithms to improve the quality of images. One has always to keep in mind that good quality of the initial gray-level or color images is essential: any enhancement by software will introducedsome bias in the final results. Due to the halos around the cells, to in-homogeneities of staining within the cells, fluorescence images are generally delicate. It is even more true when the cells are small as for non-filamentousbacteria. Schröder et al. [55] and Viles et Sieracki [12] suggest improving theimage by convolution with the Mexican-hat type matrix proposed by Marr andHildreth [56].
The aim of segmentation is to separate the objects (cells, including most of the debris) from the background.The obtaining of the binary image (pixel value=1 for object and = 0 for background) is a critical step, which should be auto-mated as much as possible to avoid the operator “subjectivity” (differences of appreciation between operators, fatigue). Different algorithms are possible anda good overview can be found in Ref. [57].
The global segmentation methods are based on the analysis of the gray-level
image (or on the Intensity image for the HSI color model) histogram, i.e. thedistribution in number of the gray-levels, which is approximated by a weightedsum of two (or more) probability densities with normal distribution,one for thebackground region and one for the object region. Figure 8 presents two typicalcases. The histogram of the Streptomyces image presents two regions separatedby a large valley: one at low gray-level for the pellet and one at high gray-levelsfor the background.The image of Saccharomyces cerevisiae shown in Fig. 2b hasbeen focused so that the gray-levels of the cell wall are very low and those of thecytoplasm very high. The background pixels have intermediate values. Theiterative threshold optimal selection can be based on different characteristics:
first moments [58], variance [59], entropy [60] and can be applied for segmen-tation into two or more regions.
Let pi be the probability for a pixel to have a gray-level equal to i:
pi = N i /N (1)
where N i is the number of pixels of gray-level i and N the total number of pixelsin the image.Let us consider the case of a segmentation into two regions: w0 andw1 the probabilities for a pixel to have a gray-level, respectively, less than or
equal to the threshold h and greater than h:h 255
w0 = Â pi and w1 = Â pi (2)i = 0 i = h +1
Biomass Quantification by Image Analysis 145

8/8/2019 23689262 Bio Analysis and Bio Sensors for Bio Process Monitoring 66
http://slidepdf.com/reader/full/23689262-bio-analysis-and-bio-sensors-for-bio-process-monitoring-66 151/236
The first moments of the probability functions corresponding to the back-ground and the objects will be:
1 h 1 255m 0 = 4 Â i · pi and m 1 = 4 Â i · pi (3)
w0 i = 0 w1 i = h +1
Ridley and Calvard [58] propose to update the initial estimate of thethreshold h:
m 0 + m 1hnew = 02 until hnew = h (4)2
when Otsu [59] maximizes the separability between the probability functionsby maximizing the interclass variance
w0 w1(m 1 – m 0)2 (5)
146 M.-N. Pons · H.Vivier
Fig. 8. Gray-level image of a Streptomyces pellet and its histogram (a) – Histogram of theSaccharomyces cerevisiae image (Fig. 2a) (b)
a
b

8/8/2019 23689262 Bio Analysis and Bio Sensors for Bio Process Monitoring 66
http://slidepdf.com/reader/full/23689262-bio-analysis-and-bio-sensors-for-bio-process-monitoring-66 152/236

8/8/2019 23689262 Bio Analysis and Bio Sensors for Bio Process Monitoring 66
http://slidepdf.com/reader/full/23689262-bio-analysis-and-bio-sensors-for-bio-process-monitoring-66 153/236
et al. [61] obtained satisfactory results with the variance method for thesegmentation of images of yeast flocs.
The local methods of segmentation consider the neighborhood of each pixel.Edge-based methods rely on discontinuities in gray level, color, texture. They
are sensitive to noise which creates false edges and to bad contrast betweenfeatures which gives weak edges (i.e. difficult to detect). Region-growingmethods work better on noisy images. Neighboring pixels, which have reason-ably similar neighborhoods in terms of gray-levels are considered to belong tothe same object or background zone.
In applications dealing with individualized cells, only those fully in view canbe analyzed. The largest objects have, proportionally, a higher risk in contactwith the image frame and to be discarded, which will ultimately introduce a biasin the population statistics. Some authors suggest a measuring frame be in-serted into the visible field [41] or a correction factor, function of the size of thefeature relative to the size of the field of view, be applied to the measured sizeor shape parameter [62]. Border-killing is also used to remove artifacts such asthe halo of Fig. 9a.
It may happen that two or more objects are in contact. The first questionto ask is whether the assembly has a biological meaning. Saccharomyces cellswith a high budding rate can form small chains. This is also the case forbacteria and plant cells. There the cluster or the chain has a biological signi-ficance and should be retained as such. In other cases, the contact between theobjects is due to the sample preparation. Some authors recommend discarding
the objects [63]. If the number of discarded objects is small with respect tothe total number of objects the error finally made is small. Otherwise thepreparation should be improved or the different procedures proposed for aseparation by software of objects in contact should be used [53]. The EuclideanDistance Map (EDM) gives for each pixel of an object its distance (in numberof pixels) to the nearest border: if features like the microcarriers of Fig. 10 arein contact, the EDM shows one maximum for each object, which can be con-sidered as a mountain peak (Fig. 10e). Valleys can be seen where objects arein contact. The separation line between the microcarriers lies in the middleof the valley. This method is frequently called “watershed” by analogy with
the way rain falls from the top of each mountain. The separation is, however,never as perfect as the operator would expect: only particles with ratherbroad valleys between them can be separated and noise along the contourscan introduce false separations. It works better when the objects are in the samesize range.
Classically small particles of debris are removed by a two-step procedure of erosion and rebuilding (i.e.conditional dilation).This implies than the smallestdimension of the cells is larger than that of the debris. This is usually a problemfor filamentous cells.A more sophisticated procedure should be applied, taking
into account some shape descriptor. For example debris are often considered tobe smoother and less elongated than filaments, and can be separated on thebasis of their circularity [64].
Due to the transparency of the microorganisms and with absence of staining,the visualization focuses often on the membrane of the cell. A hole-filling step
148 M.-N. Pons · H.Vivier

8/8/2019 23689262 Bio Analysis and Bio Sensors for Bio Process Monitoring 66
http://slidepdf.com/reader/full/23689262-bio-analysis-and-bio-sensors-for-bio-process-monitoring-66 154/236
is necessary to obtain a complete silhouette. This is simple for a yeast cell butrequires more work for filaments for which holes do not mean necessary cyto-plasmic zones in the case of hyphae curling.
Figure 11 summarizes the main steps of the treatment of the Saccha-romyces cerevisiae image (Fig. 2a). There is usually one final procedurebefore quantitative characterization of each object or cell: the purposeof the discrete labeling is to identify each individual and assign a numberto it [52].
Biomass Quantification by Image Analysis 149
a b
d
f
c
e
Fig. 10. Separation of objects in contact: a Original gray-level image, b Binary image,c Enhanced binary image (hole-filling), d EDM image, e Perpective view of the EDM image,f Separated microcarriers

8/8/2019 23689262 Bio Analysis and Bio Sensors for Bio Process Monitoring 66
http://slidepdf.com/reader/full/23689262-bio-analysis-and-bio-sensors-for-bio-process-monitoring-66 155/236
5Size and Shape Description
Counting individuals through the labeling procedure is usually the first measure-ment performed on an image [65].No problem is encountered when the objects incontact have been properly separated by software and the debris removed.Bacterial detection for growth or contamination assessment is based on the coun-
ting of cells or microcolonies, often after staining [66– 69]. Manual counts aretedious and labor-intensive [70, 71].Automation of colony counting has been pro-posed with epi-illumination or a transillumination [72, 73]. Sometimes a full sepa-ration of all the objects in view is difficult or not desired when one is interested inthe number of elements of a cluster [74,75].Assuming the cells are convex the EDMprovides an easy way to count the number of objects as illustrated in Fig. 12: thenumber of maxima found in the EDM images corresponds to the number of cells.
The primary size measurement is based on the area of the silhouette. Asimple count of the pixels and the consideration of the calibration (mm2/pixelfor example) give the projected area, A. This is valid for any cell, even elongated
ones [76]. Geometrical correction might be necessary to take into account theshape of the support, like in the case of spherical microcarriers [77]. An equi-valent diameter (Deq ) is subsequently calculated:
61Deq = 2 ÷ A/p (8)
150 M.-N. Pons · H.Vivier
Fig. 11. The main steps of the treatment of the yeast image (Fig. 2a): a Binary image just aftersegmentation; b after hole-filling; c after a 4-order erosion to remove debris; d after final
reconstruction
a
c d
b

8/8/2019 23689262 Bio Analysis and Bio Sensors for Bio Process Monitoring 66
http://slidepdf.com/reader/full/23689262-bio-analysis-and-bio-sensors-for-bio-process-monitoring-66 156/236
If this can be applied to rather “circular” shapes (Saccharomyces cerevisiae [50],mammalian cells, either isolated or aggregated [26, 78, 79), microcolonies [80],
etc.), it seems more difficult to characterize filamentous species by this sizeparameter. As mentioned before size and shape quantifications are intimately connected.
Many general shape factors exist but the nomenclature depending uponauthors varies and it is suggested to always verify the mathematical definition
Biomass Quantification by Image Analysis 151
a b
d
f
c
e
Fig. 12. Counting cells without separation: a and b Initial binary images; c and dCorresponding EDM images; e and f Maxima of EDM

8/8/2019 23689262 Bio Analysis and Bio Sensors for Bio Process Monitoring 66
http://slidepdf.com/reader/full/23689262-bio-analysis-and-bio-sensors-for-bio-process-monitoring-66 157/236
[53, 81]. It has to be pointed out that the shape descriptors should be invariantwith respect to the size of the object and to its position within the field of view.Several descriptors describe macroscopically the shape by geometrical con-siderations based on length measurements.
Circularity or compactness is usually defined as p2 4p A 71 or 71 (9)4p A p2
where P is the perimeter of the silhouette. Pixels on the contour of the silhouettehave at least one of their neighbors which does not belong to the object (pixelvalue =0). However, due to the constrains of discrete geometry, the perimeterlength cannot be given by a simple count of the contour pixels. Reasonableapproximations are proposed by the image analysis packages, taking into
account separately the orthogonal and diagonal neighbors [53].The circularity varies both with the elongation of the object and its rugosity.
Elongation itself is often assessed through the Feret diameters, especially through the ratio between the maximal (“length”) and minimal (“breadth“)Feret diameters (Fig. 13a). This is valid for convex or almost convex elements,but not for those exhibiting large concavities (Fig. 13b). In such cases a rectan-
152 M.-N. Pons · H.Vivier
Fig. 13. a Maximal (F max) and minimal (F min) Feret diameters of a Saccharomyces cerevisiaebudding cell; Schematic representation of an unbranched filament (b), its skeleton (c) and itsEDM image (d)
a b
c d

8/8/2019 23689262 Bio Analysis and Bio Sensors for Bio Process Monitoring 66
http://slidepdf.com/reader/full/23689262-bio-analysis-and-bio-sensors-for-bio-process-monitoring-66 158/236
gular assumption can be made about the feature shape: assuming a constantwidth W and a length F then
A = F · W (10)
and P = 2 · (F + W ) (11)
If the boundary is relatively smooth the perimeter can be measured withreasonable accuracy, and F and W are given by the following equations:
08P + ÷P 2 – 16 · AF = 007 (12)
4 A
W = 3 (13)F
Another way to proceed is to calculate the skeleton of the feature of interest(Fig. 13c) and its Euclidian Distance Map (Fig. 13d). The skeleton is obtained by successive erosions until a set of points with maximal thickness of one or two isfound: the area of the skeleton gives the length of the object. Using the skeletonto select only the points which lie along the axis of the feature’s EDM and re-taining their gray values, an average or maximal width is obtained. In theexample of Fig. 13, F = 347 pixels and W =13 pixels when calculated from therectangular assumption, and F = 352 pixels and W =13 pixels when calculatedfrom the skeleton length and the EDM.
Cazzulino et al. [82] and Hirano [83] calculate a “roughness” factor:p (F + W )
R = 06 (14)2P
to characterize somatic embryos and budding Saccharomyces cerevisiae cellsrespectively. R is closed to 1 for a disk or an ellipse.For a disk F =W and P = p F .
Biomass Quantification by Image Analysis 153
Fig. 14. Reduced radii of gyration for a large debris (r g = 0.77), a filament (r g = 2) and a clump(r g =1.19)

8/8/2019 23689262 Bio Analysis and Bio Sensors for Bio Process Monitoring 66
http://slidepdf.com/reader/full/23689262-bio-analysis-and-bio-sensors-for-bio-process-monitoring-66 159/236
R becomes smaller than one (0.7 £ R<1) when the shape becomes irregular likea budding yeast. For Fig. 13a R = 0.87.
The reduced radius of gyration (r g ) is a global descriptor usefulto discriminate large globular features (debris or pellets) from filamentous
objects (r g = 0.7 for a disc) (Fig. 14). It is based on the moments of thefeature: 08÷ M 2x + M 2Y r g = 001 (15)
Deq /2
withN N
 (xi – x g )2  ( yi – y g )2
i = 1 i = 1 M 2 X = 001 , M 2Y = 091 , (16)N N
N N
 xi  yii = 1 i = 1x g = 81 and y g = 81
N N
(xi , yi ) defines the position of pixel i of an object of N pixels according tothe columns and lines of the image. The inertia matrix S XY , also based on themoments, is real and positive semi-definite, with two non-zero real eigenvalues,lmin and lmax
M 2 X M XY Â XY = T Y (17) M XY M 2Y
withN
 (xi – x g ) · ( yi – y g )2
i = 1 M XY = 0007 (18)N
The ratio of the two eigenvalues is an indication of the eccentricity of thelminshape, as 71 is equal to 1 for a disc and decreases toward 0 when the shapelmax
becomes elongated. Dubuisson et al. [84] based their classification of Metha-nospirillum hungatei and Methanosarcina mazei on this descriptor combinedwith the circularity.
Fourier descriptors have been found valuable for the description of rathersmooth contours such as the ones of somatic embryos [85– 87]. The contoursignature defined as R(s) = f (s) where R(s) is the distance between the centroidG and a point of the contour (Fig. 15), of normalized curvilinear abscissa s with
respect to an origin O, is holomorph and can be written as:∞ 1 2p
s ¢R(s) = Â C ne– jns with C nR(s)) = 5 ∫ R(s) e– jns ds and s = 2p 3 (19)
i = 1 2p 0 P
154 M.-N. Pons · H.Vivier

8/8/2019 23689262 Bio Analysis and Bio Sensors for Bio Process Monitoring 66
http://slidepdf.com/reader/full/23689262-bio-analysis-and-bio-sensors-for-bio-process-monitoring-66 160/236
The first coefficients (2 £ n <10) describe the general shape of the objectwhen the coefficients of higher order are related to its rugosity. C 0 gives theaverage radius of the particle and C 1 the error in the definition of the positionof the centroid [81, 88].
The comparison to a reference shape, which is generally the convexbounding polygon provides another set of descriptors, at a mesoscopic level of details. The index of concavity in length or in surface measures globally how theobject departs from a convex shape:
IC A = A/ Ac and IC P = P /P C (20)
where Ac and P c are respectively the area and the perimeter of the convexbounding polygon. For the somatic embryo (torpedo) schematized in Fig. 16IC A = 0.95 and IC P = 1.07. Variations of the index of concavity can be due to
multiple small concavities or to a single one. The size of the largest concavity can be estimated by applying a series of erosions to the residual set of the objectwith respect to the convex bounding polygon [89,90].The residual set (Fig. 16c)disappears completely after w2 = 9 erosions and the reduced size of its largestconcavity is expressed by:
2w2W2 = 7 = 0.14 (21) 31÷ A
Fractal dimension is used to give information on rugosity at the microscopic
level of details. Different algorithms are available. In the Richardson’s walk [91],
Biomass Quantification by Image Analysis 155
Fig. 15. Definition of the signature
Fig. 16. Concavity index measurement: a Schematic somatic embryo b Convex boundingpolygon, c Residual set
a b c

8/8/2019 23689262 Bio Analysis and Bio Sensors for Bio Process Monitoring 66
http://slidepdf.com/reader/full/23689262-bio-analysis-and-bio-sensors-for-bio-process-monitoring-66 161/236
a step of increasing length (l) is uses to measure the length of the contour (P )(Fig. 17 above). The slope of the logP versus log l plot gives the desired fractaldimension (Fig. 17 below). As mentioned previously measuring lengths is noteasy on images: many discuss the reliability of the results in function of the way the contour is defined. The results of the Richardson’s walk depends also uponthe starting point.
A faster and more robust way to obtain the fractal dimension is to use the
EDM [53]. The brightness histogram b(v ) gives directly the number of pixels ateach distance l: the perimeter P (l) is calculated by dividing the number of pixels with a brightness less than or equal to l by l:
l
 b(v )v = 1P (l) = 03 (22)
l
It has to be recognized that the interpretation of the plot is not always straight-
forward since it might be difficult to find a single straight line. NeverthelessGrijspeerdt and Verstraete [92] have established a relationship between thefractal dimension of flocs and the settleability properties of the activatedsludge. Relations can be found between the fractal dimension and the porosity of aggregates [93].
Image analysis provide information based on the number of cells examined:the question of the volume is therefore often raised, as some other sizingsystems (Coulter counter, laser diffraction granulometers) provide volume-based results. It is important to note that, because an image is essentially aplane, volume estimation will require some assumption on the 3D-shape.
Bacteria are often considered as cylinders with hemispherical ends at each side.Based on these simple geometrical assumptions their volume can be computed[94, 95]:
V = [(W 2 – p /4) · (F – W )] + (p · W 3/6) (23)
156 M.-N. Pons · H.Vivier
Fig. 17.
Computation of the fractal dimension (below) by the Richardson’s walk (above)

8/8/2019 23689262 Bio Analysis and Bio Sensors for Bio Process Monitoring 66
http://slidepdf.com/reader/full/23689262-bio-analysis-and-bio-sensors-for-bio-process-monitoring-66 162/236
Biomass Quantification by Image Analysis 157
Fig. 18. Fractal dimension of activated sludge flocs “1” (a) and “2” (e) (initial gray-levelimages); Binary image (b) and EDM image (c) of floc “1”; Calculation of the fractal dimen-sion of flocs “1” (d) and “2” (f )
a b
c d
e f
This reduces to:
V = p · W 3/6 (24)
when the bacteria is a coccus. Saccharomyces cerevisiae yeast cells are mostly assumed to be prolate ellipsoids [74]
4p W 2 F V = 04 (25)3
or even spheres [37, 96]. Vaija et al. [97] assume that Saccharomyces cerevisiaemother cell is a prolate ellipsoid with a spherical bud. A more detailed volume

8/8/2019 23689262 Bio Analysis and Bio Sensors for Bio Process Monitoring 66
http://slidepdf.com/reader/full/23689262-bio-analysis-and-bio-sensors-for-bio-process-monitoring-66 163/236
determination has been used by Huls et al. [29] for the same yeast but theirtechnique, based on narrow slices perpendicular to the main axis of the cell, isnot fully automated as the operator interactively selects the cell to analyze.
6The Special Case of Filamentous Species
Filamentous species, either fungi (Penicillium sp., Trichoderma sp., Aspergillussp., etc.) or bacteria (Streptomyces sp.), have received a lot of attention due totheir commercial importance. The difficulty in their case is not so much the sizeof the cells but the very different morphologies that can be observed. The pos-sible interaction between the observed morphologies ( A. awamori, [98, 99] andniger [100] P. chrysogenum [101–105] S. fradiae [106, 107] and tendae [108],basidiomycetes such as Schizophyllum commune [109], Fomes fomentarius [110]or Cyathus striatus [111] ), the mixing conditions and the viscous properties of the broth is one important question for improved process design, not only at thelevel of the fermenter but also for downstream processing steps such as filtra-tion [112]. Product formation is related to morphology for many species: A.awamori [99,113], A. oryzae [114], A. niger , producer of itaconic and citric acids[115] and enzymes (polygalacturonidase or alpha-glucosidase). Models relatingthe hyphal differentiation, in terms of morphology (P. chrysogenum [118], Aawamori [119], Trichoderma reesei [120, 121], S. tendae [122]) and physiology [123], and the production of secondary metabolites is another field of interest.
The quality and reproducibility of inoculum is a everyday problem in industry:the P. chrysogenum spore inoculum level [124] and the type of reactor used forthe preparation of inoculum [125] influence the morphology found during themain culture. Filamentous microorganisms such as Microthrix parvicella areresponsible for bulking and foaming accidents [126, 127] in activated sludgewastewater plants: such events are detrimental to the control of the plant,especially of the secondary settler. Some plant cells ( Morinda citrifolia forexample) [128] or yeast cells (Saccharomyces cerevisiae [129], Kluveyromycesmarxianus [130], Aureobasidium pullulans [131, 132]) can also exhibit fila-mentous morphologies.
Whether growing in suspension or on a solid substrate, the life cycle of fila-mentous bacteria and fungi starts with spores. Spores are usually considered asbeing spherical particles [133] although they can probably be best representedas ellipsoids. Actinomycetes spores were found to have some degree of elonga-tion [134]. Mitchell et al. [135] have examined a collection of 13 types of basi-diospores ( Agrocybe parasitica, Leucoagaricus leucothites and 11 Agaricusspecies) which were distinguished one from another by five features (length,width, elongation, circularity and area). An automated method has beendeveloped by Paul et al. [136] to monitor the swelling, the emission of germ
tubes and their subsequent elongation: the method has been applied to P.chrysogenum spores for different germination conditions. The shape of thegerm tube depends upon the species. A general automated procedure has beendevised by Oh et al. [137] to study the germination of circular ( Aspergillus
fumigatus), oval (Curvularia lunata) and banana-shaped (Fusarium solani)
158 M.-N. Pons · H.Vivier

8/8/2019 23689262 Bio Analysis and Bio Sensors for Bio Process Monitoring 66
http://slidepdf.com/reader/full/23689262-bio-analysis-and-bio-sensors-for-bio-process-monitoring-66 164/236
spores: it uses a curvature-based shape representation technique after edge-smoothing by Fast Fourier Transform. Once the germ tube has grown suf-ficiently, lateral branches develop as filaments [138].
Figure 19 shows the main steps of a method of characterization of spores and
generated filaments which is based on the Euclidean Distance Map. The centralzone of the EDM (i.e. the zone with the highest distance value Rm) is dilated Rm
times. The size of the object in Fig. 20e gives the size of the spore.A logical sub-traction of Fig. 19e from Fig. 19c leaves only the branches visible in Fig. 19f.
The important features of filaments in absence of entanglement of theirbranches are the total length of the filament, the length of the main hypha, thenumber of extremities or tips, the number of branching points and the distancebetween two branching points and between branching points and tips.
Biomass Quantification by Image Analysis 159
Fig. 19. Study of a germinated spore (Trichoderma reesei): a Initial gray-level image; b binary image; c binary image after cleaning; d EDM image; e Spore mask; f Filamentous parts
a b
c d
e f

8/8/2019 23689262 Bio Analysis and Bio Sensors for Bio Process Monitoring 66
http://slidepdf.com/reader/full/23689262-bio-analysis-and-bio-sensors-for-bio-process-monitoring-66 165/236
The first methods of their quantitative morphological analysis were based ona digitizing table, on which the image of filaments was projected. The filamentswere spread carefully to avoid entanglements [139]. The operator, by means of a cursor, captured the hyphal coordinates, the tips and the branching points
positions. This method has been used to study the influence of operationconditions on the morphology of filamentous molds [140] but it reveals itself tobe very laborious, as it is necessary to study a large numbers of objects (from100 to 2000 per sample) to have statistically valid results. This encouraged C.Thomas and his research team to develop automated image analysis methodsfor free filaments [141–143] initially for S. clavuligerus and P. chrysogenum.Similar methods were applied by Daniel et al. [144] for the quantification of fungi on decomposing leaves and by Walsby and Avery [145] to cyanobacteria.In the latter case, the microorganisms can be observed directly by epifluores-cence microscopy (lex = 546 nm and lem = 580 nm) The general steps involvedin the free filaments characterization are shown in Fig. 20. Special points of the
160 M.-N. Pons · H.Vivier
Fig. 20. Study of a simple filament: a Gray-level image (S. ambofaciens filament after INTstaining); b binary image; c skeleton; d skeleton after removal of branching points; e terminalbranches; f internal segments
a b
c d
e f

8/8/2019 23689262 Bio Analysis and Bio Sensors for Bio Process Monitoring 66
http://slidepdf.com/reader/full/23689262-bio-analysis-and-bio-sensors-for-bio-process-monitoring-66 166/236
skeleton (Fig. 20c) are detected: end-points to mark the apices and triple-pointsto mark the branching points. The triple-points are removed from the skeletonand the apices are reconstructed from the end-points (Fig. 20e). The internalsegments are obtained by difference (Fig. 20f).
A similar procedure can be applied to the branches of the germinated sporesof Fig. 19. The only measurement listed above which cannot be really obtainedis the length of the main hypha. Its definition is somewhat unclear. In the aboveapproach it is usually stated to be the longest path between two tips. In theexample of Fig. 19, it is certainly not true as the spore from which the filamentsoriginated is almost at the center of the structure. For a more developed fila-ment the spore is often not clearly visible any more due to the spatial resolution.
In order to monitor closely the early steps of germination and developmentof hyphae, and to track the development of the main hypha, a flow-through cellhas been designed by Spohr et al. [133]. The adhesion of Aspergillus oryzae
Biomass Quantification by Image Analysis 161
Fig. 21. Different complex filamentous morphologies: a P. roqueforti entanglement; b S. am-bofaciens clump; c and d S. ambofaciens pellets; e S. ambofaciens bald pellet
a b
c d
e

8/8/2019 23689262 Bio Analysis and Bio Sensors for Bio Process Monitoring 66
http://slidepdf.com/reader/full/23689262-bio-analysis-and-bio-sensors-for-bio-process-monitoring-66 167/236

8/8/2019 23689262 Bio Analysis and Bio Sensors for Bio Process Monitoring 66
http://slidepdf.com/reader/full/23689262-bio-analysis-and-bio-sensors-for-bio-process-monitoring-66 168/236
Biomass Quantification by Image Analysis 163
In this approach an ellipse is fitted to the object, taking into account itsmoments. Series of openings helped Treskatis et al. [41] to characterize S.tendae pellets by progressive filling of the holes in the structure.
The EDM brightness histograms computed on the object before and after
hole-filling bring also information on pellets and entanglements withouthaving to detect specifically the presence of a core. The differences in the EDMimages of a pellet before (object, of equivalent diameter Deq1, in Fig. 23b and d)and after (mask, of equivalent diameter Deq2 , in Fig. 23c and e) hole-filling areseen in the graph of Fig. 23d. The maximal distance of the object gives theradius of the core: Rc1 [151].
The filament thickness can be another interesting feature. Production of cephalosporin by Cephalosporium acremonium has been observed in conjunc-tion with some swelling of the hyphae [152]. It has been often reported that,
when cultivated on solid substrate, apical parts of filamentous species tend tobecome thinner, apparently due to substrate limitation, which induces the cellto increase its surface to volume ratio. Similar behavior has been observed insuspended media on fungi (Trichoderma reesei [151] and S. ambofaciens [153,154]) (Fig. 24). Hyphae are often regarded as solid cylinders, and, in order to
Fig. 22. Detection of a pellet core: a Binary image; b Skeleton; c Core obtained after 15 open-ings; and d its skeleton
a
c d
b

8/8/2019 23689262 Bio Analysis and Bio Sensors for Bio Process Monitoring 66
http://slidepdf.com/reader/full/23689262-bio-analysis-and-bio-sensors-for-bio-process-monitoring-66 169/236
164 M.-N. Pons · H.Vivier
Fig. 23. Streptomyces pellet (a), its silhouette (b normal, c filled) and the EDM images of itsnormal (d) and filled (e) silhouettes; f EDM histograms for the pellet (Object) and its mask
a
b c
d e
f

8/8/2019 23689262 Bio Analysis and Bio Sensors for Bio Process Monitoring 66
http://slidepdf.com/reader/full/23689262-bio-analysis-and-bio-sensors-for-bio-process-monitoring-66 170/236
calculate the volume occupied by filaments, one needs to know the hyphaldiameter (Dh) [155]:
p Dh AV = 0 (30)
4Manual estimation can be obtained using a cursor-editor but a more general
quantification of the filament thickness can be simply made by computing thebrightness level histogram of the EDM along the skeleton, as a generalization of the procedure described in Fig. 13b. A simpler characterization in three thick-ness classes is proposed in Fig. 25 for Trichoderma reesei [151] by performingseries of erosions of predetermined order to the silhouette and measuring thelength of the skeleton masked by the eroded silhouette. Another morphologicalcharacteristic, the distance between septa, can be put in light by fluorescent
dyes as described by Reichl et al. [156] and Drouin et al. [152] on Streptomycessp.(Fig.2b).
Biomass Quantification by Image Analysis 165
Fig. 24. Filament diameter: S. ambofaciens with SEM (a) and epifluroescence microscopy (b);T. reesei with optical microscopy at the beginning (c) and the end (d) of a culture
a b
c d

8/8/2019 23689262 Bio Analysis and Bio Sensors for Bio Process Monitoring 66
http://slidepdf.com/reader/full/23689262-bio-analysis-and-bio-sensors-for-bio-process-monitoring-66 171/236
7Shape Classification
As we have seen in the previous sections several descriptors are needed for thedescription of a shape. Together with other characteristics of the cell (viability,etc.), these descriptors form a vector of features describing each microorga-
nism. The problem is then into the interpretation of the data. Distributions of the various descriptors can be plotted, but they do not help much to have aglobal assessment except when the number of descriptors is limited as for thecharacterization of Saccharomyces cerevisiae budding by elongation [74, 83] orwhen one is specifically interested in a descriptor such as hairiness. The situa-tion is even more complex when Fourier descriptors are used as it is difficult tofind a real physical significance to them. Data-mining tools such as PrincipalComponent Analysis [90, 135, 157, 158], Discriminant Analysis [82], fuzzy logicand Artificial Neural Nets [41, 72, 95, 132, 133, 159] are useful for clarifying thesituation.
The general framework of these data interpretation techniques is:– a learning phase: a training population is classified manually by one or several
experts. The algorithm is trained to classify the corresponding data set.– a validation step: a population, which has not been used for the training
phase, is automatically classified.The performance index, i.e. the rate of mis-classification with respect to the “ideal”classification which would have beendone by the expert(s) is calculated.
If the agreement is satisfactory, the classification procedure can be used on a
routine bias. If not, some of the classification algorithm parameters, the com-position of the training population, the class characteristics or the selection of the shape descriptors should be modified.
Many applications dealing with non filamentous bacteria are not so muchrelated to process control than to health and hygiene problems or characteriza-
166 M.-N. Pons · H.Vivier
Fig. 25. Evolution of the thickness of filament in a culture of Trichoderma reesei: (x) Fine,
() Medium, () Thick filaments

8/8/2019 23689262 Bio Analysis and Bio Sensors for Bio Process Monitoring 66
http://slidepdf.com/reader/full/23689262-bio-analysis-and-bio-sensors-for-bio-process-monitoring-66 172/236
tion of the biopopulation in a natural system (fresh and sea waters, soils). Meijeret al. [157] have classified different bacterial strains automatically: Strepto-coccus puogenes, Escherichia coli, Streptococcus group D, Klebsiella pneumonia,Proteus mirabilis, Pseudomonas aeroginosa and Staphylococcus aureus.
Descriptors of the size, the irregularity of the contour, the concavity and theglobal circularity of the cells were considered in a multivariate analysis of variance to distinguish the different species one from another.
Filamentous morphologies can be classified with a similar approach. Goingback to the characterization based on the EDM, the maximal distance of themask gives the radius of the core plus the entangled zone, without the lateralisolated filaments (Rc2 ). Together with the reduced radius of gyration (r g = 0.84)four descriptors are defined: the ratio of the object perimeter to the maskperimeter, the ratio of the pellet diameter to the core diameter, the ratio of thefilled pellet diameter to the core + entanglement diameter and the ratio of thecore radius to the mean value of the pellet EDM.A general map, in the plane of the two first principal components, can be obtained,with different locations forthe various morphologies (Fig. 26). Recently a similar method has been pro-posed to help to the automated recognition of protozoa in activated sludge[160]. The protozoa are characterized by their silhouette circularity, elongation,eccentricity, length and area. V. microstoma sp. and Opercularia sp., which areindicators of a poor efficiency of a wastewater treatment plant are wellrecognized.
Biomass Quantification by Image Analysis 167
Fig. 26. Global shape classification of filamentous species using Principal ComponentsAnalysis

8/8/2019 23689262 Bio Analysis and Bio Sensors for Bio Process Monitoring 66
http://slidepdf.com/reader/full/23689262-bio-analysis-and-bio-sensors-for-bio-process-monitoring-66 173/236
8Densitometry and Visual Texture
8.1
Physiology Assessment
Saffron was used by A. van Leeuwenhoek to stain muscular fibers but it was thedevelopment of aniline stains for the textile industry in the mid 19th century that changed the face of sample preparation for optical microscopy. Orchil ap-pears to be the first synthetic dye, prepared as early as 1300. Some of the now classical stains are Methylene Blue, Neutral Red, Hematoxylin, Carbol Gentian,Trypan Blue and Fuschin. They are almost all synthetic. These stains are firstused to enhanced the contrast between the cells and the background butphysiological features can also be detected due to changes in hue or intensity
related to intracellular reactions between the dye and biological species.Different mechanisms are responsible for these reactions [161]. Basic Fuchsin isthe main component of Schiff’s reagent, often used for aldehyde detection.In 1924, Feulgen and his coworkers [162, 163] used this reagent for the firsttime to stain nuclei. In Feulgen’s reaction, after acid hydrolysis of nucleicacids, the produced aldehydes are detected by Schiff’s reagent. Crystal Violetand Safranin are the basic components of the Gram’s stain: Gram-positivemicro-organisms are deep-violet when the Gram-negative ones are red. Imageanalysis can provide morphological as well as densitometric data to monitor
the cell cycle [164]. Methylene Blue is used extensively in a viability test foryeast cells [165]: the moribund cells are colored blue when the live cells remaincolorless. The dead cells are lysed and their intracellular content is dispersedin the broth [166]. Automated analysis of hybridoma cell viability has beenproposed by Tucker et al. [167] and Maruhashi et al. [39] using Trypan Bluestaining.
Growing apices of P. chrysogenum are easily stained by Neutral Red and they appear darker than the remaining cytoplasm and vacuoles [168]. Twothresholds are defined to detect the three regions of interest, that enable todefine three physiological states: growing, non-growing (cytoplasm with
vacuoles <30 mm3), degenerated (cytoplasm with vacuoles > 30 mm3).A simplemonochrome CCD-camera can be used, which was not the case for the stainingprocedure developed for the same microorganism by Vanhoutte et al. [169]: amixture of Methylene Blue and Ziehl Fuschin takes various hues (orange, gray,purple), the subtle changes of which can be picked up correctly only by a 3-CCDcolor camera.Six physiological states were defined: growing, four states with in-creased degree of differentiation, dead, and the physiological status of hyphaecould be monitored along the culture. The hyphae of P. chrysogenum are re-latively thick: it is not so for S. ambofaciens for which a simple procedure, basedon Carbol Gentian, was developed by Drouin et al. [153] to distinguish activehyphal parts from inactive ones (Fig. 27 above), which have lost their intra-cellular material by leakage through the cell wall [170]. In a batch culture, thisloss happens first at the extremities of the hyphae and then propagates into theinternal parts of the filament as shown graphically in Fig. 27 below. The ability
168 M.-N. Pons · H.Vivier

8/8/2019 23689262 Bio Analysis and Bio Sensors for Bio Process Monitoring 66
http://slidepdf.com/reader/full/23689262-bio-analysis-and-bio-sensors-for-bio-process-monitoring-66 174/236
offered by automated image analysis to examine a large number of images havefacilitated investigations on the effects of operation conditions and metabolismand in function of the culture age [171].
More recent staining procedures largely use fluorescent dyes to characterizethe physiological and biochemical states of cells. Fluorescein Diacetate (FDA), a
non-polar substance which crosses the membrane and is hydrolyzed by intra-cellular esterases in viable cells to produce fluorescein, exhibits yellow-greenfluorescence when excited at 490 nm. Damaged or non-viable cells in generalare unable to hydrolyze FDA or to retain fluorescein within the cell [172, 173].In combination with Ethidium Homodimer or Propidium Iodide, a similaresterase substrate, calcein acetoxy methyl ester (CAM) has been found to bereliable for viability assessment of protozoans, but not on Candida yeast,neither on bacteria such as Bacillus cereus and Escherichia coli [174].
Acridine Orange (3,6-bis[dimethylamino]acridinium chloride) is a well-known metachromatic stain which fluoresces orange when bound to single-
stranded nucleic acids and green when bound to double-stranded nucleic acids.The color,which ranges from orange to yellow and green,can give an indicationof the relative proportions of RNA (mostly single-stranded) and of DNA(mostly double-stranded). When RNA:DNA is large, such as in fast growingcells, the color is orange and tends to green in slowly growing cells [69]. A colorCCD camera should be used for Acridine Orange densitometry: monochromecameras are more sensitive to red than to green and therefore detection of cellsstained in green may be difficult. It can be applied to cells cultivated in suspen-sion or on solid substrate, without having to detach them from their support
[69, 175–177]. DAPI (4¢6-diamino-2-phenylindole) is another vital stain, DNAspecific [178]: however, its blue fluorescence under UV light can again causeproblem for detection by a CCD camera [179] although other researchers obtaina good correlation between the most-probable-number (MPN) obtained by DAPI staining and direct counts [67].
Biomass Quantification by Image Analysis 169
Fig. 27. above Full and empty parts in hyphae; below Proportion of empty parts in hyphae(v) (in arbitrary units) and proportion of terminal empty parts ()
a b

8/8/2019 23689262 Bio Analysis and Bio Sensors for Bio Process Monitoring 66
http://slidepdf.com/reader/full/23689262-bio-analysis-and-bio-sensors-for-bio-process-monitoring-66 175/236
Other vital stains take advantage of different cellular properties which can becorrelated with cellular physiology: Propidium Iodide, Ethidium Bromide,Ethidium Monoazide, Calcofluor White have been widely used to indicate thepresence of dead eukaryotes or prokaryotes cells. 2-(p-iodophenyl-)3)(p-nitro-
phenyl)-5-phenyl tetrazolium chloride (INT) belongs to a class of stains whichcan be used to determine if a cell or hyphal compartments [180] can maintainan internal reducing environment (Fig. 20a). There are, however, still a largedebate about the reliability of those techniques, depending upon the cells underconsideration [181]. Calcofluor (lex ≈ 380 nm, lem ≈ 420 nm) is a specific cellwall stain which enables to counts buds scars on Saccharomyces cerevisiae [29]to estimate the age of a cell.
Classically the viability of bacterial cells is determined by plate countingprocedures.Under the stress or starvation conditions induced by the cultivationon a synthetic growth medium the cells may enter into a state of dormancy,which introduces a bias in the results. A method of direct estimation of viablebacteria has been proposed by Kogure et al. [182] for Gram-negative bacteria:the samples are incubated in presence of nutrients and of a low concentrationof nalidixic acid, which acts as a specific inhibitor of DNA synthesis. Thegrowing cells cannot divide and the enlarged, i.e. viable, cells are stained withAcridine Orange. Singh et al. [183] have automated the enumeration of bacteriaon such preparations. Barcina et al. [184] have proposed another inhibitor,ciprofloxacin, for both Gram-positive and Gram-negative bacteria.
The vital stains can have an effect on the shape of the cells. It is especially
true for cells which have a rather flexible membrane such as Saccharomycescerevisiae: the buffers (reactants) necessary to a proper reaction of the stainaffect the cell.Viable cells observed with Methylene Blue staining are larger anddying cells smaller than unstained cells [74]. Potential problems are mentionedby Huls et al. [29], with dansylchloride and Calcofluor staining procedures of Saccharomyces cerevisiae. Sometimes a simple difference in gray level can per-mit,without staining but with a phase contrast microscope,to visualize internalstructures such as vacuoles in Saccharomyces cerevisiae (Fig. 28) [40]. Billon etal. [185] have monitored the germination of single spores of Clostridiumbotulinum by observing them with a phase-contrast microscope and simply
170 M.-N. Pons · H.Vivier
Fig. 28. Vacuole of Saccharomyces cerevisiae cell observed by phase-contrast microscopy

8/8/2019 23689262 Bio Analysis and Bio Sensors for Bio Process Monitoring 66
http://slidepdf.com/reader/full/23689262-bio-analysis-and-bio-sensors-for-bio-process-monitoring-66 176/236
recording the change in refractivity. Jones et al. [186] have observed also achange in refractivity when they developed their automated method forPhanerochaete chrysosporium, but they have suggested it may be due to waterevaporation. Recombinant bacteria such as E. coli can store the foreign proteins
they produce as inclusion bodies [53, 187] or crystals [188] which do not refractlight as the rest of the cell. The number of cells containing one or more inclusionbodies as well as the number of inclusion bodies per cell can be easily moni-tored [53].
Images obtained under different light conditions can be combined.Binnerupet al. [189] have proposed a protocol to determine rapidly the Gram character-istics of single cells or microcolonies: the polycarbonate membrane filters onwhich the bacteria have been deposited, immobilized with a thin layer of highly viscous silicone (which does not affect either cell growth or Acridine Orangesubsequent staining), stained for Gram characterization and by AcridineOrange are first observed by light microscopy then by epifluoresence. Theviability of Saccharomyces cerevisiae cells subjected to osmotic stresses andstained with Acridine Orange was assessed by visualization under white light,to detect all cells, followed by a visualization of the same field by epifluo-rescence, to detect the viable cells [172]. Multispectral imaging [190], by simul-taneous or sequential capture of images using a range of excitation and emis-sion wavelengths, has been tested by Lawrence et al. [191] for the quantificationof algal (by far red autofluorescence, lex = 647 nm, lem = 680 – 632 nm), bacte-rial (by a fluorescent nucleic acid stain SYTO 9,lex =488nm, lem =522–532nm)
and exopolymer components (by a lectin probe, Triticium vulgaris-TRITC,lex = 568 nm, lem = 605 – 632 nm) of microbial biofilms observed by CLSM.Ratio imaging takes a large advantage of the ion-sensitive fluorescent dyes
[192, 193] which have been proposed for the mesurement of local concentra-tions of various ions, H+ but also Na+, K+, Ca2+, Mg 2+, Cl–. Two types of dyes areavailable for the measurement of intracellular pH: dyes that cross the cell wallin response to a pH gradient or dyes which stayed trapped in cell compartmentsand whose excitation or emission spectra depend on the local pH. AcridineOrange belongs to the first type. The spectrum of fluorescein and its derivativesis pH sensitive. Figure 29a represents schematically the action of BCECF-AM
(2¢,7¢-bis(carboxyethyl)-5-carboxyfluorescein-acetoxyl methyl) when it isloaded in a cell. The ester group AM protects the polar groups of the dye andfacilitate the crossing of the cell membrane. The esterases present in the cellcleave the ester, liberating BCECF, which can be detected by emission (Fig. 29b)or excitation (Fig. 29c) ratio imaging.
The basic principle of ratio imaging is presented in Fig. 30. In the pH image,the value taken by each pixel is calculated as F 520 nm /F 620 nm where F 520 nm andF 620 nm are respectively the fluorescence signals at 520 nm and 620 nm. Emissionratio is potentially interesting but is more difficult to apply than excitation ratio
since rapid changes in the emission filters or two detectors are required. CF (5-(and 6)-carboxyfluorescein) exhibits a strong change in its excitation spectrumwith respect to pH when its emission spectrum is almost unchanged: intra-cellular pH is measured by ratio excitation imaging [194] with lex = 518 and464 nm and lem ≈ 520 nm. Due to the importance of calcium in cellular signal
Biomass Quantification by Image Analysis 171

8/8/2019 23689262 Bio Analysis and Bio Sensors for Bio Process Monitoring 66
http://slidepdf.com/reader/full/23689262-bio-analysis-and-bio-sensors-for-bio-process-monitoring-66 177/236
transduction, many calcium indicators have been proposed. The mostpopular Ca2+ indicator for individual cells is certainly Fura-2: when the dyebinds to Ca2+, the excitation spectrum shift to shorter wavelengths but theemission spectrum is unchanged. An excitation pair of 340/380 nm or
350/385 nm gives a good measure of intracellular Ca2+
, with a reading at505– 520 nm.In ratio imaging the quality of the calibration curve is essential for a success-
ful quantitative method. The curve can be established in vitro (i.e. using solu-tions of the stain in a series of buffers at different pH) or in vivo (using labeled
172 M.-N. Pons · H.Vivier
a
b
c
Fig. 29. Action of BCECF-AM illustrated for the emission fluorescence case (a); b Emission(excited at 490 nm) and c excitation (detected at 535 nm) spectra of BCECF at pH 5.5 at pH 9

8/8/2019 23689262 Bio Analysis and Bio Sensors for Bio Process Monitoring 66
http://slidepdf.com/reader/full/23689262-bio-analysis-and-bio-sensors-for-bio-process-monitoring-66 178/236
Biomass Quantification by Image Analysis 173
Fig. 30. Ratio imaging of a Streptomyces pellet, a Red fluorescence; b Green fluorescence(lex = 480 nm); c Pellet mask; d pH image
a b
c d
cells). The problem with in vitro standards is that the dye does not behaveexactly in the same manner in vitro and in vivo: BCECF exhibits a red-shift of about 5 nm when it is introduced in a cell. For in vivo calibration ionophoressuch as nigericin (for pH) or ionomycin (for Ca2+) which allow alteration of theintracellular ion concentration by changing the extracellular one are used.For calcium the in vitro calibration approach proposed by Grynkiewiez et al.[195] is generally adopted [197–198]:
Rm – Rmin F l exfree
[Ca2+
] = K d
07 61 (31)Rmax – Rm F l exsat
where K d is the in vitro dissociation constant, Rm is the measured ratio, Rminthe fluorescence ratio at zero calcium concentration, Rmax the fluorescence

8/8/2019 23689262 Bio Analysis and Bio Sensors for Bio Process Monitoring 66
http://slidepdf.com/reader/full/23689262-bio-analysis-and-bio-sensors-for-bio-process-monitoring-66 179/236
ratio at maximal calcium concentration, F l exfree and F l ex
sat the fluorescence signalsat zero and maximal calcium concentrations respectively.
For any type of application the staining procedure should be carefully designed in connection with the visualization problem [55, 181]. Overstaining
saturates the images, the background fluoresces and debris are also stained. Onthe contrary, when the concentration is too low, cells cannot be detected out of the background noise.
8.2
Visual Texture
Texture is here used in the particular sense of vision: it is related to the idea thata lateral lighting of an object by an electromagnetic wave will reveal the topo-graphy of the object by shading effects (Fig. 31). A rough structure gives animage with large gray-level variations over short distances. When the structureis smooth, the gray-level variations are smaller and the clear bands larger.
On these images, the challenge is to quantify the regularity, the fineness, thehomogeneity, the orientation of the patterns. It can be also extended to colorspatial distribution. Most of the general work done in this field comes from theanalysis of aerial or satellite images. There are, as in bi-dimensional shapecharacterization, several methods of texture characterization [51–53]. One of the most successful of them in based on the spatial gray-level dependencematrix (SGLDM) [199] which examines the relative position of pixels of similar
174 M.-N. Pons · H.Vivier
Fig. 31. Visualization of 3D shape by visual texture: rugose (a) and smooth (b) surfaces;c young and d old P. roqueforti colonies
a b
c d

8/8/2019 23689262 Bio Analysis and Bio Sensors for Bio Process Monitoring 66
http://slidepdf.com/reader/full/23689262-bio-analysis-and-bio-sensors-for-bio-process-monitoring-66 180/236
gray level. The co-occurrence gray-level matrix C (cij ) of dimension N g ¥ N g ,where N g is the maximal number of possible gray levels (usually 256) is definedas:
cij = frequency of occurrence of having a pixel of gray level j at a distance d
and angle a of a pixel of gray level i. The C matrix is itself characterized by descriptors such as:
N g N g
Inertia = Â Â (i – j)2 cij (32)i = 1 j = 1
N g N g
Entropy = Â Â {cij log(cij + 10–6)} (33)i = 1 j = 1
N g N g
Energy = Â Â c 2ij (34)
i = 1 j = 1
Inertia takes small values when the largest values of C are close to itsdiagonal, where (i – j) is small, i.e. when the image is homogeneous. Entropy describes the randomness of C : it is maximal when all the cij are equal, on thecontrary to energy which will be minimal in this case. Other descriptors havebeen proposed by Haralick but these are the most commonly used. They arecomputed for the four directions of the grid (a = 0°, 45°, 90° and 135°) and may
be averaged with respect to direction. Several values of d are tested to char-acterize the texture on different ranges.The SGLDM method can be applied to global images as well as individual
objects (seen through the mask constituted by the silhouette) such as thecolonies of Fig. 32. In this special case however, the obvious circular symmetry
Biomass Quantification by Image Analysis 175
Fig. 32. Texture kinetics of a S. ambofaciens colony over an eight-day period (the magnifica-tion is not constant)

8/8/2019 23689262 Bio Analysis and Bio Sensors for Bio Process Monitoring 66
http://slidepdf.com/reader/full/23689262-bio-analysis-and-bio-sensors-for-bio-process-monitoring-66 181/236
of the colony would be badly characterized by a matrix calculated on rectangu-lar grid assumptions. To circumvent this problem a geometrical transformation
is applied which transforms the circular colony into a square image (Fig. 33)[200].It has to be noted that the direct analysis of the texture descriptors is
generally difficult: the descriptors help to compare one structure to another, in
176 M.-N. Pons · H.Vivier
Fig. 33. Transformation of a circular colony into a square image
Fig. 34. Quantification of the texture kinetics of S. ambofaciens (a) and P. roqueforti (b) colo-nies by Principal Components Analysis. The percentages of total variability explained by theprincipal components are given in parentheses
a
b

8/8/2019 23689262 Bio Analysis and Bio Sensors for Bio Process Monitoring 66
http://slidepdf.com/reader/full/23689262-bio-analysis-and-bio-sensors-for-bio-process-monitoring-66 182/236
similar conditions of visualization, but do not give an absolute grading of thetexture. In that domain also Principal Components Analysis has been founduseful for summarizing the information. The growth on agar of colonies of S.ambofaciens and P. roqueforti have been monitored over several days (one or
two images/colony/day): S. ambofaciens colonies are initially bright and smoothand becomes rougher with aging. In contrast, P. roqueforti are initially ratherrough and becomes smooth. The texture descriptors previously presented havebeen calculated for each colony and sample time and a Principal ComponentAnalysis conducted. It is possible to represent 95% of the variability by con-sidering the first two principal components ( f 1 and f 2 ). In Fig. 34 the texturetrajectories of the two types of colonies in the plane f 1 – f 2 have been plotted.The modification of the texture between smooth and rough colonies for S.ambofaciens (Fig. 34a) and between rough and smooth colonies for P. roqueforti(Fig. 34b) is clearly visible.
9Motility
The characteristics of the motion of cells in the vicinity of solid surfaces canhelp to improve the design and control of bioremediation processes, filtrationmembranes, surface biofouling, biofilm reactors for wastewater treatmentBacterial cells respond to heat or toxic stresses by modifying their motility characteristics [201]. The motility characteristics of some protozoa make their
identification easier than on still images. The chemotactic responses of pro-tozoa or daphnia are used to monitor toxic components in wastewater. In theearly seventies Berg [202] and Berg and Brown [203] developed a trackingmicroscope able to monitor the full spatial motion of a single cell for a longperiod of time. It is a very sophisticated system, still in use nowadays [204] butmany cells should be monitored to get reliable statistics on the motion charac-teristics. Image analysis is more restrictive as only the motion in the plane of focus is observed [205]. The advantage is that several cells are monitoredsimultaneously. Data of various types are collected: velocities, shape of trajec-tories, tumbling, reversal of motion, waggling, etc. [206]. Until recently the
on-line analysis of motion of cells or just dynamical investigation such as celldivision [7–9] was restricted by the time required by the treatment of images.Images were stored on films or video-tapes, which were analyzed manually orautomatically after the experiment. Such storage is often detrimental to thequality of images. Digital video-recorders or computers with real-time imagecapture and storage are now available, which permit to capture a large numberof frames, at a rate of 25 frames/s or 33 frames/s. When higher grabbing fre-quencies are necessary, to analyze the motion of cilia or flagella for example,high-speed cameras are available, up to 4000 frames/sec.
When the dynamics are not too fast, real-time image capture and analysis iseasily performed on a personal computer: Gerin et al. [207] have monitored theadhesion of Phanerochaete chrysosporium spores with a capture rate of oneimage/4 min. Bailleul and Schleunders [208] describe a method to reconstructin real time the trajectories of moving cells, by logical addition in the frame
Biomass Quantification by Image Analysis 177

8/8/2019 23689262 Bio Analysis and Bio Sensors for Bio Process Monitoring 66
http://slidepdf.com/reader/full/23689262-bio-analysis-and-bio-sensors-for-bio-process-monitoring-66 183/236
memory (which can contain 4 images simultaneously) of the threshold images.Sequences of 25 images captured at a rate of 25 frames/s are collected andanalyzed.
The basic analysis steps previously described are applicable to each individual
image [206].The localization of the cell, generally by the position of its centroid,is important here to be able to reconstruct the trajectories of the various cellsfrom one frame to the next one. The magnification should be careful selected:high magnification will make the cell identification easier but the cell will re-main very shortly in the field of view. More frames will be necessary and somedata such as the distance between reversal or tumbling events will be biased.
10Conclusions and Perspectives
The background for the application of image analysis in bioengineering is now well set: users are no more afraid by a mysterious tool and more and moreexamples of applications to different microorganisms can be found in theliterature. Growing cells under extreme conditions [209, 210] will probably induce the development of new visualization systems. The user-friendliness of image analysis software has increased, making a routine use of it in a researchenvironment quite possible. The main challenge resides now in the extension toindustrial applications. As for many sophisticated analysis techniques, off-linemeans human labor, which can be incompatible with productivity constrains.
Attempts for on-line development are still scarce and on a prototype scale.However it may not be necessary to dispose of the morphological informationat every minute of a culture. Low-frequency sampling and analysis may be suf-ficient to recalibrate a model, which will use easily available measurements suchas respiration data or pH variations for high-frequency estimation of the pro-cess state.
There is always a debate on the use of either image analysis or “classical”sizing systems such as Coulter counter or laser diffraction granulometry forbiomass quantification. It is certain that the number of cells examined by imageanalysis is much lower than what is analyzed by the other systems. Physiology
can be also assessed by flow cytometry, with a much higher rate. This is aproblem to be considered in order to obtain results which are statistically validover a cell population. There are also types of cells which are difficult or evenimpossible to analyze by laser diffraction granulometry or flow cytometry: it isthe case for filamentous species and cells growing on a support. For the later, adetachment is necessary, with risks on the physiological state of the cells and of partial detachment. Even for yeast cells the agreement between the differentmethods is difficult to reach, due to shape factor [29, 97].
Following the trend to cultivate more and more complex cells such as human
ones for gene therapy or regeneration of body parts (skin [211], nerve [212],bone [213], cartilage [214]) or simply for an easier study of cell physiology [13,215], applications have yet to be developed, in the field of supported growth inparticular, where descriptors of visual texture, to check cell confluence forexample, might be interesting.
178 M.-N. Pons · H.Vivier

8/8/2019 23689262 Bio Analysis and Bio Sensors for Bio Process Monitoring 66
http://slidepdf.com/reader/full/23689262-bio-analysis-and-bio-sensors-for-bio-process-monitoring-66 184/236
Other fields of application will be important in the future for the control of the quality of the bioproducts: different systems are already proposed on a com-mercial basis for the quantification of electrophoresis gels, but developmentsare under way also for automatic DNA fingerprinting and Fluorescence In-Situ
Hybridization (FISH) [216–219].Acknowledgements.The authors are thankful to P Corvini, JF Drouin, A Maazi,P Mauss, D Pichon, whose work helps to provide most of the illustrations.
References
1. Descartes R (1637) In: La Dioptrique, Dixième Discours2. Ball BA, Mohammed HO (1995) Theriogenology 44: 367
3. Larpent JP (1991) Biotechnologie des levures, Masson, Paris4. Chalfie M, Tu Y et al. (1994) Science 263: 8025. Poppenborg L, Friehs K, Flaschel E (1997) J Biotechnol 58:796. Kuehn M, Hausner M, Bungartz HJ, Wagner M, Wilderer PA, Wuertz S (1998) Appl
Environ Microbiol 64:41157. Lord PG,Wheals AE (1980) J Bacteriol 142: 8088. Lord PG, Wheals AE (1981) J Cell Sci 50: 3619. Wheals AE (1982) Mol Cell. Biol. 2:361
10. Pons MN, Vivier H, Voignier L, Bernard-Michel B, Rolland T (1996) Microsc MicroanalMicrostruct 7:467
11. Wilkinson MHF (1998) Optical systems for image analysed microscopy In: Wilkinson
MHF, Schut F (eds) Digital Image Analysis of Microbes. Wiley, New York, pp 43112. Viles CL, Sieracki ME (1992) Appl Environ Microbiol 58:58413. Young JC, DiGiusto D, Backer MP (1996) Biotechnol Bioeng 50: 46514. Lawrence JR, Wolfaardt GM, Neu TR (1998) The study of biofilms using confocal laser
scanning microscopy In: Wilkinson MHF, Schut F (eds) Digital Image Analysis of Microbes. Wiley, New York, p 431
15. Walsh PK, Isdell FV, Noone SM, O’Donovan MG,Malone DM (1996) Enz Microb Technol18:366
16. Bloem J, Veninga M, Shepperd J (1995) Appl Environ Microbiol 61:92617. DeLeo PC, Baveye P, Ghiorse WC (1997) J Microbiol Methods 30:19318. Morris CE, Monier JM, Jacques MA (1997) Appl Environ Microbiol 63:157019. Caldwell DE, Korber DR, Lawrence JR (1992) J Microbiol Methods 15:24920. Swope KL, Flickinger MC (1996) Biotechnol Bioeng 52:34021. Sanford BA, de Fejiter AW, Wade MH, Thomas VL (1996) J Indus Microbiol 16:4822. Wentland EJ, Stewart PS, Huang CT, McFeters GA (1996) Biotechnol Prog 12:31623. Bancel S., Hu WS (1996) J Ferment Bioeng 81: 437– 44424. Bancel S, Hu WS (1996) Biotechnol Prog 12: 398– 40225. Coppen SR, Newsam R, Bull AT, Baines AJ (1995) Biotechnol Bioeng 46:14726. Wu FJ, Friend JR, Hsiao CC, Zilliox MJ, Ko WJ, Cerra FB, Hu WS (1996) Biotechnol
Bioeng 50:40427. Hartke A, Giard JC, Laplace JM, Auffray Y (1998) Appl Environ Microbiol 64:423828. Jiang SC, Kellogg CA, Paul JH (1998) Appl Environ Microbiol 64:53529. Huls PG, Nanninga N, van Spronsen EA, Valkenburg JAC, Vischer NOE, Woldringh CL
(1992) Biotechnol Bioeng 39:34330. Pons MN,Wagner A, Vivier H, Marc A (1992) Biotechnol Bioeng 40:18731. Fry JC, Davies AR (1985) J Applied Bacteriol 58:10532. Woldringh CL, De Jong MA, Van den Berg W, Koppes L (1977) J Bacteriol 131:27033. Gutsche AT, Zurlo J, Deyesu E, Leong KW (1996) Biotechnol Bioeng 49:259
Biomass Quantification by Image Analysis 179

8/8/2019 23689262 Bio Analysis and Bio Sensors for Bio Process Monitoring 66
http://slidepdf.com/reader/full/23689262-bio-analysis-and-bio-sensors-for-bio-process-monitoring-66 185/236
34. Fowler JD, Robertson CR (1991) Appl Environ Microbiol 57:10235. Heldal M, Norland S, Bratbak G, Riemann B (1994) J Microbiol Methods 20: 25536. Howgrave-Graham AR, Wallis FM (1993) Biotechnol Techniques 7 :14337. Srinorakutara (1998) J Ferment Bioeng 86:25338. Lichtfield JB, Reid JF, Richburg BA (1992) Proc IFAC Modeling and Control of
Biotechnical Processes, Colorado, 27539. Maruhashi F, Murakami S, Baba K (1994) Cytotechnol 15:28140. Zalewski K, Buchholz R (1996) J Biotechnol 48:4341. Treskatis SK, Orgeldinger V, Wolf H, Gilles ED (1997) Biotechnol Bioeng 53:19142. Berner JL, Gervais P (1994) Biotechnol Bioeng 43:16543. Perrier-Cornet JM, Marechal PA, Gervais P (1995) J Biotechnol 41:4944. Suhr H,Wehnert G, Schneider K, Bittner C, Scholz T, Geissler P, Jähne B, Scheper T (1995)
Biotechnol Bioeng 47:10645. Bittner C, Wehnert G, Scheper T (1998) Biotechnol Bioeng 60:2446. Van Vliet LJ, Boddeke FR, Sudar D, Young IT (1998) Image detectors for digital image
microscopy In: Wilkinson MHF, Schut F (eds) Digital Image Analysis of Microbes.Wiley,
New York, p 3747. Smith MAL, Reid JF, Hansen AC, Li Z, Madhavi Dl (1995) J Biotechnol 40:148. Prosser J, Rattray L, Silcock D, Glover A, Killham K (1994) Binary 6:49– 5449. Hooper CE,Ansarge RE, Rushbrooke JG (1994) J Biolumin Chemlumin 9:11350. Costello PJ, Monk PR (1985) Appl Environ Microbiol 49:86351. Gonzalez RC, Wintz P (1987) Digital image processing, 2nd edn. Addison Wesley,
Reading, MA52. Sonka M, Hlavac V, Boyle R (1993) Image Processing, Analysis and Machine Vision,
Chapman & Hall Computing, London53. Russ JC (1995) The Image Processing Handbook, 2nd edn. CRC Press, Boca Raton, FL54. Serra J (1982) Image analysis and Mathematical Morphology, Academic Press, London
55. Schröder D, Krambeck C, Krambeck HJ (1991) Acta Stereol 10:12356. Marr D, Hildreth E (1980) Theory of edge detection Proc R Soc London Ser B207:18757. Wilkinson MHF (1998) Automated and manual segmentation techniques in image
analysis of microbes In: Wilkinson MHF, Schut F (eds) Digital Image Analysis of Microbes. Wiley, New York, p 135
58. Ridler TW, Calvard S (1978) IEEE Trans On Syst Man Cyber 8:63059. Otsu N (1979) IEEE Trans Syst Man Cyber 9:6260. Kanpur JN, Sahoo PK, Wong AKC (1985) Comput Vis Graphics Image Proc 29: 27361. Vicente A, Meinders JM, Teixeira JA (1996) Biotechnol Bioeng 51:67362. Miles RE (1974) Stochastic Geometry, Wiley, New York, p 22863. Jeison D, Chamy R (1998) Biotechnol Techniques 9: 65964. Paul GC, Thomas CR (1998) Characterisation of mycelial morphology using image
analysis. Adv Biochem Eng Biotechnol 60:165. Sieracki ME, Viles CL (1998) Enumeration and sizing of micro-organisms using digital
image analysis In: Wilkinson MHF, Schut F (eds) Digital Image Analysis of Microbes.Wiley, New York, p 175
66. Wierzba A, Reichl U, Turner RFB,Warren RAJ, Kilburn DG (1995) Biotechnol Bioeng 46:18567. Bianchi A, Giuliano L (1996) Appl Environ Microbiol 62:17468. Wirtanen G, Mattila-Sandholm T (1993) J Food Protein 56:67869. Yeh TY, Godshalk JR, Olson GJ, McKelly RM (1987) Biotechnol Bioeng 30:13870. Jiang C, Chen P, Shan S (1995) J Microbiol Methods 23:29771. Guerra-Flores AL, Abreu-Grobois A, Gomez-Gil B (1997) J Microbiol Methods 30: 21772. Wit P, Busscher HJ (1998) J Microbiol Methods 32: 28173. Corkidi G, Diaz-Uribe R, Foch-Mallol JL, Nieto-Sotelo (1998) Appl Environ Microbiol
64:140074. Pons MN,Vivier H, Rémy JF, Dodds JA (1993) Biotechnol Bioeng 42:135275. Robinson A, Sadr-Kazemi N, Dickason G, Harrison STL (1998) Biotechnol Techniques
12:763
180 M.-N. Pons · H.Vivier

8/8/2019 23689262 Bio Analysis and Bio Sensors for Bio Process Monitoring 66
http://slidepdf.com/reader/full/23689262-bio-analysis-and-bio-sensors-for-bio-process-monitoring-66 186/236
76. Korber DR, Choi A, Wolfaardt GM, Caldwell DE (1996) Appl Environ Microbiol 62: 393977. Pichon D, Vivier H, Pons MN (1992) Proc IFAC Modeling and Control of Biotechnical
Processes, Colorado, p 31178. Dai W, Saltzman WM (1996) Biotechnol Bioeng 50:34979. Moreira JL, Alves PM,Aunins JG, Carrondo MJT (1995) Biotechnol Bioeng 46:351
80. Hammonds SJ, Adenwala F (1990) Lett. Appl Microbiol 10: 2781. Coster M, Chermant JL (1989) Précis d’Analyse d’Images, 2nd Ed., CNRS Editions, Paris82. Cazzulino D, Pedersen H, Chin CK (1991) Bioreactors and Image Analysis for Scale-up
and Plant Propagation. Cell Culture Somatic Cell Gen Plants 8:14783. Hirano T (1990) ASBC J 48 :7984. Dubuisson MP, Jain AK, Jain MK (1994) J Microbiol Methods 19:27985. Chi CM, Zhang C, Staba EJ, Cooke TJ, Hu WS (1996) J Ferment Bioeng 81:44586. Huang LC, Chi CM, Vits H, Staba J, Cooke TJ, Hu WS (1193) Biotechnol Bioeng 41: 81187. Chi CM, Zhang C, Staba J, Cooke TJ, Hu WS (1996) Biotechnol Bioeng 50:6588. Beddow JK, Melloy P (1980) Testing and characterisation of powders and fine particles,
Heyden, London
89. Pons MN,Vivier H, Dodds JA (1997) Part Part Syst Charact 14: 27290. Pons MN, Vivier H (1998) Beyond filamentous species … Adv Biochem Eng Biotechnol60:61
91. Kaye BH (1986) Image analysis procedures for characterising the fractal dimension of fine particles. Proc Part Technol Conf Nürnberg
92. Grijspeerdt K, Verstraete W (1997) Wat Res 31:112693. Logan BE,Wilkinson DB (1991) Biotechnol Bioeng 38: 38994. Loferer-Krößbacher, Klima J, Psenner R (1998) Appl Environ Microbiol 64: 68895. Blackburn N, Hagström Å, Wikner J, Cuadros-Hansson R, Bjørnsen PK (1998) Appl
Environ Microbiol 64:324696. Marechal PA, Gervais P (1994) Appl Microbiol Biotechnol 42:617
97. Vaija J, Lagaude A, Ghommidh C (1995) A. van Leeuwenhoek 67:13998. Cui YQ, van der Lans RGJM, Luyben KCAM (1997) Biotechnol Bioeng 55:71599. Schügerl K, Gerlach SR (1998) Influence of the process parameters on the morphology
and enzyme production of Aspergilli.Adv Biochem Eng Biotechnol 60:195100. Kamilakis EG,Allen DG (1995) Process Biochem 30:353101. Makagiansar HY, Ayazi Shamlou P, Thomas CR, Lily MD (1993) Bioprocess Eng 9:83102. Tucker KG, Thomas CR (1993) Trans IchemE 71:111103 . McIntyre M, McNeil B (1997) Enz Microb Technol 20:135104. Jüsten P, Paul GC, Nienow AW, Thomas CR (1998) Biotechnol Bioeng 59: 762105. Olsvik E, Tucker KG, Thomas CR, Kristiansen B (1993) Biotechnol Bioeng 42:1046106. Tamura S, Park Y, Toriyama M, Okabe M (1997) J Ferment Bioeng 83:523107. Choi DB, Park EY, Okabe M (1998) J Ferment Bioeng 86 :413108. Vecht-Lifshitz SE, Magdassi S, Braun S (1990) Biotechnol Bioeng 35: 890109. Durant G, Cox PW, Formisyn P, Thomas CR (1994) Biotechnol Techniques 8 :759110. Durant G, Crawley G, Formisyn (1994) Biotechnol Techniques 8:395111. Gehrig I, Bart HJ, Anke T, Germerdonk R (1998) Biotechnol Bioeng 59: 525112. McCarthy AA, O’Shea D, Murray NT, Walsh PK, Foley G (1998) Biotechnol Prog 14:279113. Johansen CL, Coolen L, Hunik JH (1998) Biotechnol Prog 14: 233114. Carlsen M, Nielsen J, Villadsen J (1996) J Biotechnol 45:81115. Gomez R, Schnabel I, Garrido J (1988) Enzyme Microb Technol 10:188116. Hemmersdorfer H, Leuchtenberger A, Wardsack C, Ruttloff H (1987) J Basic Microbiol
27:309117. Kobayashi H, Suzuki H (1977) Biotechnol Bioeng 18: 37118. Krabben P, Nielsen J (1998) Modeling the mycelium morphology of Penicillium species
in submerged cultures.Adv Biochem Eng Biotechnol 60:125119. Cui YQ, Okkerse WJ, van der Lans RGJM, Luyben KCAM (1998) Biotechnol Bioeng
60:216120. Lejeune R, Nielsen J, Baron GV (1995) Biotechnol Bioeng 47:609
Biomass Quantification by Image Analysis 181

8/8/2019 23689262 Bio Analysis and Bio Sensors for Bio Process Monitoring 66
http://slidepdf.com/reader/full/23689262-bio-analysis-and-bio-sensors-for-bio-process-monitoring-66 187/236
121. Lejeune R, Baron GV (1997) Biotechnol Bioeng 53:139122. King R (1998) Mathematical modelling of the morphology of Streptomyces species.Adv
Biochem Eng Biotechnol 60:95123. Paul GC, Thomas CR (1996) Biotechnol Bioeng 51: 558124. Tucker KG, Thomas CR (1992) Biotechnol Letters 14:1071
125. Tucker KG, Thomas CR (1994) Biotechnol Techniques 8:153126. Rossetti S, Christensson, Blackall LL, Tandol V (1997) J Appl Microbiol 82: 405127. Seviour EM, Blackall LL, Christensson C, Hugenholtz P, Cunningham MA, Bradford D,
Stratton HM, Seviour RJ (1997) J Appl Microbiol 82: 411128. Kieran PM, O’Donnel HJ,Malone DM,MacLoughlin PF (1995) Biotechnol Bioeng 45: 415129. Shimosaka M, Masui S, Togawa Y, Okazaki M (1991) J Ferment Bioeng 72:485130. O’Shea DG, Walsh PK (1996) Biotechnol Bioeng 51:679131. Shabtai Y, Ronen M, Mukmenev I, Guterman H (1996) Comp Chem Engng 20: S321132. Guterman H, Shabtai Y (1996) Biotechnol Bioeng 51:501133. Spohr A, Dam-Mikkelsen C, Carlsen M, Nielsen J (1998) Biotechnol Bioeng 58: 541134. Reponen TA, Gazenko SV, Grinshpun SA, Willeke K, Cole EC (1998) Appl Environ
Microbiol 64: 3807135. Mitchell AD, Walter M, Gaunt RE (1997) Biotechnol Techniques 11:801136. Paul GC, Kent CA, Thomas CR (1993) Biotechnol Bioeng 42:11137. Oh KB, Chen Y, Matsuoka H, Yamamoto A, Kurata H (1996) J Biotechnol 45: 71138. Reichl U, Buschulte TK, Gilles ED (1990) J Microsc 158:55139. Metz B, de Bruin EW, van Suijdam JC (1981) Biotechnol Bioeng 23:149140. van Suijdam JC, Metz B (1991) Biotechnol Bioeng 23:111141. Adams HL, Thomas CR (1988) Biotechnol Bioeng 32: 707142. Packer HL, Thomas CR (1990) Biotechnol Bioeng 35: 870143. Thomas C, Packer H (1990) Binary 2:47144. Daniel O, Schönholzer F, Zeyer J (1995) Appl Environ Microbiol 61: 3910
145. Walsby AE, Avery A (1996) J Microbiol Methods 26:11146. Hitchcock D, Glasbey CA, Ritz K (1996) Biotechnol Techniques 10 :205147. McIntyre M, Berry DR, Eade JK, Cox PW, Thomas CR, McNeil B (1998) Biotechnol
Techniques 12:671148. Cox PW, Thomas CR (1992) Biotechnol Bioeng 39: 945149. Pichon DR, Vivier HL, Pons MN (1992) Acta Stereol 11: 243150. Yang YK, Morikawa M, Shimizu H, Shioya S, Suga KI, Nihira T, Yamada Y (1996) J
Ferment Bioeng 81: 7151. Maazi A, Pons MN, Vivier H, Latrille E, Corrieu G, Cosson T (1998) 2nd Eur Symp
Biochem Eng Science, Porto152. Matsumura M, Imanaka T, Yoshida T, Taguchi H (1980) J Ferment Technol 58, 197153. Drouin JF, Louvel L, Vanhoutte B, Vivier H, Pons MN, Germain P (1997) Biotechnol
Techniques 11:819154. Pons MN, Drouin JF, Louvel L,Vanhoutte B,Vivier H, Germain P (1998) J Biotechnol 65: 3155. Packer HL, Keshawarz-Moore E, Lilly MD, Thomas CR (1992) Biotechnol Bioeng 39:384156. Reichl U, Yang H, Gilles ED (1990) FEMS Microbiol Lett 67:207157. Meijer BC, Kootstra GJ,Wilkinson MHF (1990) Binary 2: 21158. Meijer BC, Wilkinson MHF (1998) Optimized population statistics derived from
morphometry In: Wilkinson MHF, Schut F (eds) Digital Image Analysis of Microbes.Wiley, New York, p 225
159. Uozomi N, Yoshino T, Shiotani S, Suehara KI, Arai F, Fukuda T, Kobayashi T (1993) JFerment Bioeng 76: 505
160. Amaral AL, Baptiste C, Pons MN, Nicolau A, Lima N, Ferreira EC, Mota M, Vivier H(1999) Biotechnol Techniques 13:111
161. Lillie RD, JJ (1997) Conn’s Biological Stains, 9th edn.Williams & Wilkins, Baltimore162. Feulgen R, Rossenbeck H (1924) Z Physiol Chem 135:203163. Feulgen R, Voit K (1924) Z Physiol Chem 135: 249164. Nicolini C, Kendall F (1982) Acta Med Pol 23:155–181
182 M.-N. Pons · H.Vivier

8/8/2019 23689262 Bio Analysis and Bio Sensors for Bio Process Monitoring 66
http://slidepdf.com/reader/full/23689262-bio-analysis-and-bio-sensors-for-bio-process-monitoring-66 188/236
165. Yeast Group of EBC (1962) J Inst Brewing 68:14166. Pons MN, Vivier H (1998) Morphometry of yeast. In: Wilkinson MHF, Schut F (eds)
Digital Image Analysis of Microbes. Wiley, New York, p 199167. Tucker KG, Chalder S, Al-Rubeai, CR Thomas (1994) Enz Microb Technol 16:29168. Paul GC, Kent CA, Thomas CR (1994) Biotechnol Bioeng 44:655
169. Vanhoutte B, Pons MN, Thomas CR, Louvel L, Vivier H (1995) Biotechnol Bioeng 48:1170. Tanaka H, Mizuguchi T, Ueda K (1975) Hakko Kogaku Zasshi 53: 35171. Whiteley AS, Grewal R, Hunt A, Barer MR (1998) Determining biochemical and physio-
logical phenotypes of bacteria by cytological assays In: Wilkinson MHF, Schut F (eds)Digital Image Analysis of Microbes. Wiley, New York, p 281
172. Raynal L, Barnwell P, Gervais P (1994) J Biotechnol 36:121173. Nikolai TJ, Peshwa MV, Goetghebeur S, Hu WS (191) Cytechnol 5:141174. Kaneshiro ES, Wyder MA,Wu YP, Cushion MT (1993) J Microbiol Methods 17 :1175. Wirtanen G, Nissinen V, Tikkanen L, Mattila-Sandholm T (1995) Int J Food Sci Technol
30:523176. Wirtanen G, Ahola H, Mattila-Sandholm T (1995) Trans Int. Chem. Engineers 73 (part
C):9177. Sjoberg AM, Wirtanen G, Mattila-Sandholm T (1995) Trans Int. Chem. Engineers 73(part C) 17
178. Coleman, AW, Maguire, MJ, Coleman, JR (1981) J Histochem Cytochem 29: 959179. Davies CM (1991) Letters Appl Microbiol 13: 58180. Mauss P, Drouin JF, Pons MN, Vivier H, Germain P, Louvel L, Vanhoutte B (1997)
Biotechnol Techniques, 11, 813181. Williams SC, Hong Y, Danawal DCA, Howard-Jones MH, Gibson D, Frischer ME, Verity
PG (1998) J Microbiol Methods 32:225182. Kogure K, Simidu U, Taga N (1979) Can J Microbiol 25: 415183. Singh A, Pyle BH, McFeters GA (1989) J Microbiol Methods 10: 91
184. Barcina I, Arana I, Santorini P, Iriberri J, Egea L (1995) J Microbiol Methods 22:139185. Billon CMP, McKirgan CJ, McClure PJ, Adair C (1997) J Appl Microbiol 82: 48186. Jones CL, Lonergan GT, Mainwaring DE (1992) Biotechnol Techniques 6: 417187. Brandis JW, Ditullio DF, Lee JF, Armiger WB (1989) Process controlled temperature in-
duction during batch fermentations for recombinant DNA products. In: Computer ap-plications in fermentation technology. Elsevier, London, p 235
188. Srinivas G, John Vennison S, Sudha SN, Balasubramanian P, Vaithilingam Sekar (1997)Appl Environ Microbiol 63:2792
189. Binnerup SJ, Højberg O, Sørensen J (1998) J Microbiol Methods 31:185190. Slavik J (1998) Single and multispectral parameter fluorescence microscopy. In:
Wilkinson MHF, Schut F (eds) Digital Image Analysis of Microbes. Wiley, New York,p 281
191. Lawrence JR, Neu TR, Swerbone GDW (1998) J Microbiol Methods 32: 253192. Slavik J (1998) Microspectrofluorometry: measuring ion concentrations in living
microbes In: Wilkinson MHF, Schut F (eds) Digital Image Analysis of Microbes. Wiley,New York, p 309
193. Tsien, RY (1988) Fluorescent indicators of ion concentrations. In: Taylor DL, Wang YlL(eds) Fluorescence Microscopy of Living Cells in Culture, part B. Academic Press, SanDiego, p 127
194. Imai T, Ohno T (1995) J Biotechnol 38:165195. Grynkiewicz C, Poenie M, Tsien RY (1985) J Biol Chem 260:3440196. Kawai S, Yoshizawa Y, Mizutani J (1993) Biosci Biotechn Biochem 57:1115197. Kawaii S, Yoshizawa Y, Mizutani J (1994) Biosci Biotech Biochem 58: 982198. Tsunoda Y, Yodozawa S, Tashiro Y (1988) FEBS Lett 231: 29199. Haralick RM (1978) Statistical and structural approaches to texture. Proc 4th Int Joint
Conf Patt Recog, Kyoto, p 45200. Pons MN, Mona H, Drouin JF, Vivier H (1995) Texture characterization of colonies on
solid substrate. Proc CAB6, Garmisch-Partenkirchen, Elsevier, p 189
Biomass Quantification by Image Analysis 183

8/8/2019 23689262 Bio Analysis and Bio Sensors for Bio Process Monitoring 66
http://slidepdf.com/reader/full/23689262-bio-analysis-and-bio-sensors-for-bio-process-monitoring-66 189/236
201. Tsuchido T, Takeuchi H, Kawahara H, Obata H (1994) J Ferment Bioeng 78:185202. Berg HC (1971) Rev Sci Instrumm 42:868203. Berg HC, Brown DA (1972) Nature 239: 500204. Frymier PD, Ford RM (1997) AIChE J 43:1341205. Biondi SA, Quinn JA, Goldfine H (1998) AIChE J 44:1923
206. Cercignani G, Lucia S, Petracchi D (1998) Motility, chemotaxis and phototaxis measure-ments by image analysis. In: Wilkinson MHF, Schut F (eds) Digital Image Analysis of Microbes. Wiley, New York, p 343
207. Gerin P, Bellon-Fontaine MN, Asther M, Rouxhet PG (1995) Biotechnol Bioeng 47:677208. Baillieul M, Scheunders P (1998) Wat Res 32:1027209. Walther I, Bechler B, Müller O, Hunzinger E, Cogoli A (1996) J Biotechnol 113210. Pinheiro R, Belo I, Mota M (1997) Biotechnol Lett 19 :703211. Prenosil JE,Villeneuve PE (1998) Biotechnol Bioeng 59: 679212. Tai HC, Buettner HM (1998) Biotechnology 14 :364213. Hollister SJ, Kikuchi N (1994) Biotechnol Bioeng 43: 586214. Carver SE, Heath CA (1998) Biotechnol Bioeng 62:167
215. Bhatia SN, Balis UJ, Yarmush ML, Toner M (1998) Biotechnol Prog 514: 378216. Joos S, Fink TM, Rätsch A, Lichter P (1994) J Biotechnol 35:135217. Ramm P (1994) J Neurosci Methods 54:131218. Tanke HJ, Florijn RJ,Wiegant J, Raap AK, Vrolijk J (1995) Histochem J 27: 4219. Pukall R, Brambilla E, Stackebrandt E (1998) J Microbiol Methods 32: 55
184 M.-N. Pons · H.Vivier

8/8/2019 23689262 Bio Analysis and Bio Sensors for Bio Process Monitoring 66
http://slidepdf.com/reader/full/23689262-bio-analysis-and-bio-sensors-for-bio-process-monitoring-66 190/236
Advances in Biochemical Engineering/Biotechnology,Vol. 66Managing Editor: Th. Scheper© Springer-Verlag Berlin Heidelberg 1999
Monitoring the Physiological Status in Bioprocesseson the Cellular Level
K. Christian Schuster
Research Group Bioprocess Engineering, Institute of Chemical Engineering,Fuel and Environmental Technology,Vienna University of Technology, Getreidemarkt 9/159,A-1060 Vienna, Austria. E-mail: [email protected]
The trend in bioprocess monitoring and control is towards strategies which are based on thephysiological status of the organism in the bioprocess. This requires that the measuredprocess variables should be biologically meaningful in order to apply them in physiologically
based control strategies. The on-line monitoring equipment available today mostly derivesinformation on the physiological status indirectly, from external variables outside the cells.The complementary approach reviewed here is to analyse the microbial cells directly, in orderto obtain information on the internal variables inside the cells. This overview covers methodsfor analysis of whole cells (as a population or as a single cell), for groups of cellular com-ponents, and for specific compounds which serve as markers for a certain physiologicalstatus. Physico-chemical separation methods (chromatography, electrophoresis) and reactiveanalysis can be used to analyse elemental and macromolecular composition of cells.Spectroscopic methods (mass, dielectric, nuclear magnetic, infrared, and Raman) have only recently been applied to such complex multicomponent mixtures such as microbial cells.Spectroscopy and chemical separation methods produce large amounts of data, which canoften be used in the best way by applying chemometrics. Some of the methods can yieldinformation not just on the average of the microbial cell population, but also on the distribu-tion of sub-populations. The suitability of the methods for on-line coupling to the bioprocessis discussed. Others not suitable for on-line coupling can be established in routine off-lineanalysis procedures. The information gained by the methods discussed can mainly be used toestablish better knowledge of the basis for monitoring and control strategies. Some are alsoapplicable in real-time monitoring and control.
Keywords. Macromolecular compounds, Marker molecules, Chemical patterns, Infraredspectroscopy, Raman spectroscopy
1 Introduction – The Approach to Obtain Physiological StatusInformation on the Cellular Level . . . . . . . . . . . . . . . . . . . . 186
2 Morphology . . . . . . . . . . . . . . . . . . . . . . . . . . . . . . . . . 189
3 Biomass Elemental Composition . . . . . . . . . . . . . . . . . . . . . 191
4 Chemical Analysis of (Macro-) Molecular Components (Protein,Carbohydrate, Lipid, Nucleic Acids) . . . . . . . . . . . . . . . . . . . 191
5 Intracellular Key Metabolites (ATP/ADP, NADH, cAMP,Inorganic Phosphate) . . . . . . . . . . . . . . . . . . . . . . . . . . . 192
6 Electrical Properties: “Dielectric Spectroscopy” . . . . . . . . . . . . 193

8/8/2019 23689262 Bio Analysis and Bio Sensors for Bio Process Monitoring 66
http://slidepdf.com/reader/full/23689262-bio-analysis-and-bio-sensors-for-bio-process-monitoring-66 191/236

8/8/2019 23689262 Bio Analysis and Bio Sensors for Bio Process Monitoring 66
http://slidepdf.com/reader/full/23689262-bio-analysis-and-bio-sensors-for-bio-process-monitoring-66 192/236

8/8/2019 23689262 Bio Analysis and Bio Sensors for Bio Process Monitoring 66
http://slidepdf.com/reader/full/23689262-bio-analysis-and-bio-sensors-for-bio-process-monitoring-66 193/236
188 K.C. Schuster
Table 1. Approaches to physiological status monitoring on the cellular level, overview
* Not reviewed in detail in this chapter. For image analysis, see the chapter by M.N. Pons inthis volume. For some more details and references, see the paragraph in the chapter by Sonnleitner, this volume, and [4].
Table 2. Information content on sub-populations of the approaches to physiological statusmonitoring on the cellular level
Detailed, specific Some information can be extracted Generally no information oninformation on from spectra or patterns sub-populationssub-populations
Microscopy and Infrared Spectroscopy Macromolecular composition
Image Analysis by specific analysisFlow Cytometry Pyrolysis Mass Spectroscopy Enzyme activities by specific
analysis or mRNA blotNMR spectroscopy Stress markers by electrophoresis
or mRNA blot
Raman (Micro-) Dielectric Spectroscopy Small key metabolitesSpectroscopy
Lipid pattern by GC Elemental composition by specificanalysis
Protein pattern by NADH by fluorescence
ElectrophoresisSpecial cases of enzyme activities(by specific analysis or mRNA blot)Some stress markers (by electro-phoresis or mRNA blot)

8/8/2019 23689262 Bio Analysis and Bio Sensors for Bio Process Monitoring 66
http://slidepdf.com/reader/full/23689262-bio-analysis-and-bio-sensors-for-bio-process-monitoring-66 194/236
obtain qualitative information on the status of a microbial culture. Chemical
analysis of the biomass for its elemental and macromolecular composition is auseful tool for process development, but can also provide information forprocess monitoring. Intracellular key metabolites can serve as general or very specific markers for certain physiological states. The electrical properties of thecells can not just be used for biomass quantification, but also for qualitative in-formation. Macromolecules involved in biosynthetic pathways and signallingcan serve as specific markers for physiological events.
The methods yielding chemical patterns of whole cells or of certain molecu-lar component groups were originally developed for identification of organismsor for studying mixed populations, and have only rather recently started being
used to monitor changes within a culture of a single organism during a processrun.
The suitability of the mentioned methods for on-line monitoring will also bediscussed. For an overview see Table 3.With some, it is straight forward and hasbeen done, others have been used off-line but are feasible on-line. With othersthe effort to go on-line may be too high for the results obtained, although withflow injection systems or laboratory robots nearly anything is feasible in prin-ciple.
2Morphology
Observing the morphology is one of the oldest methods of monitoring thephysiological status of a cellular culture qualitatively and can often give valu-
Monitoring the Physiological Status in Bioprocesses on the Cellular Level 189
Table 3. Suitability for on-line monitoring of the approaches to physiological status monito-ring on the cellular level
In situ Ex-situ, with interfaces for Difficult, complex automated set-upsautomatic sampling, similar necessary, possible with FIA and/or
to on-line chromatography laboratory robots
Microscopy and Microscopy and Image Macromolecular composition by Image Analysis Analysis specific analysis
NMR spectroscopy Elemental composition by Protein pattern by Electrophoresisspecific analysis
Dielectric Flow Cytometry Enzyme activities by specific analysisSpectroscopy or mRNA blot
NADH by fluo- Raman (Micro-) Spectroscopy Stress markers by electrophoresisrescence or mRNA blot
Infrared Spectroscopy Small key metabolitesPyrolysis Mass Spectroscopy NMR spectroscopy Lipid pattern by GCSome Small key metabolitesSome enzyme activities

8/8/2019 23689262 Bio Analysis and Bio Sensors for Bio Process Monitoring 66
http://slidepdf.com/reader/full/23689262-bio-analysis-and-bio-sensors-for-bio-process-monitoring-66 195/236
able global and single-cell information on the state of an organism. This isespecially true for fungal and higher organism cell cultures, and most applica-tions of systematic morphology monitoring deal with these. For example, in aprevious volume of this series [3] on the relationship between morphology and
process performance, five out of six chapters dealt with filamentous organismsand only one with single-cell organism cultures (bacteria, yeasts, and animalcells) [6]. However, many yeasts and bacteria also display distinct morpho-logical changes which can be related to physiological events, especially thegroups of the budding yeasts, and the bacteria groups of Actinomycetes, theCoryneformes, (for examples see [7], the Lactobacilli [6] and the sporulatinggenera Bacillus and Clostridium. For example,with solventogenic Clostridia, theshift of metabolic pathways between solvent and acid production is closely related to morphological changes [8, 9, 10]. Distortions of morphology inotherwise rod-shaped bacteria can be an indication for trace element limi-
tations [11].However, the morphological information is often neglected; this is partly due
to the subjectivity of microscopic observation and the difficulty to quantify theinformation. The approach to overcome this problem is the use of automatedcomputer-based image analysis of micro-images (see the chapter on imageanalysis in this issue).
Light microscopic studies of bacteria work at the edge of the theoreticalresolution of this method, so many morphological features cannot be detectedclearly. Additional insight in morphological features especially of bacteria can
190 K.C. Schuster
Fig. 1. Electron micrograph of cells from a continuous culture of a solventrogenic Clostridium(ultrathin section). In the light microscope, the cells look more or less rod-shaped withslightly different sizes, whereas under the electron microscope, additional features are detec-ted: Examples for starting spore formation are marked with black arrows (Æ). Examples forstorage carbohydrate granules (bright round spots) are marked with double arrows (fi).Remark: Circular-looking shapes of cells are cross-sections of rods perpendicular to the longaxis of the rod [12]

8/8/2019 23689262 Bio Analysis and Bio Sensors for Bio Process Monitoring 66
http://slidepdf.com/reader/full/23689262-bio-analysis-and-bio-sensors-for-bio-process-monitoring-66 196/236

8/8/2019 23689262 Bio Analysis and Bio Sensors for Bio Process Monitoring 66
http://slidepdf.com/reader/full/23689262-bio-analysis-and-bio-sensors-for-bio-process-monitoring-66 197/236
An alternative, at least semi-quantitative method to follow changes in bio-mass composition is infrared (IR) spectroscopy [22]. From dried samples of microbial cells, IR spectra can be obtained which contain information on allmajor cell components. The spectra are analysed as a multi-component mix-ture: Characteristic bands in the spectra are identified, the extinction coef-ficients for each component (protein, carbohydrate, lipid, and nucleic acids) ateach band are determined, and the concentrations are calculated by a system of linear equations. The method gives results on all major cell components simul-taneously, and is relatively quick and easy to perform, compared to the chemi-
cal analysis methods. For details see Sect. 8.4 below.
5Intracellular Key Metabolites (ATP/ADP, NADH, cAMP,Inorganic Phosphate)
The most generally interesting intracellular metabolites are the adeninenucleotide phosphates (ATP/ADP/AMP) and the nicotinic acid/adeninedinucleotide phosphates (NAD(P)H/NAD(P)). The pool concentrations and
ratios of these can serve as markers for the physiological status of a culture.ATP, or exactly the specific ATP concentration, and the ratios to ADP andAMP in the biomass, indicate the energy content (or energy charge) of the cells.Estimation of the fairly low pools of the adenine nucleotides can be achieved by bioluminiscence methods ([30] by Kimmich et al.); automated to a flow analy-
192 K.C. Schuster
Table 4. Some methods for analysis of cell component groups
Component Reference Remarks to Method
Carbohydrate Dubois et al. [25]
Free Amino Acids Stewart [26]
Lipids Henriksen et al. [19] gravimetry
RNA Benthin et al. [27]
DNA Herbert et al. [20]
Protein Henriksen et al. [19] Kjehldahl nitrogen analysis and subtractingother N-compounds
Bradford [28] Coomassie blue dye reaction
Lowry [29] Folin reagent colour reaction
All components Herbert [20] Review with many chemical (reactive)methods
Cooney [21] Review with many chemical (reactive)methods
Grube et al. [22] Simultaneously by infrared spectroscopy (see also Sect. 8.4) and comparison withchemical methods (with references)

8/8/2019 23689262 Bio Analysis and Bio Sensors for Bio Process Monitoring 66
http://slidepdf.com/reader/full/23689262-bio-analysis-and-bio-sensors-for-bio-process-monitoring-66 198/236

8/8/2019 23689262 Bio Analysis and Bio Sensors for Bio Process Monitoring 66
http://slidepdf.com/reader/full/23689262-bio-analysis-and-bio-sensors-for-bio-process-monitoring-66 199/236
[46]. For organisms with more complex morphology, e.g. filamentous bacteria,the interpretation of dielectric signals is difficult [47]. However, in principle themethod seems to hold more potential than has been exploited up to now, espe-cially when dielectric spectra are evaluated with advanced mathematical and
statistical methods (see also the chapter by A. Shaw and D. Kell in this volume).
7Marker Molecules for Physiological Events
Physiological events which are the basis of gradual or sudden changes in pro-duct formation of a culture can be followed by analysing the biosynthetic com-ponents of the pathways involved, or of signal molecules. Examples includeenzyme activities and molecules related to stress response, like heat shockproteins and other stress proteins.
7.1
Enzymes
The activities of intracellular enzymes give an indication of the activity of certain metabolic pathways. They are classically assayed by performing theirspecific reactions in vitro,using the conversion of natural or artificial substratesand often some additional detection reaction. The sample preparation pro-cedure involves cell harvesting and preparation of cell extracts. A well-studied
example is the metabolic shift in Clostridium acetobutylicum from acid tosolvent production, the so-called solvent shift. Andersch et al. [48] studied theactivities of 10 different enzymes involved in this shift, in batch cultivationswhere the shift is self-induced by the products formed, and under continuousculture conditions with an externally induced shift.
Difficulties with using enzyme activities as a physiological marker include:the general problem of comparing in vitro measured activities with the in vivosituation; the stability of enzymes under the conditions of cell extract prepara-tion,which has to be tested and optimised for each individual enzyme, e.g. [48];and the activity assay itself, which again has to be established for each enzyme.
Thus, it has to be stated that it is a tremendous amount of work to analyseseveral enzymes at regular time intervals, and therefore the approach is hardly suitable for routine monitoring of a bioprocess over extended periods of time.
The upcoming alternative to assess enzymatic activities is the detection of enzyme induction on the transcription level by assaying the correspondingmessenger RNA. To be precise, the assay of mRNA concentrations does not cor-respond directly to the enzyme activity, but to the rate of enzyme synthesis;however, a high rate of enzyme synthesis eventually leads to a high enzymeactivity, due to the intracellular protein turnover. So, the two estimation ap-
proaches cover different time scales. The typical kinetic pattern of mRNA con-centration for an induced enzyme shows a quick rise to a peak, followed by adrop to a steady-state level. For the above example of the solvent shift inClostridium, this was shown by Sauer and Dürre [49] and Girbal and Soucaille[50] by hybridisation of mRNA on electrophoresis gels with radioactively label-
194 K.C. Schuster

8/8/2019 23689262 Bio Analysis and Bio Sensors for Bio Process Monitoring 66
http://slidepdf.com/reader/full/23689262-bio-analysis-and-bio-sensors-for-bio-process-monitoring-66 200/236
led DNA probes against known enzyme gene sequences. (Instead of DNA pro-bes, also RNA probes can be used in a similar way).
The assay of enzyme induction at the mRNA level is much easier to performthan the chemical assay of each individual enzyme and the response to a phy-
siological event is intrinsically faster to detect. Moreover, mRNA is often morestable under cell extract preparation conditions than enzymes, if destruction by RNAses can be prevented. For analysing a number of different enzymes inparallel, only one sample preparation procedure is necessary, which produces acrude RNA extract, and only in the final step the different DNA or RNA probesare used for detection of specific enzyme RNAs. Recently, the detection of RNAis further facilitated by ready-to-use RNA isolation kits, non-radioactive DNAor RNA probes and the dot-blot and slot-blot techniques, respectively, [51, 52].
A certain limitation to the method is the fact that DNA or RNA probesagainst the genes involved have to be available for hybridisation. This implies
that only rather well-known organisms can be studied, for which the genesequences involved are known, or that the preparatory work to set up themethod has to identify suitable sequences from related organisms or pathways.
7.2
Stress Response Proteins and Other Marker Proteins
Various proteins have been identified as markers for general stress in micro-organisms or for specific stress like temperature, pH, toxic products, oxygen
deficiency for strict aerobes, or oxygen toxicity for anaerobes,etc.; most of themare rather small in size. Most work was done with E. coli (for a review see e.g.[53] and with B. subtilis [54]).
Classically, the stress proteins are assayed by two-dimensional electrophore-sis, with a separation according to molecular mass (in SDS) in one direction andisoelectric focusing in the other, and autoradiographic detection. An examplefor an application is the study of stress response and its relationship to a meta-bolic shift in Clostridium by Terraciano et al. [55] and Pich et al. [56]. Thistechnique is not applicable to bioprocess monitoring on a routine basis, as theanalysis by 2-dimensional electrophoresis is fairly laborious and needs high
skill, and moreover the autoradiographic detection requires feeding of radio-active substrates. However, for basic studies and identification of a few markerproteins which can afterwards be detected e.g. by antibody reactions, it is use-ful. A recent development in this field is the identification of proteins directly from the spot on the gel by N -terminal sequencing and comparison with knownsequences. In B. subtilis, this was shown [57]; and also in Clostridium forproteins involved in the solvent shift [58].
Recently, an easier,more applicable alternative was developed by Völker et al.[59], detecting the expression of “stress genes” by the messenger RNA pro-
duced. Schweder et al. [52,60] used this to monitor process-related stress inlarge scale bioreactors. Cells exposed to stress in certain zones of the reactorexpressed general and specific stress genes within a few seconds, and theelevated mRNA levels could be detected for a few minutes after the stress event,thus serving as a “historic” marker for past physiological events.
Monitoring the Physiological Status in Bioprocesses on the Cellular Level 195

8/8/2019 23689262 Bio Analysis and Bio Sensors for Bio Process Monitoring 66
http://slidepdf.com/reader/full/23689262-bio-analysis-and-bio-sensors-for-bio-process-monitoring-66 201/236
At the moment, the procedure takes about a day for the analysis of 8 stressgenes and an improved method is being developed. The approach is theDNA/RNA chip technology (T. Schweder, personal communication). For themethodical advantages and limitations, the considerations are similar as for
enzyme activity analysis via mRNA – see [51, 52, 60], and Sect. 7.1 (Enzymes)above.
8Chemical Patterns of Cellular Components or Whole Cells
Most of the following methods, yielding characteristic chemical patterns of cells, were originally developed for identification of organisms or for studyingmixed populations, and are as such well established in microbiology laborato-ries. For organism identification, care has to be taken to grow and harvest the
cells under certain, well-defined growth conditions, otherwise the patterns arenot comparable. Rather recently, this problem has in some cases been turnedinto an opportunity for monitoring the changes within a culture of a singleorganism during cultivation. As the patterns contain a large amount of data,evaluation may not be straight forward but may need chemometric methods forextracting the relevant information or for making correlations with thedescription of the physiological status by other process variables [61, 62] (seealso the chapter on chemometrics by Shaw and Kell in this volume). Alsobecause of this high information content, it is possible to extract quantitative
data on heterogeneity of cultures, provided that features can be identified inwhich the sub-populations differ clearly.In principle, most of these methods can be linked to a bioreactor on-line and
ex-situ, with interfaces for automatic sampling similar to those used for on-linechromatography (for interfaces, see the chapter by Sonnleitner in this volume).An exception is the analysis of protein patterns by electrophoresis, which is dif-ficult to perform automatically.
8.1
Lipid Pattern
The analysis of lipid or fatty acid patterns of organisms by gas chromatography is a common method in taxonomy [63]. The fatty acid pattern changes withgrowth conditions like growth rate and phase,aeration,pH value, medium com-position, etc., which is attributed to adaptations of the cell membrane. ForE. coli, the changes were studied by Arneborg et al. [64] and Pramanik andKeasling [65]. With thermophilic bacteria, the changes due to growth tem-perature are especially remarkable and connected with short-term and long-term temperature adaptation [66, 67], thus also serving as a “historic” marker
for conditions the organisms have experienced some time before the actualobservation.
196 K.C. Schuster

8/8/2019 23689262 Bio Analysis and Bio Sensors for Bio Process Monitoring 66
http://slidepdf.com/reader/full/23689262-bio-analysis-and-bio-sensors-for-bio-process-monitoring-66 202/236
Fig. 2a –c. Growth of Bacillus stearothermophilus PV72 in continuous culture on a syntheticmedium containing glucose (8 gl–1) as the sole carbon and energy source. The dissolvedoxygen concentration was controlled at 50% and the dilution rate was 0.3 h–1.As derived fromthe measured process variables, variant formation started at about 15– 16 h after inoculation.Shown are the measures for: a Respiration activity b External and internal reduction state(redox potential and culture fluorescence) c Cell density (Reprinted from: J. Biotechnol. 54,K.C. Schuster et al., p. 19, 1997, with permission from Elsevier Science)
b
c
a

8/8/2019 23689262 Bio Analysis and Bio Sensors for Bio Process Monitoring 66
http://slidepdf.com/reader/full/23689262-bio-analysis-and-bio-sensors-for-bio-process-monitoring-66 203/236
8.2
Protein Pattern
Protein patterns of whole cells by simple SDS-PAG-electrophoresis [68] havebeen used for a long time in strain identification. Such an analysis resolvessomething like 20 to 50 bands of protein groups in the order of their (apparent)molecular mass. Detailed analysis of a high number of cellular proteins isusually performed by two-dimensional electrophoresis (see Sect. 7.2 on stressresponse markers); e.g. for E. coli, this was done by Pedersen et al. [69]. As
mentioned above, the two-dimensional technique is not suitable for routinebioprocess monitoring.
For some organisms, however, the changes in protein composition by phy-siological events are strong enough to be detected in a simple one-dimensionalSDS-PAG-electrophoresis (e.g. with Clostridium acetobutylicum [55]). If thechanging protein bands are reasonably separated, the bands on the electro-phoresis gel can be evaluated by densitometry and be used as a semi-quanti-tative marker for the physiological status and for the kinetics of the changes.
An example is the reproducible formation of a strain variant in a thermo-
philic Bacillus [36, 70]. The variant was first detected by its altered surface layer(S-layer) protein, which differed from the wild type in molecular mass andcrystalline structure, as observed by electron microscopy. In continuous culti-vation, the event of variant formation was accompanied by a characteristic pat-tern of changes in several process variables (Fig. 2), and the kinetics of variantformation could be followed by quantified SDS-PAG electrophoresis (Fig. 3).
198 K.C. Schuster
Fig. 3. Monitoring of the variant formation in a continuous culture of Bacillus stearothermo- philus PV72 (as in Fig. 2) by SDS-PAGE. The organisms differed in the S- (surface) layerproteins. The wild type formed an S-layer protein of 130 kDa apparent molecular mass, thevariant S-layer protein appears at 97 kDa molecular mass. The wild-type S-layer protein wasquantified relative to the band of the altered protein by densitometry. Numbers on the curverepresent samples harvested at distinct points of time during variant formation. The decreaseof the wild-type S-layer protein followed the theoretical washout curve in a stirred tankreactor at the set dilution rate of 0.3 h–1 (Reprinted from: J.Biotechnol. 54, K.C. Schuster et al.,p. 20, 1997, with permission from Elsevier Science)

8/8/2019 23689262 Bio Analysis and Bio Sensors for Bio Process Monitoring 66
http://slidepdf.com/reader/full/23689262-bio-analysis-and-bio-sensors-for-bio-process-monitoring-66 204/236
Fig. 4a –d. Protein patterns by SDS-PAGE of whole cells of Clostridium beijerinckii in thecourse of a batch cultivation. The functions of the proteins changing in concentration are notyet known. However, the results in [58] suggest that dehydrogenases of the acid and solventproducing pathways are involved. For assessing the physiological status, it is sufficient to use
the quantified bands as markers. a Image of the electrophoresis gel, stained with Coomassieblue. The apparent molecular masses of the cell proteins changing in concentration are in-dicated at the left side of the gel, the marker proteins on the right side. Sampling times are asgiven in (c). b Densitogram of one lane (24 h cultivation time). c Three-dimensional re-presentations of the protein patters with changes over the batch cultivation time. Samplingtimes are indicated. d Quantification by relative peak areas of the proteins P130, P95 and P65against reference protein P40 (from [72])
a
b
c
d

8/8/2019 23689262 Bio Analysis and Bio Sensors for Bio Process Monitoring 66
http://slidepdf.com/reader/full/23689262-bio-analysis-and-bio-sensors-for-bio-process-monitoring-66 205/236
The method has been used for semi-quantitative monitoring of the changesin the protein patterns in Clostridium acetobutylicum [10]. Recently, it has beenfurther assessed for linearity and other analytical features and extended in ap-plication to discriminate between different physiological states (acid pro-
duction versus solvent production) in solventogenic Clostridia [71, 72]) (Fig. 4).The method yields results within a few hours after sampling requiring only moderate handling time, especially when commercial ready-to-use gels areapplied, so at least with slowly proceeding processes it can be used for controldecisions on a cell physiological basis, e.g. in long-term continuous cultivations.
8.3
Chemical Pattern by Pyrolysis Mass Spectrometry
The method of pyrolysis mass spectrometry is being applied in microbiology
for organism classification and identification (for a review see [61]) (Figs. 5and 6). Recently there are reports on monitoring changes in cultures of aStreptomyces [73], observing variations in mass spectra with growth stage andmorphological differentiation. Changes in some specific intracellular sub-stances during cultivation could also be detected, e. g. small molecules likeindole [74] or a recombinant protein [75].
The method is very powerful in terms of selectivity and sensitivity. The only PyMS instrument presently available commercially is the RAPyD-400 by Horizon Instruments (Horizon Instruments Ltd., Heathfield, Sussex, UK) [76].
A certain obstacle to a widespread application is the high equipment cost.
200 K.C. Schuster
Fig. 5. Flow diagram of the main steps in pyrolysis mass spectrometry (from [76])

8/8/2019 23689262 Bio Analysis and Bio Sensors for Bio Process Monitoring 66
http://slidepdf.com/reader/full/23689262-bio-analysis-and-bio-sensors-for-bio-process-monitoring-66 206/236
Spectra are very complex, and the instruments show a drift over longer times[61]. Both problems can be accounted for by data evaluation, but requiresophisticated mathematical methods like supervised learning of neural net-works. For a comprehensive overview and more detail, see the chapter by Shaw
and Kell, this volume.
8.4
Chemical Pattern by Infrared (IR-)Spectroscopy
Reports on a chemical analysis of microorganisms by infrared spectroscopy,including ideas to use it for identification,go back to the 1950s, e.g. [77].Due tothe poor reproducibility between instruments and problems with evaluatingcomplex spectra, not much development followed these early works for a
long time.A group in Latvia and Russia [78] analysed microbial cell mass by a fairly simple classical infrared spectroscopic method, recording spectra of driedbiomass embedded in potassium bromide pellets with a dispersive IR spectro-meter. They could calibrate the evaluation for four major groups of cellular
Monitoring the Physiological Status in Bioprocesses on the Cellular Level 201
Fig. 6. Pyrolysis mass spectra of two organisms (Staphylococcus aureus and E.coli). The data
from PyMS may be displayed as quantitative pyrolysis mass spectra. The abscissa representsthe m/z (mass to electric charge) ratio whilst the ordinate contains information on the ioncount for any particular m/z value ranging from 51– 200. Below 51 m/z , there is no biologi-cally relevant information in the spectra (from [76])

8/8/2019 23689262 Bio Analysis and Bio Sensors for Bio Process Monitoring 66
http://slidepdf.com/reader/full/23689262-bio-analysis-and-bio-sensors-for-bio-process-monitoring-66 207/236
compounds (protein, carbohydrate, lipid, and nucleic acids) using the absorp-tion coefficients of these compounds at four different characteristic wave-lengths of the spectrum and a system of four linear equations. Savenkova et al.[79] (1994) expanded this method for quantitative analysis of polyhydroxybu-
tyrate in Azotobacter cells. Grube et al. [22] reported the quantitative analysis of biomass of the fungus Thielavia terrestris, comparing results of chemical andinfrared analysis and showing different composition at two growth phases(exponential growth and stationary phase) as well as in two morphologicalstates (diffuse and pellet form).
A great improvement towards a wide applicability of IR spectroscopy came from the introduction of moderately priced Fourier transform (FT-) IRspectrometers, and multivariate statistical data evaluation on personalcomputers. The analysis of whole cells by FTIR spectroscopy for identificationand classification of bacteria, introduced by Naumann [80], is meanwhile well
established in microbiology, with spectrometers available for this purpose.Spectra in the mid-IR range from about 3500 to 500 cm–1 are recorded intransmission technique from films of biomass dried on a zinc selenidesample carrier. Some components and structures in cells can be clearly identified qualitatively from spectra, like spores, polyhydroxybutyrate,and large amounts of carbohydrate [81]. It was sometimes mentioned in theliterature that spectra of a certain organism change due to growth conditions[81, 82]. For monitoring physiological changes in a cultivation by the cellcomposition, the technique was used by Schuster et al. [83] during
Clostridium beijerinckii batch and fed-batch cultures, Fig. 7. The physio-logical state of the organism, characterised by the formation of differentproducts, corresponded to different clusters of similar cell compositionrevealed by multivariate evaluation of IR spectra. Moreover, the growingphase is clearly characterised by strong bands of nucleic acids, whereasthe states at high concentrations of toxic products are connected with a highlipid content in the cells, probably reflecting a response to stress on the cellmembrane [83, 84].
The technique is easy and fast to use, involving only cell harvesting,washing and drying of the biomass on an IR-transparent carrier as sample
preparation, before the spectra are recorded and evaluated. An instrumentdedicated for organism identification is available and has been used forthe cited process monitoring experiments with complete spectrometerhardware and software, model IFS 28/B from Bruker (Milton, ON, Canada;or Bruker Optik, Karlsruhe, Germany). The whole procedure takes less thanan hour.
A different method of recording FTIR spectra of microbial biomass is the dif-fuse reflectance-absorbance technique [62]. To my knowledge, this has not yetbeen used to monitor biomass properties in bioprocesses but for related pur-
poses such as screening for overproducing mutants (for more detail see thechapter by Shaw and Kell in this volume).
202 K.C. Schuster

8/8/2019 23689262 Bio Analysis and Bio Sensors for Bio Process Monitoring 66
http://slidepdf.com/reader/full/23689262-bio-analysis-and-bio-sensors-for-bio-process-monitoring-66 208/236
Monitoring the Physiological Status in Bioprocesses on the Cellular Level 203
Fig. 7. Analysis of bacterial biomass by FTIR spectroscopy. Samples of Clostridium beijerinckiibiomass were taken from different phases of batch cultivations. Sample numbering is according
to the degree of differentiation visible in the light microscope: Sample 1 is least differentiated,sample 4 most differentiated. Samples 1 and 2 are from the acidogenic and early solventogenicphase, samples 3 and 4 are from the middle and late solventogenic phase. Sample 4 S is a flocku-lating fraction of sample 4, with cells sticking together by a slime. Inserted images: Light micro-graphs from the growth phases of Clostridium beijerinckii. Bright field mode, iodine stain, vi-deo images. Dark stained spots are from storage polysaccharide (granulose). Bars 5 mm. Top:FT-Infrared spectra of Clostridium beijerinckii biomass in different phases of batch cultivations.The main differences between the spectra are in the carbohydrate (1076 cm–1), the nucleic acid(around 1250 cm–1), and the lipid region (around 2900 cm–1). Spectra were normalised to theprotein band (Amid I). Bottom: Statistical similarities of the biomass spectra according to ahierarchical cluster analysis (Calculation of the distance matrix with “scaling to 1st range” al-
gorithm, frequency range 1800– 700 cm–1). Identical numbers represent individual prepara-tions of the same biomass sample. Each sample was prepared several times to assess the varia-tion in the method. It can be seen that the parallel preparations of one sample are always moresimilar to each other than to different samples. Correlating with the physiological states, sam-ples from the early states in the cultivation (acidogenic and early solventogenic) form onecluster, and the samples from late stages form another. (Modified from: Vibrational Spec-troscopy vol. 19, K.C. Schuster et al., 1999, p. 471–2, with permission from Elsevier Science.)

8/8/2019 23689262 Bio Analysis and Bio Sensors for Bio Process Monitoring 66
http://slidepdf.com/reader/full/23689262-bio-analysis-and-bio-sensors-for-bio-process-monitoring-66 209/236
8.5
Chemical Pattern on the Single Cell Level by Confocal Raman Microscopy
From the results of chemical analysis and infrared spectroscopy it can be seen
that the chemical composition of microbial cells may vary greatly over theduration of a process run.However, these methods are limited to the bulk of thepopulation. Single-cell studies with IR spectroscopy are only possible down toa size of about 10 mm, as the resolution is limited by the wavelength of the lightapplied. So, IR microscopy is limited to the large cells of higher organisms.
The complementary method to gain chemical information from molecular vi-brations is Raman spectroscopy. This technique works by exciting vibrations by means of light, and detecting the inelastically scattered light at slightly lower fre-quencies.As excitation light sources, laser beams in the visible or near – infraredrange are used, thus the beam can be focused e.g. through the optical set-up of a
microscope,and the detection of the scattered light can be limited to the focus by pinholes (confocal technique). By this technique, single living cells of higherorganisms have been studied [85] and strains of bacteria have been identifieddirectly from colonies on solid culture media [86], or using samples of a few cellsfrom colonies by surface-enhanced Raman spectroscopy (SERS) [87].
Lately, spectra of single cells of Clostridium beijerinckii have been obtained(Fig. 8) [88, 89]. The aim was to monitor the population distribution in a sol-
204 K.C. Schuster
Fig. 8. Raman spectrum of a single cell of Clostridium beijeinckii, of a size of about 2¥4 mm.Peaks are marked with the wavenumber of the Raman shift, and tentative attributions of thebands are given. Insert : Video image showing a C. beijerinckii cell in the focused laser beamof the Raman microscope. The diameter of the laser focus, which determines the samplingvolume by the excitation of the Raman effect, is about the same size as the cell. (from [89])

8/8/2019 23689262 Bio Analysis and Bio Sensors for Bio Process Monitoring 66
http://slidepdf.com/reader/full/23689262-bio-analysis-and-bio-sensors-for-bio-process-monitoring-66 210/236
vent-producing culture. Cell suspensions were dried on various glass-likesurfaces. Raman spectra of single cells were obtained using a confocal Ramanmicroscope (Dilor, France). The laser beam was focused on individual cellsthrough the microscope objective (100¥ magnification), obtaining a spatial
resolution of less than 2 mm in the horizontal plain. Raman spectra of singlecells with good signal/noise ratio could be recorded with excitation in thevisible range and using a calcium fluoride carrier. Cells of different morphology and cell samples from different development stages showed different spectra.These first results show that it is possible to study the chemical composition of single bacterial cells in the size of about 1 mm by confocal Raman spectroscopy.This can be used e.g. to study the heterogeneity in a microbial population.
9Conclusions and Outlook
During the last decade, a wide range of approaches to gain information aboutthe physiological status of a culture on the cellular level has been developed, andmethods from other fields like microbial identification have been applied forthis purpose. Especially the spectroscopic methods, yielding multidimensionaldata on the chemical composition of microbial cells, are only at the beginningof being exploited and have a bright prospect. The link with chemometrics willsignificantly improve the information yield.
It is expected that the systematic application of the discussed methods to
bioprocesses will bring deeper understanding of the physiological events in theprocesses, and of the distinct phases that an organism experiences during aprocess, from inoculum preparation to final product recovery. Studies of cultureinhomogeneity and dynamics of sub-populations in monoseptic cultures (by flow cytometry, image analysis, and some of the methods discussed here)should further improve our view of the cellular processes. Integration of thephysiological information on the cellular level with non-invasive monitoringcan lead to more efficient bioprocess control.
Acknowledgement. The author’s work on infrared and Raman spectroscopy shown here was supported by the companies Bruker Optik (Karlsruhe,Germany, contact: Dr. Frank Mertens) and Dilor (Bensheim, Germany, contact:Dr. Eva Urlaub). Thanks are due to Doug Hopcroft, Hort Research New Zealand(Palmerston North, New Zealand) for preparing the specimen for the electronmicrograph in Fig. 1. The author also acknowledges Florentina Dana’s help withfinalising the reference list for the manuscript.
References
1. Konstantinov KB (1996) Biotechnol Bioeng 52: 2712. Fiechter A, Sonnleitner B (1994) Adv Microbial Physiology 36 :1453. Schügerl K (vol ed) (1998) Relation between morphology and process performance.
Advances in Biochemical Engineering, Biotechnology, vol. 60 (series ed. T. Scheper)Springer, Berlin Heidelberg New York
Monitoring the Physiological Status in Bioprocesses on the Cellular Level 205

8/8/2019 23689262 Bio Analysis and Bio Sensors for Bio Process Monitoring 66
http://slidepdf.com/reader/full/23689262-bio-analysis-and-bio-sensors-for-bio-process-monitoring-66 211/236
4. Shapiro HM. (1995) Practical flow cytometry, 3rd edn. Wiley-Liss, New York5. Shapiro H, Srienc F (vol ed) (1999) J Microbiol Methods, special issue with con-
tributions of the Int. Conference on Analysis of microbial cells on the single-cell level,Como, Italy, March 1999 (in preparation)
6. Pons MN, Vivier H (1998) Beyond filamentous species. In: Schügerl K (vol ed) Relation
between morphology and process performance, Advances in Biochemical Engineering,Biotechnology, vol 60 (series ed. T. Scheper) Springer, Berlin Heidelberg New York, p 61
7. Schlegel HG (1992) Allgemeine Mikrobiologie. 7th edn. Georg Thieme Verlag, Stuttgart,for examples see pp 100–110
8. Jones DT, Woods DR (1986) Microbiol Rev 50: 4849. Dürre P, Bahl H (1996) Microbial production ofacetone/butanol/isopropanol. In: Rehm
H-J, Reed G (eds) Biotechnology – a multi-volume comprehensive treatise, vol 6b, VerlagChemie, Weinhein
10. Schuster KC, van den Heuvel R, Gutierrez NA, Maddox IS (1998) Appl MicrobiolBiotechnol 49 :669
11. Schuster KC (1994). Ph. D.Thesis, Vienna University of Technology, Vienna, Austria, p 73
12. Schuster KC (1995) unpublished electron micrograph13. Mandalam RK, Palsson BO (1998) Biotechnol Bioeng 59:60514. Rho D, Andre G (1991) Biotechnol and Bioeng 38: 57915. Gurakan T, Marison I, Stockar U, Gustafsson L, Gnaiger E (1990) Thermochimica Acta
172:25116. Ames BN (1965) Assay of inorganic phosphate, total phosphate and phosphates. In:
Neufeld EF, Ginsburg V (eds) Methods in Enzymology 8, Academic Press, New York, p 11517. Kamnev AA, Renou-Gonnord MF, Antonyuk LP, Colina M, Chernyshev AV, Frolov I,
Ignatov VV (1997) Biochem Mol Biol Int 41:12318. Fontes AG, Moreno J, Vargas MA (1998) Biotechnol Bioeng 34:81919. Henriksen CM, Christensen LH, Nielsen J, Villadsen J (1996) J Biotechnol 45:149
20. Herbert D, Phipps PJ, Strange RE (1971) Chemical analysis of microbial cells. In:Norris JR, Ribbons DW (eds) Methods in Microbiology 5B,Academic Press, London, UK,p 209
21. Cooney CL (1981) Growth of microorganisms. In: Rehm H-J, Reed G (eds) Biotechnology – a multi-volume comprehensive treatise, vol 1,Verlag Chemie, Weinhein, p 73
22. Grube M, Zagreba J, Gromozova E, M. Fomina M (1999) Vibrational Spectroscopy 19:30123. Bley T, Ackerman J-U, Muller S, Loesche A, Babel W (1995) J Biotechnol 39: 924. Sonnleitner B (1993) Experimental verification of rapid dynamics in biotechnological
processes. In: Mortensen U, Noorman H (eds) Bioreactor Performance, Biotechnology Research Foundation, Lund, Sweden, p 143
25. Dubois M, Gilles KA, Hamilton JK, Rebers, Smith F (1956) Anal Chem 28: 35026. Stewart PR (1975) Analytical methods for yeast. In: Prescott DM (eds) Methods in cell
biology, 12. Academic Press, New York, p 11127. Benthin S, Nielsen J, Villadsen J (1991) Biotechnol Technol 5:3928. Bradford MM (1976) Anal Biochem 73:24829. Lowry OH, Rosebourgh NJ, Farr AL, Randall RJ (1951) J Biol Chem 193: 26530. Kimmich GA, Randles J, Brand JS (1975) Anal Biochem 69:18731. Reimann A, Bigge F, Hall (1997) Direkte Bestimmung der Stoffwechselaktivität von Zellen:
Die Luciferase-Reaktion mit automatisierten Biosensorsystemen (FH Furtwangen, FandE Verfahrens- und Biotechnik,D-78054 Villingen-Schwenningen),Poster at ACHEMA fairand conference, Frankfurt/Main, Germany
32. Compagnone D, Guilbault GG (1997) Analytica Chimica Acta 340:10933. Richter T, Bilitewski U (1997) A flow injection analysis system using a bi-enzyme sensor
for the determination of ATP, (GBF, Braunschweig, D), 8th European Biotechnology Conference, Budapest, Hungary
34. Gikas P, Livingston A (1997) Biotechnol Bioeng 55:66035. Srivastava AK,Volesky B (1991) Biotechnol Bioeng 38:18136. Schuster KC, Pink T, Mayer HF, Hampel WA, Sára M (1997) J Biotechnol 54:15
206 K.C. Schuster

8/8/2019 23689262 Bio Analysis and Bio Sensors for Bio Process Monitoring 66
http://slidepdf.com/reader/full/23689262-bio-analysis-and-bio-sensors-for-bio-process-monitoring-66 212/236

8/8/2019 23689262 Bio Analysis and Bio Sensors for Bio Process Monitoring 66
http://slidepdf.com/reader/full/23689262-bio-analysis-and-bio-sensors-for-bio-process-monitoring-66 213/236
76. Goodacre, R (1998) World Wide Web-page: http://gepasi.dbs.aber.ac.uk/ROY/pyms-home.htm
77. Norris KP, Greenstreet JES (1958) J Gen Microbiol 19:56678. Zagreba ED, Savenkov V, Ginovska M (1990) IR-spectrophotometric control of chemical
composition of microbial biomass. In: Microbial conversion – fundamental aspects.
Zinatne, Riga, Latvia, p 13979. Savenkova L, Bonartseva G, Gertsberg Z, Beskina N, Zagreba J,Grube M (1994) Proc of the
Latvian Academy of Sciences Section B, 562/563:8980. Naumann D, Fialja V, Labischinski H, Giesbrecht P (1988) J Molecular Structure 174:16581. Helm D, Naumann D (1995) FEMS Microbiol Letters 126, 7582. Zeroual W, Choisy C, Doglia SM,Bobichon H,Angiboust J-F, Manfait M (1994) Biochimica
Biophysica Acta 1222:17183. Schuster KC, Mertens F, Gapes JR (1999) Vibrational Spectroscopy 19: 46784. Schuster KC, Mertens F, Grube M, Gapes JR (1998) Bioprocess monitoring by infrared
spectroscopy of bacterial cells, 2nd Workshop “FT-IR Spectroscopy in Microbial andMedical Diagnostics,” Berlin
85. Puppels GJ, deMul FFM, Otto C (1990) Nature 347:30186. Puppels GJ (1999) Europ J Histochemistry 43/S1:35 (Abstract)87. Sockalingum GD, Lamfarraj H, Pina P, Beljebbar A, Allouch P, Manfait M (1999) Europ J
Histochemistry 43/S1:39 (Abstract)88. Schuster KC, Urlaub E, Gapes JR (1999) Europ J Histochemistry 43/S1:37 (Abstract)89. Schuster KC, Urlaub E, Gapes JR (1999) Analysis of single bacterial cells by confocal
Raman cpectroscopy, Conference “Analysis of Microbial Cells at the Single-Cell Level,”Como, Italy
208 K.C. Schuster

8/8/2019 23689262 Bio Analysis and Bio Sensors for Bio Process Monitoring 66
http://slidepdf.com/reader/full/23689262-bio-analysis-and-bio-sensors-for-bio-process-monitoring-66 214/236
Advances in Biochemical Engineering/Biotechnology,Vol. 66Managing Editor: Th. Scheper© Springer-Verlag Berlin Heidelberg 1999
Metabolic Network Analysis
A Powerful Tool in Metabolic Engineering
Bjarke Christensen, Jens Nielsen*
Center for Process Biotechnology, Department of Biotechnology, Building 223,Technical University of Denmark, DK-2800 Lingby, Denmark* E-mail: [email protected]
Metabolic network analysis is a tool for investigating the features that identify the topology of a metabolic network and the relative activities of its individual branches. The pillars of metabolic network analysis are mathematical modeling, allowing for a quantitative analysis,
biochemical knowledge of, for example, reaction stoichiometry, and the experimentaltechniques, providing input for the modeling part. The modeling part includes metabolitebalancing, usually the basis for metabolic flux analysis, and isotope balancing. Isotopebalancing can be used for both identification of active pathways and for estimation of therelative fluxes through two pathways leading to the same metabolite, aspects that are difficultto investigate using metabolite balancing. The combination of metabolite and isotopebalancing is very powerful and constitutes the basis of metabolic network analysis. With themain focus being on investigating the metabolic network structure, this review describes how central metabolic features, for example, pathway identification, flux distribution, and com-partmentation, can be addressed using a combination of metabolite balancing and labelingexperiments.
Keywords.Metabolic flux analysis, Flux estimation, Compartmentation, Metabolic channeling,13C tracer experiments
1 Introduction . . . . . . . . . . . . . . . . . . . . . . . . . . . . . . . . 210
2 Metabolic Flux Analysis . . . . . . . . . . . . . . . . . . . . . . . . . . 210
2.1 Metabolite Balancing . . . . . . . . . . . . . . . . . . . . . . . . . . . . 2102.2 Isotope Balancing . . . . . . . . . . . . . . . . . . . . . . . . . . . . . . 212
2.3 Mathematical Modeling . . . . . . . . . . . . . . . . . . . . . . . . . . 214
3 Metabolic Network Analysis . . . . . . . . . . . . . . . . . . . . . . . . 217
3.1 Pathway Identification . . . . . . . . . . . . . . . . . . . . . . . . . . . 2173.2 Metabolic Channeling . . . . . . . . . . . . . . . . . . . . . . . . . . . 2213.3 Compartmentation . . . . . . . . . . . . . . . . . . . . . . . . . . . . . 2233.4 Bidirectional Fluxes . . . . . . . . . . . . . . . . . . . . . . . . . . . . 225
4 Conclusions and Future Directions . . . . . . . . . . . . . . . . . . . 229
References . . . . . . . . . . . . . . . . . . . . . . . . . . . . . . . . . . . . 230

8/8/2019 23689262 Bio Analysis and Bio Sensors for Bio Process Monitoring 66
http://slidepdf.com/reader/full/23689262-bio-analysis-and-bio-sensors-for-bio-process-monitoring-66 215/236
1Introduction
A directed approach to optimization of cellular processes requires an in-depth
understanding of the reactions supporting growth and product formation.Identification and quantification of metabolic reactions in an organism istherefore a central element in Metabolic Engineering [1, 2]. As metabolic re-actions are subject to complex regulation, it is very likely that an attempt todirect the metabolism towards a product of interest will result in an unexpectedmetabolic response. While one part of the optimization process is focused onelucidation of regulation, another part deals with analyzing the metabolicresponse resulting from changes made to the biological system. It is importantto realize that the metabolic response may manifest itself in both changes in themagnitudes of the metabolic fluxes and in changes in the network topology, and
both fluxes and network structure therefore have to be investigated. Based onmass balances for all the metabolites in the network, the metabolic fluxes may be quantified from measurements of a few fluxes, e.g., the glucose uptake rate.This approach is normally referred to as Metabolic Flux Analysis or metabolitebalancing and it is used for estimating net fluxes in a pre-defined metabolicnetwork. However, when it comes to discriminating between pathways, e.g., innetworks containing two different pathways leading to the same metabolite,metabolite balancing is often not adequate. Through the use of 13C-labeledsubstrates and subsequent measurement of the labeling profile in intracellular
metabolites, additional balances can be set up for estimation of the fluxes.Furthermore, the use of labeled substrates enables discrimination of differentpathways leading to the same metabolite. The combination of metabolitebalancing and labeling experiments enables a more detailed analysis that in-cludes flux estimation, identification of the network topology, metabolic chan-neling, and subcellular compartmentation. It is therefore more appropriate touse the term Metabolic Network Analysis for this combination of techniques
This review aims at giving an overview of the potential and the versatility of the results that can be obtained using metabolite balancing and labelinganalyses, and at describing the methodologies applied. Special emphasis is put
on cases where a combination of the two techniques has been applied, butillustrative examples are also taken from literature where only one of the tech-niques was used. A detailed description of the mathematical modeling andtechniques for measuring labeling patterns has been reported by Wiechert andde Graaf [3] and Szyperski [4].
2Metabolic Flux Analysis
2.1Metabolite Balancing
The flux distribution in the entire central metabolism can in some cases beobtained from calculations based on knowledge of the stoichiometry of the
210 B. Christensen · J. Nielsen

8/8/2019 23689262 Bio Analysis and Bio Sensors for Bio Process Monitoring 66
http://slidepdf.com/reader/full/23689262-bio-analysis-and-bio-sensors-for-bio-process-monitoring-66 216/236

8/8/2019 23689262 Bio Analysis and Bio Sensors for Bio Process Monitoring 66
http://slidepdf.com/reader/full/23689262-bio-analysis-and-bio-sensors-for-bio-process-monitoring-66 217/236
By replacing the NADH-dependent glutamate dehydrogenase, which is themajor nitrogen assimilation route in S. cerevisiae, the NADH formation as-sociated with biomass synthesis was reduced, i.e., the stoichiometric coefficienta in Fig. 1 was reduced.
Like the examples mentioned above, most examples of metabolic flux analy-sis by metabolite balancing have redox balances as a central constraint used inthe determination of the flux distribution. However, the redox balance is,especially under aerobic conditions, subject to uncertainties which make it lesssuitable for estimation of the fluxes. Part of the reason for this is to be found infutile cycles, e.g., oxidation of sulfides to disulfides, where reductive power isneeded to reduce the disulfides. The net result of this reaction is reduction of molecular oxygen to water, and oxidation of NADPH to NADP+. Since the con-sumption rate of oxygen of these specific reactions is impossible to measure, theresult may be that the NADPH consumption is underestimated. This is in ac-
cordance with the finding that when the NADPH-producing reactions areestimated independently of the NADPH-consuming reactions, there is usually alarge excess of NADPH that needs to be oxidized by reactions not included inthe network, e.g., futile cycles [11–13].
Reactions where the net reaction is hydrolysis of ATP represent anotherexample of reactions that are difficult to investigate using metabolite balancing.It is well known that the consumption of ATP needed for the biomass- andproduct-forming reactions cannot account for the entire production of ATP by the catabolic reactions, and an ATPase reaction therefore has to be included in
the metabolic network [9]. Because there are many combinations of reactionsthat have ATP hydrolysis as the net result, the ATP balance cannot be used forestimating fluxes in single futile cycles. Since both the redox and the energy balances are central to the metabolism, it is of interest to study these balancesindependently of the carbon balances, and this can only be done by usingisotope-labeled substrates as discussed in the following section.
2.2
Isotope Balancing
Whereas metabolite balancing enables the estimation of the absolute fluxes,isotope balancing enables estimation of relative fluxes, as illustrated by theexample in Fig. 2. It can be seen from Fig. 2 that metabolite balancing alone doesnot give information on the distribution of the fluxes in the system if only oneof the fluxes is measured. Similarly, the fluxes cannot be determined if only thelabeling patterns are measured. However, by combining the extensive property of the system, i.e., the measured absolute flux, and the information on theintensive properties, i.e., the labeling patterns,all fluxes can be determined. Thefact that neither metabolite balancing nor isotope balancing is capable of
yielding information on the entire set of fluxes in Fig. 2 illustrates that in-formation obtained using the two techniques is complementary.Isotope balancing can be carried out at two levels, atom-wise or molecule-
wise. In the case of isotope balancing on the level of carbon atoms, fractionalenrichments are used for estimating the fluxes.Thus, the sum of labeled carbon
212 B. Christensen · J. Nielsen

8/8/2019 23689262 Bio Analysis and Bio Sensors for Bio Process Monitoring 66
http://slidepdf.com/reader/full/23689262-bio-analysis-and-bio-sensors-for-bio-process-monitoring-66 218/236

8/8/2019 23689262 Bio Analysis and Bio Sensors for Bio Process Monitoring 66
http://slidepdf.com/reader/full/23689262-bio-analysis-and-bio-sensors-for-bio-process-monitoring-66 219/236
2.3
Mathematical Modeling
A distinct feature of metabolic network analysis, as compared with clas-
sical labeling experiments, is the mathematical modeling approach. Themathematical method in metabolic network analysis is characterized by beinggeneral in a way that all metabolic features, e.g., reversible fluxes, com-partmentation and metabolic channeling, can be included [14]. At the sametime the modeling is readily amenable to changes in the metabolic network.Martin et al. [15] used 81 equations for deducing the fluxes in five cycles in-volved in the glutamate metabolism. While their results are very valuable froma biological point of view, the complexity of their calculations makes it difficultto modify the equations if the metabolic network has to be slightly modified. Itshould be mentioned that the modeling carried out by Martin et al. [15] did not
require that steady state was obtained, which is normally the case [13, 14, 16],leading to more complex equations. In the following, modeling of isotopicsteady state data will be considered, as the steady state condition simplifies themodeling significantly. The methodology is therefore readily applicable tochemostat cultivations, where steady state is achieved with a labeled substrate,since this is a special case where all metabolites, whether or not they are direct-ly included in the model, are in isotopic steady state. However, the modeling alsoapplies to situations where only the metabolites included in the modelare in a steady state, thereby neglecting the labeling state of, e.g., the macro-molecules.
As the number of equations needed for isotope balances is large, it is im-portant to use a condensed notation to describe the carbon transitions in areaction. In the case of isotope balancing based on fractional enrichments, thebalances can be expressed using so-called atom-mapping matrices [17]. Theprinciple of using atom-mapping matrices is illustrated by considering anexample where the carbon transitions in the first reactions in the Krebs cycleare shown (Fig. 3).
Citrate is an intermediate in this pathway, and it is therefore possible to setup metabolite and isotope balances over citrate. Since citrate is a C6 -molecule,
214 B. Christensen · J. Nielsen
Fig. 3. Condensation of acetyl-CoA and oxaloacetate to citrate and isomerization of citrateinto isocitrate. The numbers next to the carbon atoms indicate the enumeration of the meta-bolite carbon atoms. OAA oxaloacetate; AcCoA acetyl-coenzyme A

8/8/2019 23689262 Bio Analysis and Bio Sensors for Bio Process Monitoring 66
http://slidepdf.com/reader/full/23689262-bio-analysis-and-bio-sensors-for-bio-process-monitoring-66 220/236
there are a total of six equations deriving from isotope balances over the carbonatoms:
r 1 xOAA(4) – r 2 xCitrate(1) = 0
r 1 xOAA(3) – r 2 xCitrate(2) = 0r 1 xOAA(2) – r 2 xCitrate(3) = 0
(1)r 1 x AcCoA(2) – r 2 xCitrate(4) = 0
r 1 x AcCoA(1) – r 2 xCitrate(5) = 0
r 1 xOAA(1) – r 2 xCitrate(6) = 0
where r i is the reaction rate of the i’th reaction and xmetabolite(y) is the fractionalenrichment of the y’th carbon atom in the metabolite.
This set of equations is a bilinear system which is not as simple as the linearsystem of metabolite balancing, but neither as complex as a completely non-linear system.The equation system can be written in a matrix form, giving only one matrix equation:
(2)
It is important to note that if all the reaction rates are known, the equationsystem becomes linear, and equation systems from several reactions can becombined to give a linear system. In this case, an analytical solution to thefractional enrichments can be found. This result is valid for all systems con-
taining any number of reactions. Similarly, if all the fractional enrichments areknown, the system becomes linear, but it is not certain that there is a uniquesolution for the reaction rates. At present, it is quite hypothetical to assume thatall fractional enrichments are measured, and estimates of the complete set of reaction rates are therefore, in general, not accessible using analytical expres-sions. Instead, an iterative approach is used, where a guess is made of the fluxesand the corresponding set of fractional enrichments is calculated. The frac-tional enrichments are then compared with the measured values and thedeviation is calculated. Methods for minimizing the error for a general meta-
bolic network have been described in recent papers and reviews [3, 14, 18, 19].As mentioned above, the calculations based on positional isotopomers aremore complicated than the calculations based on fractional enrichments. Thereason for this is to be found in the nonlinear structure of the equations as aconsequence of some metabolites being composed of carbon atoms from
Metabolic Network Analysis 215

8/8/2019 23689262 Bio Analysis and Bio Sensors for Bio Process Monitoring 66
http://slidepdf.com/reader/full/23689262-bio-analysis-and-bio-sensors-for-bio-process-monitoring-66 221/236
several molecules. If the reactions in Fig. 3 are considered again, the positionalisotopomer equations arising from the isotope balancing over citrate give riseto 26 = 64 equations that all contain terms that are nonlinear in the isotopomerabundances:
r 1I AcCoA(00)I OAA(0000) – r 2 I Citrate(000000) = 0
r 1I AcCoA(01)I OAA(0000) – r 2 I Citrate(000100) = 0
r 1I AcCoA(10)I OAA(0000) – r 2 I Citrate(000010) = 0(3)
r 1I AcCoA(11)I OAA(0000) – r 2 I Citrate(000110) = 0
r 1I AcCoA(00)I OAA(0001) – r 2 I Citrate(100000) = 0
r 1I AcCoA(11)I OAA(1111) – r 2 I Citrate(111111) = 0
where, e.g., I AcCoA(00) is the fraction of the acetyl-CoA molecules that areunlabeled in both positions, and I Citrate(000110) is the fraction of the citratemolecules that are labeled in positions 4 and 5.
Even if all the reaction rates are known, the system is still not linear. As thenumber of reactions in the system increases, an analytical solution to the fluxdistribution becomes difficult to obtain, perhaps even impossible. Furthermore,the iterative approach also becomes difficult because the isotopomers are notlinear functions of the isotopomer abundances. A rapid-equilibrium approxi-
mation has been suggested as a way of simplifying the mathematical model.The approximation applies whenever a reaction is near equilibrium, and statesthat the substrates and products of such reactions can be pooled in a single pool[20]. An example of this is the pentose phosphates in the pentose phosphatepathway, which are assumed to be in near equilibrium and these metabolites aretherefore combined in a single metabolite pool [21]. Isotopomer-mappingmatrices have been introduced to facilitate the calculations [22, 23]. Matrix-based methods have been applied for flux determination of the metabolism of Escherichia coli [24] and in various metabolic cycles [25, 26]. Even though
modeling using isotopomers is very complex (Table 1) and, therefore, moretime consuming than the fractional enrichment based method, positional iso-topomer analysis opens up the possibility for all types of labeling input to beused in the flux estimation, and this type of analysis is therefore the methodwith the most potential.
216 B. Christensen · J. Nielsen
Table 1. Mathematical structure of metabolite and isotope balances
Balance Mathematical structure
Metabolite balance LinearFractional enrichment balance BilinearPositional isotopomer balance Nonlinear

8/8/2019 23689262 Bio Analysis and Bio Sensors for Bio Process Monitoring 66
http://slidepdf.com/reader/full/23689262-bio-analysis-and-bio-sensors-for-bio-process-monitoring-66 222/236
3Metabolic Network Analysis
Metabolic networks contain a number of interesting features that can be in-
vestigated using a combination of metabolite balancing and labeling experiments.Pathway identification naturally occupies a central position among these features,but other interesting aspects, including compartmentation, futile cycles, and me-tabolic channeling, may also play a significant role in the overall metabolic picture.The following examples are primarily taken from studies where these featureswere investigated separately. However, it is important to keep in mind that the in-tegrated approach, i.e., metabolite balancing over the entire central metabolismcombined with data from labeling experiments, is in many cases capable of in-vestigating several or all of these features based on a single experiment.
3.1.Pathway Identification
A quantitative description of the fluxes through the individual branches in ametabolic network relies on knowledge of the pathways that are active in theprimary metabolism. Labeling experiments give a unique possibility for deter-mining the set of pathways that are active in vivo. While several other techni-ques, such as genome analysis, mRNA measurements, and in vitro enzyme as-says, are able to give information on the possible activity of a pathway,
metabolite balancing and labeling experiments, preferably in combination, arethe only tools that allow investigation of actual in vivo activities.Partly because of the high information content of the labeling pattern of
glutamate, and partly because of the ease of analysis due to the high intracel-lular concentration of glutamate in most organisms, the labeling pattern of glutamate is often used for investigating the activities of various central path-ways. Glutamate is formed from 2-ketoglutarate which, in turn, is derived in-directly from oxaloacetate and pyruvate.Glutamate therefore contains informa-tion on both the labeling pattern of pyruvate, giving information on theactivities of the glucose-degrading pathways: Embden-Meyerhof-Parnas path-
way, Entner-Doudoroff pathway, and the pentose phosphate pathway, and on thelabeling pattern of oxaloacetate, which is involved in, e.g., the anaplerotic re-actions and the TCA cycle. Clearly, the glutamate-labeling pattern may yieldvaluable information on many of the central pathways in the metabolism. Thisis illustrated by a study of the glucose-degrading pathways in Corynebacteriummelassecola, where the labeling pattern of glutamate was studied when themicroorganism was grown on 1-13C-glucose and 6-13C-glucose, respectively [27]. Measurements of the fractional enrichments of C1, C2, C3, and C4 inglutamate lead to a quantification of the relative activities of the Embden-
Meyerhof-Parnas pathway and the pentose phosphate pathway, and the relativeactivities of the Krebs cycle, the glyoxylate shunt, and the anaplerotic reactionsyielding C4 -units by carboxylation of C3 -units [27].
There are,however, cases where the glutamate-labeling pattern does not con-tain sufficient information for identification of the active pathways. One such
Metabolic Network Analysis 217

8/8/2019 23689262 Bio Analysis and Bio Sensors for Bio Process Monitoring 66
http://slidepdf.com/reader/full/23689262-bio-analysis-and-bio-sensors-for-bio-process-monitoring-66 223/236
example is the anaplerotic reactions generating oxaloacetate by carboxylationof phosphoenolpyruvate catalyzed by phosphoenolpyruvate carboxylase, andby carboxylation of pyruvate catalyzed by pyruvate carboxylase. When labeledglucose is used, the labeling patterns of the oxaloacetate formed in these re-
actions are indistinguishable. The anaplerotic reactions in C. glutamicum, inparticular, have been studied with some interest because these reactions lead tothe oxaloacetate needed for production of amino acids derived from Krebscycle intermediates, in particular lysine and glutamate. Phosphoenolpyruvatecarboxylase is present in C. glutamicum; however, the study of phosphoenolpy-ruvate-negative mutants gave the surprising result that lysine production wasindependent of the presence of phosphoenolpyruvate carboxylase [28].
The potential candidates for the generation of C4-units in the Krebs cycle are:phosphoenolpyruvate carboxykinase, the glyoxylate shunt, and pyruvate car-boxylase. The first two possibilities are unlikely since these activities are nor-
mally not found when glucose is present in the medium. Attempts to find ac-tivity of pyruvate carboxylase were not successful.Thus, none of these reactionsqualified for being responsible for the anaplerotic reactions. Using H13CO3
– in aminimal medium with glucose as the sole carbon source, it was shown thatthreonine was highly labeled in C-4 and, to a much lesser extent, in C-1 [29].Threonine is derived from oxaloacetate and has therefore the same labelingpattern as oxaloacetate. Since the Krebs cycle produces symmetrically labeledoxaloacetate, the labeling pattern could only be explained if the anapleroticreaction forming oxaloacetate was taking place by carboxylation of a C3 -unit
[29].Using gene-disruption techniques, the possibility of phosphoenolpyruvatecarboxylase was excluded. This result, in combination with the labeling ex-periments, therefore pointed towards pyruvate carboxylase as the enzymeresponsible for the formation of oxaloacetate, despite the fact that no in vitroactivity of pyruvate carboxylase was found. It was later shown that pyruvatecarboxylase is present in C. glutamicum [30], and the gene coding for theenzyme was sequenced [31].
Labeling experiments are particularly useful in cases where pathways havingthe same substrates and the same products are considered. Especially whenmetabolic studies are undertaken of microorganisms which are not well de-
scribed, labeling experiments serve as a valuable tool for investigating the pri-mary metabolism. An example of this is the degradation pathways of glucose inHelicobacter pylori which were identified using 13C-labeled glucose as takingplace via the Entner-Doudoroff pathway [32]. Labeling experiments provide aneasy way of distinguishing between the Entner-Doudoroff pathway and theEmbden-Meyerhof-Parnas pathway since the labeling patterns of pyruvateproduced by the two pathways are completely different (Fig. 4). The samemethod was applied in a study of hyperthermophilic archaea, where it wasshown that the Entner-Doudoroff pathway and the Embden-Meyerhof-Parnas
pathway were active at the same time [33]. The labeling experiments allowed fora quantitative determination of the relative in vivo activities of the twopathways.
According to the reaction scheme shown in Fig. 4, pyruvate and, therefore,alanine and lactate, formed from degradation of 1-13C-glucose should only be
218 B. Christensen · J. Nielsen

8/8/2019 23689262 Bio Analysis and Bio Sensors for Bio Process Monitoring 66
http://slidepdf.com/reader/full/23689262-bio-analysis-and-bio-sensors-for-bio-process-monitoring-66 224/236
labeled in positions 1 and 3 if the Entner-Doudoroff and Embden-Meyerhof-Parnas pathways are the only pathways producing pyruvate. In the study of theglucose degradation by the archaeon Thermoproteus tenax, position 2 inalanine also turned out to carry a significant labeling that could not be ex-
plained by the Entner-Doudoroff or the Embden-Meyerhof-Parnas pathway [34]. A possible explanation for this could be activity of the pentose phosphatepathway. However, since the reasons for the enrichment in C2 is not clear,a cor-rection for the influence of this pathway on the enrichments of C1 and C 3 can-not be made,and the estimates of the relative activities of the Entner-Doudoroff and the Embden-Meyerhof-Parnas pathways are therefore subject to some un-certainty. Even though the qualitative finding of activities of the two glucose-degrading pathways is indisputable, a more complete picture of the glucose de-gradation could be obtained by measuring the labeling patterns of moremetabolites that may be able to explain the enrichment of C2. The advantage of
analyzing the labeling patterns of several metabolites is illustrated by a study of the propionate metabolism in Escherichia coli [35]. Analyzing the labelingpatterns of alanine, glutamate, and aspartate in the biomass of E. coli grown onlabeled propionate as the sole carbon source, the major anabolic reactionproducing C4 -units for the Krebs cycle was shown to be the glyoxylate shuntrather than the phosphoenolpyruvate carboxylase catalyzed reaction [35].Furthermore, by studying the labeling patterns, it was possible to reduce thenumber of possible propionate-degrading pathways from seven to only two.This result is remarkable because the products of six of the seven pathways were
either pyruvate or acetyl-CoA, rendering analysis of the pathways using meta-bolite balancing very difficult or even impossible.The examples above primarily consider the identification of the pathways
that are available for a given microorganism.An equally interesting study is theinvestigation of the conditions under which the pathways, already identified in
Metabolic Network Analysis 219
Fig. 4. Carbon transitions in the Embden-Meyerhof-Parnas (EMP) and the Entner-Doudoroff
(ED) pathway. In the EMP pathway, C1-labeled glucose is converted into 50% unlabeled and50% C 3-labeled pyruvate, while the ED pathway produces 50% unlabeled and 50% C1-labeled pyruvate

8/8/2019 23689262 Bio Analysis and Bio Sensors for Bio Process Monitoring 66
http://slidepdf.com/reader/full/23689262-bio-analysis-and-bio-sensors-for-bio-process-monitoring-66 225/236
the studied microorganism, are active. The glyoxylate shunt, which is found inmost microorganisms, is an example of a pathway that is only active under cer-tain conditions. As an anaplerotic reaction furnishing C4-intermediates to theKrebs cycle, the glyoxylate shunt has a potentially very central position in the
primary metabolism. It may be reasonable to assume that the glyoxylate shuntis inactive when the microorganism is growing in a batch cultivation withglucose as the carbon source since the enzymes in many organisms are knownto be repressed by glucose. However, in a C-limited chemostat with glucose asthe carbon source, the residual glucose concentration is very low, and it may bespeculated that the glucose repression is less efficient in this case. Using thecombined approach of metabolite and isotope balancing, Marx et al. [21] wereable to show that the glyoxylate shunt in Corynebacterium glutamicum playedonly a minor role when C. glutamicum was grown in a C-limited chemostat.When Saccharomyces cerevisiae is grown on acetate the glyoxylate shunt is an
important metabolic pathway which can be quantified, relative to the Krebscycle flux, using labeling experiments [36, 37].
The two pathways responsible for lysine production by Corynebacterium glutamicum (Fig. 5) provide another example of pathways that change in relativeactivities depending on the growth conditions. Using labeled glucose, Sonntaget al. [38] were able to give precise estimates of the relative activities of the two
220 B. Christensen · J. Nielsen
Fig. 5. Carbon transitions in the split pathway of lysine biosynthesis in Corynebacterium glutamicum. Not all the reaction steps or all the metabolites are shown. A1 , A2 , A3 , and A4
refer to the carbon atoms C1– C4 of aspartate and P1 , P2 , and P3 refer to C1– C3 of pyruvate

8/8/2019 23689262 Bio Analysis and Bio Sensors for Bio Process Monitoring 66
http://slidepdf.com/reader/full/23689262-bio-analysis-and-bio-sensors-for-bio-process-monitoring-66 226/236
pathways leading from the common precursors, aspartate and pyruvate, tolysine. Comparing the relative activities of these pathways with the ammoniumcontent of the extracellular medium showed a clear correlation indicating thatthe pathway containing diaminopimelate dehydrogenase, which has am-
monium as a substrate,only takes place if the extracellular concentration of am-monium is above approximately 38 mM. The calculations of the flux ratio werebased on measurements of the labeling pattern of both alanine, reflecting thelabeling pattern of pyruvate, a substrate common to both pathways, and thelabeling pattern of lysine, the product of both pathways. In this way no as-sumptions on the labeling patterns of the substrates, aspartate and pyruvate,had to be made, which is important because prediction of these labeling pat-terns is quite complicated.
3.2
Metabolic Channeling
The estimation of the relative activities of the lysine biosynthetic pathwaysrelies on the assumption that the chemically symmetrical molecule, l,l-diami-nopimelate, formed in one of the two pathways, is allowed to rotate freely afterits formation, and that the next enzyme in the pathway therefore cannot distin-guish between the two ends of the molecule. There is, however, some evidencesupporting the hypothesis that symmetrical molecules may be channeled fromone enzyme to the other giving rise to an orientation-conserved transfer of the
symmetrical molecule. This is exemplified by the symmetric Krebs cycle inter-mediates, succinate and fumarate [39–43]. If metabolic channeling does takeplace, it will have a significant effect on the labeling patterns of the involvedmetabolites, which has to be taken into consideration when labeling analysis isused for pathway identification. Metabolic channeling is not only interestingbecause of its implications on the pathway identification, discussed above, butalso because it is an example of enzyme–enzyme associations that, in thespecial cases of symmetrical molecules, can be investigated using labeling ex-periments.
Much of the evidence supporting the metabolic channeling model is based
on analysis of the labeling pattern of pyruvate resulting from degradation of labeled propionate [40– 42, 44]. The rationale, in the case of propionate meta-bolism, is that propionate is carboxylated to methylmalonyl-CoA which, in turn,is isomerized to succinyl-CoA (Fig. 6). Conversion of succinyl-CoA to succinateand subsequently to fumarate, malate and oxaloacetate, is expected to give sym-metrically labeled oxaloacetate, since fumarate and succinate are symmetricalmolecules. Pyruvate formed from decarboxylation of oxaloacetate is thereforeexpected to reflect the labeling pattern of a symmetrically labeled oxaloacetatemolecule. The labeling pattern of alanine and, thereby, the labeling pattern of
pyruvate, from a culture of Saccharomyces cerevisiae grown on 3-13
C propio-nate, showed a significantly higher 13C-enrichment in C-2 than in C-3 which isnot in accordance with scrambling in the Krebs cycle [42]. This result was in-terpreted as a consequence of metabolic channeling carried out by an enzymecomplex, a so-called metabolon, consisting of succinate thiokinase, succinate
Metabolic Network Analysis 221

8/8/2019 23689262 Bio Analysis and Bio Sensors for Bio Process Monitoring 66
http://slidepdf.com/reader/full/23689262-bio-analysis-and-bio-sensors-for-bio-process-monitoring-66 227/236
222 B. Christensen · J. Nielsen
Fig. 6. Two pathways leading from propionate to pyruvate. The methyl citrate pathway givesretention of the carbon positions. The methylmalonyl-CoA pathway proceeds via the sym-metrical intermediates succinate and fumarate, and the carbon atoms in pyruvate therefore
reflect the scrambling that may take place as a consequence of the symmetry of these inter-mediates. If metabolic channeling takes place, only one of the two possible labeling patternsof malate is formed

8/8/2019 23689262 Bio Analysis and Bio Sensors for Bio Process Monitoring 66
http://slidepdf.com/reader/full/23689262-bio-analysis-and-bio-sensors-for-bio-process-monitoring-66 228/236
dehydrogenase, and fumarase. The metabolic channeling gives rise to theorientation-conserved transfer of the carbon atoms in the asymmetrical suc-cinyl-CoA via symmetrical intermediates, succinate and fumarate, to the asym-metrical molecule of malate.
However, an alternative explanation is that the propionate metabolism oc-curs via the 2-methyl citrate pathway, which gives rise to pyruvate with the ob-served retention of the carbon positions from propionate (Fig. 6) [45]. Enzymeassays on a chemostat cultivation of Saccharomyces cerevisiae, grown on 3-13Cpropionate, showed high activities of the enzymes of the 2-methyl citrate path-way and negligible activity of propionyl-CoA carboxylase, the first enzyme inthe methylmalonyl-CoA pathway [45]. Furthermore, the glutamate-labelingpatterns arising from experiments where S. cerevisiae metabolized labeled py-ruvate have been modeled without having to include metabolic channeling [36,37]. These results support the assumption of scrambling at the stage of suc-
cinate and fumarate, i.e., no metabolic channeling takes place in the conversionof these metabolites. Observations of unexpected labeling patterns in other celltypes include the studies of mammalian tissue [39–41]. In the study of C6glioma cells [39], the orientation of the metabolic channeling was opposite tothe one observed for S. cerevisiae [44] and other mammalian cell types [40, 41],indicating that the orientation of metabolic channeling is not necessarily a con-served trait in all cells.
It is, however, difficult to exclude the possibility of alternative reactions inthese studies. In the case of the C6 glioma cells, it is suggested that oxaloacetate
produced by pyruvate carboxylase may explain part of the observed labelingpattern [39]. In the case of metabolic channeling in connection with the pro-pionate metabolism in mammalian cells [40, 41], there is a large number of pos-sible pathways [35] that may support an alternative explanation of the observedlabeling patterns. However, the existence of metabolic channeling cannot beexcluded on this basis. Moreover, it is important to note that whatever reasonthere is for the observed labeling patterns, there has to be an explanation, andlabeling analysis is a tool for suggesting possible explanations. It should also benoted that even though evidence of metabolic channeling supports the conceptof complexes of functionally related enzymes, metabolons [46], the lack of
evidence for metabolic channeling is not evidence against the concept of metabolons.
3.3
Compartmentation
The discussion of metabolic channeling in the examples above has focused onnew pathways as alternative explanations for the results. However, the com-plexity of metabolic networks offers a variety of different features that influence
the labeling patterns. Theories based on the existence of alternative pathwaysdo not give a satisfactory explanation for the reports of time-dependentlabeling asymmetry, attributed to metabolic channeling, which has been ob-served in both yeast and mammalian tissue [40, 43]. In these cases one has toconsider other structures in the metabolic network, e.g., compartmentation of
Metabolic Network Analysis 223

8/8/2019 23689262 Bio Analysis and Bio Sensors for Bio Process Monitoring 66
http://slidepdf.com/reader/full/23689262-bio-analysis-and-bio-sensors-for-bio-process-monitoring-66 229/236

8/8/2019 23689262 Bio Analysis and Bio Sensors for Bio Process Monitoring 66
http://slidepdf.com/reader/full/23689262-bio-analysis-and-bio-sensors-for-bio-process-monitoring-66 230/236
planation for the presence of these two compartments, but is seems reasonablethat the explanation for the observation should be based on compartmentationphenomena.
It is, however, only occasionally that labeling experiments are able to give
conclusive evidence of compartmentation of the metabolic pathways. This ismainly because it is only possible to distinguish between pathways taking placein different compartments if the precursors in these compartments are labeleddifferently. This is usually not the case because intracellular transport processestend to equilibrate any labeling differences between precursor pools in the dif-ferent compartments, and because most precursors are formed exclusively inone compartment, usually the cytosol, and then transported to the relevantcompartments for further metabolic conversion. Thus, the precursors of thecompartments are likely to be identically labeled, making it difficult to in-vestigate the compartmentation using labeling techniques. However, since these
transport processes require time to take place, information can be obtainedfrom labeling experiments where the transients in the labeling patterns are fol-lowed. An example of this is the investigation of the penicillin biosynthesis inPenicillium chrysogenum [48].
In this study pulse-chase experiments using U-14C-valine were carried out onhigh- and low-yielding strains of P. chrysogenum and the 14C-labeling wasmeasured in both proteinogenic valine and valine incorporated into thepenicillin molecule. It was concluded that valine used for penicillin biosynthe-sis is derived from a compartment which is different from the compartment
that contains the valine used for protein biosynthesis. In isotopic steady statesituations the difference between the labeling patterns of valine used for peni-cillin and protein would have been identical because the effects of the transportprocess kinetics are eliminated in a steady state. However, discrepancies insteady state labeling patterns of the metabolites known to be derived from com-mon precursors have been reported in the case of perfused mammalian heartswhere metabolism of 1-13C-glucose led to significantly higher 13C-enrichmentof lactate in the hearts than the enrichment of alanine. The labeling pattern of lactate in the perfusate was labeled to a higher extent than the lactate in theheart tissue, which was interpreted as the existence of a nonexchanging pool of
lactate [49].A metabolic steady state in perfused mammalian tissue is of coursedifferent from a steady state obtained in a continuous cultivation of a micro-organism. However, if the observed metabolic system only contains metaboliteswith pool sizes that are small compared with the flux in and out of the pool, themetabolic network is in a pseudo-steady state, and the principles of mass andisotope balancing can be applied. Therefore, the methodology used in the study of tissue can also be used in the study of compartmentation in microorganisms.
3.4
Bidirectional Fluxes
An important difference between isotope balancing and metabolite balancing isthe fact that the isotope label, e.g., due to reversible reactions, may be trans-ported in the opposite direction to the net flux. Thus, reversible reactions, or
Metabolic Network Analysis 225

8/8/2019 23689262 Bio Analysis and Bio Sensors for Bio Process Monitoring 66
http://slidepdf.com/reader/full/23689262-bio-analysis-and-bio-sensors-for-bio-process-monitoring-66 231/236
more generally bidirectional pathways, have a significant influence on thelabeling patterns. While bidirectional pathways have no implications on meta-bolite balancing,which only gives information on the net fluxes, information onbidirectionality of a pathway must be included in the analysis of labeling ex-
periments. If bidirectionality is not included in the network it may seriously influence the interpretation of the network, especially when the pentosephosphate pathway is considered [50, 51]. The pentose phosphate pathway con-sists of an irreversible oxidative part, which is an important source of NADPH,and a nonoxidative part, where all the reactions are reversible. In the oxidativepart, C1 of glucose 6-phosphate is lost as carbon dioxide. The usual method forestimating the flux through the oxidative pentose phosphate pathway is there-fore to quantify the loss of label from glucose 6-phosphate, usually assumed tobe labeled identically to 1-13C-glucose in the medium. However, due to rever-sibilities of the nonoxidative pentose phosphate pathway and the reversible
isomerization of glucose 6-phosphate into fructose 6-phosphate, not all glucose6-phosphate molecules are labeled in the C1 position (Fig. 8).
226 B. Christensen · J. Nielsen
Fig. 8. Possible route for redistributing label from 1-13C-glucose 6-phosphate to C2 and C3 of glucose 6-phosphate. Because C1–C3 of glucose can be labeled, glyceraldehyde 3-phosphatealso becomes labeled in all three positions. Through a transaldolase-catalyzed reaction,glyceraldehyde 3-phosphate can be incorporated into C4 –C6 of fructose 6-phosphate whichmay be converted to glucose 6-phosphate by phosphoglucose isomerase. In this way glucose 6-phosphate may, in principle, be labeled in all positions. Glc glucose; G6P glucose 6-phosphate;F6P fructose 6-phosphate; G3P glyceraldehyde 3-phosphate; P5P pentose 5-phosphate (i.e.,xylulose 5-phosphate, ribose 5-phosphate, and ribulose 5-phosphate, which are readily inter-convertible); S7P sedoheptulose 7-phosphate; E4P erythrose 4-phosphate; HK hexokinase;TA transaldolase; TK transketolase; PGI phosphoglucose isomerase; PP pentose phosphate

8/8/2019 23689262 Bio Analysis and Bio Sensors for Bio Process Monitoring 66
http://slidepdf.com/reader/full/23689262-bio-analysis-and-bio-sensors-for-bio-process-monitoring-66 232/236
Consequently, not all glucose 6-phosphate molecules entering the oxidativepentose phosphate pathway contribute to the loss of label, leading to an un-derestimation of the flux through the pentose phosphate pathway. The com-plexity arising from reversibilities is illustrated by the fact that glucose 6-phos-
phate, in theory, can be labeled in all positions by the action of reversiblereactions, without the need for any reactions catalyzed by phosphatases.Figure 8 shows a possible route for transferring the label from C1 of glucose 6-phosphate to C2 and C3 of glucose 6-phosphate. Glucose 6-phosphate labeledin the top three carbon atoms means that glyceraldehyde 3-phosphate can belabeled in all three position. Because glyceraldehyde 3-phosphate supplies thebottom three carbon atoms in a fructose 6-phosphate forming, transaldolase-catalyzed reaction, glucose 6-phosphate may, through the action of phospho-glucose isomerase, be labeled in the bottom three carbon atoms. Therefore, inprinciple, glucose 6-phosphate may be labeled in all positions.Although glucose
6-phosphate may contain labeled carbon atoms in all positions, some of thepositions are only likely to carry a small fraction of the total labeling. Includingreversible reactions complicates the computational analysis of the labeling pat-terns, but reversibilities have to be considered if optimal estimates of the fluxesare to be obtained [18].
NADPH balances are often essential for metabolite balancing based estima-tions of the net fluxes in a metabolic network. However, NADPH consumptionand generation are often found in bidirectional reactions that cannot be quan-tified by metabolite balancing approaches. The mannitol cycle (Fig. 9) is an
example of a pathway that can affect the NADPH balance, but has no net con-version of any metabolites, except for cofactors. In the mannitol cycle, NADHand NADP+ are converted into NAD+ and NADPH, respectively, at the expenseof ATP [52]. Because mannitol happens to be symmetrical, the activity of themannitol cycle will cause scrambling of the carbon atoms of fructose 6-phos-phate, and the activity of the cycle may therefore be identified using labelinganalysis. The mannitol cycle has been reported to be present in several fungi[52].
While the mannitol cycle is generating NADPH, another cycle, involvingisocitrate and 2-ketoglutarate, may operate in the opposite direction [53]
(Fig. 10). The net reaction is the conversion of NADPH and NAD+ into NADP+
and NADH, respectively. Using gas chromatography/mass spectrometry,evidence for the activity of the cycle was indicated by the appearance of citrateenriched in five positions, when U-13C5 glutamate was being metabolized in theperfused rat liver.
The cycle consisting of the reactions catalyzed by pyruvate carboxylase,malate dehydrogenase, and malic enzyme constitutes a third example of apathway, with no net reaction, that may play a role in the redox metabolism. Inthis cycle, NADP+ is reduced to NADPH by malic enzyme, and NADH is oxi-
dized by malate dehydrogenase. The cycle was suggested to be active inCorynebacterium glutamicum during growth on 1-13C fructose [55]. In thisstudy, a combination of metabolite balances and labeling analyses showed thatthe NADPH-producing reactions in the catabolism were not able to supply sufficient amounts of NADPH for the biosynthetic reactions. Enzyme assays
Metabolic Network Analysis 227

8/8/2019 23689262 Bio Analysis and Bio Sensors for Bio Process Monitoring 66
http://slidepdf.com/reader/full/23689262-bio-analysis-and-bio-sensors-for-bio-process-monitoring-66 233/236
228 B. Christensen · J. Nielsen
Fig. 9. Mannitol cycle. The net result of one turn of the cycle is the conversion of NADH andNADP+ into NAD+ and NADPH, respectively, at the expense of ATP. Since mannitol is a sym-metrical molecule, the cycle causes scrambling of the carbon atoms of fructose 6-phosphateunless metabolic channeling takes place [52]
Fig. 10. Conversion of NAD+ and NADPH into NADH and NADP+, respectively. The cycle wassuggested by Sazanov and Jackson [53] and evidence for its activity in the mitochondria of rat livers has been obtained using labeling experiments [54]

8/8/2019 23689262 Bio Analysis and Bio Sensors for Bio Process Monitoring 66
http://slidepdf.com/reader/full/23689262-bio-analysis-and-bio-sensors-for-bio-process-monitoring-66 234/236

8/8/2019 23689262 Bio Analysis and Bio Sensors for Bio Process Monitoring 66
http://slidepdf.com/reader/full/23689262-bio-analysis-and-bio-sensors-for-bio-process-monitoring-66 235/236
can be investigated in a single analysis covering the entire primary metabolism.In particular, analysis based on isotopic steady state labeling patterns is mathe-matically tractable. Metabolic network analysis based on labeling patterns of proteinogenic amino acids from isotopic steady state cultures has been demon-
strated to be a powerful approach to investigate the primary metabolism. Thisis partly because protein is found in significant amounts in all types of biomass,and partly because the amino acid precursors are derived from several parts of the central metabolism. The labeling patterns of the amino acids contain directinformation on the labeling state of these precursors. Thus, information on thelabeling patterns of, e.g., oxaloacetate and pyruvate need not be deduced fromthe labeling pattern of glutamate, but can be obtained directly from aspartateand alanine, respectively. Redundancy of information is crucial when questionsregarding the network structure are to be addressed and redundant measure-ments are therefore of major importance in metabolic network analysis.
However, the labeling patterns obtained from an isotopic steady state re-present the average metabolism, and not the metabolism at the level of a singlecell. Since cells undergo fundamental changes during the cell cycle, it is reason-able to expect these events to be reflected in the central metabolism. Cell dif-ferentiation may be seen as a special case of compartmentation, and it is there-fore likely that cell differentiation, like compartmentation, is amenable toinvestigation by metabolic network analysis. Thus, the future of metabolic net-work analysis may lie in extending the analysis of metabolism from a time-average description to a time-dependent description of the changes in the
metabolism that take place as a consequence of, e.g., cell proliferation.
References
1. Bailey JE (1991) Science 252:16682. Stephanopoulos G (1999) Metabolic Engineering 1:13. Wiechert W, de Graaf AA (1996) Adv Biochem Eng Biotechnol 54:1094. Szyperski T (1998) Q Rev Biophys 31:415. Vallino JJ, Stephanopoulos G (1993) Biotechnol Bioeng 41: 6336. Jørgensen HS, Nielsen J, Villadsen J, Møllgaard H (1995) Biotechnol Bioeng 46:117
7. Varma A, Palsson BO (1994) Bio/Technology 12: 9948. Stephanopoulos G, Aristodou AA, Nielsen J (1998) Metabolic engineering. Academic
Press, San Diego9. van Gulik WM, Heijnen JJ (1995) Biotechnol Bioeng 48: 681
10. Nissen TL, Kielland-Brandt MC, Nielsen J,Villadsen J (1999) Metabolic Engineering (sub-mitted for publication)
11. Sonntag K, Schwinde J, de Graaf AA, Marx A, Eikmanns BJ, Wiechert W, Sahm H (1995)Appl Microbiol Biotechnol 44:489
12. Marx A, Eikmanns BJ, Sahm H, de Graaf AA, Eggeling L (1999) Metabolic Engineering1:35
13. Sauer U, Hatzimanikatis V, Bailey JE, Hochuli M, Szyperski T, Wüthrich K (1997) Nature
Biotechnol 15 :44814. Marx A, de Graaf AA, Wiechert W, Eggeling L, Sahm H (1996) Biotechnol Bioeng 49:11115. Martin G, Chauvin M-F, Baverel G (1997) J Biol Chem 272:471716. Chatham JC, Forder JR, Glickson JD, Chance EM (1995) J Biol Chem 270: 799917. Zupke C, Stephanopoulos G (1994) Biotechnol Prog 10: 489
230 B. Christensen · J. Nielsen

8/8/2019 23689262 Bio Analysis and Bio Sensors for Bio Process Monitoring 66
http://slidepdf.com/reader/full/23689262-bio-analysis-and-bio-sensors-for-bio-process-monitoring-66 236/236
18. Wiechert W, de Graaf AA (1997) Biotechnol Bioeng 55:10119. Wiechert W, Siefke C, de Graaf AA, Marx A (1997) Biotechnol Bioeng 55:11820. Schuster R, Schuster S, Holzhütter H-G (1992) J Chem Soc Faraday Trans 88: 283721. Marx A, Striegel K, de Graaf AA, Sahm H, Eggeling L (1997) Biotechnol Bioeng 56:16822. Fernandez CA, des Rosiers C (1995) J Biol Chem 270:10 037
23. Schmidt K, Carlsen M, Nielsen J, Villadsen J (1997) Biotechnol Bioeng 55: 83124. Schmidt K, Nielsen J,Villadsen J (1999) J Biotechnol (in press)25. Klapa MI, Park SM, Sinskey AJ, Stephanopoulos G (1999) Biotechnol Bioeng 62:37526. Park SM, Klapa MI, Sinskey AJ, Stephanopoulos G (1999) Biotechnol Bioeng 62: 39227. Rollin C, Morgant V, Guyonvarch A, Guerquin-Kern J-L (1995) Eur J Biochem 227: 48828. Peters-Wendisch PG, Eikmanns BJ, Thierbach G, Bachmann B, Sahm H (1993) FEMS
Microbiol Lett 112:26929 Peters Wendisch PG Wendisch VF de Graaf AA Eikmanns BJ Sahm H (1996) Arch
Metabolic Network Analysis 231