guidance of a supersonic projectile by plasma-actuation concept€¦ · guidance of a supersonic...
TRANSCRIPT

31
Guidance of a Supersonic Projectile by Plasma-Actuation Concept
Patrick Gnemmi and Christian Rey French-German Research Institute of Saint-Louis (ISL)
France
1. Introduction
The change in the trajectory of a flying vehicle is made possible by unbalancing the
pressures exerted on the body surface. This pressure imbalance can be produced by the
deployment of control surfaces (Berner & Dupuis, 2001; Dupuis & Berner, 2001; Berner &
Dupuis, 2002; Berner et al., 2002; Dupuis et al., 2004; Srulijes et al., 2004; Patel et al., 2002;
Silton, 2004; Massey et al., 2004) or by the use of one or more pyrotechnical mechanisms
judiciously distributed along the vehicle (Gnemmi & Seiler, 2000; Schäfer et al., 2001; Seiler
et al., 2003; Gnemmi & Schäfer, 2005; Havermann et al., 2005; Yamanaka & Tanaka, 1996). In
the case of supersonic projectiles, the major drawback to using the surface spreading
technique is that large forces are involved in the deployment of surfaces in order to
overcome the very high pressures encountered at high velocities. Thus, the use of
pyrotechnical mechanisms is more appropriate for high-speed vehicles, but the fact that the
pyrotechnical mechanism works only once and produces all or nothing is a main drawback
when a controlled angle of attack must be given.
The application concerns guided anti-aerial projectiles launched by a 40-mm gun and
designed to increase their precision when faced with increasingly agile aerial vehicles flying
up to a few kilometers of altitude. The underlying idea consists of giving the projectiles a
maneuvering capacity, allowing them to compensate for the trajectory prediction error. In
the case of a high-speed vehicle, a shock wave occurs at its nose tip or ahead of it,
depending on the nose geometry. When the vehicle flies without any angle of attack, the
pressures distributed on its surface balance one another out and the shock wave has
symmetries dependent on the vehicle geometry. For example, for a supersonic projectile
forebody having a conical nose, the shock wave is attached to the cone tip and also has a
conical shape. The plasma-actuator steering concept consists of obtaining the asymmetry of
the flow variables around the projectile nose by generating one or several plasma discharges
at the nose tip in order to give the projectile an angle of attack (Wey et al., 2005; Gnemmi et
al., 2008). The objective consists of generating one long or several short plasma discharges so
that the asymmetry is large and long enough to cause the deviation of the projectile with
respect to its initial trajectory.
A patent describing the concept and a first high-voltage system was registered in February 2002 and was issued in France in January 2005 and in the USA in February 2006 (Gnemmi et al., 2002). A new low-voltage device was designed to avoid the high-voltage apparatus
www.intechopen.com

Wind Tunnels and Experimental Fluid Dynamics Research
630
drawbacks and a patent was also registered in September 2005 and was issued in France in December 2007 and in the USA in January 2010 (Gnemmi & Rey, 2005). The flow control around aerial vehicles by using plasma has been one of the concerns of the fluid dynamics flow control community for over a decade. The most recent state of the art concerning a type of plasma actuator is given by Corke et al., 2009. This plasma actuator, now widely in use, is based on a dielectric barrier discharge (DBD) mechanism that has desirable features for use in the air at atmospheric pressures. It has been employed in a wide range of applications that include: drag reduction at supersonic speeds (Kuo, 2007; Elias et al., 2007a; Shneider et al., 2008); steering vehicles at supersonic speeds (Girgis et al., 2006); exciting boundary-layer instabilities at supersonic speeds (Kosinov et al., 1990; Corke et al., 2001; Matlis, 2004; Elias et al., 2007b); lift increase on a wing section (Corke et al., 2006; Nelson et al., 2006; Patel et al., 2006; Goeksel et al., 2006); low-pressure turbine-blade separation control (Huang, 2005; Huang et al., 2006a; Huang et al., 2006b; Suzen et al., 2007; Ravir, 2007; Risetta & Visbal, 2007); turbine tip clearance flow control (Douville et al., 2006; Van Ness et al., 2006); bluff-body flow control (Thomas et al., 2006; Asghar et al., 2006; Do et al., 2007); turbulent boundary-layer control (Balcer et al., 2006; Porter et al., 2007); unsteady vortex generation and control (Visbal & Gaitonde, 2006; Nelson et al., 2007); and airfoil-leading-edge separation control (Post, 2004; Post & Corke, 2004a; Post & Corke, 2004b; Corke et al., 2004). The analysis of the above-mentioned publications shows that few studies are being conducted on supersonic projectile steering by using a plasma discharge. Therefore, the work described in this paper is original; indeed, a plasma-discharge production on the surface of a supersonic projectile flying in the low atmosphere has not been applied up to now to the control of projectiles in terms of change of trajectory. Section 2 of the present chapter deals with the principle of the concept of controlling a supersonic projectile by a plasma discharge. Section 3 describes the experimental setups and details the plasma-discharge actuator and the instrumentation used for the experiments. Section 4 presents the experimental results of the surface-pressure and temperature measurements made in order to investigate the complex physical phenomenon involved in the process and the results of the tests on the angular deviation of a fin-stabilized projectile model carried out in the wind-tunnel facility at a Mach number of 3. This Section also presents the experimental results of the free-flight of a simple projectile model deviated by a plasma discharge performed in the shock-tunnel facility at Mach 4.5. Section 5 concludes the chapter and proposes future investigations.
2. Principle of the concept
In the case of a high-speed vehicle, a shock wave occurs at its nose tip or ahead of it, depending on the nose geometry. When the vehicle flies without any angle of attack, the pressures distributed on its surface balance one another out and the shock wave has symmetries dependent on the vehicle geometry. For example, for a supersonic projectile forebody having a conical nose, the shock wave is attached to the conical tip and also has a conical shape. The proposed concept consists of producing the asymmetry of the flow variables around the projectile nose by generating one or several plasma discharges at the nose tip in order to give the projectile an angle of attack. Some theoretical investigations illustrate the feasibility of such a system. Figure 1 presents
the qualitative result of a numerical computation of a projectile forebody, flying from right
www.intechopen.com

Guidance of a Supersonic Projectile by Plasma-Actuation Concept
631
to left near the ground level at a Mach number of 3.2. A plasma discharge modelled as a
transverse hot jet is applied near the nose tip for a certain length of time. The figure shows
the forebody in blue and the halves of two surfaces in red. The red surfaces represent a
constant pressure in the flow field which is chosen to highlight the main structure of the
latter. The attached shock wave is perfectly visible at the tip of the conical nose as well as the
Prandtl-Meyer expansion wave at the junction of the conical nose with the cylindrical part of
the forebody. On the side of the conical nose where the plasma discharge is activated, the
geometry of the shock wave is clearly distorted due to the generation of the plasma
discharge. On the contrary, on the opposite side, the geometry of the shock wave remains
unperturbed.
Fig. 1. Surfaces of constant pressure in the flow field of a supersonic projectile forebody having modelled plasma-discharge action
The final objective consists of the production of one or several plasma discharges so that the
asymmetry is large and long enough to cause the deviation of the projectile facing its initial
trajectory. The absence of mobile parts and the repetitive action of discharges are the main
advantages of this technique. In fact, the control of the vehicle can be realized by repetitive
discharges activated on demand, depending on the required trajectory.
3. Experimental setup and instrumentation
3.1 Wind-tunnel facility The “Aerodynamics and Wind-Tunnel Laboratory” has two facilities for supersonic flow
investigations. The experiments involving pressure and temperature measurements are
conducted in the supersonic blow-down wind tunnel S20 (Schäfer et al., 2001; Gnemmi et al.,
2006). The test chamber has a square section of 0.2 m × 0.2 m and has interchangeable Laval
nozzles adjusted for Mach numbers (M) of 1.4, 1.7, 2, 2.44, 3, 4 and 4.36. The present
experiments are carried out at M = 3 for a static free-stream pressure of P∞ = 0.19 • 105 Pa
and a static free-stream temperature of 108 K. This facility operates in blow-down mode
with a blow duration of typically 50 s. For these experimental conditions, the free-stream
velocity is 611 m/s and the density is 0.643 kg/m3.
www.intechopen.com

Wind Tunnels and Experimental Fluid Dynamics Research
632
Section 3.4 describes the projectile forebody fixed in the test chamber and equipped with surface-pressure transducers, which is also used for the temperature measurement in the
plasma plume. The model-related Reynolds number based on the body diameter is 2.6 • 106. The fin-stabilized projectile model used for investigations of the angular deviation is described in Section 3.5. The model-related Reynolds number based on the body diameter is
9.1 • 105.
3.2 Shock-tunnel facility The “Aerothermodynamics and Shock-Tube Laboratory” has two high-energy shock tubes (STA and STB) able to supply up to 8 MJ/kg to carry out high-speed flow experiments (Patz, 1970, 1971; Oertel, 1966). The inner shock-tube diameter is of 100 mm and each facility is about 22 m long. Nowadays, the ISL shock tubes are mainly used as supersonic/hypersonic shock tunnels. A shock tunnel is a very-short-duration test wind tunnel consisting of a shock tube connected to a supersonic/hypersonic nozzle, a measurement chamber and a dump tank. The shock tube itself is divided into a high-pressure driver tube and a low-pressure driven tube, as depicted in Figure 2. The STA driver tube is 3.6 m long, the STB one is 4.0 m long and the driven tube is 18.4 m long for both facilities. Behind the driven tube are situated the nozzle, the measurement section and the dump tank.
Fig. 2. Schematic of the ISL shock tunnels
A preferably light driver gas is compressed in the driver tube up to 450 bar. The steel membrane separating the high-pressure from the low-pressure parts is designed to burst at a determined pressure dependent on the required experimental conditions. At this moment a shock wave propagates through the driven tube where the test gas (usually nitrogen) is contained at a pressure of up to 5 bar. Simultaneously, an expansion wave runs in the opposite direction and is reflected off the driver-tube end. The shock wave propels the gas into the driven tube in front of the entrance to the nozzle where it is compressed and heated and where it remains almost stationary for a very short time. Then, the driven gas expands through the nozzle, resulting in a quasi-stationary supersonic/hypersonic flow inside the measurement section. The resulting measurement time ranges from 1 to 4 ms for quasi-stationary flow conditions. Additionally, because the Mach number only depends on the nozzle geometry, it remains constant over a time period of 15 more milliseconds, until the driver gas arrives. During this extended measurement time, it is necessary to know how the history of the flow conditions (e.g. velocity and density) changes at the nozzle exit. Therefore, the transient velocity change is measured with the Laser-Doppler Velocimeter (LDV) (Smeets and George, 1978) by using seeded titanium dioxide particles. The density is obtained from both the static pressure measured at the nozzle wall close to the nozzle exit
www.intechopen.com

Guidance of a Supersonic Projectile by Plasma-Actuation Concept
633
and the LDV-measured velocity at a constant Mach number. The measurement section contains the model to be studied and catches the shock-tube gases after the experiment. The gases are then stored inside the dump tank attached to the measurement section. The dump tanks have a volume of about 10 m3 and 20 m3 for STA and STB, respectively. After each shot, the free-stream flow conditions are recalculated by using a one-dimensional shock-tube code, which requires the measured shock-wave speed in the driven tube to be input into the code (Smeets et al., 1980-2009). By varying the tube pressure, the free-stream flow can be adjusted in order to reproduce the flow conditions present in the atmosphere. Real atmospheric flight conditions can be produced in these facilities from ground level up to a flight altitude of 70 km, depending on the Mach number, as shown in Figure 3.
Fig. 3. Red and overlapped yellow areas representing the working range of the ISL STB and STA shock tunnels, respectively
The experimental flow conditions, i.e. the ambient pressure and temperature, are based on the US Standard Atmosphere (1976) model. Experiments can be were conducted either in the STA shock tunnel or in the STB one at various Mach numbers and simulated altitudes. Nozzles having a Laval contour are available for experiments at Mach numbers of 3, 4.5, 6 and 8. Divergent nozzles are used for Mach numbers of 3.5, 4, 10, 12 and 14. The nozzle-exit diameters range from 200 mm to 400 mm. Experiments reported in this chapter were carried out in the STA shock tunnel at a Mach number of 4.5 and at a simulated altitude of 2.5 km.
3.3 Plasma-discharge actuator In the present application, the projectile has to be steered at an altitude lower than a few kilometers, where the pressure ranges from 105 to about 104 Pa. As an example and taking into account the Paschen curve, for an electrode distance of 5 mm and for a pressure of 104 Pa, it is necessary to apply a voltage higher than 3 000 V to break the electric barrier. For a supersonic flight the pressure on a projectile forebody, where the electrodes are flush with the surface, is higher than the atmospheric pressure (depending on the projectile velocity) and consequently, the breakdown voltage also has to be higher. The plasma-discharge actuator is composed of a high-voltage low-energy activating system and of a low-voltage high-energy plasma generator capable of producing a plasma discharge between two electrodes (Fig. 4). Let us consider a projectile flying from right to left and composed of a conical forebody equipped with two pairs of electrodes, as represented in Figure 5, step 1. The role of the high-voltage activating system only consists of breaking the electric barrier between two
www.intechopen.com

Wind Tunnels and Experimental Fluid Dynamics Research
634
Fig. 4. Principle of the plasma-discharge actuator
electrodes, then of ionizing a small gas volume (step 2). As the projectile flies, the ionized
gas volume moves along its surface (steps 3 and 4). The ionized gas volume, which has a
low impedance, activates a plasma discharge when it encounters two other electrodes
supplied with a low voltage (step 5). The role of that low-voltage plasma generator consists
of feeding the energy to the pair of electrodes and then producing the plasma discharge. It is
obvious that the high-voltage activating-system electrodes have to be ahead of the
electrodes of the low-voltage plasma generator.
Fig. 5. Principle of the activation of a low-voltage plasma-discharge actuator
The high-voltage activating system is composed of a low-voltage power supply providing
little energy to the ionizing power supply and to the impulse generator. The ionizing supply
and the impulse generator are connected to a step-up transformer generating the high
voltage. The transformer is itself connected to the pair of electrodes. An external signal
allows the triggering of the activating system. The transformer is the main part of the latter.
ionized gas volume moving along the surface with the
flow
electrodes of the plasma-discharge
generator
electrodes of the
activating system
plasma discharge generated by the low-voltage generator
M 1
4
2
3
5
www.intechopen.com

Guidance of a Supersonic Projectile by Plasma-Actuation Concept
635
In the experiments presented in the current studies, a 320 V / 5 000 V transformer is used;
however, the plasma-actuator design could be adapted to any projectile flight conditions.
The low-voltage plasma-discharge generator is composed of a capacitor connected to the electrode pair through a current controller and a switch activating the actuator. The current controller allows the plasma power and therefore, the plasma duration to be controlled for a given energy. The capacitor is charged by a low-voltage supply. Aluminum electrolytic capacitors meet the requirements for the present application; indeed, they have a large capacity/volume ratio and a low equivalent series resistance (ESR), allowing the use of a large discharge current. As an example, a capacitor of a 35-mm diameter and a 50-mm length supplied with 550 V has a stored energy of 50 J. Figure 6 shows the plasma-discharge actuator embedded in a 50-mm-diameter test model. The
low-voltage supply used for charging the capacitor before the test is carried out, is not
embedded in the test model; an autonomous low-voltage supply based on a 7.2 V battery and
a step-up transformer is being studied so that it can be embedded in the same test model.
Fig. 6. Embedded low-voltage plasma-discharge actuator in a 50-mm-diameter test model and zoom on the electrodes
3.4 Fixed projectile forebody for surface-pressure and temperature measurements in the wind tunnel A series of experiments is performed with a projectile forebody mounted in the wind tunnel
in order to analyze the flow field disturbed by the plasma discharge by means of pressure
and temperature measurements and visualizations. The experimental study is conducted for
the 50-mm test model of Figure 7, which is mounted without any angle of attack on a shaft
assembly along the wind-tunnel centerline. The model is composed of two electrically
insulating parts mounted on a steel support ensuring the mechanical connection between
the model and the wind-tunnel shaft assembly.
Fig. 7. Projectile forebody for surface-pressure measurements
www.intechopen.com

Wind Tunnels and Experimental Fluid Dynamics Research
636
The copper electrodes flush with the conical surface are embedded in the PVC part and are arranged along the longitudinal axis of the model, allowing the production of a geometrically quasi-linear discharge. The cathode of the activating system and that of the low-voltage plasma generator are put together, limiting the number of electrodes to three. The common cathode is located between the anodes of the activating system and of the low-voltage plasma generator. The anode of the activating system is located at a distance of 65 mm from the projectile tip. The distance between the electrodes of the activating system is 3.5 mm and the distance between the electrodes of the low-voltage generator is 6 mm. The plasma discharge is produced by using the low-voltage actuator embedded in the projectile. Four pressure transducers also flush with the surface are embedded in the model according to Figure 7. Transducer No. 1 is located 10 mm ahead of the cone-cylinder junction. Transducers Nos. 2 and 3 are 40 and 10 mm downstream from the cone-cylinder junction, respectively. Transducer No. 4 is located 10 mm upstream from the anode of the activating system. The model CCQ-093-1.7BARA from the Kulite-Semiconductor company is used: the rated absolute pressure is 1.7 bar, the maximum absolute pressure is 3.4 bar and it is compensated in temperature within a 78 K-235 K range. The accuracy of the measurement is 0.1% of the rated absolute pressure. That model is particularly designed to be protected against electromagnetic perturbations. The data acquisition is carried out by using 16-bits National Instrument RACAL boards cadenced at 100 kHz. The complete projectile forebody equipped with pressure transducers and their acquisition chains have been calibrated at rest in the shock-tunnel test chamber; indeed, the shock tunnel is airtight when the installation is closed and a defined pressure can be set from 5 to 105 Pa to calibrate the measurement chains.
3.5 Free-pitching projectile motion device Another series of experiments is conducted with a projectile model mounted on a sting ending
with an axis in such a way that the model can rotate around this pitching axis located right at
the center of gravity of the model. The aim of the experimental study consists of recording the
free-pitching motion of the projectile model by using a high-speed camera. The analysis of the
recorded images allows the determination of the pitching response of the projectile model as
far as the evolution of the measured angle of attack is concerned.
The main difficulty encountered in that study concerns the projectile model stability.
Figure 8 shows the free-pitching projectile motion device supporting the model (part 1)
which can have an angle of attack. Before the experiment starts, the model is horizontal and
locked by a pneumatic jack (parts 2 and 3) and remains locked until the steadiness of the
supersonic flow is reached (about 10 s). Then the pneumatic jack fixed to the wind-tunnel
Fig. 8. Projectile model mounted on the free-pitching motion device in the wind tunnel
www.intechopen.com

Guidance of a Supersonic Projectile by Plasma-Actuation Concept
637
support (part 4) releases the model; it is now able to rotate freely around its center of gravity. If the projectile model remains horizontal, it is stable in the flow; otherwise, it rotates until the
angular stop is reached. The maximum amplitude of the projectile model deviation is ± 3.4°. Three projectile models have been tested; they have the same geometry, except for the fin height L, which is 0.5 D, D and 1.5 D, respectively (Fig. 9). The diameter D of the cylindrical part is 20 mm and is the reference dimension. The models are composed of many parts so that the center of gravity is located right at the pitching axis, as mentioned before. The electrodes flush with the conical surface are situated just in front of the fins. The plasma discharge is produced by using the low-voltage actuator located outside the wind tunnel, due to the dimensions of the actuator and projectile models.
Fig. 9. Projectile model geometries for the free-pitching motion study
3.6 Projectile model for free-flight experiments in the shock tunnel Another series of experiments is conducted in the shock tunnel by using a very light model of an Explosively Formed Projectile (EFP) for free-flight investigations. This projectile is chosen because it has been studied at ISL in terms of flight stability and it has been found that it is very stable without any spin (Rondot & Berner, 1998). Another advantage is that it is very easy to manufacture the projectile model as its geometry is axisymmetric. It is composed of an ogive, a cylindrical part, a flare having a conical angle of 17° and a second one with a conical angle of 40.8° (Fig. 10). The model is made of AU4G, except for the support of the electrodes which is made out of PVC. The model mass is 20.5 g, and the center of gravity is located at 47.9 mm from the projectile tip. The electrodes are embedded near the junction between the ogive and the cylindrical part.
Fig. 10. EFP model for free-flight tests
www.intechopen.com

Wind Tunnels and Experimental Fluid Dynamics Research
638
Figure 11 shows model No. 1 hung up in the test chamber of the shock tunnel by means of two very thin and small disks of paper (No. 2) linked to Nylon threads that are fixed on the test-chamber wall. The plasma discharge is produced by using the low-voltage actuator located outside the shock tunnel, due to the dimensions of the actuator and of the projectile model. The electric wires (No. 3) connected to the plasma-discharge actuator are very flexible and they slide through a small tube (No. 4) fixed in the test chamber. The displacement of the model is of the order of the model length. The Pitot-pressure probe (No. 5) allows the determination of the flow conditions. The aim of the experimental study consists of recording the free-flight motion of the projectile by using a high-speed camera. The analysis of the recorded images allows the determination of the free motion of the projectile model subjected to a plasma discharge.
Fig. 11. EFP model hung up in the test chamber
3.7 Spectroscopic temperature estimation in the plasma plume Spectra of the plasma emission have been recorded at different positions by means of two spectrometers: a miniature spectrometer covering the visible region from 400 nm to 800 nm (Ocean Optics HR2000) and a grating spectrograph (SPEX, f = 500 mm, grating: 2400 lines/mm) for measuring spectra at certain wavelengths with a higher resolution (Eichhorn et al., 1998). A gateable ICCD camera (PRINCETON INSTRUMENTS ICCD-MAX 1024 ELD), which is connected to the grating spectrograph, is used for taking one spectrum per discharge at a precise chosen moment (delay with respect to the trigger signal) with an exposure time of 10 µs. The schematic of the optical setup is shown in Figure 12. The plasma temperature can be calculated by means of the copper spectrum at 510 nm. Copper is the electrode material and therefore the Cu lines are clearly visible in the measured spectrum (Sect. 4.2). If the local thermal equilibrium can be assumed, the intensity of a spectral line can be expressed as:
−⋅⋅=
kT
EgfS n
n
nn exp
)(3λ
γ (1)
www.intechopen.com

Guidance of a Supersonic Projectile by Plasma-Actuation Concept
639
with:
nS : intensity of line No. n,
γ : factor, containing all constants,
ngf )( : weighted oscillator strength of line No. n,
nλ : wavelength of line No. n,
nE : energy of the upper level of line No. n,
k : Boltzmann constant (0.69503 cm-1/ K),
T : temperature.
Fig. 12. Optical setup for the recording of spectra
The spectrum of Section 4.2 shows one Cu II line and several Cu I lines; two of them,
numbered 1 and 2, are used for calculating the temperature. From Eq. (1) we can deduce:
−⋅
⋅
⋅=
kT
EE
gf
gf
S
S 12
23
1
13
2
2
1 exp)(
)(
λ
λ
⋅⋅
⋅⋅⋅
−=
13
22
23
11
12
)(
)(ln
1
gfS
gfSk
EET
λ
λ (2)
The uncertainty depends on the relative uncertainties of the line intensities:
⋅⋅
⋅⋅
Δ+
Δ
⋅=Δ⋅∂
∂+Δ⋅
∂
∂=Δ
13
22
23
11
2
2
1
1
22
11
)(
)(ln
gfS
gfS
S
S
S
S
TSS
TS
S
TT
λ
λ (3)
3.8 Voltage and current measurements The measurements of the voltage and current during the plasma discharge are recorded. The voltage measurement performed at the electrode bounds indicates the lifetime of the
www.intechopen.com

Wind Tunnels and Experimental Fluid Dynamics Research
640
plasma discharge. The current measurement gives a representation of the impulsiveness of the plasma discharge.
3.9 Flow-field visualizations The plasma discharge is produced on the projectile surface when the flow is quasi-steady around the model. A differential interferometer (DI), a classical schlieren picture or a simple photograph is used for visualizing the flow-field structure by means of a CCD camera. DI works as a flow visualization technique (Smeets, 1990) based on the density gradient field, thus allowing the gathering of information on an interferogram showing the flow pattern around the model. The differential interferometer is set for a gas at rest so as to obtain fringe patterns or an infinite fringe width showing a homogeneous light intensity distribution. In the current experiments the DI is used by following the second adjustment and the pictures look like schlieren pictures. In this way, the density gradient field in the gas flow is visualized by the light intensity distribution shown on interferogram pictures. The DI is adjusted in such a way that the density gradient direction is vertical.
4. Experimental results
4.1 Wind-tunnel experiments, M = 3, fixed model device, flow-field visualization Many experiments have been carried out with the low-voltage actuator embedded in the 50-
mm-diameter model for different electrode distances, capacitors and supply voltages. The
current study only focuses on the first 60 millimeters of the conical nose in order to highlight
the evolution of the plasma discharge in detail.
The DI pictures (interferograms) are recorded by a 12-bit PCO SENSICAM camera with a
spatial resolution of 1280 pixels by 1024 pixels and an exposure time of 0.2 µs. The plasma
discharge is produced under wind-tunnel conditions at M = 3 without any angle of attack.
The electrode distance is 3.5 mm.
A first series of interferograms is taken for a configuration in which the energy (E) stored in
the capacitor amounts to 12 J. Figure 13 shows shots taken at 3 instants after the beginning
of the plasma discharge, allowing the analysis of the evolution of the flow field modified by
the plasma. The flow direction is from left to right. The formation and growth of the
disturbance and its propagation along the conical model surface are clearly highlighted. At
t = 17 µs, the plasma causes an expansion of the air leading to the distortion of the attached
t = 17 µs t = 50 µs t = 100 µs
Fig. 13. Plasma-discharge visualizations at M = 3, E = 12 J, time evolution
www.intechopen.com

Guidance of a Supersonic Projectile by Plasma-Actuation Concept
641
shock wave present at the conical tip. The boundary layer is also perturbed by the plasma, but the flow-field modification is larger on the plasma side than on the opposite side. At t = 50 µs, the plasma power decreases, the bubble due to the sudden expansion is convected along the model surface and the attached shock wave remains distorted. At t = 100 µs, the plasma power slightly decreases as long as the capacitor is able to provide sufficient energy to maintain it. Its extinction occurs after nearly 250 µs. A second series of interferograms is taken for an energy E = 50 J. Figure 14 shows pictures taken at the same instants, so that the influence of the energy delivered to the plasma discharge can be analyzed; a saturation of some CCD pixels is visible for the first instant, due to the very high light intensity. The effects of the plasma are much greater when the energy is increased and the plasma-discharge duration is longer. Indeed, its extinction takes place after nearly 400 µs.
t = 17 µs t = 50 µs t = 100 µs
Fig. 14. Plasma-discharge visualizations at M = 3, E = 50 J, time evolution
The visualizations show that the generation of a plasma discharge causes a perturbation
between the projectile surface and the shock wave attached to the conical projectile tip. The
perturbation is much greater than the one obtained with the high-voltage generator (Gnemmi
et al., 2008). It is maintained for a certain length of time and is strong enough to distort the
attached shock wave: the higher the energy, the stronger the perturbation and the longer the
plasma-discharge duration. The perturbation is more important on the plasma-discharge side
than on the opposite side of the projectile tip, leading to an imbalance in the flow field.
The influence of the energy is clearly examined by using capacitors capable of supplying 7, 12 and 50 J. Figure 15 shows interferograms taken 50 µs after the beginning of the plasma discharge for an electrode distance of 9.5 mm: the higher the supplied energy, the larger the perturbation. The analysis of these flow-field structures must be considered very carefully: the fact that the perturbation is greater when the highest energy is used does not mean that the pressure imbalance on the projectile surface is stronger. The influence of the electrode distance is examined by performing other series of interferograms taken for four electrode distances (l) and an energy of 50 J. Figure 16 shows interferograms taken 50 µs after the beginning of the plasma discharge. The sparks indicating the electrode pairs of the low-voltage plasma generator are visible on each interferogram. There are small differences in the flow structure just after the beginning of the process, which means that the delivered power is nearly the same. However, the plasma duration depends on the electrode distances, as can be seen in Figure 17.
www.intechopen.com

Wind Tunnels and Experimental Fluid Dynamics Research
642
E = 7 J E = 12 J E = 50 J
Fig. 15. Plasma-discharge visualizations at M = 3, t = 50 µs, energy influence
l = 3.5 mm l = 5.5 mm l = 7.5 mm l = 9.5 mm
Fig. 16. Plasma-discharge visualizations at M = 3, t = 50 µs, E = 50 J, electrode-distance influence
0
100
200
300
400
500
600
-100 0 100 200 300 400 500 600
time [µs]
vo
lta
ge
[V
]
tip No. 1, electrode distance = 3.5 mm
tip No. 2, electrode distance = 5.5 mm
tip No. 3, electrode distance = 7.5 mm
tip No. 4, electrode distance = 9.5 mm
Fig. 17. Voltage measurement during the plasma discharge with 4 electrode distances
Figure 17 represents the voltage evolution measured between the electrodes of the low-voltage plasma generator during the previous experiments. Before the plasma discharge occurs at t = 0, the voltage between the electrodes is 558 V, corresponding to the capacitor voltage. The start of the plasma discharge causes a voltage drop down to about 220 V,
www.intechopen.com

Guidance of a Supersonic Projectile by Plasma-Actuation Concept
643
depending on the electrode distance, as the same capacitor is used. The voltage slightly decreases and the plasma extinction takes place when a slight voltage increase occurs up to a residual value. The plasma duration increases from 0.34 ms for tip No. 4 to 0.42 ms for tip No. 1 as the electrode distance decreases: indeed, the longer the electrode distance, the higher the voltage necessary to keep the discharge active.
4.2 Wind-tunnel experiments, M = 3, fixed model device, pressure and temperature measurements, flow-field visualization The experiments presented previously and many others reported in Gnemmi & Rey, 2008 and Gnemmi & Rey, 2009 were carried out with the low-voltage actuator embedded in the 50-mm-diameter model for different electrode distances, capacitors and supply voltages in order to analyze the flow-field modification due to a plasma discharge by using interferograms pictures. The plasma discharge is produced under wind-tunnel conditions at M = 3 without any angle of attack. The current study focuses on time-resolved pressure and temperature measurements recorded synchronously with the flow-field visualizations. The plasma discharge is produced by an electric arc between the electrodes, which causes electromagnetic perturbations. It is therefore necessary to verify that the pressure measurements are not disturbed by these perturbations. The first test consists of masking the pressure transducers by means of adhesive tape covering each of them, of realizing the experiment with the plasma discharge and of analyzing the pressure evolution. The energy stored in the plasma discharge actuator amounts to 83 J: it is distributed to the electrodes without any current regulation, but limited by the use of a coil. Figure 18 presents the absolute pressure recorded on transducers P1 to P4 covered with adhesive tape and the current I measured at the same time. The pressure data acquisition is performed at 100 kHz and filtered at 10 kHz. The plasma duration is 1.05 ms. The dielectric barrier disruption produces perturbations on the pressure signal during about 80 µs and then the pressure remains constant. It is noticeable that the perturbation amplitude varies with the transducer-plasma distance: the shorter the distance, the larger the perturbation amplitude. The absolute pressure has a certain value (near 0.23 bar) because the projectile model is not airtight.
0.10
0.20
0.30
0.40
0.0175 0.0180 0.0185 0.0190 0.0195
Time [s]
Ab
so
lute
Pre
ss
ure
[b
ar]
0
120
240
360
Cu
rre
nt
[A]
P 1 P 2
P 3 P 4
I plasma
Fig. 18. Pressure and current measurements during a plasma discharge, M = 3, E = 83 J (test 12-08-11-26-02): transducers protected by adhesive tape
www.intechopen.com
Wind Tunnels and Experimental Fluid Dynamics Research
644
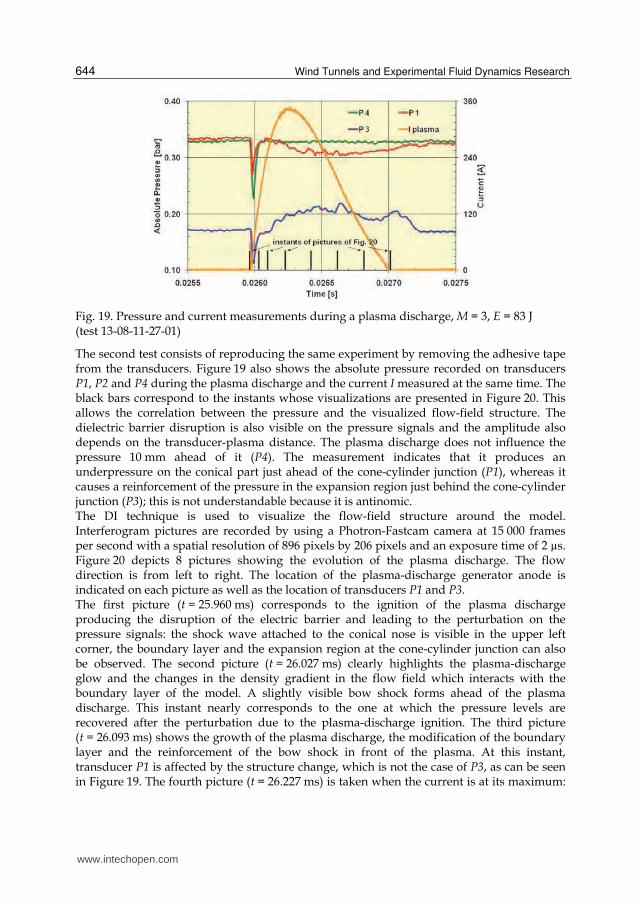
Fig. 19. Pressure and current measurements during a plasma discharge, M = 3, E = 83 J (test 13-08-11-27-01)
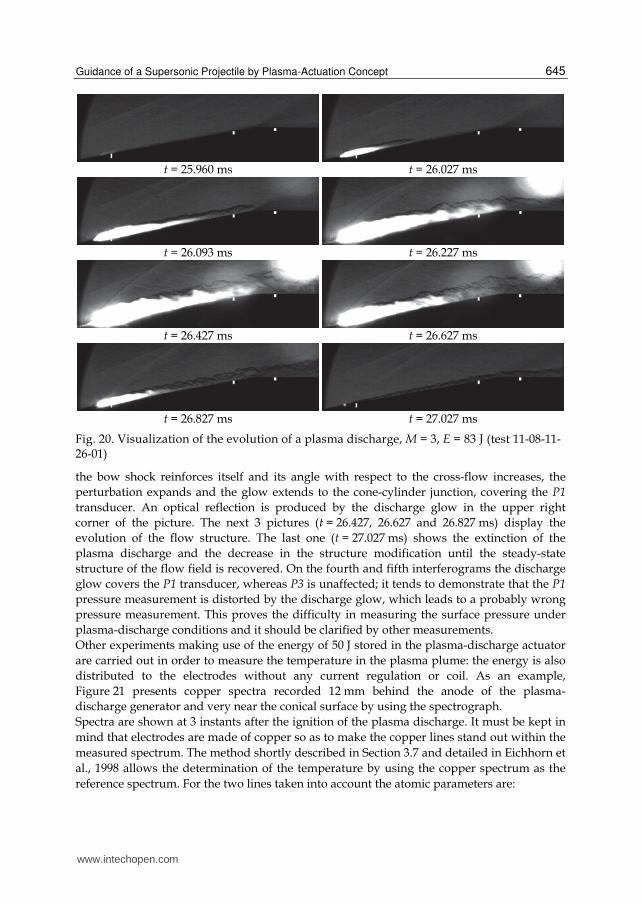
The second test consists of reproducing the same experiment by removing the adhesive tape from the transducers. Figure 19 also shows the absolute pressure recorded on transducers P1, P2 and P4 during the plasma discharge and the current I measured at the same time. The black bars correspond to the instants whose visualizations are presented in Figure 20. This allows the correlation between the pressure and the visualized flow-field structure. The dielectric barrier disruption is also visible on the pressure signals and the amplitude also depends on the transducer-plasma distance. The plasma discharge does not influence the pressure 10 mm ahead of it (P4). The measurement indicates that it produces an underpressure on the conical part just ahead of the cone-cylinder junction (P1), whereas it causes a reinforcement of the pressure in the expansion region just behind the cone-cylinder junction (P3); this is not understandable because it is antinomic. The DI technique is used to visualize the flow-field structure around the model. Interferogram pictures are recorded by using a Photron-Fastcam camera at 15 000 frames per second with a spatial resolution of 896 pixels by 206 pixels and an exposure time of 2 µs. Figure 20 depicts 8 pictures showing the evolution of the plasma discharge. The flow direction is from left to right. The location of the plasma-discharge generator anode is indicated on each picture as well as the location of transducers P1 and P3. The first picture (t = 25.960 ms) corresponds to the ignition of the plasma discharge producing the disruption of the electric barrier and leading to the perturbation on the pressure signals: the shock wave attached to the conical nose is visible in the upper left corner, the boundary layer and the expansion region at the cone-cylinder junction can also be observed. The second picture (t = 26.027 ms) clearly highlights the plasma-discharge glow and the changes in the density gradient in the flow field which interacts with the boundary layer of the model. A slightly visible bow shock forms ahead of the plasma discharge. This instant nearly corresponds to the one at which the pressure levels are recovered after the perturbation due to the plasma-discharge ignition. The third picture (t = 26.093 ms) shows the growth of the plasma discharge, the modification of the boundary layer and the reinforcement of the bow shock in front of the plasma. At this instant, transducer P1 is affected by the structure change, which is not the case of P3, as can be seen in Figure 19. The fourth picture (t = 26.227 ms) is taken when the current is at its maximum:
www.intechopen.com
Guidance of a Supersonic Projectile by Plasma-Actuation Concept
645
t = 25.960 ms t = 26.027 ms
t = 26.093 ms t = 26.227 ms
t = 26.427 ms t = 26.627 ms
t = 26.827 ms t = 27.027 ms
Fig. 20. Visualization of the evolution of a plasma discharge, M = 3, E = 83 J (test 11-08-11-26-01)
the bow shock reinforces itself and its angle with respect to the cross-flow increases, the
perturbation expands and the glow extends to the cone-cylinder junction, covering the P1
transducer. An optical reflection is produced by the discharge glow in the upper right
corner of the picture. The next 3 pictures (t = 26.427, 26.627 and 26.827 ms) display the
evolution of the flow structure. The last one (t = 27.027 ms) shows the extinction of the
plasma discharge and the decrease in the structure modification until the steady-state
structure of the flow field is recovered. On the fourth and fifth interferograms the discharge
glow covers the P1 transducer, whereas P3 is unaffected; it tends to demonstrate that the P1
pressure measurement is distorted by the discharge glow, which leads to a probably wrong
pressure measurement. This proves the difficulty in measuring the surface pressure under
plasma-discharge conditions and it should be clarified by other measurements.
Other experiments making use of the energy of 50 J stored in the plasma-discharge actuator
are carried out in order to measure the temperature in the plasma plume: the energy is also
distributed to the electrodes without any current regulation or coil. As an example,
Figure 21 presents copper spectra recorded 12 mm behind the anode of the plasma-
discharge generator and very near the conical surface by using the spectrograph.
Spectra are shown at 3 instants after the ignition of the plasma discharge. It must be kept in
mind that electrodes are made of copper so as to make the copper lines stand out within the
measured spectrum. The method shortly described in Section 3.7 and detailed in Eichhorn et
al., 1998 allows the determination of the temperature by using the copper spectrum as the
reference spectrum. For the two lines taken into account the atomic parameters are:
www.intechopen.com

Wind Tunnels and Experimental Fluid Dynamics Research
646
Fig. 21. Cu lines in the measured spectrum during a plasma discharge, M = 3, E = 50 J
=1λ 510.554 nm, =1E 30 784 cm-1, =1)(gf 0.0309;
=2λ 515.324 nm, =2E 49 935 cm-1, =2)(gf 0.9772.
The temperature and its uncertainty are calculated by using Equations 1 and 2, respectively, for three different delay times t:
t = 1.025 ms: T = 11 771 K ± 244 K
t = 1.045 ms: T = 11 926 K ± 116 K
t = 1.065 ms: T = 11 239 K ± 143 K.
The maximum temperature reaches about 12 000 K at the location of the measurement point with an uncertainty of ± 240 K.
4.3 Wind-tunnel experiments, M = 3, free-pitching projectile motion The free-pitching projectile motion device defined in Section 3.5 is fixed in the measurement chamber of the wind tunnel (Figure 22). The projectile-model behavior is tested without any plasma discharge in a first step. As mentioned in Section 3.5, at the beginning of the experiment the projectile model is horizontal and remains locked until the steadiness of the supersonic flow is reached. The model is then unlocked and is able to rotate freely around its pitching axis, which is also its center of gravity. The model is stable, which means that the projectile model remains horizontal. About 20 series of experiments are conducted in order to examine the behavior of the projectile model subjected to a plasma discharge. Two series of tests with plasma discharges are analyzed in this section; they are examples, in terms of flow-field visualization, of the projectile-tip displacement corresponding to the angle of attack deviation and of the voltage-current evolution. The plasma discharge is
www.intechopen.com
Guidance of a Supersonic Projectile by Plasma-Actuation Concept
647
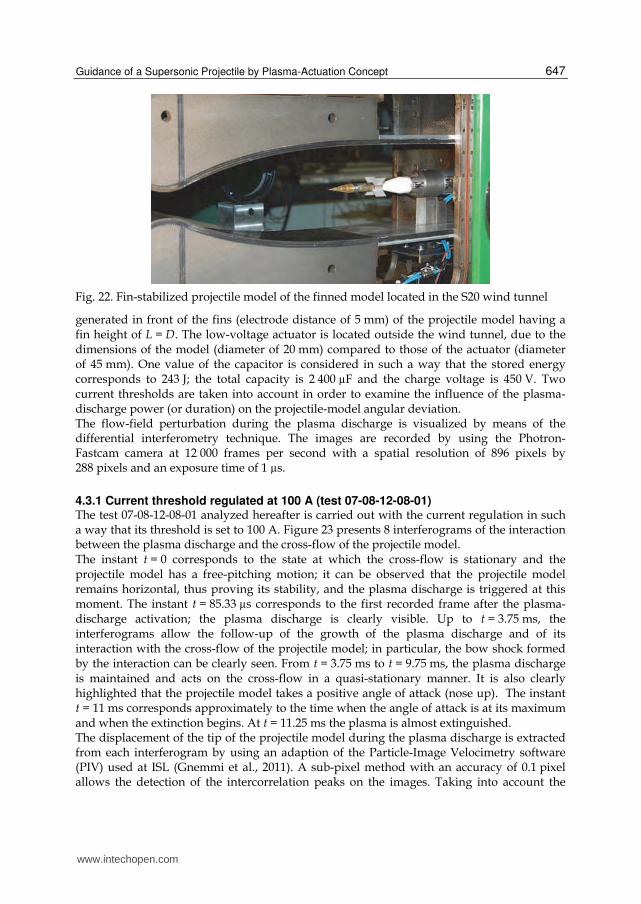
Fig. 22. Fin-stabilized projectile model of the finned model located in the S20 wind tunnel
generated in front of the fins (electrode distance of 5 mm) of the projectile model having a fin height of L = D. The low-voltage actuator is located outside the wind tunnel, due to the dimensions of the model (diameter of 20 mm) compared to those of the actuator (diameter of 45 mm). One value of the capacitor is considered in such a way that the stored energy corresponds to 243 J; the total capacity is 2 400 µF and the charge voltage is 450 V. Two current thresholds are taken into account in order to examine the influence of the plasma-discharge power (or duration) on the projectile-model angular deviation. The flow-field perturbation during the plasma discharge is visualized by means of the differential interferometry technique. The images are recorded by using the Photron-Fastcam camera at 12 000 frames per second with a spatial resolution of 896 pixels by 288 pixels and an exposure time of 1 µs.
4.3.1 Current threshold regulated at 100 A (test 07-08-12-08-01) The test 07-08-12-08-01 analyzed hereafter is carried out with the current regulation in such a way that its threshold is set to 100 A. Figure 23 presents 8 interferograms of the interaction between the plasma discharge and the cross-flow of the projectile model. The instant t = 0 corresponds to the state at which the cross-flow is stationary and the projectile model has a free-pitching motion; it can be observed that the projectile model remains horizontal, thus proving its stability, and the plasma discharge is triggered at this moment. The instant t = 85.33 µs corresponds to the first recorded frame after the plasma-discharge activation; the plasma discharge is clearly visible. Up to t = 3.75 ms, the interferograms allow the follow-up of the growth of the plasma discharge and of its interaction with the cross-flow of the projectile model; in particular, the bow shock formed by the interaction can be clearly seen. From t = 3.75 ms to t = 9.75 ms, the plasma discharge is maintained and acts on the cross-flow in a quasi-stationary manner. It is also clearly highlighted that the projectile model takes a positive angle of attack (nose up). The instant t = 11 ms corresponds approximately to the time when the angle of attack is at its maximum and when the extinction begins. At t = 11.25 ms the plasma is almost extinguished. The displacement of the tip of the projectile model during the plasma discharge is extracted from each interferogram by using an adaption of the Particle-Image Velocimetry software (PIV) used at ISL (Gnemmi et al., 2011). A sub-pixel method with an accuracy of 0.1 pixel allows the detection of the intercorrelation peaks on the images. Taking into account the
www.intechopen.com

Wind Tunnels and Experimental Fluid Dynamics Research
648
Fig. 23. Free-pitching projectile evolution during the plasma discharge, M = 3, E = 243 J (test 07-08-12-08-01)
optical calibration system, the accuracy of the displacement measurement is 34 µm per pixel, leading to a measured angle uncertainty of 10-5 degree. The angle of attack of the projectile model is then determined by the knowledge of its rotation axis location. Figure 24 depicts the evolution of that angle of attack and of the current circulating in the circuit. The instant t = 0 corresponds to the one shown in Figure 23.
Fig. 24. Angle of attack of the fin-stabilized projectile model subjected to a 243 J plasma discharge with a 100-A current regulation (test 07-08-12-08-01)
www.intechopen.com

Guidance of a Supersonic Projectile by Plasma-Actuation Concept
649
Before the activation of the plasma discharge, the projectile model oscillates freely at its
natural pitching frequency of 50.7 Hz. The model starts to move upwards around 2 ms after
the plasma-discharge activation and its angle of attack increases up to a maximum of 2.6°,
nearly corresponding to the extinction of the plasma. Afterwards, the angle of attack
decreases and the projectile oscillates at its pitching frequency in a damped motion.
According to the result found in Section 4.2 concerning the pressure measurements, the
projectile model takes a positive angle of attack as the overpressure generated by the plasma
discharge is located behind the pitching axis, inducing a nose-up moment.
The analysis of the plasma-current profile shows that the plasma-discharge duration is
nearly 9.7 ms and the extinction duration is 1.7 ms. The correlation of the two profiles shows
a delay of about 2 ms between the generation of the plasma discharge and the response of
the projectile model.
Figure 25 presents the evolution of the voltage and of the current measured in the circuit.
The signals are probably perturbed by the fact that the electrodes are eroded and a transfer
of copper occurs from the cathode to the anode, leading to an irregular path of the electric
arc; this irregular electric arc induces voltage fluctuations on the electrodes. The current
regulation at 100 A is perfectly achieved, the mean voltage is 100 V, leading to a mean
power of 10 kW and an energy of 97 J; considering the stored energy of 243 J, the efficiency
is of about 40%.
Fig. 25. Voltage and current in the discharge circuit (test 07-08-12-08-01)
4.3.2 Current threshold regulated at 50 A (test 09-08-12-08-03) The other test 09-08-12-08-03 is carried out with the same energy stored in the actuator, but
it is distributed with a current threshold regulated at 50 A. Figure 26 presents the evolution
of the angle of attack and of the current circulating in the circuit.
The duration of the plasma discharge is of about 25.4 ms, which is higher than the natural pitching period, the latter being lower than 20 ms. The projectile model moves upwards roughly 1 ms after the plasma-discharge activation and reaches its maximum angle of attack of 1.3° nearly after 10 ms; this corresponds to half the natural pitching period. Afterwards, in spite of the plasma being maintained, the angle of attack decreases down to 0.6° near 20 ms. Then, while the plasma is still maintained, the angle of attack increases again up to 1.2° near
www.intechopen.com

Wind Tunnels and Experimental Fluid Dynamics Research
650
28 ms. At 28 ms the plasma is completely extinguished and the angle of attack decreases again and it resumes its natural pitching motion. During the test, it is demonstrated that the projectile model has a mean angle of attack of about 0.9° for a duration nearly equivalent to that of the plasma discharge.
Fig. 26. Angle of attack of the fin-stabilized projectile model subjected to a 243 J plasma discharge with a 50-A current regulation (test 09-08-12-08-03)
Figure 27 presents the evolution of the voltage and the current measured in the circuit. The signals are also perturbed. The current regulation at 50 A is also perfectly reached, the mean voltage is 90 V, yielding a mean power of 4.5 kW and an energy of 114 J; considering the stored energy of 243 J, the efficiency is close to 47%.
Fig. 27. Voltage and current in the discharge circuit (test 09-08-12-08-03)
The results show a significant change in the angle of attack of the projectile about 2 ms after
the plasma-discharge generation of 243 J. However, the experiments cannot demonstrate
that such a plasma discharge induces a significant change in the trajectory of the projectile,
because it is fixed at its gravity center. The remaining questions are: “Does this disturbance
www.intechopen.com

Guidance of a Supersonic Projectile by Plasma-Actuation Concept
651
last long enough to cause the trajectory of the projectile to change?” and “Is the power large
enough for a change in the projectile trajectory to take place?” The trajectory change will be
computed in the future by running a 3-DoF program which will use data extracted from
these experimental results.
4.4 Shock-tunnel experiments: Free-flight projectile behavior at the altitude of 2.5 km, M = 4.5 More experiments are carried out in the shock-tunnel facility to show the free-flight motion
of a projectile under realistic conditions, for the purpose of answering the previous
remaining questions. Therefore, the very light EFP model described in Section 3.6 is hung up
inside the test chamber of the shock tunnel in front of the nozzle. When the membranes of
the shock tube burst, the airflow is accelerated up to the desired pressure, temperature and
flight velocity, leading to M = 4.5 for the altitude of 2.5 km. The Nylon threads and paper
disks break and the projectile can fly freely in the test chamber. Because our main interest
lies in the projectile-model behavior, it is important to focus on the projectile model so that
its trajectory can be determined. Therefore, simple photographs are taken by the Photron-
Fastcam CCD camera, allowing the projectile motion to be recorded and analyzed at a rate
of 10 000 frames per second with an exposure time of 2 µs. Two sets of pictures are taken
during each experiment: one picture of the motion in the horizontal plane and one in the
vertical plane.
4.4.1 Without any plasma discharge (test 02-09-03-11-01) A first test consists of verifying the free-flight stability of the projectile model. Therefore,
Figure 28 presents 6 pictures taken at different instants in the vertical and horizontal planes.
horizontal plane
vertical plane
t = 0 t = 1.2 ms t = 2.4 ms
horizontal plane
vertical plane
t = 3.6 ms t = 4.8 ms t = 6.0 ms
Fig. 28. Visualization of the displacement of the free-flight EFP model, M = 4.5 (test 02-09-03-11-01)
www.intechopen.com

Wind Tunnels and Experimental Fluid Dynamics Research
652
The pictures show the vertical and horizontal displacements of the model without any
plasma discharge. t = 0 corresponds to the burst of the diaphragm and the model is still
hung up in the test chamber. At t = 1.2 ms, the model moves to the right because the flow
comes from the left and the shock-wave patterns are visible. During the complete flight, the
model moves along its longitudinal axis, thus proving its flight stability. It is important to
notice that the electric wires used later for the plasma discharge do not disturb the behavior
of the model during its flight.
The next experiments consist of generating a plasma discharge when the flow field is constant and then analyzing the trajectory of the model. Two test results are presented for 2 plasma discharges generated by different amounts of stored energy in the actuator for the same current threshold of 100 A. The plasma discharge is produced in the horizontal plane in order to avoid the influence of the gravity on the model trajectory.
4.4.2 With a plasma discharge, stored energy of 65 J (test 07-09-03-25-01) The result in Figure 29 is obtained for an energy of 65 J, inducing a plasma duration of 2.5 ms. The latter is deduced from the current measurement depicted on the left-hand side of Figure 31.
horizontal plane
vertical plane
t = 0 ms t = 1.2 ms t = 2.4 ms
horizontal plane
vertical plane
t = 3.6 ms t = 4.8 ms t = 6.0 ms
Fig. 29. Visualization of the displacement of the free-flight EFP model subjected to a plasma discharge, M = 4.5, E = 65 J (test 07-09-03-25-01)
In Figure 29, t = 0 corresponds to the burst of the diaphragm and the model is hung up in
the test chamber. At t = 1.2 ms, the model slightly moves to the right and the plasma
discharge is activated on the ogive of the model at the beginning of the free-flight motion. At
t = 2.4 ms, i.e. about 1.2 ms after the plasma-discharge activation, the plasma is shown by
the glow on the pictures: in the horizontal plane, the plasma is produced on one side of the
model and in the vertical plane, the plasma acts symmetrically on the model. Shock-wave
www.intechopen.com

Guidance of a Supersonic Projectile by Plasma-Actuation Concept
653
patterns can also be seen, but the detailed structure of the flow field does not appear as it is
a simple photograph. At t = 3.6 ms, the plasma extinguishes itself and the model moves in
the opposite direction to the plasma. From t = 4.8 ms, the plasma is extinguished and the
model continues to move in the opposite direction to the plasma, whereas it keeps its
rectilinear trajectory in the vertical plane.
4.4.3 With a plasma discharge, stored energy of 120 J (test 08-09-03-26-01) The result in Figure 30 is obtained for an energy of 120 J, which is about twice the energy of
the previous test, leading to a plasma duration of 4.5 ms.
horizontal plane
vertical plane
t = 0 ms t = 1.2 ms t = 2.4 ms
horizontal plane
vertical plane
t = 3.6 ms t = 4.8 ms t = 6.0 ms
Fig. 30. Visualization of the displacement of the free-flight EFP model subjected to a plasma discharge, M = 4.5, E = 120 J (test 08-09-03-26-01)
At t = 0 the model is hung up in the test chamber. At t = 1.2 ms, the model slightly moves to
the right and the plasma discharge is activated on the ogive. At t = 2.4 ms, the model begins
to deviate from its trajectory in the horizontal plane. From t = 2.4 ms to 4.8 ms, the plasma is
delivered to the electrodes with a constant power. In the end (t = 6.0 ms), the plasma is
extinguished, the model continues to move in the opposite direction to the plasma, reaching
an angle of attack of about 11° and a slight translation is observed in the vertical plane.
4.4.4 Comparison of the results with a plasma discharge Figure 31 shows the voltage and current measurements recorded during the previous tests
demonstrating the correct control of the current delivered to the plasma discharge. The
plasma duration is deduced from the current measurement.
Each picture recorded during the tests is analyzed in order to reproduce the displacement of
the model tip. A displacement of 45 mm represents 270 pixels in the vertical plane and
www.intechopen.com

Wind Tunnels and Experimental Fluid Dynamics Research
654
E = 65 J (test 07-09-03-25-01) E = 120 J (test 08-09-03-26-01)
Fig. 31. Voltage and current measurements during the free-flight EFP model subjected to a plasma discharge, M = 4.5
41 mm corresponds to 251 pixels in the horizontal one. An error of less than ± 2 pixels is
estimated for the analysis, leading to a displacement error lower than ± 0.3 mm. Figure 32
shows the analysis of the displacement in the horizontal and vertical planes for the tests 07
and 08. In the case of the test 08, the lateral displacement is 21 mm for a longitudinal
displacement of 86 mm.
-5
0
5
10
15
20
25
0 40 80 120 160
y, z [
mm
]
x [mm]
test No. 07, vertical plane
test No. 07, horizontal plane
test No. 08, vertical plane
test No. 08, horizontal plane
Fig. 32. Displacement measurement during a plasma discharge, M = 4.5 (tests 07-09-03-25-01 and 08-09-03-26-01)
According to results found in the previous Sections concerning the pressure measurements
and the pitching-motion analysis, the plasma discharge producing an overpressure on the
projectile model leads to a negative angle of attack. Indeed, this overpressure generated by
the plasma discharge is mainly located in front of the gravity center of the model, creating a
nose-down moment and a lateral displacement opposite to the plasma discharge.
5. Conclusion
The ISL wind-tunnel and shock-tube facilities have been used for studying in detail the
interaction of a plasma discharge generated on the projectile surface with its supersonic
cross-flow by using a low-voltage plasma actuator. A current controller has been developed
www.intechopen.com

Guidance of a Supersonic Projectile by Plasma-Actuation Concept
655
in order to generate a power-controlled plasma discharge anywhere on the surface of any
aerial vehicle.
Pressure and temperature measurements as well as flow-field visualizations were carried
out in the wind tunnel at a Mach number of 3. The plasma discharge was produced on the
conical part of a projectile model of a 50 mm diameter in which the plasma actuator was
embedded. Flow fields were visualized by means of a CCD camera located behind a
differential interferometer or a schlieren method set-up. These measurements and
visualizations allowed the analysis of the perturbation evolution along the projectile surface
due to the plasma discharge. Some difficulties occurred during the pressure-measurement
experiments probably due to the radiation of the plasma; however, the plasma was expected
to produce an overpressure. The spectrography technique was used for obtaining the copper
spectrum which allowed the determination of the temperature in the plasma plume. The
main result was that a maximum temperature of about 12,000 K was obtained 12 mm behind
the plasma-discharge generator anode and very near the conical surface.
The wind tunnel was also used for demonstrating that the plasma discharge generated the
angular deviation of a 20-mm-caliber fin-stabilized projectile, but the low-voltage plasma
actuator was outside the model. For a 243 J stored energy, an angle of attack of 2.6° was
reached by means of a power-controlled plasma discharge of 10 kW delivered in 9.7 ms in
front of the projectile-model fins. For the same stored energy, a constant angle of attack of
0.9° was reached by means of another power-controlled plasma discharge of 4.5 kW
delivered in 25.4 ms at the same location. The efficiency of the actuation system was nearly
of 40% to 50%. However, the experiments could not demonstrate that such a plasma
discharge induced a significant change in the trajectory of the projectile, because it was fixed
at its gravity center. The remaining questions are: “Does this disturbance last long enough to
cause the trajectory of the projectile to change?” and “Is the power large enough for a
change in the projectile trajectory to take place?” The trajectory change will be computed in
the future by running a 3-DoF program which will use data extracted from these
experimental results.
The shock tunnel proved to be a facility well adapted to the experimental study of the
steering of a supersonic projectile flying under low-atmosphere conditions. Flow-field
visualizations showed that a plasma discharge produced on the ogive of a projectile flying
at an altitude of 2.5 km and at a Mach number of 4.5 could deviate a projectile from its
trajectory. The angular deviation of 11° was demonstrated with a very light flare-stabilized
Explosively-Formed-Projectile with the low-voltage plasma actuator mounted outside the
shock tunnel.
The studies will continue in wind-tunnel and shock-tube facilities with new surface-
pressure measurements with the purpose of confirming the results obtained up to now.
Other experiments will be conducted with the aim of increasing the angular deviation of the
projectile and of evaluating the trajectory deviation. Some experiments will go on in order to
increase the plasma-discharge lifetime, maintaining the angle of attack for a longer duration.
New experiments will be carried out, simulating the application of the concept to a spin-
stabilized projectile.
The electrodes of such a type of plasma actuator can be mounted anywhere on the projectile
surface or embedded in other parts of it, especially in fins, canards, etc. This concept can also
be applied to other subsonic, supersonic or hypersonic flying vehicles such as missiles,
www.intechopen.com
Wind Tunnels and Experimental Fluid Dynamics Research
656
UAVs, MAVs, waveriders, etc. However, an optimization phase will be necessary for each
application and this is long-term work. This is due to the fact that the resulting aerodynamic
forces and moments depend on the Mach number, angle of attack, number of actuators,
delivered energy and voltage, actuator location, electrode distance, etc.
6. Acknowledgements
The authors thank the Aerodynamics and Wind-Tunnel and the Aerothermodynamics and Shock-Tube Department staff members for their efficiency. In particular, they want to highlight the professionalism of Denis Bidino, Michel Meister and Dominique Willme who allowed the wind-tunnel tests to take place. Myriam Bastide, in charge of the optical visualization, Berthold Sauerwein and Jean-Luc Striby, in charge of the shock tunnel and Remy Kempf as technician, are warmly thanked for the very good quality of the shock-tunnel experiments. Alfred Eichhorn, responsible for the difficult temperature measurements is also associated in our success.
7. References
Asghar, A., Jumper, E.J. & Corke, T.C. (2006). On the Use of Reynolds Number as the Scaling
Parameter for the Performance of Plasma Actuator in a Weakly Compressible Flow,
AIAA Paper 2006-21
Balcer, B.E., Franke, M.E. & Rivir, R.B. (2006). Effects of Plasma Induced Velocity on
Boundary Layer Flow, AIAA Paper 2006-875
Berner, C. & Dupuis, A. (2001). Wind Tunnel Tests of a Grid Finned Projectile
Configuration, 39th Aerospace Sciences Meeting & Exhibit, Reno/NV, USA, January
08-11, AIAA Paper 2001-0105
Berner, C. & Dupuis, A. (2002). Wind Tunnel Tests of a Long-Range Artillery Shell Concept,
AIAA Atmospheric Flight Mechanics Conference and Exhibit, Monterey/CA, USA,
August 5-8, AIAA Paper 2002-4416
Berner, C., Fleck, V. & Dupuis, A. (2002). Experimental and Computational Analysis for a
Long-Range Spinning Artillery Shell with Lifting Surfaces, 20th International
Symposium on Ballistics, Orlando/FL, USA, September 23-27
Corke, T.C., Cavalieri, D. & Matlis, E.H. (2001). Boundary Layer Instability on a Sharp Cone
at Mach 3.5 with Controlled Input, AIAA Journal, Vol. 40, No. 55, pp. 1015-1018
Corke, T.C., He C. & Patel, M. (2004). Plasma Flaps and Slats: an Application of Weakly-
Ionized Plasma Actuators, AIAA Paper 2004-2127
Corke, T.C., Mertz, B. & Patel, M.P. (2006). Plasma Flow Control Optimized Airfoil, AIAA
Paper 2006-1208
Corke, T.C., Post, M..L. & Orlov, D.M. (2009). Single Dielectric Barrier Discharge Plasma
Enhanced Aerodynamics: Physics, Modelling and Applications, Experiments in
Fluids, Vol. 49, pp. 1-26
Do, H., Kim, W., Mungal, M. & Capelli, M. (2007). Bluff Body Flow Control Using Surface
Dielectric Barrier Discharges, AIAA Paper 2007-0939
Douville, T., Stephens, J., Corke, T.C. & Morris, S.C. (2006). Turbine Blade Tip Leakage Flow
Control by Partial Squealer Tip and Plasma Actuators, AIAA Paper 2006-20
www.intechopen.com

Guidance of a Supersonic Projectile by Plasma-Actuation Concept
657
Dupuis, A. & Berner, C. (2001). Aerodynamic Aspects of a Grid Finned Projectile at Subsonic
and Supersonic Velocities, 19th International Symposium on Ballistics, Interlaken,
Switzerland, May 7-11
Dupuis, A., Berner, C. & Fleck, V. (2004). Aerodynamic Characteristics of a Long-Range
Spinning Artillery Shell. Part 1: From Aeroballistic Range Free-Flight Tests, 21st
International Symposium on Ballistics, Adelaide, Australia, April 19-23
Eichhorn, A., Mach, H. & Rösch, D. (1998). Optische und spektroskopische Untersuchungen
an einem Plasmabrenner mit evakuierbarer Messkammer und Ermittlung der
Plasmatemperatur mit Hilfe von Kupferlinien, ISL Report R 124/98
Elias, P.Q., Chanetz, B., Larigaldie, S. & Packan, D. (2007a). Study of the Effect of Glow
Discharges Near a M = 3 Bow Shock, AIAA Journal, Vol. 45, No. 9, pp. 2237-2245,
Sept. 2007
Elias, P.Q., Chanetz, B., Larigaldie, S., Packan, D. & Laux, C.O. (2007b). Mach 3 Shock Wave
Unsteadiness Allevation Using a Negative Corona Discharge, AIAA Journal, Vol. 46,
No. 8, pp. 2042-2049, Sept. 2007
Girgis, I.,G., Shneider, M.N., Macheret, S.O., Brown, R.B. & Miles, R.B. (2006). Steering
Moments Creation in Supersonic Flow by Off-Axis Plasma Heat Addition, Journal of
Spacecraft and Rockets, Vol. 43, No. 3, pp. 607-613, May-June 2006
Gnemmi, P. & Seiler, F. (2000). Interaction of a Lateral Jet with the Projectile External Flow,
Atmospheric Flight Mechanics Conference & Exhibit, Denver/CO, USA, August 14-17,
AIAA Paper 2000-4196
Gnemmi, P., Samirant, M. & Charon, R. (2002). ISL, Saint-Louis, France, French Patent for
“Pilotage d’un projectile par décharge plasma,” No. 02 12906 filed 17 Oct. 2002,
issued 7 Jan. 2005. US Patent for “Projectile Steering by Plasma Discharge,”
No. US 7,002,126 B2 filed 17 Oct. 2003, issued 21 Feb. 2006
Gnemmi, P. & Rey, C (2005). ISL, Saint-Louis, France, French Patent for “Nouveau dispositif
embarqué de génération de décharge(s) plasma pour le pilotage d’un engin
supersonique ou hypersonique,” No. 05 09831 filed 27 Sept. 2005, issued 14 Dec.
2007. US Patent for “Low Voltage Device for the Generation of Plasma Discharge to
Operate a Supersonic or Hypersonic Apparatus,” No. US 11/525,169 filed on
22 Sept. 2006, issued 12 Jan. 2010
Gnemmi, P. & Schäfer, H.J. (2005). Experimental and Numerical Investigations of a
Transverse Jet Interaction on a Missile Body, 43rd AIAA Aerospace Sciences Meeting
and Exhibit, Reno/NV, USA, January 10-13, , AIAA Paper 2005-0052
Gnemmi, P., Eichhorn, A., Leopold, F., Schäfer, H.J., Emunds, H., Esch, H., & Gülhan, A.
(2006). Experimental and Computational Study of the Interaction between a Lateral
Jet and the Supersonic External Flow on a Generic Missile Body, NATO-RTO
Symposium on Innovative Missile Systems, AVT-135/RSY, Amsterdam, The
Netherlands, May 15-18, ISL report PU 622/2006
Gnemmi, P., Charon, R., Dupéroux J.P. & George A. (2008) Feasibility Study for Steering a
Supersonic Projectile by a Plasma Actuator, AIAA Journal, Vol. 46, No. 6, pp. 1308-
1317
www.intechopen.com

Wind Tunnels and Experimental Fluid Dynamics Research
658
Gnemmi, P. & Rey C. (2008). Plasma Actuation for the Control of a Supersonic Projectile,
Atmospheric Flight Mechanics Conference & Exhibit, August 18–21, 2008, Honolulu,
Hawaii, AIAA Paper 2008-6885
Gnemmi, P. & Rey C. (2009). Plasma Actuation for the Control of a Supersonic Projectile,
AIAA Journal of Spacecraft and Rockets, Vol. 46, No. 5, pp. 989-998, Sep.-Oct. 2009
Gnemmi, P., Srulijes, J. & Seiler, F. (2011). Overview of Activities at the ISL Hypersonic
Shock Tunnels, Int. J. Engineering Systems Modelling and Simulation, Vol. 3, Nos. 1/2
Goeksel, B., Rechenberg, I., Greenblatt, D. & Paschereit, C. (2006). Steady and Unsteady
Plasma Wall Jets for Separation and Circulation Control, AIAA Paper 2006-3686
Havermann, M., Seiler, F., Ende, H. & George, A. (2004). Untersuchungen im Stossrohr-
Windkanal zur Steuerung eines Hochgeschwindigkeits-Flugkörpers mit
Seitenstrahlen, ISL report RV 232/2004
Huang, J. (2005). Documentation and Control of Flow Separation on a Linear Cascade of
Pak-B Blades Using Plasma Actuators, Dissertation, University of Notre Dame
Huang, J., Corke, T.C. & Thomas, F.O. (2006a). Plasma Actuators for Separation Control of
Low Pressure Turbine Blades, AIAA Journal, Vol. 44, No. 1, pp. 51-57, January 2006
Huang, J., Corke, T.C. & Thomas, F.O. (2006b). Unsteady Plasma Actuators for Separation
Control of Low-Pressure Turbine Blades, AIAA Journal, Vol. 44, No. 7, pp. 1477-
1483, July 2006
Kosinov, A, Maslov, A & Shevelkov, S (1990). Experiments on the Stability of Supersonic
Laminar Boundary Layers, Journal of Fluid Mechanics, pp. 219: 621
Kuo, S.P. (2007). Plasma Mitigation of Shock Wave: Experiments and Theory, Shock Waves,
Vol. 17, pp. 225–239
Massey, K.C., McMichael, J., Warnock, T. & Hay, F. (2004). Design and Wind Tunnel Testing
of Guidance Pins for Supersonic Projectiles, Georgia Inst. of Technology / GTRI /
ATAS Report, Atlanta/GA, USA, Dec. 2004
Matlis, E.H. (2004). Controlled Experiments on Instabilities and Transition to Turbulence on
a Sharp Cone at Mach 3.5. Dissertation, University of Notre Dame
Nelson, C., Cain, A., Patel, M. & Corke, T.C. (2006). Simulation of Plasma Actuators Using
the Wind-US Code, AIAA Paper 2006-634
Nelson, R., Corke, T.C., Patel M. & Ng, T. (2007). Modification of the Flow Structure over a
UAV Wing for Roll Control, AIAA Paper 2007-0884
Oertel, H. (1966). Stossrohre, Springer Verlag, Wien-New York, Austria
Patel, M.P., Prince, T.S., Carver, R., DiCocco, J.M., Lisy, F.J. & Ng, T.T. (2002). Deployable
Flow Effectors for Phantom Yaw Control of Missiles at High Alpha, 1st Flow Control
Conference, St.-Louis/MO, USA, June 24-26, AIAA Paper 2002-2827
Patel, M.P., Sowle, Z.H., Corke, T.C. & He, C. (2006). Autonomous Sensing and Control of
Wing Stall Using a Smart Plasma Slat, AIAA Paper 2006-1207
Patz, G. (1970). Das Hyperschallstossrohrlabor des ISL, 3. Teil: Stossrohr B, ISL Report
N 30/70
Patz, G. (1971). Das Hyperschallstossrohrlabor des ISL, 2. Teil: Stossrohr A, ISL Report
N 27/71
Porter, C., McLaughlin, T., Enloe, L. & Font, G. (2007). Boundary Layer Control Using DBD
Plasma Actuator, AIAA Paper 2007-0786
www.intechopen.com
Guidance of a Supersonic Projectile by Plasma-Actuation Concept
659
Post, M.L. (2004). Plasma Actuators for Separation Control on Stationary and Unstationary
Airfoils, Dissertation, University of Notre Dame
Post, M.L. & Corke, T.C. (2004a). Separation Control Using Plasma Actuators - Stationary
and Oscillatory Airfoils, AIAA Paper 2004-0841
Post, M.L. & Corke, T.C. (2004b). Separation Control on High Angle of Attack Airfoil Using
Plasma Actuators, AIAA Journal, Vol. 42, No. 11, pp. 2177-2187, November 2004
Rivir, R. (2007). Effects of Pulsed dc Discharge Plasma Actuators in a Separated LPT
Boundary Layer, AIAA Paper 2007-0942
Rizzetta, D. & Visbal, M. (2007). Numerical Investigation of Plasma-Based Flow Control for
a Transitional Highly-Loaded Low-Pressure Turbine, AIAA Paper 2007-0938
Rondot, F & Berner, C. (1998). Performance of Aerodynamically Optimized EFP Simulants,
17th International Symposium on Ballistics, Midrand, South Africa, March 23-27
Schäfer, H.J., Augenstein, E., Esch, H. & Emunds, H. (2001). Experimental Investigation of
Transverse Jet Interaction on a Missile Body Using Laser Velocimetry and Flow
Visualization,” IEEE Xplore Digital Library, 19th International Congress on
Instrumentation in Aerospace Simulation Facilities, Cleveland/OH, USA, August 27-30
Seiler, F., Gnemmi, P., Ende, H., Schwenzer, M. & Meuer R. (2003). Jet Interaction at
Supersonic Cross-Flow Conditions,” Shock Waves, Vol. 13, No. 1, pp. 13-23, July
2003
Shneider, M.N., Macheret, S.O., Zaidi, S.H., Girgis, I.G. & Miles, R.B. (2008). Virtual Shapes
in Supersonic Flow Control with Energy Addition, Journal of Propulsion and Power,
Vol. 24, No. 5, pp. 900-915, Sept.-Oct. 2008
Silton, S.I. (2004). Comparison of Predicted Actuator Performance for Guidance of
Supersonic Projectiles to Measured Range Data, 22nd Applied Aerodynamics
Conference and Exhibit, Providence/Rhode Island, USA, August 16-19, AIAA Paper
2004-5195
Smeets, G. & George, A. (1978). Instantaneous Laser Doppler Velocimeter Using a Fast
Wavelength Tracking Michelson Interferometer, Rev. Sci. Instrumentation, Vol. 49,
No. 11, pp. 1589-1596
Smeets, G., Patz, G., Srulijes, J., Seiler, F. & Havermann, M. (1980-2009). Software Codes
Developed in the Shock-Tube Laboratory of ISL
Smeets, G. (1990). Interferometry, ISL Report CO 214/90, May 1990
Srulijes, J., Seiler, F., Hennig, P. & Gleich, P. (2004). Visualisierung der Umströmung von
Lenkflügeln im Stoßrohr-Windkanal bei realen atmosphärischen
Strömungsbedingungen, ISL report RV 229/2004
Suzen, Y., Huang, G. & Ashpis, D. (2007). Numerical Simulations of Flow Separation
Control in Low-Pressure Turbines Using Plasma Actuators, AIAA Paper 2007-0937
Thomas, F.O., Kozlov, A. & Corke, T.C. (2006). Plasma Actuators for Bluff Body Flow
Control, AIAA paper 2006-2845
Van Ness, D.K., Corke, T.C. & Morris, S.C. (2006). Turbine Tip Clearance Flow Control
Using Plasma Actuators, AIAA Paper 2006-21
Visbal, M.R. & Gaitonde, D.V. (2006). Control of Vortical Flows Using Simulated Plasma
Actuators, AIAA Paper 2006-505
www.intechopen.com

Wind Tunnels and Experimental Fluid Dynamics Research
660
Wey, P., Berner, C., Sommer, E., Fleck, V., & Moulard, H. (2005). Theoretical Design for a
Guided Supersonic Projectile, 22nd International Symposium on Ballistics, Vancouver,
BC, Canada
Yamanaka, T. & Tanaka, H. (1996). “Effects of Impulsive Thruster on Exterior Ballistics
Accuracy Improvement for a Hypervelocity Rocket, 16th International Symposium on
Ballistics, San Francisco/CA, September 23-27
www.intechopen.com

Wind Tunnels and Experimental Fluid Dynamics ResearchEdited by Prof. Jorge Colman Lerner
ISBN 978-953-307-623-2Hard cover, 709 pagesPublisher InTechPublished online 27, July, 2011Published in print edition July, 2011
InTech EuropeUniversity Campus STeP Ri Slavka Krautzeka 83/A 51000 Rijeka, Croatia Phone: +385 (51) 770 447 Fax: +385 (51) 686 166www.intechopen.com
InTech ChinaUnit 405, Office Block, Hotel Equatorial Shanghai No.65, Yan An Road (West), Shanghai, 200040, China
Phone: +86-21-62489820 Fax: +86-21-62489821
The book “Wind Tunnels and Experimental Fluid Dynamics Research†is comprised of 33 chaptersdivided in five sections. The first 12 chapters discuss wind tunnel facilities and experiments in incompressibleflow, while the next seven chapters deal with building dynamics, flow control and fluid mechanics. Third sectionof the book is dedicated to chapters discussing aerodynamic field measurements and real full scale analysis(chapters 20-22). Chapters in the last two sections deal with turbulent structure analysis (chapters 23-25) andwind tunnels in compressible flow (chapters 26-33). Contributions from a large number of international expertsmake this publication a highly valuable resource in wind tunnels and fluid dynamics field of research.
How to referenceIn order to correctly reference this scholarly work, feel free to copy and paste the following:
Patrick Gnemmi and Christian Rey (2011). Guidance of a Supersonic Projectile by a Plasma-ActuationConcept, Wind Tunnels and Experimental Fluid Dynamics Research, Prof. Jorge Colman Lerner (Ed.), ISBN:978-953-307-623-2, InTech, Available from: http://www.intechopen.com/books/wind-tunnels-and-experimental-fluid-dynamics-research/guidance-of-a-supersonic-projectile-by-a-plasma-actuation-concept

© 2011 The Author(s). Licensee IntechOpen. This chapter is distributedunder the terms of the Creative Commons Attribution-NonCommercial-ShareAlike-3.0 License, which permits use, distribution and reproduction fornon-commercial purposes, provided the original is properly cited andderivative works building on this content are distributed under the samelicense.