guidance for ecological risk assessment - environmental quality
TRANSCRIPT

GUIDANCE FOR ECOLOGICAL RISKASSESSMENT: LEVELS I, II, III, IV
Oregon Department of Environmental QualityWaste Management & Cleanup Division
Cleanup Policy & Program Development Section811 SW 6th Avenue
Portland, Oregon 97204(503) 229-6251
FINALApril 1998
SECTION Last UpdateLEVEL I Scoping 11 / 98LEVEL II Screening 12 / 01LEVEL II Screening Benchmark Values 12 / 01LEVEL III Baseline 03 / 00LEVEL IV Field Baseline 11 / 98
This document is intended as guidance for employees of the Department of Environmental Quality (DEQ). DEQguidance does not constitute rulemaking by the Environmental Quality Commission and may not be relied upon tocreate a right or benefit, substantive or procedural, enforceable at law or in equity, by any person. DEQ may take
action at variance with this guidance.

Oregon Department of Environmental QualityGUIDANCE FOR ECOLOGICAL RISK ASSESSMENT
LEVEL I - SCOPING
Updated November 1998 I - 1
INTRODUCTIONThe DEQ ecological risk assessment process consists of four distinct levels, as follows (and asshown in Figure 1):
• Level I Scoping• Level II Screening• Level III Baseline• Level IV Field Baseline
Within and between these levels are a number of Technical/Management Decision Points (TMDP).Based on the information developed and presented within a given level, these TMDPs determineone of three recommendations:
• No further ecological investigations at the site, or• Continuation of the risk assessment process at the next level, or• Undertake (beyond Level I only) a removal or remedial action.
The outcome of each level of the assessment should be documented in writing. Thoroughdocumentation will provide a future reference for any other site-related activities involving ahazardous substance release, future site remedial actions, or onsite monitoring.
Prior to undertaking any ecological risk assessment pursuant to OAR 340-122-084, risk assessorsshould have read and be familiar with the terms, concepts, and approaches discussed in thefollowing documents:
• USEPA Proposed Guidelines for Ecological Risk Assessment (61 FR 47552, 9/9/96)• USEPA Region X Supplemental Ecological Risk Assessment Guidance for Superfund
(EPA 910-R-97-005, June 1997)• ORS 465.315• OAR 340-122-010 through -115• State of Oregon Level I, II, III, and IV Ecological Risk Assessment Guidance
OBJECTIVELevel I is a conservative qualitative determination of whether there is any reason to believe thatecological receptors and/or exposure pathways are present or potentially present at or in thelocality of the facility. Scoping is intended to identify sites that are obviously devoid ofecological important species or habitats and/or where exposure pathways are obviouslyincomplete.

Oregon Department of Environmental QualityGUIDANCE FOR ECOLOGICAL RISK ASSESSMENT
LEVEL I - SCOPING
Updated November 1998 I - 2
PREREQUISITESA release or suspected release of a hazardous substance.
TASKS (see Figure 2)(1) Assess existing data Prior to visiting the site, obtain as much information regarding the
following as possible:(a) Surface area of the site;(b) Present and historical uses of the site and nearby properties;(c) Current and reasonably likely future land and/or water use(s);(d) Sensitive environments (as defined by OAR 340-122-115(49)) at, adjacent to, or in
the locality of the site;(e) Known or suspected presence of threatened and/or endangered species or their
habitat in the locality of the facility (as evidenced by response letters from the U.S.Fish & Wildlife Service (USFWS) and the Oregon Department of Fish and Wildlife(ODFW). For coastal sites, contact with the National Marine Fisheries Service(NMFS) may also be required;
(f) Accurate site and regional maps showing structures, sampling locations, land use,wetlands, surface water bodies, sensitive environments, etc.;
(g) Types of hazardous substances reportedly released at the site;(h) Magnitude and extent of migration of any hazardous substances reportedly released
at the site. (2) Initial site visit A visit to the site to directly assess ecological features and conditions is
mandatory. Involvement of an ecologist or biologist with risk assessment experience ispreferred. The site visit should be conducted at a time of the year when ecological featuresare most apparent, i.e., spring, summer, early fall. Visits during the winter months orperiods of severe weather are unlikely to produce convincing evidence of thepresence/absence of receptors and exposure pathways. The site itself, areas adjacent tothe site, and areas in the locality of the site (as defined by OAR 340-122-115(34)) shouldall be visited. The size and complexity of the site will determine the time needed for thisinitial visit. While at the site, the following activities should be performed:(a) Look for any signs (e.g. visual, olfactory, etc.) of a chemical release;(b) Sketch the site topography, with special emphasis to surface water drainages and
other potential hazardous substance migration pathways;(c) Note any evident (e.g. visual, olfactory, etc.) signs of hazardous substance
migration within the site or offsite;(d) Look for signs of threatened and/or endangered species or their habitat within or
adjacent to the site;

Oregon Department of Environmental QualityGUIDANCE FOR ECOLOGICAL RISK ASSESSMENT
LEVEL I - SCOPING
Updated November 1998 I - 3
(e) As appropriate, note any evident signs (seeps, springs, cutbanks, etc.) forgroundwater discharge to the surface;
(f) Note any natural or anthropogenic disturbances onsite;(g) Make a photographic record of the site, with emphasis on ecological features and
potential exposure pathways;(h) Complete the Ecological Scoping Checklist (Attachment 1).
(3) Identify contaminants of interest (COIs) Identification of contaminants of interest for
ecological receptors may necessitate a separate identification process than that used forany human health evaluation, since a contaminant not generally considered a threat tohuman health may be a threat to biota. The list of COIs may be developed using either site-specific historical information or the results of chemical analyses of suspected sourcemedia. For Level I, the site-specific history of hazardous substance uses and releases ismore typically the source of potential contaminant information. Although the focus isgenerally on hazardous substances alone, the assessment should consider whether otherstressors, such as mechanical disturbance or unusual water quality parameters, arepotentially contributing to adverse effects. These other stressors should be identified toprovide an insight into the broader ecological situation. The results of this evaluation aresummarized by completing Attachment 1, Parts � and �.
(4) Evaluate receptor-pathway interactions Make an estimate, based on the site-specific
information gathered in the previous three tasks and professional judgment, as to whethercomplete exposure pathways exist between COIs in a specific environmental media andecologically important receptors associated with that media (e.g., between hazardoussubstances in surface water and fish). The results of this evaluation are summarized bycompleting Attachment 2.(a) For the purpose of completing Attachment 2, complete exposure pathways are those
that have: a source and mechanism for hazardous substance release to theenvironment, an environmental transport medium for the hazardous substance, apoint of receptor contact (exposure point) with the contaminated media, and anexposure route to the receptor at the exposure point.
(b) For the purpose of completing Attachment 2, any of the following are considered“ecologically important” species:(i) Individual listed threatened and endangered species;(ii) Local populations of species that are recreational and/or commercial
resources;(iii) Local populations of any species with a known or suspected susceptibility
to the hazardous substance(s);

Oregon Department of Environmental QualityGUIDANCE FOR ECOLOGICAL RISK ASSESSMENT
LEVEL I - SCOPING
Updated November 1998 I - 4
(iv) Local populations of vertebrate species;(v) Local populations of invertebrate species that:
§ Provide a critical (i.e., not replaceable) food resource for higherorganisms and whose function as such would not be replaced by moretolerant species; or
§ Perform a critical ecological function (such as organic matterdecomposition) and whose function would not be replaced by otherspecies; or
§ Can be used as a surrogate measure of adverse effects for individuals orpopulations of other species.
(c) For the purpose of completing Attachment 2, “ecologically important” plants arethose that form the habitat for an ecologically important species as defined aboveor are themselves listed as threatened and endangered species.
(d) Because they are not members of natural communities, any of the following shouldnot be considered “ecologically important” species for the purpose of completingAttachment 2:(i) Pest and opportunistic species that populate an area entirely because of
artificial or anthropogenic conditions;(ii) Domestic animals (e.g., pets and livestock);(iii) Plants or animals whose existence is maintained by continuous human
intervention (e.g., fish hatcheries, agricultural crops). (5) Submit Level I deliverable This deliverable is a brief memorandum (see Attachment 3,
Site Ecology Scoping Report, for suggested format and contents) detailing the results of thedata review, site visit, and evaluation of receptors and pathways. It should presentinformation in sufficient depth to give risk managers confidence in determining whetherreceptors and exposure pathways are or are not likely to exist at the site.(a) Attachment 3, Items 1a through 1g are 1-2 paragraph summaries of site conditions,
making reference to Items 4a through 4f as appropriate.(b) Attachment 3, Item 2a is Part � of Attachment 1.(c) Attachment 3, Item 2b includes, at a minimum, Part � of Attachment 1, as well as
any other site-specific observations that the responsible party wishes to include.(d) Attachment 3, Item 2c includes, at a minimum, Part � of Attachment 1, as well as
any other site-specific observations that the responsible party wishes to include.(e) Attachment 3, Item 2d discusses efforts to observe ecologically important species
and/or habitats, particularly listed threatened or endangered species (or theirhabitat) at or adjacent to the site. Any such species or habitats should be noted onPart � of Attachment 1.

Oregon Department of Environmental QualityGUIDANCE FOR ECOLOGICAL RISK ASSESSMENT
LEVEL I - SCOPING
Updated November 1998 I - 5
(f) Attachment 3, Item 2e includes, at a minimum, Attachment 2, as well as any othersite-specific observations that the responsible party wishes to include.
(g) Attachment 3, Item 3 describes recommendations made on the basis of specificcriteria associated with TMDP 1.
(6) TMDP 1: Ecological Risk Suspected? Based on information presented in the Level I
deliverable, do potential ecological receptors and potentially complete exposure pathwaysexist at or in the locality of the site? Specific criteria are as follows:(a) If any of the “Y” or “U” boxes in Attachment 2 are checked, then a recommendation
to move to Level II should be made. In completing this Attachment, a lack ofknowledge, presence of high uncertainty, or any “unknown” circumstances shouldbe tabulated as a “U”.(i) Note that a “Y” answer for any section requires that all three questions
within that section be answered “Y” or “U”.(b) If all of the “No” boxes in Attachment 2 are checked, then the site is highly unlikely
to present significant risks to ecological receptors and a recommendation for nofurther ecological investigations should be made.
ADDITIONAL INFORMATIONUSEPA. 1992. Briefing the BTAG: Initial Description of Setting, History, and Ecology of a
Site. Publication 9345.0-05I, Eco Update Intermittent Bulletin 1(5). Office of Emergency andRemedial Response, U.S. Environmental Protection Agency, Washington, DC.
USEPA. 1994. Selecting and Using Reference Information in Superfund Ecological RiskAssessments. Publication 9345.0-10I, Eco Update Intermittent Bulletin 2(4). EPA 540-F-94-050. Office of Emergency and Remedial Response, U.S. Environmental Protection Agency,Washington, DC.

Oregon Department of Environmental QualityGUIDANCE FOR ECOLOGICAL RISK ASSESSMENT
LEVEL I - SCOPING
Updated November 1998 I - 6
ATTACHMENT 1Ecological Scoping Checklist
Site NameDate of Site VisitSite LocationSite Visit Conducted by
Part �CONTAMINANTS OF INTEREST Adjacent to or
Types, Classes, Or Specific Hazardous Substances ‡
Known Or Suspected Onsitein locality ofthe facility †
‡ As defined by OAR 340-122-115(30) † As defined by OAR 340-122-115(34)
Part �OBSERVED IMPACTS ASSOCIATED WITH THE SITE Finding
Onsite vegetation (None, Limited, Extensive)Vegetation in the locality of the site (None, Limited, Extensive)Onsite wildlife such as macroinvertebrates, reptiles, amphibians, birds, mammals, other(None, Limited, Extensive)Wildlife such as macroinvertebrates, reptiles, amphibians, birds, mammals, other in thelocality of the site (None, Limited, Extensive)Other readily observable impacts (None, Discuss below)Discussion:
ATTACHMENT 1Ecological Scoping Checklist (cont’d)
Part �SPECIFIC EVALUATION OF ECOLOGICAL RECEPTORS / HABITAT Finding

Oregon Department of Environmental QualityGUIDANCE FOR ECOLOGICAL RISK ASSESSMENT
LEVEL I - SCOPING
Updated November 1998 I - 7
SPECIFIC EVALUATION OF ECOLOGICAL RECEPTORS / HABITAT FindingTerrestrial - WoodedPercentage of site that is woodedDominant vegetation type (Evergreen, Deciduous, Mixed) P *Prominent tree size at breast height, i.e., four feet (<6”, 6” to 12”, >12”)Evidence / observation of wildlife (Macroinvertebrates, Reptiles, Amphibians, Birds,Mammals, Other)Terrestrial - Scrub/Shrub/GrassesPercentage of site that is scrub/shrubDominant vegetation type (Scrub, Shrub, Grasses, Other) PProminent height of vegetation (<2’, 2’ to 5’, >5’)Density of vegetation (Dense, Patchy, Sparse) PEvidence / observation of wildlife (Macroinvertebrates, Reptiles, Amphibians, Birds,Mammals, Other)Terrestrial - RuderalPercentage of site that is ruderalDominant vegetation type (Landscaped, Agriculture, Bare ground) PProminent height of vegetation (0’, >0’ to <2’, 2’ to 5’, >5’)Density of vegetation (Dense, Patchy, Sparse) PEvidence / observation of wildlife (Macroinvertebrates, Reptiles, Amphibians, Birds,Mammals, Other)Aquatic - Non-flowing (lentic)Percentage of site that is covered by lakes or pondsType of water bodies (Lakes, Ponds, Vernal pools, Impoundments, Lagoon, Reservoir,Canal)Size (acres), average depth (feet), trophic status of water bodiesSource water (River, Stream, Groundwater, Industrial discharge, Surface water runoff)Water discharge point (None, River, Stream, Groundwater, Wetlands impoundment)Nature of bottom (Muddy, Rocky, Sand, Concrete, Other) PVegetation present (Submerged, Emergent, Floating) PObvious wetlands present (Yes / No)Evidence / observation of wildlife (Macroinvertebrates, Reptiles, Amphibians, Birds,Mammals, Other)Aquatic - Flowing (lotic)Percentage of site that is covered by rivers, streams (brooks, creeks), intermittent streams,dry wash, arroyo, ditches, or channel waterwayType of water bodies (Rivers, Streams, Intermittent Streams, Dry wash, Arroyo, Ditches,Channel waterway)Size (acres), average depth (feet), approximate flow rate (cfs) of water bodies PBank environment (cover: Vegetated, Bare / slope: Steep, Gradual / height (in feet))Source water (River, Stream, Groundwater, Industrial discharge, Surface water runoff)Tidal influence (Yes / No)Water discharge point (None, River, Stream, Groundwater, Wetlands impoundment)Nature of bottom (Muddy, Rocky, Sand, Concrete, Other)Vegetation present (Submerged, Emergent, Floating) PObvious wetlands present (Yes / No)Evidence / observation of wildlife (Macroinvertebrates, Reptiles, Amphibians, Birds,

Oregon Department of Environmental QualityGUIDANCE FOR ECOLOGICAL RISK ASSESSMENT
LEVEL I - SCOPING
Updated November 1998 I - 8
SPECIFIC EVALUATION OF ECOLOGICAL RECEPTORS / HABITAT FindingMammals, Other)Aquatic - WetlandsObvious or designated wetlands present (Yes / No)Wetlands suspected as site is/has (Adjacent to water body, in Floodplain, Standing water,Dark wet soils, Mud cracks, Debris line, Water marks)Vegetation present (Submerged, Emergent, Scrub/shrub, Wooded) PSize (acres) and depth (feet) of suspected wetlandsSource water (River, Stream, Groundwater, Industrial discharge, Surface water runoff)Water discharge point (None, River, Stream, Groundwater, Impoundment)Tidal influence (Yes / No)Evidence / observation of wildlife (Macroinvertebrates, Reptiles, Amphibians, Birds,Mammals, Other)
* P: Photographic documentation of these features is highly recommended.
Part �ECOLOGICALLY IMPORTANT SPECIES / HABITATS OBSERVED

Oregon Department of Environmental QualityGUIDANCE FOR ECOLOGICAL RISK ASSESSMENT
LEVEL I - SCOPING
Updated November 1998 I - 9
ATTACHMENT 2Evaluation of Receptor-Pathway Interactions
EVALUATION OF RECEPTOR-PATHWAY INTERACTIONS Y N UAre hazardous substances present or potentially present in surface waters?ANDAre ecologically important species or habitats present?ANDCould hazardous substances reach these receptors via surface water?When answering the above questions, consider the following:• Known or suspected presence of hazardous substances in surface waters.• Ability of hazardous substances to migrate to surface waters.• Terrestrial organisms may be dermally exposed to water-borne contaminants as a result
of wading or swimming in contaminated waters. Aquatic receptors may be exposedthrough osmotic exchange, respiration or ventilation of surface waters.
• Contaminants may be taken-up by terrestrial plants whose roots are in contact withsurface waters.
• Terrestrial receptors may ingest water-borne contaminants if contaminated surfacewaters are used as a drinking water source.
Are hazardous substances present or potentially present in groundwater?ANDAre ecologically important species or habitats present?ANDCould hazardous substances reach these receptors via groundwater?When answering the above questions, consider the following:• Known or suspected presence of hazardous substances in groundwater.• Ability of hazardous substances to migrate to groundwater.• Potential for hazardous substances to migrate via groundwater and discharge into habitats
and/or surface waters.• Contaminants may be taken-up by terrestrial and rooted aquatic plants whose roots are in
contact with groundwater present within the root zone (∼1m depth).• Terrestrial wildlife receptors generally will not contact groundwater unless it is discharged
to the surface.“Y” = yes; “N” = No, “U” = Unknown (counts as a “Y”)

Oregon Department of Environmental QualityGUIDANCE FOR ECOLOGICAL RISK ASSESSMENT
LEVEL I - SCOPING
Updated November 1998 I - 10
ATTACHMENT 2Evaluation of Receptor-Pathway Interactions (cont’d)
EVALUATION OF RECEPTOR-PATHWAY INTERACTIONS Y N UAre hazardous substances present or potentially present in sediments?ANDAre ecologically important species or habitats present?ANDCould hazardous substances reach these receptors via contact with sediments?When answering the above questions, consider the following:• Known or suspected presence of hazardous substances in sediment.• Ability of hazardous substances to leach or erode from surface soils and be carried into
sediment via surface runoff.• Potential for contaminated groundwater to upwell through, and deposit contaminants in,
sediments.• If sediments are present in an area that is only periodically inundated with water,
terrestrial species may be dermally exposed during dry periods. Aquatic receptors maybe directly exposed to sediments or may be exposed through osmotic exchange,respiration or ventilation of sediment pore waters.
• Terrestrial plants may be exposed to sediment in an area that is only periodicallyinundated with water.
• If sediments are present in an area that is only periodically inundated with water,terrestrial species may have direct access to sediments for the purposes of incidentalingestion. Aquatic receptors may regularly or incidentally ingest sediment while foraging.
Are hazardous substances present or potentially present in prey or food items ofecologically important receptors?ANDAre ecologically important species or habitats present?ANDCould hazardous substances reach these receptors via consumption of food items?When answering the above questions, consider the following:• Higher trophic level terrestrial and aquatic consumers and predators may be exposed
through consumption of contaminated food sources.• In general, organic contaminants with log Kow > 3.5 may accumulate in terrestrial
mammals and those with a log Kow > 5 may accumulate in aquatic vertebrates.“Y” = yes; “N” = No, “U” = Unknown (counts as a “Y”)

Oregon Department of Environmental QualityGUIDANCE FOR ECOLOGICAL RISK ASSESSMENT
LEVEL I - SCOPING
Updated November 1998 I - 11
ATTACHMENT 2Evaluation of Receptor-Pathway Interactions (cont’d)
EVALUATION OF RECEPTOR-PATHWAY INTERACTIONS Y N UAre hazardous substances present or potentially present in surficial soils?ANDAre ecologically important species or habitats present?ANDCould hazardous substances reach these receptors via incidental ingestion of ordermal contact with surficial soils?When answering the above questions, consider the following:• Known or suspected presence of hazardous substances in surficial (∼1m depth) soils.• Ability of hazardous substances to migrate to surficial soils.• Significant exposure via dermal contact would generally be limited to organic
contaminants which are lipophilic and can cross epidermal barriers.• Exposure of terrestrial plants to contaminants present in particulates deposited on leaf
and stem surfaces by rain striking contaminated soils (i.e., rain splash).• Contaminants in bulk soil may partition into soil solution, making them available to roots.• Incidental ingestion of contaminated soil could occur while animals grub for food resident
in the soil, feed on plant matter covered with contaminated soil or while groomingthemselves clean of soil.
Are hazardous substances present or potentially present in soils?ANDAre ecologically important species or habitats present?ANDCould hazardous substances reach these receptors via vapors or fugitive dust carriedin surface air or confined in burrows?When answering the above questions, consider the following:• Volatility of the hazardous substance (volatile chemicals generally have Henry’s Law
constant > 10-5 atm-m3/mol and molecular weight < 200 g/mol).• Exposure via inhalation is most important to organisms that burrow in contaminated soils,
given the limited amounts of air present to dilute vapors and an absence of air movementto disperse gases.
• Exposure via inhalation of fugitive dust is particularly applicable to ground-dwellingspecies that could be exposed to dust disturbed by their foraging or burrowing activitiesor by wind movement.
• Foliar uptake of organic vapors would be limited to those contaminants with relativelyhigh vapor pressures.
• Exposure of terrestrial plants to contaminants present in particulates deposited on leafand stem surfaces.
“Y” = yes; “N” = No, “U” = Unknown (counts as a “Y”)

Oregon Department of Environmental QualityGUIDANCE FOR ECOLOGICAL RISK ASSESSMENT
LEVEL I - SCOPING
Updated November 1998 I - 12
ATTACHMENT 3Level I Deliverable - Site Ecology Scoping Report
Outline (1) EXISTING DATA SUMMARY
(a) Site location(b) Site history(c) Site land and/or water use(s)
(i) Current(ii) Future
(d) Known or suspected hazardous substance releases(e) Sensitive environments(f) Threatened and/or endangered species (USFWS/ODFW/NMFS data)
(2) SITE VISIT SUMMARY
(a) Contaminants of Interest (Part �, Attachment 1)(b) Observed impacts (Part �, Attachment 1)(c) Ecological features (Part �, Attachment 1)(d) Ecologically important species/habitats (Part �, Attachment 1)
(i) Threatened and/or endangered species(ii) Threatened and/or endangered species habitat
(e) Exposure pathways (Attachment 2) (3) RECOMMENDATIONS (4) ATTACHMENTS
(a) Regional map showing location of site(b) Local map showing site in relation to adjacent property(c) Site map(d) Sketch map of ecological features as overlay to site map(e) Sketch map of known or suspected extent of hazardous substances as overlay to site map(f) Site photograph(s)(g) Copies of letters from USFWS and ODFW, responding to queries about threatened and
endangered species (also NMFS if appropriate) (5) REFERENCES / DATA SOURCES

Oregon Department of Environmental QualityGUIDANCE FOR ECOLOGICAL RISK ASSESSMENT
LEVEL I - SCOPING
Updated November 1998 I - 13
FIGURE 1. Ecological Risk Assessment Process Flowchart
LEVEL Level no Recommend
I I Risk ? No Further
SCOPING Tasks Investigation
yes TMDP 1
Conduct Site
Survey
Activity
no no
LEVEL yes Level yes yes
II Adequate Data ? II Risk ? Action ?
SCREENING Tasks
TMDP 2 TMDP 3 no TMDP 4
Discuss Recommend Proceed to
With No Further Feasibility
DEQ Investigation Study
yes no
LEVEL no Level yes yes
III Probabilistic ? III Risk ? Action ?
BASELINE Tasks
TMDP 5 TMDP 6 no TMDP 7
LEVEL IV Prepare yes Level
FIELD Field Sampling FSAP OK ? IV
BASELINE & Analysis Plan Tasks
no TMDP 8

Oregon Department of Environmental QualityGUIDANCE FOR ECOLOGICAL RISK ASSESSMENT
LEVEL I - SCOPING
Updated November 1998 I - 14
FIGURE 2. Level I (Scoping) Ecological Risk Assessment Flowchart
Release of
Hazardous
Substance(s)
Assess Initial Identify Evaluate Submit
Existing Site Contaminants of Receptor - Pathway Level I
Data Visit Interest (COI) Interactions Deliverable
Go to yes TMDP 1
Level II Risk ?
SCREENING
no
Recommend
No Further
Investigation

Oregon Department of Environmental QualityGUIDANCE FOR ECOLOGICAL RISK ASSESSMENT
LEVEL I - SCOPING
Updated November 1998 I - 15

Oregon Department of Environmental Quality GUIDANCE FOR ECOLOGICAL RISK ASSESSMENT
LEVEL II - SCREENING
Note:
In Task 9(c), page II-8 of the Level II Ecological Risk Assessment Guidance, please note that the Q = 5 guidance applies only to soil, and does not apply to water and sediment. Until other screening level values become available, water and sediment screening should be done using the SLVs provided in Tables 1 and 2.
(February 2005)

Oregon Department of Environmental Quality GUIDANCE FOR ECOLOGICAL RISK ASSESSMENT
LEVEL II - SCREENING
December 2001 II - 1
INTRODUCTION
The DEQ ecological risk assessment process consists of four distinct levels, as follows (and as shown in Figure 1):
• Level I Scoping • Level II Screening • Level III Baseline • Level IV Field Baseline
Within and between these levels are a number of Technical/Management Decision Points (TMDP). Based on the information developed and presented within a given level, these TMDPs determine one of three recommendations:
• No further ecological investigations at the site, or • Continuation of the risk assessment process at the next level, or • Undertake (beyond Level I only) a removal or remedial action.
The outcome of each level of the assessment should be documented in writing. Thorough documentation will provide a future reference for any other site-related activities involving a hazardous substance release, future site remedial actions, or onsite monitoring. Prior to undertaking any ecological risk assessment pursuant to OAR 340-122-084, risk assessors should have read and be familiar with the terms, concepts, and approaches discussed in the following documents:
• Guidelines for Ecological Risk Assessment (Final). EPA/630/R-95/002F. U.S. Environmental Protection Agency, 1998;
• Ecological Risk Assessment Guidance for Superfund, Process for Designing and Conducting Ecological Risk Assessments (Interim Final). EPA 540-R-97-006. U.S. Environmental Protection Agency, 1997;
• State of Oregon regulations (ORS 465.315 & OAR 340-122-010 to –115); • State of Oregon ecological risk assessment guidance (Levels I, II, III, & IV).
OBJECTIVE
A Level II assessment, building on the results of Level I, initiates the process of problem formulation for the site. The objective of Level II is to: (a) construct a site description based on information from site visits and/or surveys, the existing literature, any prior preliminary assessments, and site history (including past and present uses), (b) identify site-specific ecologically important receptors, relevant and complete exposure pathways between each

Oregon Department of Environmental Quality GUIDANCE FOR ECOLOGICAL RISK ASSESSMENT
LEVEL II - SCREENING
December 2001 II - 2
source medium of concern and these receptors, contaminants of potential ecological concern (CPECs) from among the contaminants of interest (COIs) associated with the site, (c) discuss how the physicochemical and toxicological properties of each CPEC may influence exposure pathways and adverse effects, (d) define ecologically appropriate assessment endpoints, (e) establish potential links between CPECs and responses in site-specific receptors by means of a preliminary conceptual site model, and (f) make an initial evaluation of the potential for site-related risk. PREREQUISITES A release or suspected release of a hazardous substance and completion of a Level I assessment. TASKS (see Figure 2) (1) TMDP 2: Existing Data Sufficient? Scoping results presented in the Level I
deliverable, professional judgment, and concurrence of the DEQ project manager are used to determine whether existing data (including those developed during the initial site visit) are sufficient for Level II problem formulation. If “Yes”, skip to Task (3); if “No”, perform Task (2).
(2) Conduct site survey activity A site survey goes beyond the Level I site visit to gather
the site-specific qualitative and semi-quantitative data necessary for identifying relevant and complete contaminant-pathway-receptor relationships. Techniques that may be employed to accomplish the survey may include, but are not limited to, any or all of the following: (a) Habitat / vegetation inventory (observation, line transects, quadrats, habitat
evaluation procedures (HEP), etc.); (b) Terrestrial receptor inventory (observation, night-lighting, live and snap traps,
nets, Emlen line transects, etc.); (c) Aquatic receptor inventory (observation, dip nets, Surber samplers, grab
samplers, traps, USEPA Rapid Bioassessment Protocols, etc.); (d) Geographic information system (GIS) mapping and analysis of survey data.
(3) Update site description A narrative description and analysis of ecological conditions
at, adjacent to, and in the locality of the site. This narrative should provide greater depth and detail than that allowed for in the Level I checklists and should consider: (a) Known or historical nature, sources, and extent of contamination; (b) Recorded or observed environmental problems, e.g., observed toxicity; mortality,
chlorosis in plants, etc.; (c) Available results from any previous biological testing, such as data on acute or

Oregon Department of Environmental Quality GUIDANCE FOR ECOLOGICAL RISK ASSESSMENT
LEVEL II - SCREENING
December 2001 II - 3
chronic toxicity or bioaccumulation phenomena; (d) Physical and chemical characteristics of abiotic media in the area or climatic,
physiographic, oceanographic, and/or geohydrologic features that could create contaminant pathways linking biota with contaminants;
(e) Location of any threatened or endangered species, or their preferred habitats, or sensitive environmental areas, on or near the site;
(f) Common flora and fauna of the site and surrounding areas, i.e., the most common species likely to be exposed to contaminants;
(g) Ecological information on biological assemblages or species important to site ecosystems;
(h) Specific mapping of site to identify site-specific microhabitats (areas of use); (i) Results from any previous ecosystem modeling or geographic information
system (GIS)-based analyses.
(4) Identify ecological receptors Site-specific ecologically important receptors are identified, using the criteria established for Level I, as follows: (a) Identify all habitat types at and within the locality of the facility (as defined by OAR
340-122-115(34)). (b) Identify, using results of the initial site visit, the Level II site survey (if any), a review
of the available published literature, published government or scientific studies of the area, or information maintained by government agencies or academic institutions, the plant and animal species most likely to be associated with each habitat type identified in (a) above.
(c) Identify site-specific receptors for each habitat type. To the extent practicable, these receptors should be organisms that spend a significant portion of their life or derive a significant portion of their diet or physiological needs from that habitat type. Bear in mind that presentation of long lists of species copied from regional or state-wide guidebooks, without reference to observations made during the site visit or site survey (if any), is rarely useful.
(d) Summarize the results of steps (a-c) above in the form of a table. (5) Identify complete exposure pathways This is a through identification of relevant and
complete exposure pathways, taking into consideration the physicochemical and transport and fate characteristics of the CPECs. An exposure route is the way a chemical or physical agent comes in contact with a receptor (i.e., by ingestion, inhalation, dermal contact, etc.). Ecological receptors may be exposed to chemical contaminants either through direct (primary) and/or indirect (secondary) exposure routes. Only those pathways that are complete, and are expected to contribute substantially to exposures by ecologically important receptors should be addressed.

Oregon Department of Environmental Quality GUIDANCE FOR ECOLOGICAL RISK ASSESSMENT
LEVEL II - SCREENING
December 2001 II - 4
(a) For an exposure to a contaminant to occur, complete exposure pathways must exist, which requires: (i) A source and mechanism for contaminant release; (ii) A transport medium; (iii) A point of environmental contact; and (iv) An exposure route at the exposure point. (v) If any of these four components is absent, a pathway is generally
considered incomplete. However, the transport medium may be missing and the pathway still be complete if the contact point is directly at the contaminant release point. A pathway may also be complete if a source and mechanism for contaminant release appear to be absent but (ii), (iii), and (iv) exist, i.e., direct ingestion of a contaminated transport medium.
(b) Identify those pathways that have the greatest potential to bring receptors into contact with toxicologically significant quantities of a given contaminant. Select from one or more of the following eight distinct exposure pathways: (i) Volatile contaminants may be released to air and transported by wind. (ii) Non-volatile contaminants with a moderate to strong affinity for adsorption
to soils may be transported via fugitive dust released by aeolian (wind-blown) erosion.
(iii) Contaminants that are soluble in water and have a low affinity for adsorption to soil particles may leach, infiltrate, or percolate into groundwater.
(iv) Contaminants that are soluble in water and have a low affinity for adsorption to soil particles may become dissolved in stormwater runoff from the site or may be discharged directly to surface waters.
(v) Contaminants with a strong affinity for soils may be resuspended as sediment load and transported in surface runoff.
(vi) Contaminants that reach groundwater may be transported to surface waters if the groundwater has a surface discharge point (e.g., a seep, spring, or surface water recharge area).
(vii) Contaminants in sediments may be directly ingested by benthic invertebrates or bottom-dwelling fish or may become available by partitioning (based on their adsorption characteristics and sediment organic carbon levels) into the water column.
(viii) Receptors may be exposed (through ingestion) to contaminants that are capable of bioaccumulation and/or biomagnification within the food chain. This is an indirect (secondary) exposure pathway that may involve contaminants initially contained in any media.
(c) Typical exposure routes are summarized (by environmental media) in Table 1.

Oregon Department of Environmental Quality GUIDANCE FOR ECOLOGICAL RISK ASSESSMENT
LEVEL II - SCREENING
December 2001 II - 5
Identification of typical exposure routes does not rule out the possibility that at certain sites, highly unique exposure routes could bring receptors into contact with significant quantities of contaminants. However, unless demanded by unique site characteristics, it is usually unproductive to identify particularly obscure exposure pathways and/or routes as these will ultimately be difficult or impossible to quantify.
(6) Identify candidate assessment endpoints Per OAR 340-122-115(7), an assessment
endpoint is “…an explicit expression of a value deemed important to protect, operationally defined by an entity (hereafter, “endpoint receptor”) and one or more of that entity’s measurable attributes…” Well-crafted assessment endpoints establish a clear logical connection between regulatory goals for a site, values to be protected, and how the risk assessment is to be conducted. (a) The process of assessment endpoint definition begins here and, if necessary, is
completed during Task (1) of the Level III assessment. This identification is intended to begin focusing the risk assessment on site-specific ecological features or resources of particular interest to risk managers and stakeholders. This is an opportunity for the risk manager and the risk assessor to begin a dialogue to translate the risk manager’s higher-level decision criteria into a statement of assessment objectives.
(b) Per OAR 340-122-084(3)(c), assessment endpoints are a required component of an ecological risk assessment; so the issue is not whether to pick one but rather which one to pick. If the results of an ecological risk assessment are to play a meaningful role in the remedial action process, care must be exercised when identifying assessment endpoints (and their associated endpoint receptors). When identifying assessment endpoints, consider whether if risk is demonstrated for that endpoint there would be a willingness on the part of the risk managers to undertake a potentially costly and/or time-consuming remedial action to alleviate that risk. Identifying useful endpoints usually requires input from risk managers, stakeholders, and risk assessors.
(c) An example of a candidate assessment endpoint may be: Great blue heron {entity, endpoint receptor} breeding success {measurable attribute}. This measurable attribute can be directly related to the condition of an individual heron, as well as to that of the local population of herons.
(d) Groups (guilds) of receptors that are candidates for consideration as endpoint receptors include, but are not limited to: benthic or epibenthic aquatic invertebrates; small mammalian predators whose diets include invertebrates living in close contact with soil; small mammalian herbivores; ground-feeding avian predators whose diet includes invertebrates living in close contact with soil;

Oregon Department of Environmental Quality GUIDANCE FOR ECOLOGICAL RISK ASSESSMENT
LEVEL II - SCREENING
December 2001 II - 6
piscivorous avian predators whose diet includes pelagic or bottom-feeding fish; omnivorous waterfowl whose diet includes aquatic macrophytes and invertebrates.
(e) Of the set of ecologically important ecological receptors identified during Level I, in Task (4) above, or in section (d) above, those that have substantial aesthetic, social, or economic value to risk managers or stakeholders or are important in the biological functions or biodiversity of the system, may be selected as endpoint receptors. These receptors are either themselves the object of protection or serve as surrogates for all other ecological receptors requiring protection (see OAR 340-122-115(7)). This identification of endpoint receptors at Level II may be further refined or modified during Task (1) of a Level III assessment.
(7) Identify known ecological effects Factors, such as those listed below, that affect the
toxicological behavior of a contaminant with respect to a given endpoint receptor (and not a universe of possible receptors) should be briefly and qualitatively discussed to the extent practicable. Note that development of any detailed, quantitative toxicity profiles will occur only in Level III. (a) The physicochemical characteristics and toxic mechanism of a hazardous
substance; (b) Contaminant-specific effects that might be expected in potentially exposed
endpoint receptors and whether any such receptors are particularly susceptible to any site-related CPEC;
(c) The potential for bioconcentration, bioaccumulation, or biomagnification of COIs within receptors at the site (based upon abiotic and biotic conditions and chemical data);
(d) Data gaps regarding the effects of a particular COI on a given endpoint receptors; and
(e) Those receptors that might be good indicators of habitat modifications or alterations that are potentially due to the presence of specific COIs.
(8) Calculate COI Concentration(s) Chemical sampling and analysis provides raw data concerning the presence and concentrations of COIs in abiotic (soil, surface water, groundwater, sediment, air) and biotic (plant and animal tissues) media within each habitat at or in the locality of the site. The risk assessor should ensure that sampling covers areas and media of ecological interest and that analytical detection levels are set low enough to be of ecological significance, as determined by the analysis plan (which includes DQOs and the QA/QC plan). (a) Estimate Environmental Concentration (EC) Because ecological receptors do
not experience their environment on a “point” basis, it is necessary to convert measured data from single sample points into an estimate of concentration over

Oregon Department of Environmental Quality GUIDANCE FOR ECOLOGICAL RISK ASSESSMENT
LEVEL II - SCREENING
December 2001 II - 7
some relevant spatial area, such as their habitat. (i) For abiotic media (soil, water, sediment), the simplest approach is to
assume that contaminants are evenly distributed within a habitat and that endpoint receptors forage randomly with respect to contamination within that habitat. In this case, the EC can be represented by either the one-sided 90th percentile upper confidence limit (90th percentile UCL) of the uncertainty in the arithmetic mean. Alternatively, EC may be set equal to the maximum detected concentration (MDC). If the data set contains any value classed as a positive detect, then include all non-detect samples in the EC computation with values of one-half their detection limits. For soil and sediment samples, include duplicate samples as additional single data points in the computation; for water samples, include the average concentration of the sample and its duplicate. Note, however, that data sets with greater than 15% non-detects will require use of special statistical methods (WDOE 1993).
(ii) Chemical analysis of biotic samples can be used to measure contaminant concentrations in biotic (tissues) media; however, cost and schedule considerations generally restrict such analyses to Levels III and/or IV.
(iii) It may be desirable to use a geographic information system (GIS) to overlay the spatial distribution of various habitat types with contaminant distributions to more accurately determine the degree to which habitat is contaminated. If information is available regarding the distribution or movements of plants and/or animals, these data may be combined with the habitat and contamination data to provide a more accurate visualization of exposure.
(b) The exposure concentration that will be compared to the screening level value (SLV) depends on the characteristics of the receptor. A concentration should be used that represents a reasonable maximum exposure given the characteristics of the medium and the site-related species as determined in Task (4) above. A fundamental distinction must be made between receptors that average their exposure over space and time and those that have essentially constant exposure, as follows: (i) For terrestrial wildlife consuming soil, vegetation, or animal foods, the 90th
percentile UCL on the mean is the appropriate media concentration for comparison with the SLV.
(ii) For fish and other mobile aquatic species in flowing waters, the 90th percentile UCL in either water or sediment is the appropriate value for comparison.

Oregon Department of Environmental Quality GUIDANCE FOR ECOLOGICAL RISK ASSESSMENT
LEVEL II - SCREENING
December 2001 II - 8
(iii) For wildlife that feed on aquatic biota, the 90th percentile UCL is the appropriate value for comparison.
(iv) For plants, aquatic, and soil invertebrates that are immobile or nearly immobile, the MDC in soil or sediment is the appropriate value for comparison.
(v) For groundwater, the receptor-appropriate concentration (90th percentile UCL or MDC) at (or nearest) the point of discharge should be used without allowance for a mixing or dilution zone.
(9) Identify contaminants of potential ecological concern (CPECs) Here COIs
(identified in Level I and quantified in Task (8) above) for each media (soil, water, air, etc.) are screened on the basis of physicochemical properties and then their toxicity and bioaccumulation potential, using the criteria listed below. (a) Frequency of Detection COIs that are infrequently detected may be artifacts in
the data due to sampling, analytical, or other errors. Assuming that detection limits have been set low enough for ecological purposes and that adequate sampling has occurred, COIs detected in less than five percent of the samples site-wide for a given media need not be selected as CPECs.
(b) Background Concentration If the MDC of an otherwise naturally occurring COI is less than the concentration selected as a background value (derived either from the literature, from site-specific sampling, or Table Q), it need not be selected as a CPEC.
(c) Chemistry-Toxicity Screen Screening on the basis of toxicity alone must take into consideration the potential for risk to be posed by exposure to: (a) individual COIs, (b) multiple COIs simultaneously within a given medium (cumulative risk per OAR 340-122-084(1)(i)), and (c) individual or multiple COIs within different media (i.e., aggregate exposure). Note also that screening should involve SLVs for receptors or classes of receptors that are related to endpoint receptors, and which may actually exist at, or in the locality of, the site. (i) Any individual COI in any given media with QTij > , where ijijij SLVCT =
[Ci j is the concentration of COI i in medium j, SLVi j is the screening level value for COI i in medium j under a site-appropriate exposure scenario, Ti j is the toxicity ratio for COI i in medium j, and Q is the receptor designator [Q = 1 for listed threatened and endangered (T&E) species, Q = 5 for non-T&E species] must be identified as a CPEC.
(ii) For multiple COIs in any given media, those with Ti j/Tj values ≥ (1/Ni j) × Q (where Ni j is the total number of i COIs in medium j and ∑ =
=i
i ijj TT 1 )
must be retained as CPECs, provided Tj >Q. (iii) If a COI is detected in multiple media (e.g., in both surface water and soil),

Oregon Department of Environmental Quality GUIDANCE FOR ECOLOGICAL RISK ASSESSMENT
LEVEL II - SCREENING
December 2001 II - 9
it must be retained as a CPEC if ∑ =>
j
j ij QT1
.
(iv) For sediment, detection of one or more CPECs may require a Sediment Level III (toxicity) evaluation (see DEQ’s Guidance for Evaluation of Contaminated Sediment).
(d) Bioaccumulation Screen OAR 340-122-084(3)(d) requires that special attention be given to COIs that are, or are suspected of being, persistent bioaccumulative toxins (PBTs). These include, but are not limited to, all dioxins, PCB mixtures, PCB congeners, DDT, DDD, DDE, organochlorine pesticides, metals capable of biomethylation (e.g., mercury), and chlorinated dibenzofurans. (i) If such COIs are detected (i.e., at any concentration above the detection
limit) in soil, surface water, or groundwater samples, their potential to compromise food chains and induce adverse effects in higher trophic level species should be discussed in the Level II deliverable. Addressing their presence may require advancing to a Level III assessment.
(ii) If such COIs are detected in sediment at concentrations above their bioaccumulation SLVs (or are without SLVs), a sediment bioaccumulation evaluation is likely to be required (see Guidance for Evaluation of Contaminated Sediment).
(e) Screening Level Value Availability In some cases, no appropriate SLV will be available for a given COI-media-receptor combination. In these cases, while the toxicity or bioaccumulation potential of the COI cannot be addressed, neither should that COI be eliminated from further consideration. Such COIs should be retained in a separate category for purposes of determining the need for further toxicity or bioaccumulation testing (especially in the case of sediment) and to prevent elimination from further consideration of the media in which it occurs.
(f) The results of the CPEC selection process should be presented in tabular format, with the table clearly presenting all of the data used to determine whether a COIs qualifies as a CPEC.
(10) Preliminary conceptual site model Information on ecologically important receptors,
assessment endpoints, CPECs, exposure routes, and potential effects is integrated to create a preliminary conceptual site model (CSM) involving both text and graphics. For Level II, the CSM should consist of: (a) One or more “risk hypotheses” that describe predicted relationships between
CPECs, exposure, and assessment endpoint response; i.e., a statement of how each CPEC might affect ecologically important components of the natural environment. For example: • PCBs have been shown to cause reproductive impairment in birds; such
impairment could lead to loss of individuals or populations. The risk
Oregon Department of Environmental Quality GUIDANCE FOR ECOLOGICAL RISK ASSESSMENT
LEVEL II - SCREENING
December 2001 II - 10
assessment will evaluate (as a risk hypothesis) whether the concentration of PCBs in prey (due to site-related exposures) of piscivorous Great Blue Herons exceeds levels known to impair reproduction in these birds.
(b) A simple box and arrow diagram exposure pathway model, showing the relationship between exposure pathways and ecological receptors.
(11) Submit level II deliverable This deliverable is a brief memorandum (see Attachment 1,
Site Screening Report, for suggested format and contents) which identifies CPECs, site-specific ecological receptors, relevant and complete exposure pathways, and the known ecological effects of CPECs. The resulting CSM forms the factual basis for evaluating the following TMDPs.
(12) TMDP 3: Ecological Risk Probable? For a site to present a potential for risk, it must
exhibit the following three criteria: (a) contain CPECs in abiotic media at detectable and biologically significant concentrations, (b) provide exposure pathways linking CPECs to ecological receptors, and (c) have these receptors either utilize the site, be present nearby, or be in the locality of CPECs migrating from the site. Based on information presented in the Level II deliverable, do CPECs, entities, and complete exposure pathways exist at or in the locality of the site? (a) Specific criteria are as follows:
(i) Does the locality of the facility contain, or is it reasonably likely to contain, any individuals of a threatened or endangered species or their critical habitat or does it contain habitat of sufficient size and quality to support a local population of each non-T&E species?;
(ii) Were CPECs selected on the basis of exceedence of SLVs (Task 9d) or because they have a high potential to bioaccumulate (Task 9e)?;
(iii) Based on site-specific information gathered during the site visit and/or site survey, knowledge of CPEC characteristics, receptor behavior, and professional judgment, do there appear to be plausible links between CPEC sources and endpoint receptors?;
(b) If (i), (ii), or (iii) are “No”, then the site is highly unlikely to present ecological risks and a recommendation for no further ecological investigations should be made.
(c) If (i) and (ii) and (iii) are “Yes”, then the site could present ecological risks and a recommendation to move to TMDP 4 should be made.
(13) TMDP 4: Remedial Action Decision Possible? Are risk managers willing to make a
response action decision with existing information and current levels of uncertainty? Key questions: Would cleanup be less costly than further investigation? Are data adequate to approve a removal action or to select or approve a remedy? If “Yes”, then further

Oregon Department of Environmental Quality GUIDANCE FOR ECOLOGICAL RISK ASSESSMENT
LEVEL II - SCREENING
December 2001 II - 11
ecological investigation is deferred in favor of a response action. If “No”, then the assessment process proceeds to Level III for further evaluation of the risk hypotheses posed in Task (10).
ADDITIONAL INFORMATION Barnthouse, LW & Suter II, GW. 1986. User's Manual for Ecological Risk Assessment.
ORNL-6251. Oak Ridge National Laboratory, Oak Ridge, Tennessee Maughan, JT. 1993. Ecological Assessment of Hazardous Waste Sites. Van Nostrand
Reinhold, New York, 352 pp. Moore, DRJ & Biddinger, GR. 1996. The interaction between risk assessors and risk managers
during the problem formulation phase. Environmental Toxicology and Chemistry 14, 2013-2014.
Suter II, GW. 1993. Ecological Risk Assessment. Lewis Publishers, Boca Raton, Florida, 538 pp.
USDOI. 1987. Guidance on Use of Habitat Evaluation Procedures and Suitability Index Models for CERCLA Application. Type B Technical Information Document, CERCLA 301 Project, U.S. Department of the Interior, Washington, DC.
USEPA. 2001. The Role of Screening-Level Risk Assessments and Refining Contaminants of Concern in Baseline Ecological Risk Assessments. EPA 540/F-01/014, Publication 9345.0-14. Office of Solid Waste and Emergency Response, U.S. Environmental Protection Agency, Washington, DC.
USEPA. 1996. Ecological Significance and Selection of Candidate Assessment Endpoints. EPA 540/F-95/037, Publication 9345.0-11FSI. Office of Solid Waste and Emergency Response, U.S. Environmental Protection Agency, Washington, DC.
USEPA. 1989. Ecological Assessment of Hazardous Waste Sites: A Field and Laboratory Reference. EPA/600/3-89/013. Environmental Research Laboratory, U.S. Environmental Protection Agency, Corvallis, Oregon.
USEPA. 1989. Rapid Bioassessment Protocols for Use in Streams and Rivers - Benthic Macroinvertebrates and Fish. EPA/440/4-89/001. Office of Water, U.S. Environmental Protection Agency, Washington, DC.
USEPA. 1989. Risk Assessment Guidance for Superfund, Volume II, Environmental Evaluation Manual. EPA/540/1-89/001. Office of Emergency and Remedial Response, U.S. Environmental Protection Agency, Washington, DC.
WDOE. 1993. Statistical Guidance for Ecology Site Managers, Supplement S-6, Analyzing Site or Background Data with Below-Detection Limit or Below-PQL Values (Censored Data Sets). Washington Department of Ecology.

Oregon Department of Environmental Quality GUIDANCE FOR ECOLOGICAL RISK ASSESSMENT
LEVEL II - SCREENING
December 2001 II - 12
Table 1
Exposure Routes for Ecological Receptors By Environmental Media
Environmental Media
Exposure Route
Comments
Surface Water Direct Contact Terrestrial organisms may be dermally exposed to water-borne contaminants as a result of wading or swimming in contaminated waters. Aquatic receptors may be exposed through osmotic exchange, respiration of surface waters.
Root Contact
Contaminants may be taken-up by terrestrial plants whose roots are in contact with surface waters.
Ingestion Terrestrial receptors may ingest water-borne contaminants if contaminated surface waters are used as a drinking water source
Ground Water Root Contact
Contaminants may be taken-up by terrestrial plants whose roots are in contact with groundwater present within the root zone (∼1 m depth).
Ingestion
Receptors generally will not contact groundwater unless it is discharged to the surface, at which time it should be evaluated as surface water.
Sediment Direct Contact
If sediments are present in an area that is only periodically inundated with water, terrestrial species may be dermally exposed during dry periods; such sediment exposure would be evaluated as soil exposure. Aquatic receptors may be directly exposed to sediments or may be exposed through osmotic exchange, respiration or ventilation of sediment pore waters.
Root Contact Exposure of terrestrial plants to contaminated sediment may be treated as exposure to soil.
Ingestion If sediments are present in an area that is only periodically inundated with water, terrestrial species may have direct access to sediments for the purposes of incidental ingestion. In this instance, sediment exposure would be evaluated as soil exposure. Aquatic receptors may regularly or incidentally ingest sediment while foraging.
Soil Dermal Contact
Significant exposure via dermal contact would be limited to organic contaminants which are lipophilic and can cross epidermal barriers.

Oregon Department of Environmental Quality GUIDANCE FOR ECOLOGICAL RISK ASSESSMENT
LEVEL II - SCREENING
December 2001 II - 13
Table 1
Exposure Routes for Ecological Receptors By Environmental Media
Environmental Media
Exposure Route
Comments
Foliar Deposition (rainsplash)
Exposure of terrestrial plants to contaminants present in particulates deposited on leaf and stem surfaces by rain striking contaminated soils.
Root Contact Contaminants in bulk soil may partition into soil solution, making them available to roots.
Ingestion Incidental ingestion of contaminated soil could occur while animals grub for food resident in the soil, feed on plant matter covered with contaminated soil or groom themselves.
Air Inhalation (vapors)
Exposure via inhalation is most important to organisms that burrow in contaminated soils, given the limited amounts of air present to dilute vapors and an absence of air movement to disperse gases.
Inhalation (dust)
Exposure via inhalation of fugitive dust is particularly applicable to ground-dwelling species that could be exposed to dust disturbed by their foraging or burrowing activities or by wind movement.
Foliar Uptake (vapors)
Foliar uptake of organic vapors would be limited to those contaminants with relatively high vapor pressures.
Foliar Deposition (dust)
Exposure of terrestrial plants to contaminants present in particulates deposited on leaf and stem surfaces.
Food Web Ingestion Higher trophic level terrestrial and aquatic consumers and predators, not necessarily in direct contact with any contaminated media, may be exposed through consumption of contaminated food sources.

Oregon Department of Environmental Quality GUIDANCE FOR ECOLOGICAL RISK ASSESSMENT
LEVEL II - SCREENING
December 2001 II - 14
Attachment 1 Level II Deliverable - Site Screening Report
Outline (1) INTRODUCTION
(a) Site History (b) Regulatory Status (c) Summary of Level I Results
(i) Contaminants of Interest (ii) Potential Ecological Receptors (iii) Potential Exposure Pathways
(2) SITE SURVEY
(a) Objectives and Scope (b) Methodology (c) Results
(3) SCREENING RESULTS
(a) Site Description (b) Site-specific Ecological Receptors (c) Contaminants of Potential Ecological Concern (d) Relevant and Complete Exposure Pathways (e) Known Ecological Effects (f) Candidate Assessment Endpoints (g) Preliminary Conceptual Site Model
(4) RECOMMENDATIONS (5) ATTACHMENTS
(a) Regional map showing location of site (b) Local map showing site in relation to adjacent property (c) Site map (d) Map of ecological habitats as overlay to site map (e) Map of known or suspected extent of CPECs as overlay to site map
(6) REFERENCES

Oregon Department of Environmental Quality GUIDANCE FOR ECOLOGICAL RISK ASSESSMENT
LEVEL II - SCREENING
December 2001 II - 15
FIGURE 1. Ecological Risk Assessment Process Flowchart
LEVEL Level no Recommend
I I Risk ? No Further
SCOPING Tasks Investigation
yes TMDP 1
Conduct Site
Survey
Activity
no no
LEVEL yes Level yes yes
II Adequate Data ? II Risk ? Action ?
SCREENING Tasks
TMDP 2 TMDP 3 no TMDP 4
Discuss Recommend Proceed to
With No Further Feasibility
DEQ Investigation Study
yes no
LEVEL no Level yes yes
III Probabilistic ? III Risk ? Action ?
BASELINE Tasks
TMDP 5 TMDP 6 no TMDP 7
LEVEL IV Prepare yes Level
FIELD Field Sampling FSAP OK ? IV
BASELINE & Analysis Plan Tasks
no TMDP 8

Oregon Department of Environmental Quality GUIDANCE FOR ECOLOGICAL RISK ASSESSMENT
LEVEL II - SCREENING
December 2001 II - 16
FIGURE 2. Level II (Screening) Ecological Risk Assessment Flowchart
From yes Update Ident i fy Ident i fy Comple te
Level I Adqequa te Da ta? Site Eco log ica l Exposure
S C O P I N G n o Descr ip t ion Recep to r s P a t h w a y s
T M D P 2
Conduct S i te C h e m i c a l Identify
Survey Ana lys i s Da ta K n o w n
Activi ty Avai lab le Ecological Effects
Submi t Pre l iminary S c r e e n Calcula te Ident i fy Candidate
Leve l I I Conceptua l S i te for Env i ronmenta l Assessment
Del iverable M o d e l C P E C s Concen t r a t ion Endpoin ts
no R e c o m m e n d
Risk ? N o F u r t h e r
yes Invest igat ion
T M D P 3
y e s Proceed to
Act ion ? Feasibil i ty
no S t u d y
T M D P 4
G o t o
Leve l I I I
B A S E L I N E
Oregon Department of Environmental QualityGUIDANCE FOR ECOLOGICAL RISK ASSESSMENT
LEVEL II SCREENING LEVEL VALUES
December 2001 SLV - 1
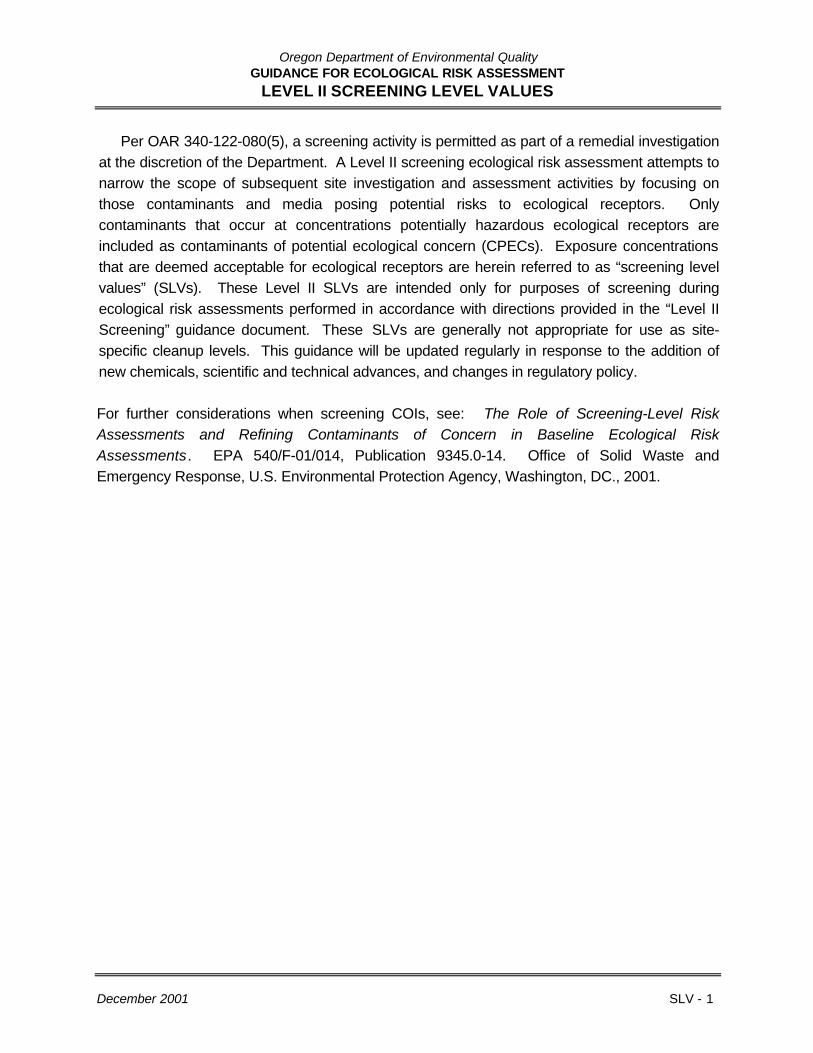
Per OAR 340-122-080(5), a screening activity is permitted as part of a remedial investigationat the discretion of the Department. A Level II screening ecological risk assessment attempts tonarrow the scope of subsequent site investigation and assessment activities by focusing onthose contaminants and media posing potential risks to ecological receptors. Onlycontaminants that occur at concentrations potentially hazardous ecological receptors areincluded as contaminants of potential ecological concern (CPECs). Exposure concentrationsthat are deemed acceptable for ecological receptors are herein referred to as “screening levelvalues” (SLVs). These Level II SLVs are intended only for purposes of screening duringecological risk assessments performed in accordance with directions provided in the “Level IIScreening” guidance document. These SLVs are generally not appropriate for use as site-specific cleanup levels. This guidance will be updated regularly in response to the addition ofnew chemicals, scientific and technical advances, and changes in regulatory policy.
For further considerations when screening COIs, see: The Role of Screening-Level RiskAssessments and Refining Contaminants of Concern in Baseline Ecological RiskAssessments. EPA 540/F-01/014, Publication 9345.0-14. Office of Solid Waste andEmergency Response, U.S. Environmental Protection Agency, Washington, DC., 2001.

Oregon Department of Environmental QualityGUIDANCE FOR ECOLOGICAL RISK ASSESSMENT
LEVEL II SCREENING LEVEL VALUES
December 2001 SLV - 2
Table 1. Screening Level Values for Plants, Invertebrates, and Wildlife Exposed to Soil and Surface Water
Soils (mg/kg) Surface Water (mg/L)
Terrestrial Receptors Fresh
CHEMICAL CAS No. Plants Inverts Birds Mammals Aquatic Birds Mammals
INORGANICS
Aluminum 7429-90-5 50 c 600 b 450 g 107 e 0.087 n,t 797 h 8 fAntimony and compounds 7440-36-0 5 c 15 e 1.6 q 1 fArsenic III 7440-38-2 10 c 60 a 10 g 29 e,i 0.150 t 18 h 6 f,iArsenic V 0.150 tBarium and compounds 7440-39-3 500 c 3000 b 85 g 638 e 0.004 o 150 h 39 fBeryllium and compounds 7440-41-7 10 c 83 e 0.0053 q 5 fBismuth 20 dBoron 7440-42-8 0.5 c 20 b 120 g 3500 e 0.0016 o 209 h 213 fBromine 10 cCadmium and compounds 7440-43-9 4 c 20 a 6 g 125 e,i 0.0022 t 10 h 8 f,iCalcium 116 pChromium III 1 c 0.4 a 4 g 3.4×10⁵ e 0.074 t 7.2 h 2.1×10⁴ fChromium VI 7440-47-3 410 e 0.011 n,q,t 25 fCobalt 7440-48-4 20 c 1000 b 150 e,i 0.023 o 9 f,iCopper and compounds 7440-50-8 100 c 50 a 190 g 390 e,i 0.009 t 341 h 53 f,iCyanides 0.0052 q,tFluorine (soluble fluoride) 7782-41-4 200 c 30 b 32 g 2285 e 57 h 317 fIron 10 d 200 b 1.000 n,q,tIodine 4 cLanthanum 50 bLead 7439-92-1 50 c 500 a 16 g 4000 e,i 0.0025 t 28 h 323 f,iLithium 7439-93-2 2 c 10 b 1175 e 0.014 o 72 fMagnesium 82 pManganese and compounds 7439-96-5 500 c 100 b 4125 g 11000 e,i 0.120 o 7242 h 676 f,iMercury (elemental, total) 7439-97-6 0.3 c 0.1 a 1.5 g 73 e 0.00077 t 3.3 h 10 fMercury (methyl) 22967-92-6 0.0002 d 0.025 g 4 e,i 0.05 h 0.25 f,iMolybdenum 7439-98-7 2 c 200 b 15 g 14 e 0.370 o 25 h 1 f

Oregon Department of Environmental QualityGUIDANCE FOR ECOLOGICAL RISK ASSESSMENT
LEVEL II SCREENING LEVEL VALUES
December 2001 SLV - 3
Table 1. Screening Level Values for Plants, Invertebrates, and Wildlife Exposed to Soil and Surface Water
Soils (mg/kg) Surface Water (mg/L)
Terrestrial Receptors Fresh
CHEMICAL CAS No. Plants Inverts Birds Mammals Aquatic Birds Mammals
Nickel 7440-02-0 30 c 200 a 320 g 625 e,i 0.052 t 562 h 38 f,iNiobium 9 e 0.6 fPotassium 53 pSelenium 7782-49-2 1 c 70 a 2 g 25 e,i 0.005 t 3.6 h 1.5 f,iSilver and compounds 7440-22-4 2 c 50 b 0.00012 qSodium 680 pStrontium 7440-24-6 32875 e 1.500 o 2001 fTechnetium 0.2 cTellurium 2 dThallium 1 c 1 e,i 0.040 q 0.06 f,iTin (inorganic) 50 c 2000 b 0.073 oTitanium 1000 bTungsten 400 bUranium 7440-61-1 5 c 65 g 170 e 0.0026 o 116 h 12 fVanadium 7440-62-2 2 c 47 g 25 e 0.020 o 82 h 1.6 fZinc 7440-66-6 50 c 200 a 60 g 20000 e,i 0.120 t 105 h 1230 f,iZirconium 97 e 0.017 o 7 fORGANICS
Acenaphthene 83-32-9 20 c 0.520 qAcetone 67-64-1 1250 e 1.500 o 76 fAcrolein 107-02-8 0.021 qAcrylonitrile 107-13-1 1000 b 2.6 qAldrin 309-00-2 25 e,i 0.00006 r 1.5 f,iAmmonia 7664-41-7 0.017 pAniline 62-53-3 200 dAnthracene 120-12-7 0.013 oBenzene 71-43-2 3300 e 0.13 o 200 fBenzidine 92-87-5 0.0039 o

Oregon Department of Environmental QualityGUIDANCE FOR ECOLOGICAL RISK ASSESSMENT
LEVEL II SCREENING LEVEL VALUES
December 2001 SLV - 4
Table 1. Screening Level Values for Plants, Invertebrates, and Wildlife Exposed to Soil and Surface Water
Soils (mg/kg) Surface Water (mg/L)
Terrestrial Receptors Fresh
CHEMICAL CAS No. Plants Inverts Birds Mammals Aquatic Birds Mammals
Benzo[a]anthracene 56-55-3 0.000027 oBenzo[a]pyrene 50-32-8 125 e,i 0.000014 o 8 f,iBenzoic acid 65-85-0 0.042 oBenzyl alcohol 100-51-6 0.0086 oBHC (alpha) 319-84-6 0.0022 oBHC (beta) 319-85-7 0.0022 oBHC (gamma) Lindane 58-89-9 8 g 1000 e,i 0.00008 n,q 14.5 h 62 f,iBHC-technical 58-89-9 2.5 g 200 e 4 h 12 f1,1-Biphenyl 92-52-4 60 c 0.014 oBis(2-ethylhexyl)phthalate (DEHP) 117-81-7 4.5 g 1020 e 0.003 o 8 h 73 f4-Bromoaniline 100 d4-Bromophenyl phenyl ether 101-55-3 0.0015 o2-Butanone 14 oButyl benzyl phthalate 85-68-7 0.019 oCarbon disulfide 75-15-0 0.00092 oCarbon tetrachloride 56-23-5 1000 b 2000 e 0.074 r 123 fChlordane 57-74-9 9 g 250 e 4.3×10⁻⁶ q,t 15.5 h 18 fChloroacetamide 2 a3-Chloraniline 20 c 30 a4-Chloroaniline 106-47-8 40 dChlorobenzene 108-90-7 40 a 0.05 q2-Chloroethyl vinyl ether 110-75-8 4.76 rChloroform 67-66-3 1875 e 1.24 q 115 fbeta-Chloronaphthalene 91-58-7 0.032 r2-Chlorophenol 95-57-8 60 d 2.0 q3-Chlorophenol 7 c 10 a4-Chlorophenol 50 dChlorpyrifos 2921-88-2 0.000041 t

Oregon Department of Environmental QualityGUIDANCE FOR ECOLOGICAL RISK ASSESSMENT
LEVEL II SCREENING LEVEL VALUES
December 2001 SLV - 5
Table 1. Screening Level Values for Plants, Invertebrates, and Wildlife Exposed to Soil and Surface Water
Soils (mg/kg) Surface Water (mg/L)
Terrestrial Receptors Fresh
CHEMICAL CAS No. Plants Inverts Birds Mammals Aquatic Birds Mammals
DDD 72-54-8 0.01 g 100 e 0.000001 t 0.02 h 6 fDDE 72-55-9 0.01 g 100 e 0.02 h 6 fDDT 50-29-3 0.01 g 100 e,i 0.000001 q 0.02 h 6 f,iDecane 0.049 oDemeton 8065-48-3 0.0001 q,tDiazinon 333-41-5 0.000043 oDibenzofuran 132-64-9 2.0×10⁻³ e 0.0037 oDi-n-butyl phthalate 84-74-2 200 c 0.45 g 30000 e 0.035 o 0.8 h 2200 f2,4-Dichloroaniline 100 a3,4-Dichloroaniline 10 d 20 a1,2-Dichlorobenzene 95-50-1 0.014 o1,3-Dichlorobenzene 541-73-1 0.071 o1,4-Dichlorobenzene 106-46-7 20 a 0.015 ocis-1,4-Dichloro-2-butene 764-41-0 1000 btrans-1,4-Dichloro-2-butene 1000 b1,1-Dichloroethane 75-34-3 0.047 o1,2-Dichloroethane (EDC) 107-06-2 70 g 2780 e 20.0 q 125 h 200 f1,1-Dichloroethylene 75-35-4 3750 e 0.025 o 230 f1,2-Dichloroethylene (cis) 156-59-2 2500 e 0.590 o 180 f1,2-Dichloroethylene (trans) 156-60-5 2500 e 0.590 o 180 f1,2-Dichloroethylene (mixture) 540-59-0 2500 e 0.590 o 180 f2,4-Dichlorophenol 120-83-2 20 d 3.65 q3,4-Dichlorophenol 20 c 20 a1,2-Dichloropropane 78-87-5 700 a 5.7 q1,3-Dichloropropene 542-75-6 0.244 qDieldrin 60-57-1 0.3 g 3 e 0.000056 t 0.6 h 0.15 fDiethyl phthalate 84-66-2 100 c 2.5×10⁵ e 0.210 o 1.8×10⁴ fDi-n-hexylphthalate 3050 e 220 f

Oregon Department of Environmental QualityGUIDANCE FOR ECOLOGICAL RISK ASSESSMENT
LEVEL II SCREENING LEVEL VALUES
December 2001 SLV - 6
Table 1. Screening Level Values for Plants, Invertebrates, and Wildlife Exposed to Soil and Surface Water
Soils (mg/kg) Surface Water (mg/L)
Terrestrial Receptors Fresh
CHEMICAL CAS No. Plants Inverts Birds Mammals Aquatic Birds Mammals
2,4-Dimethylphenol 105-67-9 20 c 0.042 rDimethyl phthalate 131-11-3 200 a 0.003 qDimethyl terephthalate 120-61-6 0.003 q2,4-Dinitrophenol 51-28-5 20 cDinitrotoluene mixture 25321-14-6 0.230 q2,4-Dinitrotoluene 121-14-2 0.230 q2,6-Dinitrotoluene 606-20-2 0.230 qDi-n-octyl phthalate 117-84-0 0.708 p1,4-Dioxane 123-91-1 63 e 4 f1,2-Diphenylhydrazine 122-66-7 0.0054 rEndosulfan 115-29-7 42 g 20 e 0.000056 q,t 72 h 1 fEndrin 72-20-8 0.04 g 5 e 0.000036 t 0.07 h 0.3 fEthanol 4000 e 245 fEthyl acetate 141-78-6 11250 e 690 fEthylbenzene 100-41-4 0.0073 oFluoranthene 206-44-0 0.00616 nFluorene 86-73-7 30 a 0.0039 pFormaldehyde 50-00-0 3900 e 184 fFuran 110-00-9 600 cGuthion 86-50-0 0.00001 tHeptachlor 76-44-8 15 e,i 3.8×10⁻⁶ q,t 2 f,iHeptachlor epoxide 102-45-73 3.8×10⁻⁶ tHeptane 1 dHexachlorobenzene 118-74-1 1000 bHexachlorobutadiene 87-68-3 0.0093 qHexachlorocyclopentadiene 77-47-4 10 c 0.0052 qHexachloroethane 67-72-1 0.540 qn-Hexane 110-54-3 0.00058 o

Oregon Department of Environmental QualityGUIDANCE FOR ECOLOGICAL RISK ASSESSMENT
LEVEL II SCREENING LEVEL VALUES
December 2001 SLV - 7
Table 1. Screening Level Values for Plants, Invertebrates, and Wildlife Exposed to Soil and Surface Water
Soils (mg/kg) Surface Water (mg/L)
Terrestrial Receptors Fresh
CHEMICAL CAS No. Plants Inverts Birds Mammals Aquatic Birds Mammals
2-Hexanone 0.099 oIsophorone 78-59-1 2.34 rKepone (Chlordecone) 143-50-0 10 e 0.6 fMalathion 121-75-5 0.0001 q,tMethanol 67-56-1 6250 e 384 fMethoxychlor 72-43-5 500 e,i 0.00003 q,t 30 f,iMethylene chloride 75-09-2 730 e 2.200 o 45 fMethyl ethyl ketone 78-93-3 2.0×10⁵ e 14000 f1-Methylnaphthalene 0.0021 o4-Methyl-2-pentanone 0.170 o2-Methylphenol (o-Cresol) 95-48-7 50 d 16000 e 0.013 o 2200 fMirex 2385-85-5 0.000001 q,tNaphthalene 91-20-3 10 d 3900 e,i 0.620 q 284 f,i3-Nitroaniline 99-09-2 70 d4-Nitroaniline 100-01-6 40 dNitrobenzene 98-95-3 8 d 40 a 0.54 r4-Nitrophenol 100-02-7 10 d 7 a 0.150 qN-Nitrosodi-n-butylamine 924-16-3 0.117 rN-Nitrosodiethanolamine 1116-54-7 0.117 rN-Nitrosodiethylamine 55-18-5 0.117 rN-Nitrosodimethylamine 62-75-9 0.117 rN-Nitrosodiphenylamine 86-30-6 20 a 0.210 oN-Nitroso di-n-propylamine 621-64-7 0.117 rN-Nitroso-N-methylethylamine 10595-95-6 0.117 r2-Octanone 0.0083 oParathion 56-38-2 0.000013 q,tPentachlorobenzene 608-93-5 40 a 0.00047 oPentachloronitrobenzene 82-68-8 30 g 51 h

Oregon Department of Environmental QualityGUIDANCE FOR ECOLOGICAL RISK ASSESSMENT
LEVEL II SCREENING LEVEL VALUES
December 2001 SLV - 8
Table 1. Screening Level Values for Plants, Invertebrates, and Wildlife Exposed to Soil and Surface Water
Soils (mg/kg) Surface Water (mg/L)
Terrestrial Receptors Fresh
CHEMICAL CAS No. Plants Inverts Birds Mammals Aquatic Birds Mammals
Pentachlorophenol 87-86-5 3 c 4 a 30 e 0.015 t 1.8 f1-Pentanol 0.110 oPhenanthrene 0.0063 nPhenol 108-95-2 70 c 30 a 0.110 nPolychlorinated biphenyls (Total) 1336-36-3 40 c 4 e,i 0.000014 q,t 0.27 e,iAroclor 1016 12674-11-2 100 e 13 fAroclor 1221 0.00028 oAroclor 1232 0.00058 oAroclor 1242 1.5 g 5 e 0.000053 o 3.0 h 0.7 fAroclor 1248 0.000081 oAroclor 1254 11097-69-1 0.7 g 4 e 0.000033 o 1.3 h 0.3 fAroclor 1260 0.094 o2-Propanol 0.0075 oStyrene 100-42-5 300 c2,3,7,8-TCDD (dioxin) 1746-01-6 5.5×10⁻⁵ g 1.2×10⁻⁴ e 1.0×10⁻⁴ h 7.6×10⁻⁶ f2,3,5,6-Tetrachloroaniline 20 c 20 a1,2,3,4-Tetrachlorobenzene 10 a1,1,1,2-Tetrachloroethane 630-20-6 0.186 r1,1,2,2-Tetrachloroethane 79-34-5 2.4 qTetrachloroethylene (PCE) 127-18-4 10 d 80 e 0.840 q 6 fTetrachloromethane 0.240 o2,3,4,6-Tetrachlorophenol 58-90-2 20 aToluene 108-88-3 200 c 1440 e 0.0098 o 104 fp-Toluidine 106-49-0 100 dToxaphene 8001-35-2 1000 e 2.0×10⁻⁷ q,t 60 fTribromomethane 0.320 oTributyltin 0.000063 tTributyltin oxide (TBTO) 56-35-9 28 g 1300 e,i 0.01 s 49 h 94 f,i

Oregon Department of Environmental QualityGUIDANCE FOR ECOLOGICAL RISK ASSESSMENT
LEVEL II SCREENING LEVEL VALUES
December 2001 SLV - 9
Table 1. Screening Level Values for Plants, Invertebrates, and Wildlife Exposed to Soil and Surface Water
Soils (mg/kg) Surface Water (mg/L)
Terrestrial Receptors Fresh
CHEMICAL CAS No. Plants Inverts Birds Mammals Aquatic Birds Mammals
2,4,5-Trichloroaniline 20 c 20 a1,2,3-Trichlorobenzene 20 a1,2,4-Trichlorobenzene 120-82-1 20 a 0.110 o1,1,1-Trichloroethane 71-55-6 55550 e 0.011 o 4000 f1,1,2-Trichloroethane 79-00-5 9.4 qTrichloroethylene (TCE) 79-01-6 40 e 21.9 q 3 f2,4,5-Trichlorophenol 95-95-4 4 c 9 a2,4,6-Trichlorophenol 88-06-2 10 d 10 a 0.970 qVinyl acetate 108-05-4 0.016 oVinyl chloride 75-01-4 20 e 1.3 fm-Xylene 108-38-3 0.0018 oo-Xylene 95-47-6 1 dXylene (mixed) 1330-20-7 100 d 120 e 0.013 o 8 f
Table 1 Notes
a) Oak Ridge National Laboratory (ORNL) TM-126 [1995] Table 1 (earthworms)b) ORNL TM-126 [1995] Table 2 (microbial processes)c) ORNL TM-85/R3 [1997] Table 1 (soil)d) ORNL TM-85/R3 [1997] Table 1 (soil solution)e) NOAEL equivalent concentration in food (i.e., the dietary level in food of a chemical that would result in a dose equivalent to the
NOAEL, assuming no other exposures) for mammals. Calculated per Equation (10) in ORNL TM-86/R3 [1996], with NOAELvalues from Appendix A of same reference. Assumes diet is 10% soil – approximately the 95th percentile of estimated percentsoil in diet (dry weight) values for mammals given in Tables 4-4 and 4-5 of the Wildlife Exposure Factors Handbook(EPA/600/R-93/187, 1993).
f) NOAEL equivalent concentration in drinking water (i.e., the level of a chemical in the drinking water of an animal that would resultin a dose equivalent to the NOAEL, assuming no other exposures) for mammals. Calculated per Equation (22) in ORNL TM-
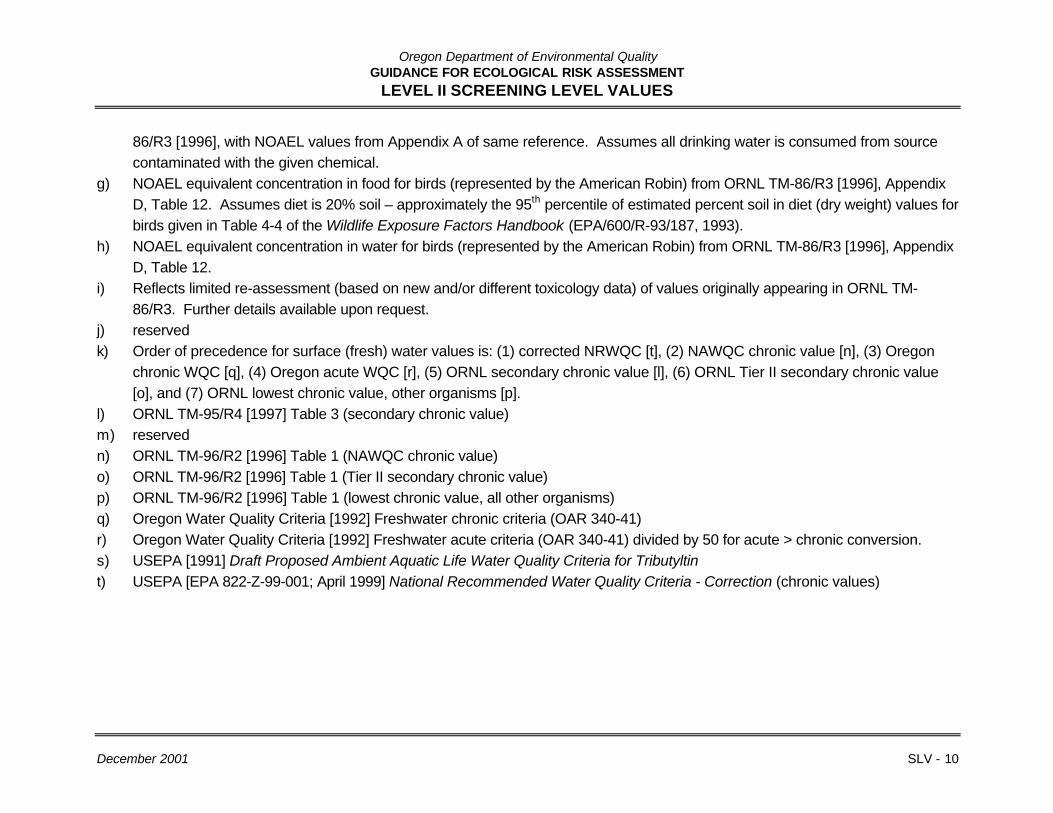
Oregon Department of Environmental QualityGUIDANCE FOR ECOLOGICAL RISK ASSESSMENT
LEVEL II SCREENING LEVEL VALUES
December 2001 SLV - 10
86/R3 [1996], with NOAEL values from Appendix A of same reference. Assumes all drinking water is consumed from sourcecontaminated with the given chemical.
g) NOAEL equivalent concentration in food for birds (represented by the American Robin) from ORNL TM-86/R3 [1996], AppendixD, Table 12. Assumes diet is 20% soil – approximately the 95th percentile of estimated percent soil in diet (dry weight) values forbirds given in Table 4-4 of the Wildlife Exposure Factors Handbook (EPA/600/R-93/187, 1993).
h) NOAEL equivalent concentration in water for birds (represented by the American Robin) from ORNL TM-86/R3 [1996], AppendixD, Table 12.
i) Reflects limited re-assessment (based on new and/or different toxicology data) of values originally appearing in ORNL TM-86/R3. Further details available upon request.
j) reservedk) Order of precedence for surface (fresh) water values is: (1) corrected NRWQC [t], (2) NAWQC chronic value [n], (3) Oregon
chronic WQC [q], (4) Oregon acute WQC [r], (5) ORNL secondary chronic value [l], (6) ORNL Tier II secondary chronic value[o], and (7) ORNL lowest chronic value, other organisms [p].
l) ORNL TM-95/R4 [1997] Table 3 (secondary chronic value)m) reservedn) ORNL TM-96/R2 [1996] Table 1 (NAWQC chronic value)o) ORNL TM-96/R2 [1996] Table 1 (Tier II secondary chronic value)p) ORNL TM-96/R2 [1996] Table 1 (lowest chronic value, all other organisms)q) Oregon Water Quality Criteria [1992] Freshwater chronic criteria (OAR 340-41)r) Oregon Water Quality Criteria [1992] Freshwater acute criteria (OAR 340-41) divided by 50 for acute > chronic conversion.s) USEPA [1991] Draft Proposed Ambient Aquatic Life Water Quality Criteria for Tributyltint) USEPA [EPA 822-Z-99-001; April 1999] National Recommended Water Quality Criteria - Correction (chronic values)
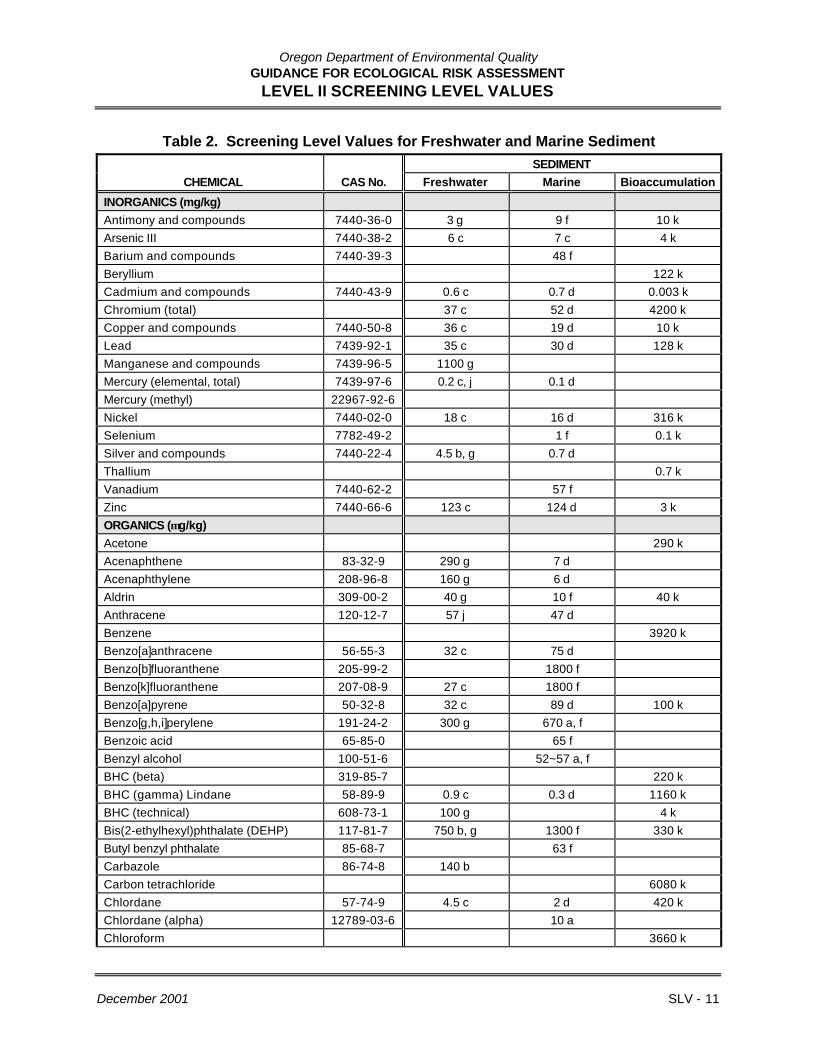
Oregon Department of Environmental QualityGUIDANCE FOR ECOLOGICAL RISK ASSESSMENT
LEVEL II SCREENING LEVEL VALUES
December 2001 SLV - 11
Table 2. Screening Level Values for Freshwater and Marine Sediment
SEDIMENT
CHEMICAL CAS No. Freshwater Marine Bioaccumulation
INORGANICS (mg/kg)
Antimony and compounds 7440-36-0 3 g 9 f 10 kArsenic III 7440-38-2 6 c 7 c 4 kBarium and compounds 7440-39-3 48 fBeryllium 122 kCadmium and compounds 7440-43-9 0.6 c 0.7 d 0.003 kChromium (total) 37 c 52 d 4200 kCopper and compounds 7440-50-8 36 c 19 d 10 kLead 7439-92-1 35 c 30 d 128 kManganese and compounds 7439-96-5 1100 gMercury (elemental, total) 7439-97-6 0.2 c, j 0.1 dMercury (methyl) 22967-92-6Nickel 7440-02-0 18 c 16 d 316 kSelenium 7782-49-2 1 f 0.1 kSilver and compounds 7440-22-4 4.5 b, g 0.7 dThallium 0.7 kVanadium 7440-62-2 57 fZinc 7440-66-6 123 c 124 d 3 kORGANICS (µg/kg)
Acetone 290 kAcenaphthene 83-32-9 290 g 7 dAcenaphthylene 208-96-8 160 g 6 dAldrin 309-00-2 40 g 10 f 40 kAnthracene 120-12-7 57 j 47 dBenzene 3920 kBenzo[a]anthracene 56-55-3 32 c 75 dBenzo[b]fluoranthene 205-99-2 1800 fBenzo[k]fluoranthene 207-08-9 27 c 1800 fBenzo[a]pyrene 50-32-8 32 c 89 d 100 kBenzo[g,h,i]perylene 191-24-2 300 g 670 a, fBenzoic acid 65-85-0 65 fBenzyl alcohol 100-51-6 52~57 a, fBHC (beta) 319-85-7 220 kBHC (gamma) Lindane 58-89-9 0.9 c 0.3 d 1160 kBHC (technical) 608-73-1 100 g 4 kBis(2-ethylhexyl)phthalate (DEHP) 117-81-7 750 b, g 1300 f 330 kButyl benzyl phthalate 85-68-7 63 fCarbazole 86-74-8 140 bCarbon tetrachloride 6080 kChlordane 57-74-9 4.5 c 2 d 420 kChlordane (alpha) 12789-03-6 10 aChloroform 3660 k

Oregon Department of Environmental QualityGUIDANCE FOR ECOLOGICAL RISK ASSESSMENT
LEVEL II SCREENING LEVEL VALUES
December 2001 SLV - 12
Table 2. Screening Level Values for Freshwater and Marine Sediment
SEDIMENT
CHEMICAL CAS No. Freshwater Marine Bioaccumulation
Chrysene 218-01-9 57 c 107 dDDD 72-54-8 4 c 1 d 0.3 kDDE 72-55-9 1.5 c 2 d 0.3 kDDT 50-29-3 4 j 1 d 0.3 kDDT (Total) 7 c 4 d 0.3 kDibenz[a,h]anthracene 53-70-3 33 j 6 dDibenzofuran 132-64-9 5100 g 110 fDi-n-butyl phthalate 84-74-2 110 g 58 f 60 k1,2-Dichlorobenzene 95-50-1 13 f1,3-Dichlorobenzene 541-73-1 170 a1,4-Dichlorobenzene 106-46-7 110 a, f1,1-Dichloroethylene 1590 k1,2-Dichloroethane 3430 k1,2-Dichloroethylene 5760 kDieldrin 60-57-1 3 c 0.7 d 4 kDiethyl phthalate 84-66-2 6 f 8.3 × 10⁶ k2,4-Dimethylphenol 105-67-9 18 fDimethyl phthalate 131-11-3 6 fDi-n-octyl phthalate 117-84-0 61 f1,4-Dioxane 10 kEndosulfan 115-29-7 110 kEndrin 72-20-8 3 c 4 kEthanol 840 kEthyl acetate 8950 kEthylbenzene 100-41-4 4 fFluoranthene 206-44-0 111 c 113 dFluorene 86-73-7 77 j 21 dFormaldehyde 900 kHeptachlor 76-44-8 10 g 0.3 f 24 kHeptachlor epoxide 102-45-73 0.6 cHexachlorobenzene (HCB) 118-74-1 100 g 6 fHexachlorobutadiene 87-68-3 1 fHexachloroethane 67-72-1 73 fIndeno[1,2,3-cd]pyrene 193-39-5 17 c 600 fKepone (Chlordecone) 143-50-0 24 kMethanol 630 kMethoxychlor 72-43-5 990 kMethyl ethyl ketone 1.1 × 10⁶ kMethylene chloride 930 k2-Methylnaphthalene 91-57-6 20 d2-Methylphenol (o-cresol) 95-48-7 8 f4-Methylphenol (p-cresol) 106-44-5 100 f
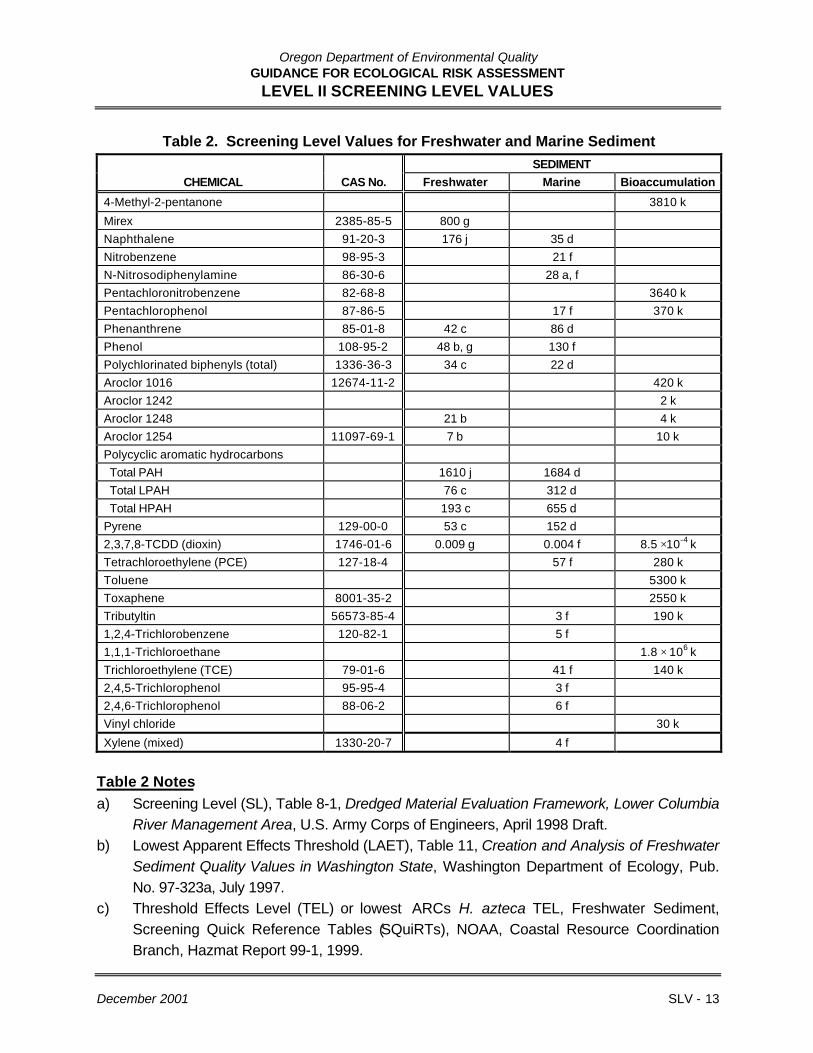
Oregon Department of Environmental QualityGUIDANCE FOR ECOLOGICAL RISK ASSESSMENT
LEVEL II SCREENING LEVEL VALUES
December 2001 SLV - 13
Table 2. Screening Level Values for Freshwater and Marine Sediment
SEDIMENT
CHEMICAL CAS No. Freshwater Marine Bioaccumulation
4-Methyl-2-pentanone 3810 kMirex 2385-85-5 800 gNaphthalene 91-20-3 176 j 35 dNitrobenzene 98-95-3 21 fN-Nitrosodiphenylamine 86-30-6 28 a, fPentachloronitrobenzene 82-68-8 3640 kPentachlorophenol 87-86-5 17 f 370 kPhenanthrene 85-01-8 42 c 86 dPhenol 108-95-2 48 b, g 130 fPolychlorinated biphenyls (total) 1336-36-3 34 c 22 dAroclor 1016 12674-11-2 420 kAroclor 1242 2 kAroclor 1248 21 b 4 kAroclor 1254 11097-69-1 7 b 10 kPolycyclic aromatic hydrocarbons Total PAH 1610 j 1684 d Total LPAH 76 c 312 d Total HPAH 193 c 655 dPyrene 129-00-0 53 c 152 d2,3,7,8-TCDD (dioxin) 1746-01-6 0.009 g 0.004 f 8.5 ×10⁻⁴ kTetrachloroethylene (PCE) 127-18-4 57 f 280 kToluene 5300 kToxaphene 8001-35-2 2550 kTributyltin 56573-85-4 3 f 190 k1,2,4-Trichlorobenzene 120-82-1 5 f1,1,1-Trichloroethane 1.8 × 10⁶ kTrichloroethylene (TCE) 79-01-6 41 f 140 k2,4,5-Trichlorophenol 95-95-4 3 f2,4,6-Trichlorophenol 88-06-2 6 fVinyl chloride 30 kXylene (mixed) 1330-20-7 4 f
Table 2 Notes
a) Screening Level (SL), Table 8-1, Dredged Material Evaluation Framework, Lower ColumbiaRiver Management Area, U.S. Army Corps of Engineers, April 1998 Draft.
b) Lowest Apparent Effects Threshold (LAET), Table 11, Creation and Analysis of FreshwaterSediment Quality Values in Washington State, Washington Department of Ecology, Pub.No. 97-323a, July 1997.
c) Threshold Effects Level (TEL) or lowest ARCs H. azteca TEL, Freshwater Sediment,Screening Quick Reference Tables (SQuiRTs), NOAA, Coastal Resource CoordinationBranch, Hazmat Report 99-1, 1999.

Oregon Department of Environmental QualityGUIDANCE FOR ECOLOGICAL RISK ASSESSMENT
LEVEL II SCREENING LEVEL VALUES
December 2001 SLV - 14
d) Threshold Effects Level (TEL), Marine Sediment, SquiRTs.e) Apparent Effects Threshold (AET), Freshwater Sediment, SquiRTs.f) Apparent Effects Threshold (AET), Marine Sediment, SquiRTs.g) Upper Effects Threshold (UET), Freshwater Sediment, SquiRTs.h) Upper Effects Threshold (UET), Marine Sediment, SquiRTs.i) Freshwater Chronic Criteria, Ambient Water Quality Criteria Document for Tributyltin, U.S.
Environmental Protection Agency, 62 FR 42554, August 7, 1997.j) Threshold Effects Concentration (TEC). Smith, SL., MacDonald, DD, Keenleyside, KA,
Ingersoll, CG, and Field, J. 1996. A preliminary evaluation of sediment quality assessmentvalues for freshwater ecosystems. Journal of Great Lakes Research 22:624-638.
k) Allowable water concentrations (Cw) calculated per Equation (28), Section 3.5 of ORNLTM-86/R3 [1996]. Value is lowest for representative piscivorous bird (Great Blue Heron) orpiscivorous mammal (mink) species. Conversion of water (Cw) to sedimentconcentrations assumes 1% organic carbon content and organic carbon partitioncoefficient (Koc) estimated from the octanol water partition coefficient (Kow; taken fromORNL TM-86/R3 [1996]) using the regression relationship: log Koc = 0.00028 + 0.983(logKow) [Di Toro et al. 1991. Technical basis for establishing sediment quality criteria fornonionic organic chemicals using equilibrium partitioning. Environmental Toxicology andChemistry 10: 1541 - 1583].

Oregon Department of Environmental QualityGUIDANCE FOR ECOLOGICAL RISK ASSESSMENT
LEVEL III - BASELINE
Updated March 2000 III - 1
INTRODUCTIONThe DEQ ecological risk assessment process consists of four distinct levels, as follows (and asshown in Figure 1):
• Level I Scoping• Level II Screening• Level III Baseline• Level IV Field Baseline
Within and between these levels are a number of Technical/Management Decision Points (TMDP).Based on the information developed and presented within a given level, these TMDPs determineone of three recommendations:
• No further ecological investigations at the site, or• Continuation of the risk assessment process at the next level, or• Undertake (beyond Level I only) a removal or remedial action.
The outcome of each level of the assessment should be documented in writing. Thoroughdocumentation will provide a future reference for any other site-related activities involving ahazardous substance release, future site remedial actions, or onsite monitoring.
Prior to undertaking any ecological risk assessment pursuant to OAR 340-122-084, risk assessorsshould have read and be familiar with the terms, concepts, and approaches discussed in thefollowing documents:
• USEPA Proposed Guidelines for Ecological Risk Assessment (61 FR 47552, 9/9/96)• USEPA Region X Supplemental Ecological Risk Assessment Guidance for Superfund
(EPA 910-R-97-005, June 1997)• ORS 465.315• OAR 340-122-010 through -115• State of Oregon Level I, II, III, and IV Ecological Risk Assessment Guidance
OBJECTIVEThe objective of a Level III baseline assessment is to determine whether a site, if leftunremediated, would pose unacceptable current or reasonably likely future risks to endpointspecies. The purposes of a baseline assessment are to determine: (a) if significant ecologicaleffects are occurring at a site, (b) the probable causes of these effects, (c) the source of causalagents, and (d) the consequences of leaving the site unremediated. The Level III assessment

Oregon Department of Environmental QualityGUIDANCE FOR ECOLOGICAL RISK ASSESSMENT
LEVEL III - BASELINE
Updated March 2000 III - 2
provides the basis for determining the need for remediation and provides information necessaryfor the development of protective remedial alternatives.
A Level III assessment would generally be performed during a remedial investigation (RI) to meetthe baseline risk assessment requirements of OAR 340-122-080(5). Any ecological baseline riskassessment performed in support of an RI must meet the information requirements of OAR 340-122-084(3). Note also that a baseline risk assessment is a necessary precursor to a residual riskassessment, which in turn is a prerequisite to demonstrating that remedial actions are protective ofhuman health and the environment as defined by OAR 340-122-040(2)(a). A Level IV fieldbaseline assessment would be used only to refine, reduce uncertainties in, or validate the accuracyof the Level III assessment at the discretion of the risk manager / risk assessor.
PREREQUISITESInitiation of Level III requires completion of a Level I and/or Level II assessment with a decisionto proceed with further ecological investigation. U.S. EPA has concluded that the strengths andweaknesses of ecological risk assessments seem to originate from decisions made during theproblem formulation stage. It is especially important at this stage to identify and contact anystakeholders with responsibilities for the resources being analyzed. If the affected parties do notparticipate in the early decisions about goals, endpoints, and measurements, the analysis is likelyto fail to provide information useful for decisionmaking. Therefore, it is strongly recommendedthat problem formulation (Tasks 1, 2, and 3 below) be completed, with stakeholder involvement,before Level III commences.
Completion of problem formulation requires: (a) assessment endpoints that link the risk assessmentto management concerns, (b) a Conceptual Site Model (CSM) that describes key relationshipsbetween a Contaminant of Potential Ecological Concern (CPEC) and assessment endpoint oramong several CPECs and assessment endpoints, and (c) finally, an analysis plan. The assessmentendpoints and their associated endpoint species, risk hypotheses, conceptual site model(s), andother information developed in Levels I and/or II should be reviewed and, if necessary, revised toreflect any new information or the results of further discussions among stakeholders.
TASKS (see Figure 2)(1) Complete problem formulation Following the screening process described in the Level II
guidance, there should now be fewer CPEC under consideration. This should make itpossible to better “think through” the relationship between specific CPEC, theirtoxicological characteristics, their likely pathway to specific ecological receptors, and theeffect(s) they may induce in these receptors. This process should substantially lessen the

Oregon Department of Environmental QualityGUIDANCE FOR ECOLOGICAL RISK ASSESSMENT
LEVEL III - BASELINE
Updated March 2000 III - 3
chance of having inappropriate assessment endpoints and of having the assessment itselfconsider insignificant or implausible CPEC - pathway - receptor relationships.(a) Review/revise assessment endpoints Definition of assessment endpoints for the
baseline assessment should be derived from the valued components of theecosystem, as determined by further discussions amongst risk managers, otherstakeholders, and risk assessors. Even if assessment endpoints identified by riskmanagers and/or stakeholders have no possible relationship to CPECs, they shouldnonetheless be carried forward in the assessment process so that stakeholders donot feel that their concerns are being slighted. An explanation of why furtherdetailed evaluation of an assessment endpoint is not needed in Level III should beprovided, but the assessment endpoint must be retained.
(b) Review/revise risk hypotheses The preliminary risk hypotheses stated for Task(10) of the Level II assessment are reviewed and further focused prior to designingand performing any baseline investigations. This will limit generation of data thatare of little use in assessing baseline risk.
(c) Establish measures There are three categories of measures, each of which may beevaluated either qualitatively and/or quantitatively:(i) Measures of exposure describe how exposure may be occurring, including
CPEC concentrations in abiotic and biotic media, how a CPEC movesthrough the environment, and how it may co-occur with the assessmentendpoint.
(ii) Measures of effect evaluate the response of the assessment endpoint whenexposed to a CPEC.
(iii) Measures of characteristics include site characteristics that influence thebehavior and location of assessment endpoints and of CPEC distribution, aswell as natural history characteristics of the assessment endpoint that mayaffect exposure or response to the CPEC.
(d) It can be useful to organize the chosen baseline assessment endpoints and measuresinto a table format (Table 1 provides examples) to more clearly illustrate theirrelation to one another. The preliminary conceptual site model (CSM) developedduring Level II can now be completed and will include: (a) text describing the riskhypotheses and associated measures, (b) an exposure pathway model (EPM), and(c) a measures of exposure/effect model (MEEM) (see Attachment 1) that tracesCPEC movement from the primary source to subsequent sources, and from therethrough the food chain to one or more points where exposures and effects, that canaffect the assessment endpoint, will be measured to evaluate the risk hypotheses.Note that an EPM alone does not constitute a complete CSM.
(e) Establishing clear assessment endpoints, risk hypotheses, and associated measures
Oregon Department of Environmental QualityGUIDANCE FOR ECOLOGICAL RISK ASSESSMENT
LEVEL III - BASELINE
Updated March 2000 III - 4
should enable all concerned parties to think through and agree upon a commonbasis for understanding what is at risk at a given site. They define the terms underwhich an assessment will be brought to closure. Definition of appropriateassessment endpoints avoids making remedial decisions on the basis of trivial orinsignificant effects. Therefore, once these factors have been defined, all affectedparties and stakeholders should agree as to their acceptability. The assessmentendpoints, hypotheses, and measures should be manipulated and refined until suchan agreement is achieved; at which point an analysis plan can be prepared.
(2) Prepare analysis plan This plan describes the assessment design, data needs, measures,
and methods for conducting the exposure and effects analysis components of the riskassessment. It may be relatively brief or extensive depending on the nature of theassessment; however, it should be included as a component of the overall RI work plan forthe site. The plan includes, but is not limited to, discussion of:(a) Data Quality Objectives (DQOs) for the assessment.(b) The data interpretation paradigm, i.e., how measures and associated data analyses
will test or otherwise evaluate the risk hypotheses.(c) The risk characterization options that will be used, including any probabilistic
methods or weight-of evidence techniques involving a combination of qualitativeand quantitative data.
(d) How uncertainties in the data and analyses will be addressed.(e) How the results will be presented.(f) If sampling and analysis of biotic material is required for Level III, or if a Level IV
risk assessment is anticipated, Field Sampling and Analysis and QualityAssurance/Quality Control Project Plans will be required.
(3) TMDP 5: Use Probabilistic Methods? Per OAR 340-122-084(1)(b), risk assessments
may be conducted using either deterministic or Probabilistic Risk Assessment (PRA)methodologies at the discretion of the party conducting the risk assessment. If a decision ismade to proceed with a PRA, then specific issues must be addressed prior tocommencement of the assessment or it will not be accepted by the Department. The issuesthat must be discussed with the Department prior to the PRA are described in OAR 340-122-084(5)(a)(A - D). Once these issues have been satisfactorily addressed, the PRAmust then meet the information requirements described in OAR 340-122-084(5)(d).
(4) Perform exposure analysis Per OAR 340-122-115(25), the exposure point value (EPV)
is the concentration or dose of a hazardous substance occurring at a location of potentialcontact between an ecological receptor and the hazardous substance. Determining the EPV

Oregon Department of Environmental QualityGUIDANCE FOR ECOLOGICAL RISK ASSESSMENT
LEVEL III - BASELINE
Updated March 2000 III - 5
requires taking into consideration a number of factors including, but not limited to, thespatial distribution of endpoint species and their habitat relative to the spatial distributionof CPEC concentrations. Calculating EPVs for any given endpoint species populationinvolves the following process:(a) Identify Ecological Receptors Based on the results of Level I and II assessments,
identify ecological receptors at and in the locality of the site.(b) Identify Assessment Endpoints and Endpoint Species Performed during Level II,
Task (5) and above in Task (1).(c) Define Local Population Boundaries This is necessary for plants and animals other
than threatened and endangered species. Refer to Appendix A for details.(d) Determine Habitat Size and Quality This is necessary for plants and animals other
than threatened and endangered species. Refer to Appendix A for details.(e) Estimate Exposure Point Value (EPV) Measured abiotic and/or biotic (tissues)
media environmental concentrations (ECs) for a given CPEC may be used within anappropriate site-specific exposure model(s) to estimate the EPV. A useful modelgenerally requires inclusion of the following:(i) Modeling is a cost-effective, but less uncertain, method for estimating
contaminant concentrations (tissue residues) in endpoint species and/ortheir prey/forage items. Measurement of contaminant concentrations intissues of endpoint or prey species collected at and in the locality of the sitecan greatly enhance the determination of actual exposure, bioaccumulationpotential, and trophic transfer of contaminants. Tissue sampling should beused at sites where greater certainty in the risk assessment is required.
(ii) Information on endpoint species food webs is usually required to fullyevaluate exposure pathways, particularly those leading to higher trophiclevel receptors. A simple illustration of the food web(s) being consideredfor exposure analysis should be included (see example in Attachment 2).
(iii) Data on endpoint species natural history parameters (dietary fraction,weight, home range, etc.) keyed to the food web may also be required tomake quantitative exposure estimates for these receptors.
(iv) An understanding of a contaminant’s physicochemical properties isnecessary to: (a) evaluate potential exposure routes, (b) estimatebioconcentration and/or bioaccumulation factors, and (c) assess its mobilityand bioavailability.
(v) Refer to Appendix A for a description of a population-level exposureestimation model.

Oregon Department of Environmental QualityGUIDANCE FOR ECOLOGICAL RISK ASSESSMENT
LEVEL III - BASELINE
Updated March 2000 III - 6
(5) Perform ecological response analysis Chemical contaminants coming into contact withendpoint species can induce acute or chronic adverse effects in individual organisms, ormay indirectly affect their ability to survive and reproduce. Ecological effects may also beexpressed as some impairment of a biological function or condition which may potentiallyeffect populations.(a) Individual-level EBV Per OAR 340-122-084(1)(h)(B)(i), effects at the level of the
individual are assessed only for threatened or endangered species pursuant to 16USC. 1531 et seq or ORS 496.172. Per OAR 340-122-115(21), the EBV forindividual receptors is defined as the highest no-observed-adverse-effect-level(NOAEL) considering effects on reproductive success.
(b) Population-level EBV Per OAR 340-122-084(1)(h)(B)(ii), effects on speciesother than those classified as threatened or endangered are made only at thepopulation level. Per OAR 340-122-115(21), the EBV for populations is definedas the median lethal dose or concentration (LD50 or LC50). Note that, in addition toconsidering the EBV, the risk assessment must also demonstrate that there are noother observed significant adverse effects on the health or viability of the localpopulation.
(c) EBV derivation If a NOAEL, LD50 or LC50, as applicable, is not available forendpoint species considered in the risk assessment, the EBV may be derived fromother toxicological endpoints for those receptors or appropriate surrogates forthose receptors, adjusted with uncertainty factors to equate to a NOAEL, LD50 orLC50. Also, per OAR 340-122-115(21), the EBV shall be based, to the extentpracticable, on studies whose routes of exposure and duration of exposure werecommensurate with the expected routes and duration of exposure for endpointspecies considered in the risk assessment, or appropriate surrogates for thosereceptors.
(d) Uncertainty factors A logical process (shown in Table 2) may be used to convert avariety of toxicological endpoints to a NOAEL suitable for evaluating risk toindividual threatened and endangered species. See also EPA (1997).
(e) Toxicity profiles Single numerical values offered for either individual orpopulation-level EBVs should be supported by detailed toxicity profiles for eachCPEC with respect to each endpoint species associated with an assessmentendpoint. These toxicity profiles should describe the mechanism of toxicity for agiven CPEC for a range of endpoint species and, if data are available, for thosereceptors of specific interest to this assessment or their appropriate surrogates.
(6) Perform risk characterization Risk characterization quantitatively defines the magnitude
of potential risks to endpoint species under a specific set of circumstances. It is the

Oregon Department of Environmental QualityGUIDANCE FOR ECOLOGICAL RISK ASSESSMENT
LEVEL III - BASELINE
Updated March 2000 III - 7
process of applying numerical methods and professional judgment to determine whetheracceptable risk levels for endpoint species are or could be exceeded as a result ofexposure to site-related CPECs. Risk characterization involves two components: aquantitative risk estimate and a narrative risk description.(a) Risk estimate
(i) For threatened and endangered species, a quotient methodology, whichsimply indicates whether the EPV is or is not greater than the EBV, is usedto assess “risk”. Thus, toxicity quotient (TQ) = EPV / EBV and toxicityindex (TI) = ΣTQ. Use of a TI assumes simple additivity of toxicresponses, however, other assumptions are possible - see OAR 340-122-084(1)(i).
(ii) For populations of endpoint species, risk estimation involves the followinggeneral process (See Appendix A for details):§ Estimate local population abundance§ Calculate probability of exposure exceeding the benchmark using one of
two probability functions.§ Calculate the number of individuals affected.§ Compare results of above calculations with definition of acceptable risk
levels i.e., determine whether 20% or more of the total local populationhas a ≥ 10% chance of EPV > EBV.
(b) Risk description This is a qualitative narrative discussion of risks presented by thesite and must include a discussion of any toxicological and ecological factorsbeyond those embodied in the quantitative risk estimates. Risk must be describedfor each CPEC-pathway-receptor combination, i.e., for each assessment endpoint.(i) Because no one piece of information can necessarily adequately define
risks to complex ecological systems, a formal "weight-of-evidence"approach might be needed to compile and integrate various types ofevidence indicating the degree of risk present for each CPEC andassessment endpoint. The four general types of evidence available to abaseline assessment consist of: (a) toxicity testing using abiotic media fromthe site, (b) ecological survey data from the site, (c) tissue residue analysisof biota collected from the site, and (d) comparison of CPEC exposureexperienced by endpoint species at the site to EBVs.
(ii) At Level III, however, only one type of evidence, (d) comparison of CPECexposure experienced by endpoint species at the site to EBVs, need beconsidered.
(iii) If required, a Level IV field baseline assessment would use fieldinvestigations to further refine the risk estimate through acquisition of the
Oregon Department of Environmental QualityGUIDANCE FOR ECOLOGICAL RISK ASSESSMENT
LEVEL III - BASELINE
Updated March 2000 III - 8
additional types of evidence (a, b, c). (7) Perform uncertainty analysis Estimates of the potential for adverse affects from
exposure to CPECs must often be made despite the presence of uncertainty (i.e., lack ofknowledge or data gaps) and variability (stochastic or natural variability). The uncertaintyanalysis summarizes assumptions made for each element of the assessment and evaluatestheir validity, the strengths and weaknesses of the analyses, and quantifies to the greatestextent possible the uncertainties associated with each identified risk. This analysisaddresses uncertainty associated with each component of the baseline assessment,including but not limited to: CPEC selection and quantification, receptor selection,exposure estimation, effects estimation, and risk characterization. It is important that datagaps that may have hindered or prevented the full determination of potential risk, andwhich may be addressed with a Level IV assessment, be identified at this time.
(8) Submit Level III deliverable This deliverable is a document (see Attachment 3, Baseline
Risk Assessment Report, for suggested format and contents) which will describe, in detail,all of the items listed in OAR 340-122-084(3)(a-g), as well as how the exposure andeffects analyses were performed, any assumptions employed in these analyses, the resultsof the risk characterization, and a thorough discussion of uncertainties inherent in the riskanalyses. The results presented in this report provide the factual basis for evaluating thefollowing TMDPs.
(9) TMDP 6: Ecological Acceptable Risk Level Exceeded? Based on information
presented in the Level III deliverable, are any of the following acceptable risk levelsexceeded for individuals and/or populations of endpoint species associated withassessment endpoints?(a) Individual Receptors (OAR 340-122-115(5)) The following criteria apply only to
threatened or endangered species pursuant to 16 USC 1531 et seq. or ORS465.172:(i) For deterministic risk assessments, a toxicity index (TI) less than or equal
to one for an individual endpoint species at an upper-bound exposure,where the toxicity index is the sum of the toxicity quotients attributable tosystemic toxicants with similar endpoints for similarly-responding speciesand the toxicity quotient is the ratio of the exposure point value to theecological benchmark value (see also OAR 340-122-084(1)(i)); or
(ii) For probabilistic risk assessments, a TI less than or equal to one at the 90thpercentile and less than or equal to 10 at the 95th percentile, each based onthe same distribution of toxicity index numbers for an exposed individual

Oregon Department of Environmental QualityGUIDANCE FOR ECOLOGICAL RISK ASSESSMENT
LEVEL III - BASELINE
Updated March 2000 III - 9
endpoint species; or(iii) The probability of important changes in such factors as growth, survival,
fecundity, or reproduction related to the health and viability of an individualendpoint species that are reasonably likely to occur as a consequence ofexposure to hazardous substances is de minimus.
(b) Populations of endpoint species (OAR 340-122-115(6) The following criteriaapply only populations of plants and animals other than those listed as thretaenedand endangered:(i) A 10 percent chance, or less, that 20 percent or more of the total local
population will be exposed to an exposure point value greater than theecological benchmark value for each contaminant of concern, and
(ii) No other observed significant adverse effects on the health or viability ofthe local population are identified. See Appendix A for details and anexample.
(c) No further investigation If all criteria (a - b above) are not exceeded, then the siteis highly unlikely to present significant risks to endpoint species and arecommendation for no further ecological investigations should be made.
(d) Further action If any criteria (a - b above) are exceeded, then the site could presentsignificant risks to endpoint species and a recommendation to move to the nextTMDP should be made. In this instance, the Level III analyses should identify (1)CPECs that clearly pose risks below the acceptable risk level (ARL) and thusrequire no further action, (2) CPECs that currently constitute risks above the ARLand thus should be subject to remediation, and (3) CPECs that may or may not posea significant ecological risk but, because of elevated uncertainty, should also besubject to remediation and/or monitoring. CPECs in category (2) or (3) are termedcontaminants of ecological concern (CEC) and are the focus of either furtherinvestigations or remedial actions.
(10) TMDP 7: Remedial Action Decision Possible? Based on the results of the Level III risk
assessment and possibly other factors, risk managers (and not risk assessors) must decideif they are willing to make a response action decision with existing information and currentlevels of uncertainty. Key questions: Would cleanup be less costly than furtherinvestigation? Are data adequate to approve a removal action or to select or approve aremedy? If “Y”, then further ecological investigation is deferred in favor of a responseaction. If “N”, then the assessment process proceeds to Level IV, after which it returns toTMDP 6.
ADDITIONAL INFORMATION

Oregon Department of Environmental QualityGUIDANCE FOR ECOLOGICAL RISK ASSESSMENT
LEVEL III - BASELINE
Updated March 2000 III - 10
Barnthouse LW & Suter II GW. 1986. User's Manual for Ecological Risk Assessment. ORNL-6251. Oak Ridge National Laboratory, Oak Ridge, Tennessee
Clifford PA, Barchers DE, Ludwig DF, Sielken RL, Klingensmith JS, Graham RV & Banton RL(1995) An approach to quantifying spatial components of exposure for ecological riskassessment. Environmental Toxicology and Chemistry 14, 895-906.
Maughan JT 1993. Ecological Assessment of Hazardous Waste Sites. Van Nostrand Reinhold,New York, 352 pp.
Menzie C, Henning MH, Cura J, Finkelstein K, Gentile J, Maughan J, Mitchell D, Petron S,Potocki B, Svirsky S & Tyler P. 1996. Special report of the Massachusetts weight-of-evidence workgroup: A weight-of-evidence approach for evaluating ecological risks. Humanand Ecological Risk Assessment 2, 277-304.
Moore DRJ & Biddinger GR 1996. The interaction between risk assessors and risk managersduring the problem formulation phase. Environmental Toxicology and Chemistry 14, 2013-2014.
USEPA 1997. Region 10 Supplemental Ecological Risk Assessment Guidance for Superfund.EPA 910-R-97-005. U.S. Environmental Protection Agency, Seattle, WA.
USEPA. 1996. Ecological Significance and Selection of Candidate Assessment Endpoints.EPA 540/F-95/037, Publication 9345.0-11FSI. Office of Solid Waste and EmergencyResponse, U.S. Environmental Protection Agency, Washington, D.C.
USEPA 1993. Wildlife Exposure Factors Handbook, Volume I of II. EPA/600/R-93/187a.Office of Research and Development, U.S. Environmental Protection Agency, Washington,D.C.
USEPA 1993. Wildlife Exposure Factors Handbook, Volume II of II. EPA/600/R-93/187b.Office of Research and Development, U.S. Environmental Protection Agency, Washington,D.C.
USEPA 1992. Developing a Work Scope for Ecological Assessments. Publication 9345.0-05I,Eco Update Intermittent Bulletin 1(4). Office of Solid Waste and Emergency Response, U.S.Environmental Protection Agency, Washington, D.C.
USEPA. 1989. Ecological Assessment of Hazardous Waste Sites: A Field and LaboratoryReference. EPA/600/3-89/013. Environmental Research Laboratory, U.S. EnvironmentalProtection Agency, Corvallis, Oregon.
USEPA. 1989. Risk Assessment Guidance for Superfund, Volume II, EnvironmentalEvaluation Manual. EPA/540/1-89/001. Office of Emergency and Remedial Response, U.S.Environmental Protection Agency, Washington, D.C.
Suter II GW 1993. Ecological Risk Assessment. Lewis Publishers, Boca Raton, Florida, 538 pp.

Oregon Department of Environmental QualityGUIDANCE FOR ECOLOGICAL RISK ASSESSMENT
LEVEL III - BASELINE
Updated March 2000 III - 11
Table 1Example Assessment Endpoints and Associated Measures
Specific Ecological Receptor MeasuresAssessment Endpoint (Entity) Exposure Effect
Acute and chronic toxic effects inbenthic community
Freshwater benthic community • Ecological community indices(abundance, diversity, etc.)
• Contaminant levels in sediments,surface water, and upwellinggroundwater
• Bioassays
• Estimated exceedence ofecological benchmark values(EBVs)
• Estimated exceedence ofpopulation-level effectthresholds
• Reference vs. onsite differencesin community indices
• Bioassay resultsAcute and chronic toxic effects innon-migratory (resident) fish
Largemouth bassFathead minnowSculpin
• Food chain exposure modeling• Contaminant levels in surface
water and sediments• Contaminant levels in food items
(plankton, invertebrates)• Contaminant tissue residue levels
• Estimated exceedence of EBVs• Estimated exceedence of
population-level effectthresholds
• Contaminant tissue residuelevels
Protect raptors from acute andchronic toxic effects due toconsumption of contaminated fooditems and incidental ingestion ofsurficial soils.
Red-tailed hawkAmerican kestrel
• Food chain exposure modeling• Contaminant levels in surficial
soils• Contaminant levels in food items
(small mammals, insects, birds)
• Estimated exceedence of EBVs• Estimated exceedence of
population-level effectthresholds
Acute and chronic toxic effects insmall mammals
Deer mouseMeadow vole
• Food chain exposure modeling• Contaminant levels in surficial
soils• Contaminant levels in food items
(vegetation, insects, earthworms)• Contaminant tissue residue levels
• Estimated exceedence of EBVs• Estimated exceedence of
population-level effectthresholds
• Measurement of bone density &strength
• Contaminant tissue residuelevels

Oregon Department of Environmental QualityGUIDANCE FOR ECOLOGICAL RISK ASSESSMENT
LEVEL III - BASELINE
Updated March 2000 III - 12
Table 2Methodology to Derive Ecological Benchmark Values (EBVs)a
To Convert From To NOAEL (EBV forThreatened &
Endangered Species),Multiply by
To LD50 or LC50 (EBVfor Populations),
Multiply by
Chronic NOEL or NOAEL 1 100
Chronic LOAEL 0.2 20
Subchronic NOAEL 0.1 10
Subchronic LOAEL 0.05 5
Acute NOAEL 0.03 3
Acute LOAEL 0.02 2
LD50 or LC50 0.01 1
Additional Modifiers
Tested species in different family, sameorder as target species
0.5 0.5
Tested species in different order, sameclass as target species
0.5 0.5
Tested species a non-protected speciesrelated to target protected species
0.5 0.5
Notes:
(a) Process to convert a toxicological endpoint to a NOAEL suitable for evaluating risk toindividual threatened & endangered species, or an LD50 or LC50 suitable for evaluating risk topopulations of non-threatened species. Based on EPA 1997.

Oregon Department of Environmental QualityGUIDANCE FOR ECOLOGICAL RISK ASSESSMENT
LEVEL III - BASELINE
Updated November 1998 III - 13
Attachment 1Measures of Effect / Exposure Model (MEEM) - Piscivorous Birds
M e a s u r e o f E x p o s u r eT i s s u e c o n c e n t r a t i o n
a c c u m u l a t e d v i a c o n t a c t w i t h s e d i m e n t p o r e w a t e r s
M e a s u r e o f E x p o s u r eD o s e r e c e i v e d v i a c o n s u m p t i o n
o f f i s h & i n v e r t e b r a t e s
P R I M A R Y S O U R C E( S I S i t e )
M e a s u r e o f E x p o s u r eT i s s u e c o n c e n t r a t i o n
a c c u m u l a t e d v i a c o n t a c t w i t h s u r f a c e w a t e r s
M e a s u r e o f E x p o s u r e D i r e c t m e a s u r e m e n t o f f i s h
t i s s u e c o n c e n t r a t i o n s
S E C O N D A R Y S O U R C E( S u r f a c e S o i l )
T E R T I A R Y S O U R C E( S u r f a c e S e a w a t e r )
P R I M A R Y R E C E P T O R S( F i s h )
S E C O N D A R Y R E C E P T O R S( p i s c i v o r o u s b i r d s )
T E R T I A R Y S O U R C E( G r o u n d w a t e r , s u r f a c e
d i s c h a r g e )
P R I M A R Y R E C E P T O R S( B e n t h i c i n v e r t e b r a t e s )
M e a s u r e o f E f f e c tD o s e e x c e e d i n g p o p u l a t i o n
a c c e p t a b l e r i s k l e v e l f o r p i s c i v o r o u s b i r d s
T E R T I A R Y S O U R C E( S e d i m e n t )

Oregon Department of Environmental QualityGUIDANCE FOR ECOLOGICAL RISK ASSESSMENT
LEVEL III - BASELINE
Updated November 1998 III - 14
Attachment 2Example of Food Web Model
MINK {6}
STARLING {4} FISH {5}
INSECT {2} MOUSE {3} BENTHIC INVERTS
PLANTS {1}
SOIL SEDIMENT WATER
{1}, {2}, ... {6} = receptor number

Oregon Department of Environmental QualityGUIDANCE FOR ECOLOGICAL RISK ASSESSMENT
LEVEL III - BASELINE
Updated March 2000 III - 15
Attachment 3Level III Deliverable - Baseline Risk Assessment Report Outline
(1) INTRODUCTION
(a) Site History and Description(b) Summary of Level I/II Results(c) Assessment Objectives and Scope
(2) PROBLEM FORMULATION
(a) Assessment Endpoints(b) Risk Hypotheses(c) Measures
(i) Exposure(ii) Effect(iii) Characteristics
(d) Analysis Plan Summary (3) EXPOSURE ANALYSIS
(a) Habitats and Receptors Considered(b) CPEC Environmental Concentration(c) Exposure Estimation Model(d) Exposure Point Value (EPV) Estimates
(4) ECOLOGICAL RESPONSE ANALYSIS
(a) Receptor Toxicity Profiles(b) Ecological Benchmark Value (EBV) Estimates
(5) RISK CHARACTERIZATION
(a) Risk Estimation Methodology(b) Risk Description
(6) UNCERTAINTY ANALYSIS
(a) CPEC Selection and Quantification(b) Receptor Selection(c) Exposure Estimation(d) Response Estimation(e) Risk Estimation
(7) CONCLUSIONS (8) ATTACHMENTS
(a) Regional map showing location of site(b) Local map showing site in relation to adjacent property(c) Site map(d) Map of ecological habitats as overlay to site map(e) Map of known or suspected extent of CPECs as overlay to site map
(9) REFERENCES

Oregon Department of Environmental QualityGUIDANCE FOR ECOLOGICAL RISK ASSESSMENT
LEVEL III - BASELINE
Updated November 1998 III - 16
FIGURE 1. Ecological Risk Assessment Process Flowchart
LEVEL Level no Recommend
I I Risk ? No Further
SCOPING Tasks Investigation
yes TMDP 1
Conduct Site
Survey
Activity
no no
LEVEL yes Level yes yes
II Adequate Data ? II Risk ? Action ?
SCREENING Tasks
TMDP 2 TMDP 3 no TMDP 4
Discuss Recommend Proceed to
With No Further Feasibility
DEQ Investigation Study
yes no
LEVEL no Level yes yes
III Probabilistic ? III Risk ? Action ?
BASELINE Tasks
TMDP 5 TMDP 6 no TMDP 7
LEVEL IV Prepare yes Level
FIELD Field Sampling FSAP OK ? IV
BASELINE & Analysis Plan Tasks
no TMDP 8

Oregon Department of Environmental QualityGUIDANCE FOR ECOLOGICAL RISK ASSESSMENT
LEVEL III - BASELINE
Updated November 1998 III - 17
FIGURE 2. Level III (Baseline) Ecological Risk Assessment Process Flowchart
From Complete Prepare yes Discuss
Level II Problem Analysis Probabilistic ? with
SCREENING Formulation Plan no DEQ
TMDP 5
Preliminary Perform Ecological Exposure
Conceptual Site Risk Response Analysis Analysis
Model Characterization (EBV) (EPV)
Submit Assemble
Level III Endpoint Species
Deliverable Response Profiles
From yes yes Proceed to
Level IV Risk ? Action ? Feasibility
FIELD BASELINE no no Study
TMDP 6 TMDP 7
Recommend Go to
No Further Level IV
Investigation FIELD BASELINE

Oregon Department of Environmental QualityGUIDANCE FOR ECOLOGICAL RISK ASSESSMENT
LEVEL III - BASELINE
Updated March 2000 III - 18
APPENDIX A
Procedure for Performing a Population-LevelEcological Risk Assessment

Oregon Department of Environmental QualityGUIDANCE FOR ECOLOGICAL RISK ASSESSMENT
LEVEL III - BASELINE
Updated March 2000 III - 19
INTRODUCTIONIn 1997, Oregon enacted amendments to its state superfund law which emphasize risk-based
remedial action decisions. The amended statute and associated rules require that protection ofecological receptors be extended at the individual level for species listed as threatened andendangered species, but, in a departure from U.S. EPA practice, at the population-level for allother plants and animals. As defined by Oregon Administrative Rules, the acceptable risk levelfor populations of ecological receptors is a 10 percent chance, or less, that 20 percent or more ofthe total local population would receive an exposure greater than the toxicity reference value(EBV) for each hazardous substance. The spatial area within which site-related contaminantsoccur above detection limits is termed the “contaminated area” (CA). The nature and extent ofcontamination, and thus the size of the CA, is determined during the remedial investigation.Depending on the transport and fate characteristics of contaminants and the spatial distribution ofreceptors, the spatial boundaries of the CA may extend beyond the property boundaries of a site.In general, the local population is a group of individual plants, animals, or other organisms of thesame species that live together and interbreed within habitat areas within or near the CA, includingany portion of a population of a transient or migratory species that periodically occupy suchhabitats. The EBV for populations of ecological receptors is a median lethal dose orconcentration (LD50 or LC50) based on studies with routes and durations of exposure that simulateexposure conditions of ecological receptors in the field. This definition of acceptable risk levelassumes that significant reductions in long-term population viability are unlikely if there is a lowprobability (<0.1) that a small fraction (<20%) of the population can be exposed to a dose orconcentration equivalent to the EBV. In addition, however, there must be no other observedsignificant adverse effects on the health or viability of the local population.
This guidance describes a practical procedure for performing a population-level ecologicalrisk assessment using a combination of relatively simple techniques within the regulatory contextdefined by Oregon statute and rules. Key elements of this procedure can be summarized asfollows: (A) Problem Formulation, to include: identification of ecological receptors, identificationof assessment endpoints and associated endpoint species, definition of local populationboundaries, and determination of habitat size and quality, (B) Exposure Analysis or estimatingreceptor exposures (as dose or concentration), (C) Ecological Response Analysis or selectingcontaminant-specific toxicity reference values, and (D) Risk Characterization, to include:estimating the abundance of local populations, estimating the probability of exposure exceedingtoxicity reference values, estimating the number of individuals whose exposure exceeds thesereference values, and evaluating acceptable risk levels.
PROBLEM FORMULATIONIdentify Ecological Receptors

Oregon Department of Environmental QualityGUIDANCE FOR ECOLOGICAL RISK ASSESSMENT
LEVEL III - BASELINE
Updated March 2000 III - 20
Site-specific ecological receptors, and their associated habitats, are generally identified duringecological field investigations performed at the site. To the extent practicable, these receptorsshould be organisms that spend a significant portion of their life or derive a significant portion oftheir diet or physiological needs from that habitat type. Note that defining habitat size andpreferences for many species is usually not this straightforward and may be a source of significantuncertainty in the analysis.
Identify Assessment Endpoints and Endpoint SpeciesAssessment endpoints are an explicit expression of a specific ecological receptor and an
associated function or quality that is to be maintained or protected (USEPA 1996). BecauseOregon statute and rules require the protection of viable populations, assessment endpoints willtypically involve demographic characteristics of populations such as population size, reproductiverates, or mortality rates. It is impractical to evaluate all potentially exposed populations, so asubset of potentially exposed ecological populations or surrogates for these ecological receptorsmust be selected for evaluation. This subset of species are called “endpoint species” and thefactors that may be considered when choosing endpoints species include: aesthetic, social,economic, and ecological value (e.g., keystone species). Also, the availability of high qualityinformation on population dynamics, food habits, ingestion rates, and other species characteristicsthat affect exposure and responses to contaminants may be considered when selecting endpointspecies.
Define Local Population BoundariesEstablishing a species-specific local population boundary sets a limit on the number of
individual members of an endpoint species population that will be considered in the riskassessment. Defining the size and boundaries of a local population can be difficult, especially forhighly mobile and wide-ranging species. Natural resource managers often use political boundariessuch as the size of a park or land management unit to delimit populations. A reasonable firstapproach for defining the boundaries of study populations is to review landscape conditionssurrounding contaminated areas for topographic or anthropogenic features that are likely torepresent important dispersal barriers for assessment endpoint species. If there are no clear andrelevant geographic boundaries, alternative methods for defining populations must be used. Whilerelating in some way to a biological feature of the species, this boundary should not be so large asto include individuals that will have little probability of contacting a site-related contaminant or beso small as to exclude individuals who might reasonably contact such a contaminant; its size willalso necessarily have to vary in response to endpoint species characteristics.
Recognizing that the following approaches have important ecological limitations but practicaladvantages, populations for sessile, mobile, and migratory species may be estimated as follows:

Oregon Department of Environmental QualityGUIDANCE FOR ECOLOGICAL RISK ASSESSMENT
LEVEL III - BASELINE
Updated March 2000 III - 21
(A) For sessile terrestrial species (e.g., plants), the local population comprises allindividuals of the endpoint species within habitat patches within the CA. If there are noclearly defined habitat patches, the population comprises all individuals of the endpointspecies within areas of contaminated soil within the CA. These are potentiallyconservative population boundary estimates because plants and other relatively sessileorganisms have a variety of mechanisms to spread gametes, zygotes, or propagules overlarge distances. As a result, the interbreeding population can often be incorporate anumber of habitat patches.
(B) For aquatic species in lakes or ponds (lentic habitats), the population comprises allindividuals of the endpoint species within the water body receiving site-relatedcontaminants. Again, many aquatic species have mechanisms that permit dispersal fromthe natal pond or lake. For example, the adult stage of most aquatic insects are volantand may fly to neighboring water bodies to breed. As a result, depending on the endpointspecies and the water body, this definition of a population may be conservative.
(C) For aquatic species in moving water such as streams and rivers (lotic habitats), the localpopulation comprises all individuals of the endpoint species within the stream segmentwithin the CA.
(D) For terrestrial vertebrates, especially birds and mammals, the population may be definedusing information about individual space use patterns. Terrestrial vertebrates travelvarying distances on a daily and seasonal basis to find food, water, shelter, and mates.The area encompassed by these travels is termed an individual’s home range (HR). Fora variety of reasons, individuals of many bird and mammal species are philopatric. Theytend to mate and rear young relatively close to the site where they were born or hatched.Studies of dispersal behavior in mammals suggest there is a low probability of an animalmoving more than five HR diameters from its natal range (Waser 1987). In general, mostindividual mammals are likely to contact and mate with opposite-sexed individualswithin five HR diameters of their natal site. For the purposes of defining the boundariesof study populations, it will be assumed that birds and other vertebrates behave in amanner similar to mammals. Then the local population comprises all individuals of theendpoint species within an area extending five HR diameters (DHR) from the outerboundary of the CA. Given the typical HR of an individual endpoint species, the fivehome range diameters (i.e., DHR) and the areal extent (A) of the study population can beapproximated as follows:
πHR
DHR ×= 10 (1)

Oregon Department of Environmental QualityGUIDANCE FOR ECOLOGICAL RISK ASSESSMENT
LEVEL III - BASELINE
Updated March 2000 III - 22
πHR
A×
=100
(2)
Potential sources of HR and population density information include published naturalhistory studies, field guides, and the Wildlife Exposure Factors Handbook (USEPA,1993). If species-specific information on HR is not available, scaling relationships maybe used to estimate HR size based on species body mass (M). Several studies of bothbirds and mammals report that HR size scales as a power function of body mass and thatthe slope of the scaling exponent tends to be approximately 1.0 (Calder 1984; Harestadand Bunnell 1979; Peters 1983; Schoener 1968). Calder (1984) summarizes a variety ofstudies and lists the following relationships between mass (in kilograms) and HR size (inhectares) in mammals and birds: primary consumers (e.g., herbivores), HR = 4.7 M1.02;secondary consumers (e.g., insectivores), HR = 66.8 M1.22; omnivores, HR = 34 M0.92;carnivores, HR = 13.2 M1.36; passerines and nonpasserines, HR = 98.6 M1.15.
(E) For transient and migratory species, the local population spatial boundary is assumed tobe equal to the CA. Actual residency time for these non-resident species within thisboundary is accounted for by means of the endpoint species temporal utilization factor(TUF).
Determine Habitat Size and QualityObservation and mapping of habitats performed during ecological field investigations are used
to estimate: (1) number (q), (2) approximate spatial extent (Hak), and (3) relative quality (Hqk,based on relative expected residency) of each habitat (or habitat patch) within the local populationboundary. It is assumed that habitat patches with greater relative quality will increase theprobability of exposure by attracting and holding an endpoint species more strongly and for alonger duration (i.e., raising its expected residency time) than those with minimal habitat quality.In other words, habitat quality can serve as another temporal utilization factor that affects exposureon a smaller spatial scale than the TUF described previously. If a snap shot census of thepopulation was performed, more individuals would be detected in high quality habitats at anygiven time than in low quality habitats. This result is consistent with the findings of manypopulation-level studies that report higher densities of wildlife in high quality habitats, althoughthe mechanisms responsible for this pattern in nature may be different than the one proposed here(i.e., individual foraging decisions). Quality of habitat, with respect to the needs of a givenendpoint species relative to all other existing species-specific habitat within the local populationboundary, should be rated as unsuitable (0), poor (0.25), average (0.5), good (0.75), or excellent(1.0). Justification for the quality determination should be made the basis of professionaljudgment, requirements of each endpoint species, and results of site visits/surveys.

Oregon Department of Environmental QualityGUIDANCE FOR ECOLOGICAL RISK ASSESSMENT
LEVEL III - BASELINE
Updated March 2000 III - 23
EXPOSURE ANALYSISExposure point value is, for terrestrial species, the contaminant dose (D) received by the
receptor (applied dose) or, for aquatic species, the contaminant concentration (EC) in the media inwhich the receptor is immersed (surface water or sediment). The following tasks seek to estimateeither D or EC, taking into consideration a number of factors including, but not limited to, thespatial distribution of contaminant concentrations relative to the spatial distribution of receptors.
Estimate ExposureTypically, some type of exposure model, perhaps supplemented with tissue residue analyses, is
used to estimate exposure. To the extent practicable, such a model must explicitly consider spatialrelationships between endpoint species, their habitat, and the distribution of contaminants, as wellas habitat quality and temporal utilization of habitat. Simple non-spatial exposure modelsgenerally assume an even distribution of contaminants over the site and random access byreceptors to all portions of the site. However, because many sites are industrial or highlymodified in nature, it is unlikely that all areas within their bounds will provide habitat suitable forendpoint species. For example, contaminant concentrations might be greatest near the center of asite, but the habitat quality might be highest near the edges. Thus, if contaminant levels are relatedto habitat quality, the assumptions of a simple model would not hold. A more reasonable modelwould account for the proportional contribution of each area with a distinct combination ofcontaminant level and habitat quality, as follows (modified from Sample and others 1997):
( )∑∑ ∑= ==
×
×
×=
q
k
d
iq
k kk
kkijkij TUF
HqHa
HqHaBW
CIRD
1 11
(3)
where: Dj = Dose for a given endpoint species for jth contaminant (mg/[kg⋅d]); q = Total number ofkth habitat patches within local population boundary (unitless); d = Total number of ith media (e.g.,food, water, soil); IRi = Intake rate for ith medium (kg/d or L/d); Cijk = Concentration of jth
contaminant in ith medium in kth habitat patch (mg/kg or mg/L); BW = Body weight of endpointspecies (kg); Hqk = Relative habitat quality (based on expected residency) of kth habitat patch for agiven endpoint species (unitless); Hak = Area of kth habitat patch (m2); TUF = Endpoint speciestemporal utilization factor (unitless).
Equation (3) assumes that individuals within the local population boundary use habitat inproportion to habitat area and quality. Here exposure is the applied dose (mg/[kg⋅d]) experiencedby an individual of the endpoint species. For terrestrial species, Equation (3) can be modified toexplicitly include an exposure route-specific estimate of contaminant absorption (gastrointestinalabsorption, dermal absorption, etc.), so that exposure would then be expressed in terms ofabsorbed dose. If multiple food items are considered, Equation (3) may include a term

Oregon Department of Environmental QualityGUIDANCE FOR ECOLOGICAL RISK ASSESSMENT
LEVEL III - BASELINE
Updated March 2000 III - 24
representing each item’s contribution to IRi, e.g., incidentally ingested soil may be only a smallfraction (< 2%) of total food intake. For terrestrial species, Equation (3) considers dosesreceived via ingestion exposure routes, e.g., consumption of contaminated prey, forage, or waterand incidental ingestion of soil or sediment. It can be modified to quantify other exposure routessuch as inhalation or dermal contact.
Field sampling and chemical analysis provide raw data concerning the presence andconcentrations of CPECs in abiotic (soil, surface water, sediment) and biotic (plant and animaltissues) media at or in the locality of the facility. Chemical analysis of biotic samples can be usedto measure Cijk in the tissues of consumed prey and forage items, as well as to estimate site-specific intermedia transfer factors. In the absence of measured Cijk values, they can be estimatedusing an abiotic media Cijk value in conjunction with an appropriate intermedia transfer factorobtained from the literature. The risk assessor should ensure that sampling covers areas and mediaof ecological interest and that analytical detection levels are set low enough to be of ecologicalsignificance.
Because ecological receptors do not experience their environment on a “point” basis, it isnecessary to convert measured data from single sample points into an estimate of concentrationover some relevant spatial area, such as their habitat. For abiotic media (soil, water, sediment),the simplest approach is to assume that contaminants are evenly distributed within a habitat patchand that ecological receptors forage randomly with respect to contamination within that habitatpatch. With these assumptions, and to allow for uncertainty, the abiotic media concentration (Cijk)is represented by a distribution. Alternative methods, such as Bootstrap analysis, Voronoidiagrams or other methods involving explicit consideration of the potentially heterogeneous spatialdistribution of contamination relative to receptor foraging patterns, may also be employed toprovide an even more representative estimate of Cijk for abiotic media (Burmaster and Thompson1997; Freshman and Menzie 1996).
Some endpoint species have migration, hibernation, or other behavior patterns that result inless exposure throughout the year at a site. A temporal factor (TUF) quantifies the frequency ofexposure to contaminated media as a function of such behavior patterns. For relatively long-livedspecies, this factor can be defined as the fraction of the number of days per year an endpointspecies is active within a habitat, so that 1 ≥ TUF > 0. Non-hibernating, non-migratory specieswill have a unitless default temporal utilization factor of 1. For those species that use the habitatisland only as a stop-over point duration their annual migration it will be necessary to estimate aTUF value < 1. This type of TUF is most appropriate when evaluating risks associated withchronic exposure to relatively low doses of contaminants.

Oregon Department of Environmental QualityGUIDANCE FOR ECOLOGICAL RISK ASSESSMENT
LEVEL III - BASELINE
Updated March 2000 III - 25
For aquatic species, the IRi and BW terms are dropped and exposure concentration (EPV =mg/L), rather than dose, is estimated, as follows (modified from Sample and others 1997):
TUFHqHa
HqHaCEC
q
k
d
iq
k kk
kkijkj ×
×= ∑∑ ∑= =
=1 1
1
(4)
where: ECj = Exposure concentration for a given endpoint species for jth contaminant (mg/L); q =Total number of kth habitat patches within local population boundary (unitless); d = Total numberof ith media (e.g., food, water, soil, sediment); IRi = Intake rate for ith medium (kg/d or L/d); Cijk =Concentration of jth contaminant in ith medium in kth habitat patch (mg/kg or mg/L); Hqk = Relativehabitat quality (based on expected residency) of kth habitat patch for a given endpoint species(unitless); Hak = Area of kth habitat patch (m2); TUF = Endpoint species temporal utilization factor(unitless).
It is also possible to use a geographic information system (GIS) to overlay the spatialdistribution of various habitat types with contaminant distributions to more accurately determinethe degree to which habitat is contaminated. If information is available regarding the distributionor movements of plants and/or animals, these data may be combined with the habitat andcontamination data to provide a more accurate visualization of exposure and potential risks(Clifford and others 1995).
ECOLOGICAL RESPONSE ANALYSISDetermine Toxicity Reference Value
By rule, the primary ecological benchmark value (EBV) for populations of ecologicalreceptors is the median lethal dose or concentration (LD50 or LC50). The EBV must be based, tothe extent practicable, on studies whose routes of exposure and duration of exposure werecommensurate with the expected routes and duration of exposure for ecological receptorsconsidered in the risk assessment, or appropriate surrogates for those receptors; it may beexpressed as either a point value or as a distribution. If a LD50 or LC50, as applicable, is notavailable for ecological receptors considered in the risk assessment, the EBV may be derivedfrom other toxicological endpoints for those receptors or appropriate surrogates for thosereceptors, adjusted with uncertainty factors to equate to a LD50 or LC50. For example, most fishand wildlife toxicity studies reporting an LD50 or LC50 are conducted using acute or subchronicexposure durations, and as a result, extrapolation factors will be needed to estimate the medianlethal dose or concentrations associated with chronic exposures.
RISK CHARACTERIZATIONBy rule, the acceptable risk level (ARL) for populations of ecological receptors is a 10

Oregon Department of Environmental QualityGUIDANCE FOR ECOLOGICAL RISK ASSESSMENT
LEVEL III - BASELINE
Updated March 2000 III - 26
percent chance, or less, that 20 percent or more of the total local population would have anexposure greater than the EBV for each contaminant of concern. Once an exposure distribution anda contaminant-specific EBV, either as a point value or a distribution, have been established foreach endpoint species, computation of the ARL numerical criterion involves: (A) estimating thelocal population abundance of the endpoint species, (B) estimating the probability that anindividual of an endpoint species will experience an exposure in excess of the EBV or p(exposure> EBV), (C) using a cumulative binomial distribution function to estimate the number ofindividuals likely to experience p(exposure > EBV) ≥ 10%, and (D) determining whether thisnumber is > 20% of the total local population.
Estimate Local Population AbundanceBecause definition of acceptable risk for a population is based on effects to a certain
percentage of individuals, it is necessary to estimate the number of n individuals of each endpointspecies within the local population boundary. For terrestrial (e.g., plants) and aquatic (e.g.,benthic invertebrates) sessile and terrestrial and avian non-sessile species, the size (i.e.,abundance) of the local population includes all individuals within the local population boundary,as previously defined. For seasonal migrants, local population abundance is defined as thenumber of individuals utilizing habitat within the CA over the course of a year. Methods forestimating population abundance include, but are not limited to: (A) observations, surveys, orsampling (e.g., transects, trapping, etc.) onsite and in the locality of the site; (B) game, fish, orother wildlife management records; (C) if appropriate, population density estimates compiled bythe USEPA (1993), or (D) if there are no appropriate species-specific population densityestimates available, scaling relationships may be used to estimate population abundance based onan animals body mass.
Numerous studies have reported that the local abundance of birds and mammals tends todecrease as average species body mass increases (Damuth 1991, 1993; Peters and Raelson 1984;Brown 1995). When plotted logarithmically, the slope of the relationship between abundance andbody size is consistently about -0.75. There is considerable variability, especially for smallerbirds and mammals, and factors such as phylogeny and diet may have significant effects on thisrelationship. The following equation, which is based on a regression of population density(#/km2) on body mass (g) for 564 mammal populations (Damuth 1993), can be used to estimateabundance for non-volant mammals: log (density) = 3.98 - 0.77 × [log (body mass)]. Similarly,the following equation can be used to estimate abundance of bird populations (Juanes 1986): log(density) = 1.96 - 0.49⋅× [log (body mass)].
Probability of Exposure Exceeding the EBVIn general, risk is the probability associated with the occurrence of an unfavorable

Oregon Department of Environmental QualityGUIDANCE FOR ECOLOGICAL RISK ASSESSMENT
LEVEL III - BASELINE
Updated March 2000 III - 27
consequence. For our purposes the “unfavorable consequence” is a decrease in the size orviability of a local population. An ecological response occurs when toxicological responses inindividuals of an endpoint species, as a consequence of long-term (chronic) exposure to ahazardous substance, result in the actual or projected loss of a minimum viable local population ofthat species (Newton 1988). Here, aspects of individual health, viability, and performance areimportant only insofar as they might influence the sustainability of the local population.
Acceptable risk occurs when, for 20 percent of the individuals in a defined local population ofsize n, there is a ≤ 10 percent probability (p) that they will experience an exposure ≥ EBV; thisprobability (p) is assumed to apply equally to all individuals in the population (n) (it may benecessary to segment the population into relatively homogeneous subpopulations [adult vs.juvenile, breeding vs. non-breeding] in order to better meet this assumption). The probability (p)of any individual receptor experiencing an RAO ≥ TRV while moving at random over a site offinite dimension is determined by assuming that an exposed individual moves randomly across anexposure area, thus allowing the area-averaged media concentration to be used to estimate the trueaverage concentration contacted over time. Estimation of p(exposure > EBV) may beaccomplished through the use of a normal density function (Suter and others 1986). If EBV is apoint value and exposure is defined by the mean and standard deviation of its natural logarithms,then the probability of exposure > EBV may be determined as follows:
( )
−=EXP
EXPZ s
EBVxp lnφ (5)
where: p = Probability of exposure > EBV (unitless); φZ = Cumulative distribution function of astandard normal random variable (NORMSDIST function in MS-Excel®); xEXP = Mean of naturallogarithms of exposure (mg/[kg⋅d] or mg/L); sEXP = Standard deviation of natural logarithms ofexposure (unitless); EBV = Point value of EBV (mg/[kg⋅d] or mg/L).
If both exposure and EBV are defined by the mean and variance of their natural logarithms,then the probability of exposure > EBV may be determined as follows (Suter and others 1986):
+
−=22EBVEXP
EBVEXPZ
ss
xxp φ (6)
where: p = Probability of exposure > EBV (unitless); φZ = Cumulative distribution function of astandard normal random variable (MS-Excel® NORMSDIST function); xEXP = Mean of naturallogarithms of exposure (mg/[kg⋅d] or mg/L); xEBV = Mean of natural logarithms of EBV (mg/[kg⋅d]or mg/L); s2
EXP = Variance of natural logarithms of exposure (unitless); s2EBV = Variance of natural

Oregon Department of Environmental QualityGUIDANCE FOR ECOLOGICAL RISK ASSESSMENT
LEVEL III - BASELINE
Updated March 2000 III - 28
logarithms of EBV (unitless).Estimate Acceptability of Risk
Taking p from Equations (5) or (6), the probability (b) of 20 percent of the individuals (y) in apopulation (n) experiencing an RAO ≥ TRV is then determined using a binomial probabilityfunction (E. Crouch, personal communication; Sample and others 1997):
( ) ( ) yny ppyn
pnyb −−
= 1,, (7)
where: y is 20 percent of the population (y = 0.2n); n is the size of the local population; p is theprobability of exposure ≥ EBV as determined using Equations (5) or (6). For a given n, a value ofp is selected for Equation (7) so that b = 0.9 (i.e., there is only a 10 percent chance that 0.2nindividuals will experience an exposure ≥ EBV. The rationale is that each of the n individuals inthe population is considered an independent exposure trial, that the probability of an individual’s“success” (i.e., experiencing exposure ≥ EBV) during movement through the contaminated area (orvolume in the case of aquatic exposures) is set by p, and that the number of “successes”(individuals encountering excessive exposure) must be ≤ 20 percent of n. In all cases, site-specific field and/or laboratory investigations may be necessary to verify or refute a finding ofunacceptable risk.
REFERENCESBrown, J.H. 1995. Macroecology. University of Chicago Press, Chicago, 269 pp.Burmaster, D.E. and K.M. Thompson. 1997. Estimating exposure point concentrations for surface
soils for use in deterministic and probabilistic risk assessments. Human and Ecological RiskAssessment 3: 363-384.
Calder III, W.H. 1984. Size, Function, and Life History. Harvard University Press, Cambridge,Massachusetts.
Clifford, P.A., Barchers, D.E., Ludwig, D.F., Sielken, R.L., Klingensmith, J.S., Graham, R.V. andM.I. Banton. 1995. An approach to quantifying spatial components of exposure for ecologicalrisk assessment. Environmental Toxicology and Chemistry 14: 895-906.
Damuth, J. 1993. Cope’s Rule, the island rule and the scaling of mammalian population density.Nature 365: 748-750.
Damuth, J. 1991. Of size and abundance. Nature 351: 268-269.Freshman, J.S. and C.A. Menzie. 1996. Two wildlife exposure models to assess impacts at the
individual and population levels and the efficacy of remedial actions. Human and EcologicalRisk Assessment 2: 481-498.
Harestad, A.S. and F.L. Bunnell. 1979. Home range and body weight - a reevaluation. Ecology 60:389-402.

Oregon Department of Environmental QualityGUIDANCE FOR ECOLOGICAL RISK ASSESSMENT
LEVEL III - BASELINE
Updated March 2000 III - 29
Juanes, F. 1986. Population density and body size in birds. American Naturalist 128: 921-929.Newton, I. 1988. Determination of critical pollutant levels in wild populations, with examples for
organochlorine insecticides in birds of prey. Environmental Pollution 55: 29-40.Peters, R.H., and J.V. Raelson. 1984. Relations between individual size and mammalian
population density. American Naturalist 124: 498-517.Peters, R.H. 1983. The Ecological Implications of Body Size. Cambridge University Press,
Cambridge.Sample, B.E., Aplin, M.S., Efroymson, R.A., Suter II, G.W., and C.J.E. Welsh. 1997. Methods and
tools for estimation of exposure of terrestrial wildlife to contaminants. Oak Ridge NationalLaboratory, Oak Ridge, Tennessee. ORNL/TM-13391.
Schoener, T.W. 1968. Sizes of feeding territories among birds. Ecology 49: 123-140.Suter II, G.W., Rosen, A.E. and E. Linder. 1986. Analysis of extrapolation error. Page 55 in L.W.
Barnthouse and G.W. Suter II (eds.) User’s Manual for Ecological Risk Assessments.Environmental Sciences Division, Oak Ridge National Laboratory, Oak Ridge, Tennessee.ESD No. 2679, ORNL-6251.
USEPA (U.S. Environmental Protection Agency). 1993. Wildlife Exposure Factors Handbook,Volume I. Office of Research and Development, Washington, DC 20460. EPA/600/R-93/187a.December 1993.
Waser, P.M. 1987. A model predicting dispersal distance distributions. Pages 251-256 in B.D.Chepko-Sade and Z.T. Halpin (eds.) Mammalian Dispersal Patterns. University of ChicagoPress, Chicago.

Oregon Department of Environmental QualityGUIDANCE FOR ECOLOGICAL RISK ASSESSMENT
LEVEL IV - FIELD BASELINE
Updated November 1998 IV - 1
INTRODUCTIONThe DEQ ecological risk assessment process consists of four distinct levels, as follows (and asshown in Figure 1):
• Level I Scoping• Level II Screening• Level III Baseline• Level IV Field Baseline
Within and between these levels are a number of Technical/Management Decision Points (TMDP).Based on the information developed and presented within a given level, these TMDPs determineone of three recommendations:
• No further ecological investigations at the site, or• Continuation of the risk assessment process at the next level, or• Undertake (beyond Level I only) a removal or remedial action.
The outcome of each level of the assessment should be documented in writing. Thoroughdocumentation will provide a future reference for any other site-related activities involving ahazardous substance release, future site remedial actions, or onsite monitoring.
Prior to undertaking any ecological risk assessment pursuant to OAR 340-122-084, risk assessorsshould have read and be familiar with the terms, concepts, and approaches discussed in thefollowing documents:
• USEPA Proposed Guidelines for Ecological Risk Assessment (61 FR 47552, 9/9/96)• USEPA Region X Supplemental Ecological Risk Assessment Guidance for Superfund
(EPA 910-R-97-005, June 1997)• ORS 465.315• OAR 340-122-010 through -115• State of Oregon Level I, II, III, and IV Ecological Risk Assessment Guidance
OBJECTIVEA Level IV assessment attempts to reduce uncertainties in the Level III “desk top” risk estimatesthrough analysis of site-specific empirical data obtained from site- and locality-specificecological field surveys, tissue analysis, and/or toxicity tests (performed either in the laboratory orin situ). A Level IV field baseline assessment, unlike a Level III assessment, is intended to: (a)refine measures to focus on specific issues identified during the Level III assessment, (b) useactual, empirical data on exposure and potential effects to replace estimated and literature-derived

Oregon Department of Environmental QualityGUIDANCE FOR ECOLOGICAL RISK ASSESSMENT
LEVEL IV - FIELD BASELINE
Updated November 1998 IV - 2
data; and (c) develop additional, specific lines of evidence to support a more robust weight-of-evidence-based conclusion regarding the potential risks identified during the Level III assessment.
PREREQUISITESMoving to Level IV requires successful completion of a Level III baseline assessment with adecision on the part of risk managers to gather additional site-specific information for the purposeof reducing uncertainties in the Level III risk estimates.
TASKS (see Figure 2)(1) Refine problem formulation Following the risk assessment process described in Level III
guidance, there should now a limited number of contaminants of ecological concern(CECs) under consideration. Once again, the relationship between specific CEC, theirtoxicological characteristics, their likely pathway to specific ecological receptors, and theeffect(s) they may induce in these receptors should be reexamined. This reexaminationshould substantially lessen the chance of engaging in field and/or laboratory investigationsthat do not provide information useful to risk managers.(a) Select CECs Level III will have identified some contaminants as contaminants of
ecological concern (CECs), on the basis of risk characterization or data gapsregarding their transport and fate behavior, toxicity, or potential for cumulativeeffects. Level IV may wish to consider all of these CECs or just a representativesubset considered (on the basis of the Level III analysis) to be key risk drivers.New CEC may be added if additional chemical analysis data become availablebetween the conclusion of Level III and the start of the Level IV planning activity.
(b) Review/Revise Established Measures For Level IV, measures are expected to benumerical expressions of observations (e.g., toxicity test results, communitydiversity measures, tissue analyses, etc.) that may be compared to referencelocations or other controls to detect adverse responses in endpoint species resultingfrom exposure to a site-related CECs. When defining measures for field andlaboratory investigations, select those with as strong an association as possiblebetween site-related CECs and responses in the selected measures and those thatrepresent the same exposure pathway and toxic mechanism of action as theassessment endpoint with which they are associated. Development of empiricalexposure-response relationships is important for evaluating remedial options, soselection of measures that incorporate a CEC concentration gradient should be agoal wherever possible.
(2) Select assessment tools There are a limited number of demonstrated assessment tools
currently available for conducting site-specific field investigations on ecological exposureand effects, as listed below. Which tool(s) to select for the assessment is highly dependent

Oregon Department of Environmental QualityGUIDANCE FOR ECOLOGICAL RISK ASSESSMENT
LEVEL IV - FIELD BASELINE
Updated November 1998 IV - 3
on site-specific factors and will depend entirely on the risk hypotheses and measureschosen for the assessment.(a) Tissue Analysis/Bioaccumulation Studies The tools listed below are particularly
useful for measuring and quantifying exposure:(i) Chemical analysis of tissues (specific organs, muscle, whole body).(ii) Laboratory bioaccumulation studies (uptake measured in laboratory setting
using contaminated media from site).(iii) Field bioaccumulation studies (receptor, animal or surrogate, placed onsite
in proximity to contaminated media).(iv) Food web bioaccumulation models.(v) Gross morphology and/or histopathology.(vi) Biomarkers.(vii) Results obtained with one or more of the above methods may be used to
support the following analyses:§ Evaluating the degree to which CPECs are transferred through a food
chain.§ Measuring CPEC concentrations in foods consumed by endpoint species
associated with an assessment endpoint.§ Providing site-specific estimates of exposure to higher-trophic-level
organisms. Techniques for exposure characterization could include, butare not limited to, any or all of the following:
§ Relating tissue residue levels to concentrations in environmental media;§ Providing site-specific and CPEC-specific estimates of
bioconcentration and/or bioaccumulation factors.(b) Population/Community Evaluations The following methods are particularly useful
for measuring and quantifying ecological responses to contaminants:(i) Community metrics (measurements of species composition, abundance,
community structure, trophic dynamics, seasonal patterns, age classes, etc.)- study site vs. reference area or changes along a CPEC concentrationgradient.
(ii) Population metrics (measurements of density patterns, rates of recruitment,growth, and survival, etc.) - study site vs. reference area or changes along aCPEC concentration gradient.
(iii) Physiological and behavioral measurements - respiration, photosynthesisreproduction, burrowing, predation, courtship, etc.
(iv) Field experiments.(c) Toxicity Tests (Bioassays) These are particularly useful for measuring and
quantifying both exposure and ecological responses to contaminants. They are

Oregon Department of Environmental QualityGUIDANCE FOR ECOLOGICAL RISK ASSESSMENT
LEVEL IV - FIELD BASELINE
Updated November 1998 IV - 4
appropriate measures for both lethal and/or sublethal responses and may be usedto:(i) Demonstrate whether contaminants are bioavailable.(ii) Evaluate the aggregate toxic effects of all contaminants in a medium.(iii) Evaluate the toxicity of substances whose biological effects may not have
been well characterized.(iv) Compare toxicity data generated at the site with that obtained in the
laboratory.(v) Characterize the nature of a toxic effect.(vi) Characterize the distribution of toxicity at a site.(vii) Develop remedial goals.(viii) Support a monitoring program.(ix) Determine a site’s post-remediation potential to support a viable ecological
community.(x) There are numerous U.S. EPA methods manuals and American Society for
Testing and Materials (ASTM) guides and procedures for conductingtoxicity tests.
(3) Prepare field sampling and analysis plan The ecological sampling plan (FSAP)
describes details of the site-specific field and/or laboratory investigation(s). It addressesonly the field and/or laboratory collection of ecological data, but must be consistent with,and achievable within, the scope of the analysis plan prepared for Level III, as well as theoverall remedial investigation work plan. Because field and/or laboratory investigationscan be expensive and time-consuming, it is important to carefully consider the types ofstudies that will provide the most expeditious and defensible (i.e., supported by thescientific literature and peer-review) tests of the stated risk hypotheses. The plan mayinclude, but is not limited to:(a) A description of the study design, including its uncertainties and key assumptions.
The design is guided by the conceptual site model, with appropriate modificationsin response to any new data.
(b) A statement of data needs in terms of those needed to test the risk hypotheses (Isthere or is there not a risk?) and, if risk is demonstrated, to inform the selection andimplementation of a remedy. Basically, the discussion should focus on how eachpiece of data planned for collection will be used to answer the question of whetheror not risk exists.
(c) A detailed description of the assessment tools (see Task (2) above) that will yielddata of the type and quality required. If statistical analyses are desired, the studymethodology and protocols should ensure that quantitative data will be collected.

Oregon Department of Environmental QualityGUIDANCE FOR ECOLOGICAL RISK ASSESSMENT
LEVEL IV - FIELD BASELINE
Updated November 1998 IV - 5
(d) A statement of data quality objectives (DQOs) for all key components of the fieldand/or laboratory investigations, considering that DQOs should be used inconjunction with, and not as a substitute for, a scientifically defensibleexperimental design.
(4) TMDP 8: Field Sampling Plan Approved? Prior to initiating field and/or laboratory
investigations, approval of the draft FSP must be obtained from the DEQ project manager.If some time has elapsed since site visits/surveys were conducted, an additional site visitmay be required to verify that the study design specified in the FSAP is stillimplementable, i.e., whether sampling and testing specified by the FSAP can actually becollected at the site. It may be necessary to modify the FSAP in response to changes in siteconditions before approval to proceed with field or laboratory investigations.
(5) Conduct field/laboratory work The site investigation involves implementation of the
agreed upon FSAP and includes all of the field sampling and surveys that are conducted aspart of the ecological risk assessment.
(6) Measure/calculate exposure point values Quantitative measurements of exposure are
needed to evaluate the relative contributions from various contaminant sources or pathwayswhen considering clean-up levels or remediation strategies. Endpoint species exposureprofiles are determined preferably from tissue residue analyses and/or toxicity test results,although sophisticated food web models are a possibility.
(7) Measure/calculate ecological benchmark values This task describes and quantifies the
responses of endpoint species when exposed to differing concentrations of site-relatedCPEC. A quantitative exposure-response profile for each endpoint species should beprepared based on the results of: (a) literature analysis, (b) toxicity testing, and/or (c)population/community evaluation methods. Note that this task will be simplified if effectsdata were collected along a CEC gradient.
(8) Perform risk characterization Risk characterization is designed to evaluate the
likelihood of an adverse effect in an endpoint species (associated with an assessmentendpoint) from exposure to a site-related CEC. This task typically contains two activities:estimation and description.(a) Risk estimation This involves integrating exposure and exposure-response profiles
to estimate a probability for adverse effects occurring in specific receptors as aresult of exposure to a certain CEC.
(b) Risk description This combines any quantified risk estimate (obtained using eitherdeterministic or probabilistic methods) with a "weight-of-evidence" approach to

Oregon Department of Environmental QualityGUIDANCE FOR ECOLOGICAL RISK ASSESSMENT
LEVEL IV - FIELD BASELINE
Updated November 1998 IV - 6
present a broader picture of the degree of risk associated with each assessmentendpoint.
(c) Lines of evidence that may be available in Level IV to construct a weight-of-evidence risk characterization include, but are not limited to:(i) Detection of contaminant concentrations in soil, sediment, surface and
ground water.(ii) Presence of environmental transport mechanisms.(iii) Geochemical factors that influence CEC bioavailability.(iv) Observations of adverse effects in potentially exposed habitats compared to
reference sites, including mortality and morbidity, vegetation stress, habitatdegradation, presence or absence of key species.
(v) Presence of endangered species or sensitive habitat.(vi) CEC concentrations in water, soil, sediment, and tissue exceed doses
observed to cause chronic or acute toxicity in other areas, species, ormedia.
(vii) Detection of acute or chronic toxicity in waters, soil, or sediment.(viii) Tissue and/or bioaccumulation analyses provide strong evidence of CEC
availability in animals and plants.(ix) Biomarkers which suggest that a receptor has been exposed to CEC.(x) Observed changes in rates of physiological and behavioral processes (e.g.,
respiration, photosynthesis; burrowing, or predation) provide additionalinsight into exposure and effect.
(xi) Observations from ecological field studies of communities or population.
(9) Perform uncertainty analysis Uncertainty analysis involves summarizing assumptionsmade by the Level IV assessment, evaluating their validity and sensitivity, evaluating thestrengths and weaknesses of the analyses (laboratory and field), and quantifying, to theextent possible, the uncertainties associated with each identified risk. This analysisaddresses uncertainty associated with each component of the Level IV assessment. Givenprior consultation with the Department (see Level III, TMDP 5), Monte Carlo or otherprobabilistic methods may be applied to exposure, toxicity extrapolation, or ecologicalmodels to quantify uncertainty.
(10) Prepare Level IV deliverable This deliverable is a document (see Attachment 1, Field
Baseline Risk Assessment Report, for suggested format and contents) which will describe,in detail, all of the items listed in OAR 340-122-084(3)(a - g), as well as how theexposure and effects analyses were performed, any assumptions employed in theseanalyses, the results of the risk characterization, and a thorough discussion of uncertaintiesinherent in the risk analyses. The results presented in this report provide the factual basis

Oregon Department of Environmental QualityGUIDANCE FOR ECOLOGICAL RISK ASSESSMENT
LEVEL IV - FIELD BASELINE
Updated November 1998 IV - 7
for re-evaluating TMDP 6.ADDITIONAL INFORMATIONBarnthouse, L.W. and G.W. Suter II. 1986. User's Manual for Ecological Risk Assessment. ORNL-
6251. Oak Ridge National Laboratory, Oak Ridge, Tennessee.Bartell, S.M., Gardner, R.H., and R.V. O’Neill, 1992. Ecological Risk Estimation. Lewis
Publishers, Boca Raton, Florida.Calabrese, E.J. and L. A. Baldwin. 1993. Performing Ecological Risk Assessments. Lewis
Publishers, Boca Raton, Florida. 257 pp.Cardwell, R.D, Parkhurst, B.R., Warren-Hicks, W., and J.S. Volison. 1993. Aquatic ecological
risk. Water Environment & Technology 5(4): 47-51.Chapman, P.M. 1990. The sediment quality triad approach to determining pollution-induced
degradation. Science of the Total Environment 97(8): 815-825.EPA. 1987. Data Quality Objectives for Remedial Response Activities. EPA 540/G-87/003.
Office of Emergency and Remedial Response, U.S. Environmental Protection Agency,Washington, DC.
EPA. 1989. Risk Assessment Guidance for Superfund, Volume II, Environmental EvaluationManual (Interim Final). EPA/540/1-89/001. Office of Emergency and Remedial Response,U.S. Environmental Protection Agency, Washington, DC.
EPA. 1989. Ecological Assessment of Hazardous Waste Sites: A Field and LaboratoryReference. EPA/600/3-89/013. Environmental Research Laboratory, U.S. EnvironmentalProtection Agency, Corvallis, Oregon.
EPA. 1989. Rapid Bioassessment Protocols for Use in Streams and Rivers - BenthicMacroinvertebrates and Fish. EPA/440/4-89/001. Office of Water, U.S. EnvironmentalProtection Agency, Washington, DC.
EPA. 1990. Guidance for Data Usability in Risk Assessment. EPA 540/G-90/008. U.S.Environmental Protection Agency, Washington, DC.
EPA. 1992. Developing a Work Scope for Ecological Assessments. Publication 9345.0-05I, EcoUpdate Intermittent Bulletin 1(4). Office of Solid Waste and Emergency Response, U.S.Environmental Protection Agency, Washington, DC.
EPA. 1992. Evaluation of Terrestrial Indicators for Use in Ecological Assessment atHazardous Waste Sites. EPA/600/R-92/183. Office of Research and Development, U.S.Environmental Protection Agency, Washington, DC.
EPA. 1993. Wildlife Exposure Factors Handbook, Volume I of II. EPA/600/R-93/187a. Officeof Research and Development, U.S. Environmental Protection Agency, Washington, DC.
EPA. 1993. Wildlife Exposure Factors Handbook, Volume II of II. EPA/600/R-93/187b. Officeof Research and Development, U.S. Environmental Protection Agency, Washington, DC.
EPA. 1994. Field Studies for Ecological Risk Assessment. Publication 9345.0-05I, EPA 540-F-94-014, PB94-963305, ECO Update Intermittent Bulletin 2(3). Office of Solid Waste andEmergency Response, U.S. Environmental Protection Agency, Washington, D.C.

Oregon Department of Environmental QualityGUIDANCE FOR ECOLOGICAL RISK ASSESSMENT
LEVEL IV - FIELD BASELINE
Updated November 1998 IV - 8
EPA. 1994. Selecting and Using Reference Information in Superfund Ecological RiskAssessments. Publication 9345.0-10I, EPA 540-F-94-050, PB94-963319, ECO UpdateIntermittent Bulletin 2(4). Office of Solid Waste and Emergency Response, U.S. EnvironmentalProtection Agency, Washington, DC.
EPA. 1994. Using Toxicity Tests in Ecological Risk Assessment. Publication 9345.0-05I, EPA540-F-94-012, PB94-963303, ECO Update Intermittent Bulletin 2(1). Office of Solid Wasteand Emergency Response, U.S. Environmental Protection Agency, Washington, DC.
EPA. 1994. Catalogue of Standard Toxicity Tests for Ecological Risk Assessment. Publication9345.0-05I, EPA 540-F-94-013, PB94-963304, ECO Update Intermittent Bulletin 2(2). Officeof Solid Waste and Emergency Response, U.S. Environmental Protection Agency, Washington,DC.
Gilbert, R.O. 1987. Statistical Methods for Environmental Pollution Monitoring. Van NostrandReinhold Co., New York 330 pp.
Green, R.H. 1979 Sampling Design and Statistical Methods for Environmental Biologists. J.Wiley & Sons, New York 257 pp.
Maughan, J.T. 1993. Ecological Assessment of Hazardous Waste Sites. Van Nostrand Reinhold,New York. 352 pp.
Menzie, C, Henning MH, Cura J, Finkelstein K, Gentile J, Maughan J, Mitchell D, Petron S,Potocki B, Svirsky S & Tyler P. 1996. Special report of the Massachusetts weight-of-evidence workgroup: A weight-of-evidence approach for evaluating ecological risks. Humanand Ecological Risk Assessment 2, 277-304.
Menzie, C.A., Burmaster, D.E., Freshman, J.S., and C.A. Callahan. 1992. Assessment of methodsfor estimating ecological risk in the terrestrial component: A case study at the Baird &McGuire Superfund Site in Holbrook, Massachusetts. Environmental Toxicology andChemistry 11: 245-260.
Parkhurst, B.R., Warren-Hicks, W., Cardwell, R.D., and J. Volison. 1994. Draft Final Report,Methodology for Aquatic Ecological Risk Assessment. Contract No. RP91-AER-1, WaterEnvironment Research Foundation, Alexandria, Virginia.
Rose, K.A. and E.P. Smith. 1992. Experimental design: The neglected aspect of environmentalmonitoring. Environmental Management 16(6): 691-700.
Suter II, G.W. 1993. Ecological Risk Assessment. Lewis Publishers, Boca Raton, Florida. 538pp.
Underwood, A.J. 1991. Beyond BACI: Experimental designs for detecting human environmentalimpacts on temporal variations in natural populations. Australian Journal of Marine andFreshwater Research. 42: 569-587.
Underwood, A.J. 1992. Beyond BACI: The detection of environmental impacts on populations inthe real, but variable, world. Journal of Experimental Marine Biology and Ecology. 161:145-178.

Oregon Department of Environmental QualityGUIDANCE FOR ECOLOGICAL RISK ASSESSMENT
LEVEL IV - FIELD BASELINE
Updated November 1998 IV - 9
Warwick, R.M. 1986. A new method for detecting pollution effects on marine macrobenthiccommunities. Marine Biology 92: 557-562.

Oregon Department of Environmental QualityGUIDANCE FOR ECOLOGICAL RISK ASSESSMENT
LEVEL IV - FIELD BASELINE
Updated November 1998 IV - 10
Attachment 1Level IV Deliverable - Field Baseline Risk Assessment Report Outline
(1) INTRODUCTION
(a) Site History and Description(b) Summary of Level III Results
(2) STUDY DESIGN & METHODOLOGY
(a) Conceptual Site Model(i) Exposure Pathway Model(ii) Food Web Model(iii) Assessment Endpoints(iv) Risk Hypotheses
(b) Selected Measures(i) Exposure(ii) Effect(iii) Characteristics
(c) Data Needs(i) Data Quality Objectives(ii) Data Analysis Procedures(iii) Data Interpretation Paradigm
(d) Assessment Tools Required(i) Ecological Parameter Measurements(ii) Toxicity Tests(iii) Tissue Residue Analysis(iv) Food Chain Models(v) Other Methods(vi) Risk Estimation Methodology
(e) Sampling Location Selection(i) Terrestrial(ii) Aquatic(iii) Reference Areas
(3) EXPOSURE ANALYSIS
(a) Exposure Investigation Results(b) Endpoint Species Exposure Profiles(c) Exposure Point Value (EPV) Estimates
(4) ECOLOGICAL RESPONSE ANALYSIS
(a) Response Investigation Results(b) Endpoint Species Exposure-Response Profiles(c) Ecological Benchmark Value (EBV) Estimates
(5) RISK CHARACTERIZATION
(a) Risk Estimation Results(b) Risk Description {weight-of-evidence}
(6) UNCERTAINTY ANALYSIS
(a) Exposure Estimation(b) Response Estimation(c) Risk Estimation
(7) RECOMMENDATIONS (8) REFERENCES
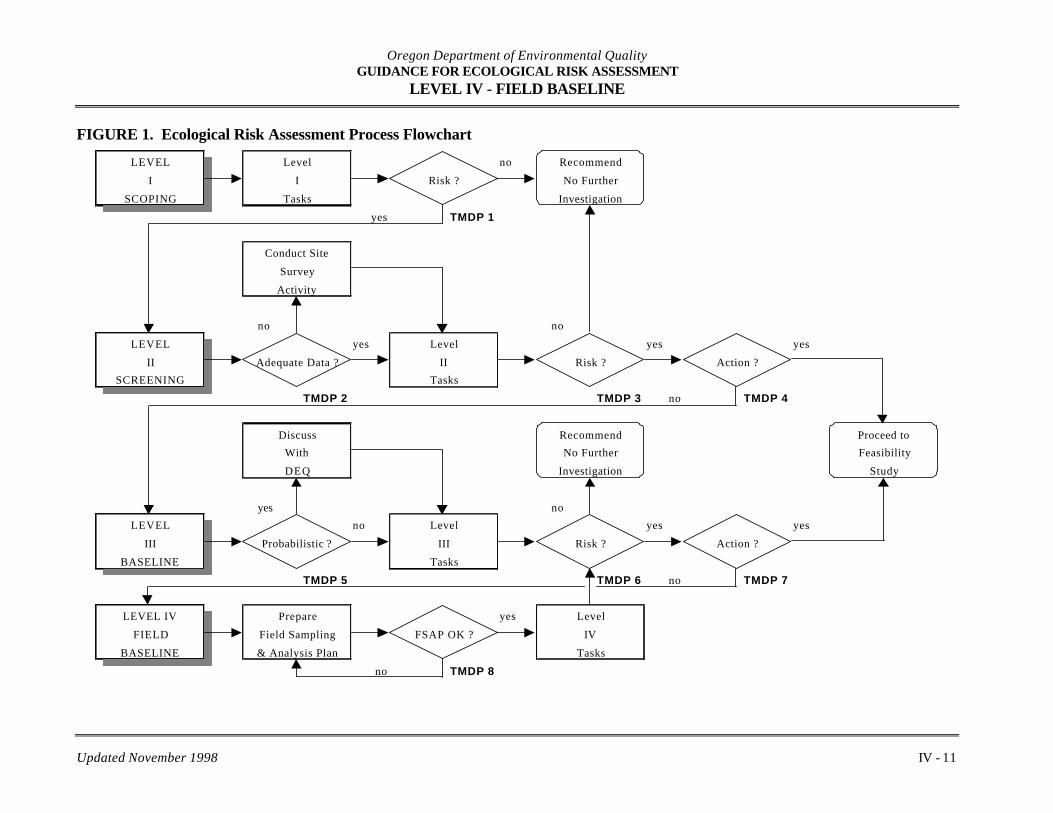
Oregon Department of Environmental QualityGUIDANCE FOR ECOLOGICAL RISK ASSESSMENT
LEVEL IV - FIELD BASELINE
Updated November 1998 IV - 11
FIGURE 1. Ecological Risk Assessment Process Flowchart
LEVEL Level no Recommend
I I Risk ? No Further
SCOPING Tasks Investigation
yes TMDP 1
Conduct Site
Survey
Activity
no no
LEVEL yes Level yes yes
II Adequate Data ? II Risk ? Action ?
SCREENING Tasks
TMDP 2 TMDP 3 no TMDP 4
Discuss Recommend Proceed to
With No Further Feasibility
DEQ Investigation Study
yes no
LEVEL no Level yes yes
III Probabilistic ? III Risk ? Action ?
BASELINE Tasks
TMDP 5 TMDP 6 no TMDP 7
LEVEL IV Prepare yes Level
FIELD Field Sampling FSAP OK ? IV
BASELINE & Analysis Plan Tasks
no TMDP 8
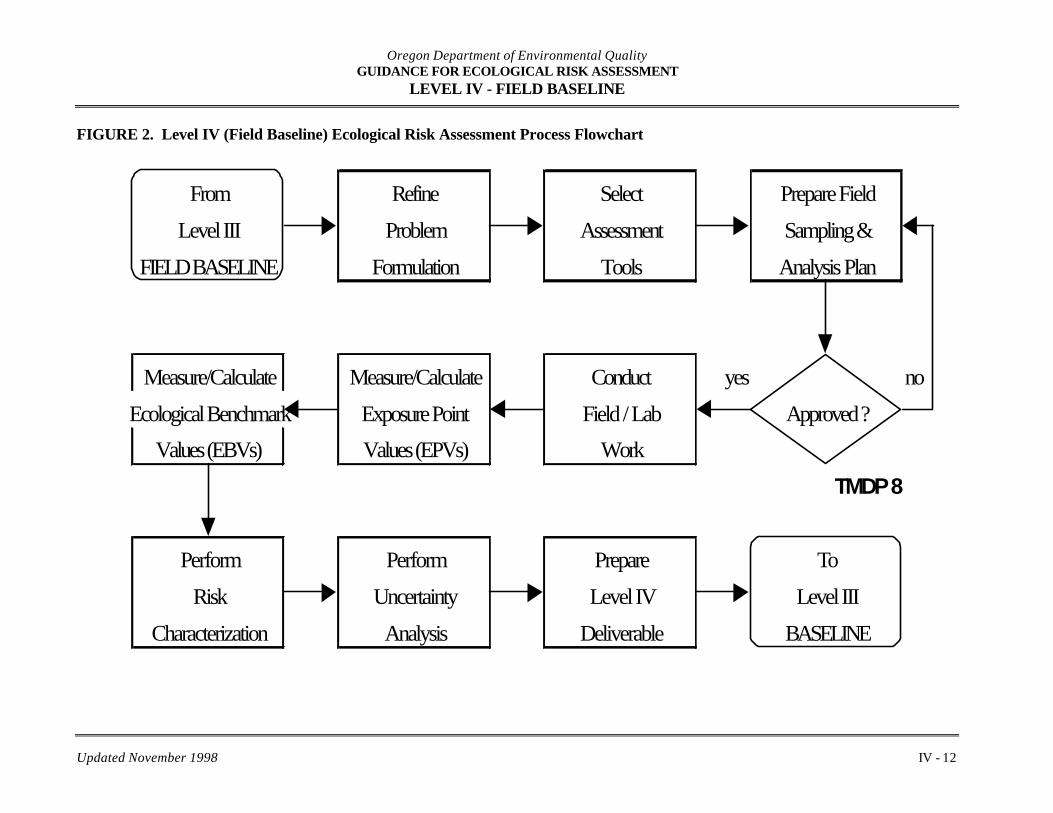
Oregon Department of Environmental QualityGUIDANCE FOR ECOLOGICAL RISK ASSESSMENT
LEVEL IV - FIELD BASELINE
Updated November 1998 IV - 12
FIGURE 2. Level IV (Field Baseline) Ecological Risk Assessment Process Flowchart
From Refine Select Prepare Field
Level III Problem Assessment Sampling &
FIELD BASELINE Formulation Tools Analysis Plan
Measure/Calculate Measure/Calculate Conduct yes no
Ecological Benchmark Exposure Point Field / Lab Approved ?
Values (EBVs) Values (EPVs) Work
TMDP 8
Perform Perform Prepare To
Risk Uncertainty Level IV Level III
Characterization Analysis Deliverable BASELINE