gssi discussion paper series in regional science
TRANSCRIPT
GSSI Discussion Paper Series in Regional Science &
Economic Geography
Is green always attractive? The location choices of Chinese outward FDI
Andrea Ascani
Gran Sasso Science Institute
Simona Iammarino
London School of Economics
Discussion paper No. 2020-08
November 2020

Editorial Board Andrea Ascani
Alessandra Faggian
Masood Gheasi
Benjamin Jara
Sandro Montresor
Valeria Pica
Ugo Rossi
Contact email: [email protected]
All views expressed in this document are those of the author(s) and do not necessarily represent the views of the editors or the GSSI.
Is green always attractive? The location choices of Chinese outward FDI
Andrea Ascani
Gran Sasso Science Institute (GSSI), L’Aquila Italy
Simona Iammarino
Department of Geography and Environment, London School of Economics
Abstract
With the exponential growth of the role of China in the global economy, the environmental
implications of its international expansion are serious but still scarcely investigated. This paper
analyses the location of 6,494 manufacturing subsidiaries of Chinese Multinational Enterprises
(MNEs) in 78 countries over the period 2008-2015, in response to the environmental performance of
host economies, in order to explore whether degraded environmental contexts represent a pull factor
for Chinese outward foreign direct investment (FDI). We build an original conceptual framework
combining traditional race-to-the-bottom arguments with a set of conditioning factors pertaining to
heterogeneity of both host countries and MNEs. By empirically accounting for endogeneity concerns,
our results suggest that Chinese outward FDI may feed a downward spiral by systematically favouring
locations with more fragile ecosystem vitality, that is, a weakly sustainable use of local natural
resources and the consequent erosion of the quality of the natural ecosystems. These results
characterise Chinese subsidiaries (i) locating in developing countries, (ii) operating within deficient
institutional frameworks and (iii) privately owned.
Keywords: Multinational enterprises, Outward FDI, Environment, Location strategies, China
JEL Codes: F23, F64, Q5
Funding: Andrea Ascani gratefully acknowledges funding from the NWO-Innovational Research
Incentives Scheme Veni SSH 2018 [Grant N. 016.Veni.195.085]
1. Introduction
Outward foreign investment of emerging markets multinational enterprises (EMNEs) has
dramatically grown in recent years, with China becoming the second largest investor after the
US in 2016 (UNCTAD, 2018). At the same time, both policy and academic debates place
emphasis on the attraction of foreign direct investment (FDI) as a tool to enhance
development opportunities, restructure and upgrade industrial sectors, acquire new
technologies, exploit new business chances and secure participation in global value chains
(e.g. Giuliani, 2008; Iammarino and McCann, 2013; Farole and Winkler, 2014; World Bank,
2017). While the growing international struggle to attract FDI together with the advent and
growth of EMNEs in global markets surely opens new economic opportunities, it may also
hide the risk of triggering a downward trend in key global societal goals. A primary concern
in this sense is that the international activities of EMNEs might increase the environmental
pressure in recipient economies. This can be due to the combination of lack of sustainable
business models and practices in EMNEs and their foreign operations (Alden and Davies,
2006; Wang and Elliott, 2014) and fiercer competition between countries to attract increasing
volumes of EMNEs activities by offering less constraints and lower regulatory standards
(Madsen, 2009; Duanmu, 2014).
This paper offers an investigation on the strategic location choices of Chinese MNEs in
response to the environmental performance of host economies, in order to shed light on
whether poor environmental practices represent a pull factor for the outward investment from
China. Considering the intensified role of China in the global economy, the environmental
implications of its economic growth and international expansion are very serious (Tan-
Mullins and Mohan, 2013). Although with relevant weaknesses, environmental regulation in
China has gradually become more severe in recent years, producing a relocation of activities
from coastal to western provinces and abroad (Wang, 2010; Wu et al., 2017). Given the
recent and increasing go-global attitude of Chinese MNEs, therefore, an urgent question
arises on whether and to what extent their internationalization is favouring recipient locations
with degraded environmental contexts.
We tackle this issue by building a conceptual framework where we conceive the relationship
between the international location decisions of Chinese MNEs and the environmental
performance of host countries by combining the traditional race-to-the-bottom arguments
with the idea that both recipient economies and Chinese subsidiaries are heterogeneous along
a number of key dimensions, including countries’ level of economic development and
institutional structures as well as subsidiaries’ degree of mobility and ownership type. Our
framework, therefore, allows to identify a number of conditions under which the relationship
under analysis can be influenced by the heterogeneous attributes of both locations and
companies, thus producing an articulated set of conceptual expectations on the link between
the strategies of Chinese MNEs and the environmental quality of host economies.
From the empirical standpoint, we collect information on 6,494 manufacturing subsidiaries of
Chinese MNEs in 78 countries over the period 2008-2015, as provided by the Bureau van
Dijk Historical Ownership Database. With respect to countries’ environmental performance,
we use the composite Environmental Performance Index (EPI) produced by the Yale Center
for Environmental Law & Policy and The Center for International Earth Science Information
Network at Columbia University, in collaboration with the World Economic Forum, which
provides a direct and unequivocal indication of how green and sustainable practices are
actually executed in a country. Methodologically, we perform a Poisson fixed effects
estimation by controlling for a large number of concurrent factors motivating Chinese
outward FDI, as identified in the existing literature since Buckley et al. (2007). Furthermore,
we take into account the potential endogeneity affecting the reliability of our estimations, by
extending our empirical analysis to an exponential mean model with endogenous regressors
and instrumenting the environmental performance of recipient countries.
Our results suggest the existence of a negative link between the location strategies of Chinese
MNEs and the environmental performance of host economies, supporting the idea that
China’s outward FDI may feed a race to the bottom by systematically favouring locations
with less diligent practices leading to environmental degradation. More specifically, Chinese
MNEs seem to privilege locations with scarcer ecosystem vitality (EV), that is, a weakly
sustainable use of local natural resources and the consequent erosion of the quality of the
natural ecosystems. Consistent with our conceptual framework, this negative link is
conditioned on the level of economic development of recipient economies, their institutional
structures, and the type of ownership of Chinese MNEs.
The article is structured as follows. The next section introduces our conceptual framework
and hypotheses development. Section 3 describes the data, while Section 4 explains the
methodological approach. Section 5 presents and discusses the estimation results. Finally,
Section 6 offers our concluding remarks and implications for policy.
2. Conceptual background and hypotheses development
2.1 Location strategies of EMNEs and environmental pressure
In their international corporate strategies of locational choices, not only are MNEs faced with
the subsidiary-level decision of establishing a specific operation in one location or another,
but they are also concerned with the organization of their overarching and global
configuration as a whole, encompassing all their foreign units. In this sense, MNEs are
complex organizations connecting multiple recipient contexts that are collectively functional
to their corporate efficiency, competitiveness and responsibility (Kostova and Zaheer, 1999;
Iammarino and McCann, 2013). In this complex decision making process, the tangible costs
of doing business in foreign locations also represent a crucial consideration. An
environmentally sustainable locational configuration of MNE activities may imply relatively
higher costs of operating abroad as compared to investing in locations where the local
environmental awareness is less developed. This is the case if locations with a better
environmental performance impose specific requirements and standards that translate into
higher costs of operation for manufacturers (Baumol and Oates, 1988). Thus, MNEs may face
lower hassles in locations with environmentally unsustainable business practices, as
compared to locations where sustainability represents a clear societal goal. This echoes the
notion of pollution havens, intended as places where the pressure of the environmental
regulation is low, and the related idea that global FDI may be attracted to these locations to
minimize production costs (e.g. Xing and Kolstad, 2002; Kellenberg, 2009; Pinkse and Kolk,
2012). In this sense, some locations can have a comparative advantage in their low
environmental performance and, as a consequence, the global (re)location of manufacturing
activity can respond to geographical differentials in how environmental sustainability is
attained. Importantly, this mechanism can generate an environmental race to the bottom,
whereby environmental sustainability can be hindered by local authorities as an attempt to
attract larger volumes of international production capitals (Konisky, 2007; Madsen, 2009). As
many emerging economies are taking gradual steps towards more sustainable business
practices domestically (Wang, 2010), also due to legitimacy pressures, some of their
companies may be incentivised to relocate subsidiaries in foreign locations with lower
environmental demands. From the EMNEs perspective, because they lack the initial firm-
specific advantages for the exploitation of global markets and are driven by the need to
construct and cement such advantages via investment abroad (e.g. Child and Rodrigues,
2005; Yiu et al., 2007; Ramamurti, 2012), locations with weaker environmental performance

can be rather attractive. This may be interpreted as a type of predatory international location
strategy, consistent with the recent evidence on the rapacious attitude of some EMNEs
investing in Europe (e.g. Giuliani et al., 2014).
On this basis, we formulate the following baseline hypothesis regarding the global location
strategies of Chinese MNEs:
H1. A negative relationship exists between the international location of Chinese
subsidiaries and the environmental performance of recipient economies.
2.2 Countries’ heterogeneity in economic development and institutional frameworks
We extend our conceptual framework by contemplating the role of country heterogeneity,
with the idea that this crucially conditions the strategic location behaviour of Chinese MNEs
in relation to the environmental performance of host economies. The level of economic
development of recipient countries is a key conditioning factor in this sense, as sustainability
and environmental concerns as well as green policy objectives are not uniform across nations
with unequal resources and financing opportunities (Claessens and Feijen, 2007). Advanced
countries are characterised by economic systems where the investment cost for attaining
environmental targets is relatively lower than in developing countries, and where domestic
companies can more easily access capital and react to environmental incentives by either
changing their production structures or through innovation (Tadesse, 2005; Tamazian et al.
2009). At the same time, developing countries more often experience ecological
marginalisation, strong pressures on natural resources and fragile environmental practices due
to unresolved developmental issues connected to low income, lack of market and non-market
incentives to promote sustainable practices, poverty, and a generalised low environmental
awareness in both the public and private sectors (Geng and Doberstein, 2008; Watmough et
al., 2016). Therefore, the negative link envisaged in our baseline hypothesis H1 between the
location of Chinese subsidiaries and the environmental performance of host economies could
be reasonably influenced by the level of economic development of host countries. Following
this line of argument, we formulate the following hypothesis:
H2: The negative relationship between the international location of Chinese
subsidiaries and the environmental performance of recipient economies is stronger
in developing countries than advanced countries.
Furthermore, we also posit that countries’ heterogeneity in the quality of their institutional
frameworks also play a central role in conditioning the link between the strategies of Chinese
MNEs and the environmental performance of different locations. The bulk of the literature
acknowledges that good institutional structures favour capital accumulation and investment,
by providing predictable and stable markets and reducing business risks (North, 1990; Scott,
1995; Phelps et al., 2003; Acemoglu and Johnson, 2005), thus facilitating the attraction of
foreign MNEs (Bénassy-Quéré et al., 2007). Nonetheless, other evidence suggests that in
some cases MNEs may prefer locations with more deficient institutional settings as a strategy
to elude or circumvent transparent market mechanisms and regulations when investing
abroad, especially in the context of developing economies (Boddewyn and Brewer, 1994;
Ascani et al., 2016). Furthermore, studies on the specific case of Chinese outward FDI
highlight how Chinese MNEs are less risk averse than companies from advanced countries as
they more systematically tend to locate in countries with weaker institutions (Buckley et al.,
2007; Kolstad and Wiig, 2011). One recurring explanation for this type of finding stands in
the idea that Chinese MNEs possess a comparative advantage in operating within flawed
institutional frameworks due to their home experience in terms of poor governance (Morck et
al., 2008; Quer et al., 2012). Based on these elements, it is possible that Chinese MNEs are
able to either efficiently cope with the risks associated with uncertain institutional
environments or exploit more fragile settings to gain an advantageous business position.
While disentangling the specific mechanism is beyond the purpose of the present research,
these arguments suggest that the strategies of localisation of Chinese MNEs could be more
plausibly oriented towards economies where the fragility of the local institutional structures
may allow the adoption of less diligent environmental practices. Hence, we formulate the
following hypothesis:
H3: The negative relationship between the international location of Chinese
subsidiaries and the environmental performance of recipient economies is stronger
in countries with weaker institutions.
2.3 Subsidiaries’ heterogeneity in mobility and ownership type
Although countries’ differences in their specific economic and institutional attributes may
fragment the relationship between Chinese MNE location decisions and host economies’
environmental performance along the lines discussed above, here we probe that the
heterogeneity of Chinese MNEs can also give rise to specific patterns of subsidiary
localisation. Specifically, we consider two distinctive features of Chinese MNEs that can
condition their locational response: namely, their mobility and their ownership. The ease of
mobility of subsidiaries is a key element in our framework because companies operating in
more footloose industries, that are characterised by relatively lower initial sunk costs, are
more likely to rapidly relocate elsewhere if the cost of production in a specific location
increases (e.g. Ulph and Valentini, 2001; Konings and Murphy, 2006; van Beveren, 2007).
On the contrary, subsidiaries operating within less footloose industries, that are associated
with relatively higher initial sunk costs of establishment, may find it more costly to move
when incurring in higher costs of production in their current location (Ederington, 2005;
Kellenberg, 2009). Interestingly, recent evidence on Chinese companies indicates that the
location behaviour of these firms can be particularly susceptible to increased costs associated
with tighter environmental requirements (Wu et al., 2017). For our purposes, these arguments
provide the basis for conceptualising the role of Chinese subsidiaries’ degree of mobility as
an element conditioning their strategic location behaviour in response to countries’
environmental performance. Specifically, Chinese MNEs operating within more footloose
manufacturing industries face easier relocation opportunities than those active in less mobile
sectors. Hence, the former should be systematically more able to sort destination countries
and locate where environmental concerns are reflected in less rigid policy and societal
objectives. Our fourth hypothesis is therefore:
H4: The negative relationship between the international location of Chinese
subsidiaries and the environmental performance of recipient economies is stronger
for relative more footloose Chinese MNEs.
Finally, we scrutinize the ownership type of Chinese MNE subsidiaries as an additional
source of heterogeneity in their location strategies, by considering State-owned and private
companies. One fundamental aspect associated with these ownership types pertains to their
uneven access to credit and the consequent different business opportunities, especially in the
context of the Chinese imperfect capital market and its financial constraints (Huang, 2003;
Guariglia and Poncet, 2008; Voss et al., 2010). Consistently, extant evidence highlight that
private companies in China face more severe access to finance for supporting their activities
as compared to State-owned enterprises (Poncet et al., 2010). Moreover, with respect to
operations abroad, these constraints can also be larger due to the control system run by the
China State Administration and Foreign Exchange (SAFE) to authorise the outward FDI of
Chinese companies, whereby the stringent prerequisites demanded to firms in terms of
financial security amply favour State-owned companies (Buckley et al., 2018). The more
limited financing opportunities of private companies could suggest that they are more
sensitive to cost reduction when investing abroad. On the other hand, it has also been shown
that State-owned Chinese MNEs are subject to higher institutional pressures by host
governments, which can push them to adapt their location strategies to reduce potential
conflicts and enhance their legitimacy in the host contexts (Meyer et al., 2014). Thus, private
Chinese MNEs can more systematically regard the environmental situation of recipient
countries as a potential area for decreasing production costs, as compared to State-owned
enterprises, thus favouring locations that allow the implementation of less diligent
environmental business practices. The following hypothesis is put forward:
H5: The negative relationship between the international location of Chinese
subsidiaries and the environmental performance of recipient economies is stronger
for private Chinese MNEs.
3. Data description
We test our hypotheses by combining different sources of information to generate a panel
dataset covering the presence of 6,494 manufacturing subsidiaries of Chinese MNEs in 78
countries over the period 2008-2015, as well as the environmental performance of these
locations and other relevant country characteristics potentially motivating the Chinese
presence. Data on Chinese subsidiaries is provided by the Bureau van Dijk Historical
Ownership Database. This is a restricted access database containing information on the
ownership linkages between companies. We start by considering all the Chinese Global
Ultimate Owners, that is Chinese entities without further parent companies, and we next
follow their downstream ownership linkages in order identify their subsidiaries abroad.
Subsequently, we consider as Chinese subsidiaries all entities controlled by a Chinese Global
Ultimate Owner for at least 50% of their total ownership, thus adopting a quite stringent
definition of subsidiary status.
[Table 1 around here]
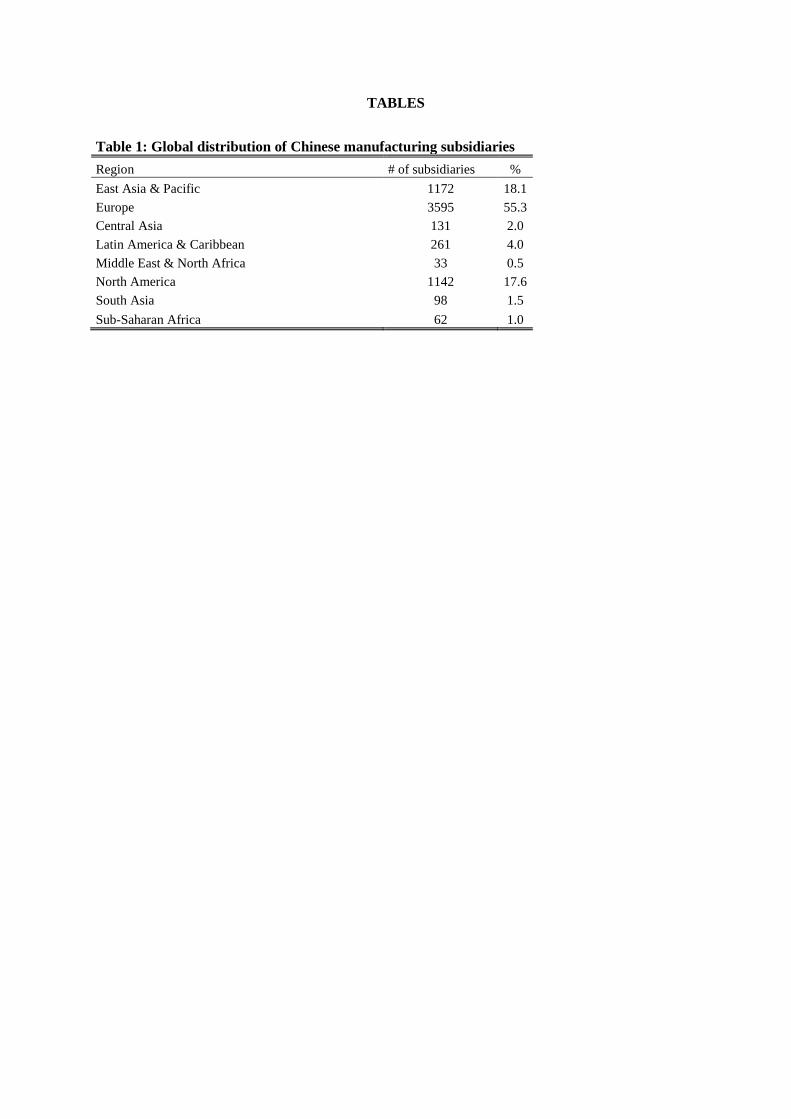
Table 1 shows the geographical distribution of the manufacturing subsidiaries of Chinese
MNEs in our sample. Not surprisingly, the great majority of them are located in Europe,
followed by the East Asia & Pacific region and North America. Panel A of Table 2 offers a
more detailed outlook of the geography of Chinese MNEs’ manufacturing investment, by
considering the top ten destinations at the beginning and at the end of our sample period. The
number of subsidiaries notably grew from 2008 to 2015 in most of these locations, and the
geographical composition of Chinese outward investment has only partially changed over
time, with countries such as the US, Germany, Australia, the UK and the Netherlands being
the most targeted economies. Panels B and C of Table 2 offer a similar snapshot considering
the capital-intensity of the industries in which Chinese subsidiaries are active1. This
distinction should allow us to distinguish between subsidiaries that are more of less footloose
depending on the sunk costs related to the nature of the investment in different industries.
While the country composition is rather similar across Panel B and C, suggesting that capital
intensity is only partially related to the investment destinations, this descriptive evidence
clearly suggests that the evolution of the international expansion of MNEs from China over
the observed period varies in terms of extent of capital-intensity. For instance, of the 24
Chinese subsidiaries located in the US in 2008, 13 are in less capital-intensive industries
(54%) and 11 in more capital-intensive industries (46%). In 2015, of the 466 Chinese
subsidiaries located in the US economy, instead, 359 are in less capital-intensive industries
(77%) and 107 in more capital-intensive industries (23%). This pattern of global expansion of
Chinese MNEs across industries with diverse capital-intensity is similar for other destination
countries and it may suggest that the share of Chinese subsidiaries that can be considered
relatively more footloose has notably widened over the sample period.
[Table 2 around here]
With respect to countries’ environmental performance, we use the Environmental
Performance Index (EPI) produced by the Yale Center for Environmental Law & Policy and
The Center for International Earth Science Information Network at Columbia University, in
collaboration with the World Economic Forum. This is a composite index based on 24
specific quantitative metrics grouped into 10 issue categories, of which 7 cover the notions of
environmental health (EH) and 3 refer to ecosystem vitality (EV), thus providing a
comparable and exhaustive picture of countries’ performance in terms of environmental
sustainability policy objectives (see Wendling et al., 2018 for more details). Precisely, the
notion of EH captures the threats to human health deriving from anthropic activities, while
the EV measures the intensity of use of natural resources and the consequent quality of the
ecosystems. The 7 issue categories considered for the EH portion of the EPI are: (i)
biodiversity & habitat, (ii) forests health, (iii) fisheries, (iv) climate & energy, (v) air
pollution, (vi) water resources and (vii) use of nitrogen in agriculture. The 3 issue categories
for the EV part of the EPI are: (i) air quality, (ii) water & sanitation and (iii) exposure to
1 Capital-intensity is calculated with Orbis data for NACE 4-digits industries and the distinction between the
two categories is based on the median of capital intensity.

heavy metals. The EPI ranges from 0 to 100, with higher values indicating a better
environmental performance. EPI scores are also comparable over the years. The same scores
are also available for the two main EPI components, EH and EV, thus allowing a more
focused analysis of specific environmental domains in relation to firm location behaviour.
The use of the EPI as a measure of locations’ environmental performance has also the
advantage of providing a direct and unequivocal indication of how green and sustainable
practices are actually executed in a country, beyond local regulations and standards. The
latter, in fact, can notably vary across countries, together with the degree of monitoring,
enforcement and compliance of economic actors (Luxmore et al., 2018). Therefore, it is
possible that a highly environmentally-regulated country with scarce governance and
enforcement quality exhibits a weak environmental performance, which can in turn positively
influence firm location behaviour (Kolk and van Tulder, 2010; Qerimi and Sergi, 2012). Not
only this seem to be in line with recent scholarly evidence that Chinese outward FDI is
attracted to locations characterised by weaker institutional conditions (e.g. Kolstad and Wiig,
2012; Buckley et al., 2018), but it also suggests that considering the actual environmental
performance of countries by means of the EPI and its components represents a significant
advantage in investigating the environmental sustainability of the global location behaviour
of Chinese MNEs.
Table 3 shows the ranking of top and bottom ten countries in our sample with respect to the
EPI as well as its components EH and EV in 2015. Not surprisingly, the highest EPI scores
characterise Scandinavian countries and other European countries, plus New Zealand (Panel
A). As far as the EH domain is concerned, the ranking is led by Australia and New Zealand,
followed by Scandinavian countries and other European states, plus Canada. With respect to
the EV, the ranking is led by Switzerland and there is a general shift in the top ten towards
some Eastern European Union (EU) countries, such as Slovenia, Czech Republic, Hungary
and Slovak Republic, and some of the largest EU economies, such as Germany, France and
Italy. With respect to the bottom ten ranking in terms of the three indicators, the list mostly
includes developing economies in Africa and Asia, such as Kenya, Bangladesh, Myanmar
and Burkina Faso, and some emerging countries, such as Indonesia and Turkey (Panel B).
The only European country in this list is Bosnia and Herzegovina, performing particularly
low in terms of EV.
[Table 3 around here]
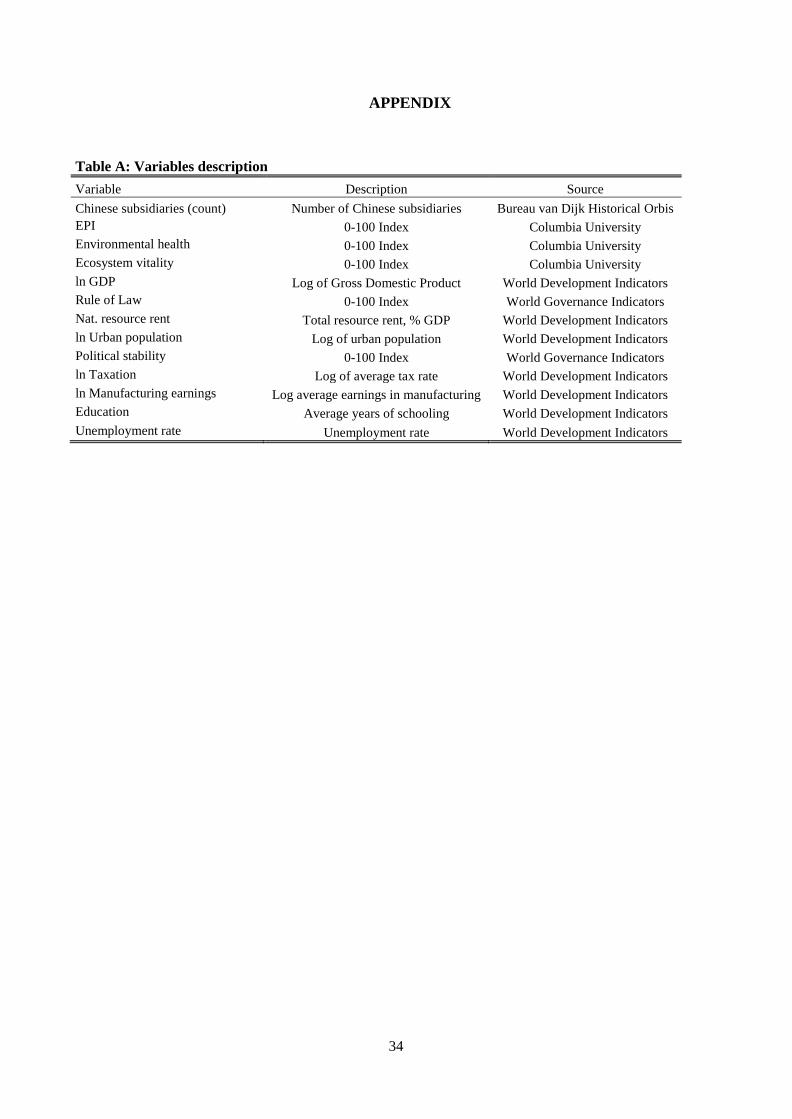
We also collect data from World Development Indicators (WDI) on a large number of other

country features that can influence the location of the subsidiaries of Chinese MNEs. A full
account of variables and data sources is provided in Table A in the Appendix. We first
consider the market size of destination countries by using GDP data, as customary in the
literature. Extant studies on Chinese MNEs generally find that market access considerations
can drive the location strategies of Chinese companies towards larger markets (e.g. Buckley
et al., 2007; Quer et al., 2018), although the empirical evidence is not always consistent
(Kang and Jiang, 2012; Han et al., 2014). Second, we consider the institutional conditions of
the recipient economies, using indicators of both Rule of Law and the Political Stability from
the World Governance Indicators. As mentioned above, outward FDI from China appears to
be attracted to weaker institutional environments in a number of existing influential studies
(e.g. Buckley et al., 2007; Buckley et al., 2018), even though some contributions offer mixed
evidence on this specific point (e.g. Ramasamy et al., 2012). Third, we include a number of
labour market characteristics in the host destinations potentially influencing the location
behaviour of Chinese MNEs via different mechanisms: (i) total employment in
manufacturing, as an indicator of size and availability of labour in this sector, (ii) level of
earnings in manufacturing, as a measure of local labour cost, (iii) unemployment rate, as a
proxy for the functioning of labour markets, and (iv) the average years of schooling of the
population, as an indication of the level of education. Fourth, we include a measure of urban
population, in order to capture the potential agglomeration effect of cities, which is often
considered a driver of firm location choice (Hilber and Voicu, 2010). Fifth, the average
taxation level of recipient economies is also considered, as an element that can influence the
costs faced by MNEs (Voget, 2011). Finally, we account for countries’ heterogeneity in their
endowments of natural resources using data on natural resources rents. Existing studies on the
specific case of Chinese MNEs offers ambiguous evidence regarding this driver of outward
FDI (Kolstad and Wiig, 2012; Li et al., 2018), as this may more plausibly be a motive related
to Chinese activities in developing countries only (Kang and Jiang, 2012). Tables 4 and 5
report the correlation matrix and summary statistics, respectively.
[Tables 4 and 5 around here]
4. Methodology
In our econometric approach we follow Hausmann et al. (1984), Cameron and Trivedi (1998)
and Wooldridge (1999). We use the number of Chinese subsidiaries in each country as

dependent variable: considering its nature of count variable, we assume a Poisson distribution
with the following density:
(1)
where Yit is a random variable and its realisation yit indicates the frequency of Chinese
subsidiaries varying across recipient country i and year t; xit is a vector of independent
variables and μit is the conditional mean of the Poisson distribution. With the longitudinal
data at hand, we consider the following Poisson model with exponential mean function and a
multiplicative individual term:
(2)
where αi indicates country specific effects and λit is the exponential mean depending on
explanatory variables xit and parameters β:
(3)
Hence, by exploiting the panel nature of our dataset, we are able to eliminate unobserved
time-invariant country attributes and to estimate the Poisson fixed effects model given by
Equations (2) and (3) by means of Maximum Likelihood. In the context of our study, the
advantage of this approach is that the estimation of the role of countries’ environmental
performance in attracting Chinese MNEs fully accounts for countries’ unobserved
heterogeneity that can affect investment location decisions.
However, a relevant concern with this approach could be that our covariates are
simultaneously determined with the dependent variable, thus potentially generating biased
estimates. For instance, Chinese MNEs’ foreign activity can be endogenously determined
with countries’ environmental performance and GDP. To address this potential issue, we first
consider time lags of the EPI and GDP in the Poisson fixed effects estimation and, second,
we test the robustness of our baseline estimates by considering an exponential mean model
with endogenous regressors. This is a Poisson model estimated with GMM techniques in
presence of explanatory variables with endogenous nature (see Windmeijer and Santos Silva,
1997; Wooldridge, 2010). We take a similar approach to Kellenberg (2009) in the choice of
instruments, by primarily using the characteristics of the agricultural sector of each country i.
The economic reasoning motivating this choice is that the agricultural sector can indirectly
affect the location of foreign manufacturing MNEs via both its contribution to national GDP
and its impact on a country environmental performance. According to the United Nations

Food and Agriculture Organisation (FAO), for instance, agricultural activities can have a
multifaceted effect on the environment, ranging from their impacts on water quality and air
pollution to that on biodiversity, fertility of soils and, more generally, environmental
sustainability (Alexandratos and Bruinsma, 2012). For this reason, both GDP and the EPI
enter the exponential mean model specification as endogenous regressors. For each country i,
we also consider as instruments the characteristics of the agricultural sectors of its
neighbouring countries j within each world region specified in Table 1, as there may be
interactions between neighbours in terms of common environmental objectives and practices.
As agricultural sector characteristics, we use both the capital-labour ratio and the land-labour
ratio. Data for agricultural land and agricultural machinery come from the WDI, while data
on the agricultural employment come from the International Labour Organisation (ILO)
database2. Essentially, these ratios provide a measure of the agricultural technology level in
each country, which directly influences national GDP and environmental performance. For
each country i, we also consider other exogeneous characteristics of neighbouring countries j,
which can be added as instruments, such as their urban population and taxation rate. These
can alternatively influence a country GDP and its environmental performance within each
world region, but remain exogeneous to the characteristics of a country i. All the instruments
based on the characteristics of third countries j are also normalised by a GDP weighted
average including all the countries in each world region.
5. Results and discussion
5.1 Baseline results
The baseline estimates of the relationship between the international location of the
subsidiaries of Chinese MNEs and the environmental performance of countries are presented
in Table 6. We gradually enter our regressors in order to test the sensitiveness of our
estimates to the model specification. We start by exploring the relationship between the
location of Chinese subsidiaries and the EPI, without controlling for other confounding
factors (column 1). The coefficient on the lagged EPI remains statistically insignificant, thus
suggesting that the global configuration of Chinese outward FDI is unrelated to the
environmental practices of destination countries. Next, we take advantage of the
2 Unfortunately, this data does not cover the full sample of 78 countries under analysis, but only 54 countries.
Therefore, we adopt this methodology only as a robustness check, rather than main estimation method.

characteristics of the EPI by unpacking the index into its two main components, namely:
environmental health and ecosystem vitality. In fact, it is possible that the insignificant
relationship detected in column 1 hides a more articulated link between the location of
Chinese MNEs and the local natural environment. The estimates in column 2 show that a
negative and statistically significant association exists between the location of Chinese MNE
subsidiaries and a country performance in terms of its EV, while the role of EH remains
irrelevant.
[Table 6 around here]
This suggests that Chinese MNEs tend to direct their international operations towards
economies characterised by a weakly sustainable use of local natural resources and the
consequent erosion of the quality of the natural ecosystems, consistently with recent evidence
on the predatory strategies of EMNEs when engaging in activities abroad (Giuliani et al.,
2014). In columns 3 to 8 we gradually enter all covariates as identified in the literature and
discussed in Section 4 above: national GDP, to capture the market-seeking rationale of
Chinese outward FDI; the two measures of institutional quality; the characteristics of the
national labour market, that is, manufacturing employment and earnings, unemployment rate
and average years of schooling; agglomeration forces related to the presence of cities; the
level of taxation; and, finally, the relevance of natural resources in the national economy.
Across specifications, the negative coefficient of the EV indicator remains statistically
significant and stable, indicating that this variable substantially captures some variation in our
dependent variable that is neither accounted for by any of the many controls, nor by the fixed
effects.
Other significant relationships emerge in the baseline estimates. Chinese MNEs seem to
prefer locations with weaker rule of law, in line with previous studies detecting a pattern of
Chinese FDI towards fragile institutional settings (Buckley et al., 2007; Kolstad and Wiig,
2011). However, we cannot find any statistical association between the location of Chinese
subsidiaries and the political stability of host economies. This suggest that Chinese strategies
may respond differently across different institutional forms. With respect to the labour market
characteristics of host locations, Chinese companies are unsurprisingly attracted to economies
where both the wages in manufacturing and the unemployment levels are lower, likely in
order to minimize production costs and enjoy a more dynamic labour turnover. Also, higher
educational levels of the labour force seem to attract Chinese MNEs. As far as the other
controls are concerned, we detect strongly negative coefficients on both urban population and
high taxation levels: these findings may be ascribed to strategies to avoid costly locations.
Finally, the presence of natural resources also play an attraction role for Chinese subsidiaries,
consistently with many prior studies indicating the marked natural resource-seeking
behaviour of Chinese MNEs (e.g. Ramasamy et al., 2012; Li et al., 2013).
In column 9, we re-run the most extended specification by entering the aggregate EPI, rather
than its components, and we find a negative and statistically significant coefficient in this
case. Overall, the evidence emerging from this baseline results suggest that a negative
relationship exists between the international location of Chinese subsidiaries and the
environmental performance of recipient economies, thus providing initial support for H1 and
a rejection of H2.
5.2 Endogeneity of environmental performance
Our main test for the robustness of our baseline estimates is reported in Table 7, where we
present the results for the exponential mean model with endogenous regressors explained in
Section 4. Column 1 replicates with this new methodology the most extended baseline
specification reported in column 8 of Table 6. The main results remain stable, with the
coefficient on EV exhibiting a strongly significant negative sign, while EH is not statistically
relevant. The only differences with the baseline results concern some of the covariates that
lose significance, while maintaining their sign (i.e. educational level, urban population and
taxation level).
While the use of this econometric strategy should provide a more solid estimation of the
impact of countries’ environmental performance on the location choices of Chinese MNEs, it
is still conceptually possible that the agricultural sector characteristics used as instruments in
this model are correlated with some omitted variables. For instance, the agricultural capital-
labour ratio and land-labour ratio can depend on the capacity of an individual economy to
accumulate capital, on the size of its labour force, and on the availability of land. Hence, we
gather data from the WDI on countries’ total labour force, total land area and fixed capital,
and re-estimate the model in column 1 by considering these elements separately, from
columns 2 to 4, and collectively, in column 5. Across all these specifications, the results
regarding the EH and the EV remain very stable from both the quantitative and qualitative
standpoint. These estimates, therefore, provide further support for H1, whereby the
international configuration of Chinese subsidiaries is driven by the low scores in the EV
component of the environmental performance of countries.
With respect to the diagnostics of this model, the overidentification tests in all columns
indicates that the null hypothesis that the instruments are valid (i.e. uncorrelated with the
error term) cannot be rejected.
[Table 7 around here]
5.3 Heterogeneity in country and subsidiary characteristics
We extend our investigation by studying whether and how the specific characteristics of
recipient countries and Chinese subsidiaries alter the relationship identified in the previous
empirical analysis. We start by exploring the role of countries’ heterogeneity by accounting
for their differences in terms of level of economic development and institutional quality. As
hypothesized in our conceptual framework above, the negative link between the location of
Chinese subsidiaries and the environmental performance of host economies could potentially
be prevalent in countries where sustainability does not represent a societal goal or can hardly
be achieved due to the lack of resources to implement green business practices or because of
a rather fragile institutional framework (Kolstad and Wiig, 2011; Lu et al. 2015;
Sarvajayakesavalu, 2015). Table 8 presents our estimates for two categorisations of recipient
countries in terms of their levels of economic development and Rule of Law. The significant
negative association between EV and the location of Chinese MNEs endures in the case of
medium and low income countries, while it completely loses its statistical relevance for high
income economies (columns 1 and 2), consistent with H2. Therefore, the wealth of
destination countries can be a source of heterogeneity in the relationship between the location
choices of Chinese MNEs and the environmental quality of host locations. A more nuanced
explanation for this finding could be that most Chinese FDI towards advanced economies is
either market- or asset- seeking in nature, and this type of operations are fundamentally
disconnected from the environmental performance of the host economy. On the contrary,
Chinese subsidiaries in medium and low income countries could be predominantly involved
in production operations, which are more intimately connected to environmental
considerations. The coefficients on GDP, manufacturing employment and earnings in
columns 1 and 2 may support this conjecture. Another interesting result stands in the
institutional dichotomy on the role of the rule of law between high versus medium and low
income countries in explaining the location of Chinese MNEs. The fragility of this type of
institutional dimension dominates in the case of the less developed economies, where MNEs
may take advantage of these weaknesses and reinforce their position, consistent with recent
empirical evidence (Ascani et al., 2016), while a more certain and predictable institutional
setting prevails in the case of advanced economies. To some extent, this dualism can also
explain the mixed evidence on the role of institutions in explaining the location behaviour of
Chinese MNEs (Ramasamy et al., 2012; Quer et al., 2018).
[Table 8 around here]
In columns 3 and 4 of Table 8 we re-run our model by dividing recipient countries based on
whether their rule of law score is above or below the median. The negative relationship
between EV and the location of Chinese subsidiaries is persistent across samples, although it
emerges as more relevant in the case of countries with weak rule of law. These evidence only
partially corroborates H3. Nonetheless, a fragile institutional environment seems to be
conducive of location strategies that respond to a poor environmental performance also in
terms of EH. This new finding – not emerged in the previous estimates – may indicate that
the global configuration of Chinese subsidiaries is associated with weak environmental
practices, and this relationship becomes stronger and more pervasive the more fragile a
country institutional structure is, in line with H3.
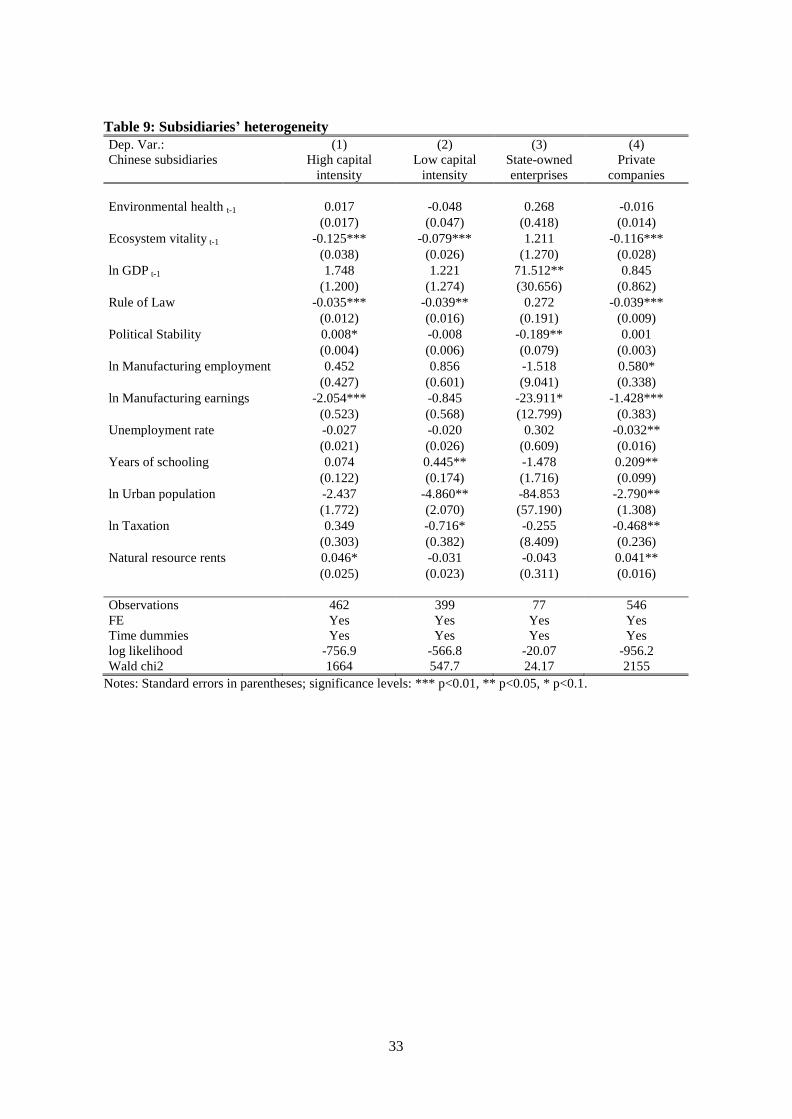
We then account for some core characteristics of Chinese subsidiaries, which may influence
the link between their location choice and the environmental performance of host economies.
Hence, we first examine the capital-intensity of subsidiaries, as defined in the data section
above, following the idea that companies operating in less capital-intensive industries are
more footloose due to lower initial sunk investment costs (Ederington et al., 2005).
Therefore, these companies are more able to relocate whenever the environmental
performance of the host country increases and they are potentially faced with higher costs of
production to comply with the new environmental standard. In this sense, they may be more
sensitive to the quality of the environmental performance of a country. Second, we account
for the type of ownership of subsidiaries, by identifying companies that are either part of a
State-owned enterprise or private entities. We posited that the negative link emerged in the
previous analysis may characterise the location behaviour of private MNEs, which could be
more sensitive to the production costs associated with a strong environmental practice in host
economies, while being subject to tighter financial constraints at home. The relationship
between the EV of host economies and the location strategies of Chinese MNEs remains
significant and negative irrespective of the capital-intensity of the subsidiaries (columns 1
and 2 of Table 9), thus suggesting that this dichotomy does not capture any relevant condition
that influences Chinese MNE behaviour in our data. Therefore, this evidence remains
unsupportive of H4. Still, there are differences in the location determinants across more or
less capital-intensive subsidiaries. For instance, less footloose companies positively react to
lower manufacturing labour costs, while more mobile subsidiaries are responsive to higher
educational levels and lower taxes. With respect to different ownership types (columns 3 and
4 in Table 9), our results indicate that countries’ poor environmental performance in terms of
EV is connected to the strategies of private MNEs only, in line with H5. As suggested above,
this can be explained by the fact that private companies may be more concerned with, and
able to react to the costs of production related to environmental standards. Thus, they may
tend to privilege locations where these costs are lower or absent due to poor environmental
practices. Interestingly, the different nature of the institutional preference of private and
State-owned MNEs shows that the former pick locations with poor rule of law while the latter
are associated to more politically unstable countries. While private MNEs may have an
advantage in operating in contexts where rules and regulations are weakly enforced, State-
owned enterprises are oriented towards less stable countries for political reasons (Cuervo-
Cazurra et al., 2014; Li et al., 2018).
[Table 9 around here]
6. Concluding remarks
This paper has offered an investigation of the strategic location decisions of Chinese MNEs
in response to the environmental performance of recipient economies. We maintained that
understanding these dynamics is urgent and relevant in consideration of the exponential
growth of the role of China in the global economy and the profound environmental
implications of its international expansion.
From the theoretical standpoint, we generated a conceptual framework where the relationship
between the international location decisions of Chinese MNEs and the environmental
performance of countries integrates traditional race-to-the-bottom arguments with country
and MNE heterogeneity, consistent with idea that a number of crucial conditions can filter the
strategies of Chinese MNEs. Our empirical analysis unveils a nuanced set of results that are
mostly in line with our hypotheses. First, we highlight a persistent negative link between the
location behaviour of Chinese subsidiaries and the environmental performance of host
countries, in line with the view that China’s outward FDI may sustain a race to the bottom by
privileging locations with looser green practices leading to environmental degradation.
Second, this relationship mostly pertains to scarcer ecosystem vitality (EV) in recipient
countries, rather than their environmental health (EH), indicating that a weakly sustainable
use of local natural resources with its subsequent erosion of the quality of the natural
ecosystems explains the location of Chinese subsidiaries. Third, consistent with our
conceptual framework, the level of economic development of recipient economies represents
a key condition for Chinese outward FDI, as the attracting force of a degraded environmental
situation holds for developing economies countries only. Furthermore, weak green practices
drive the strategies of localisation of Chinese MNEs exclusively where local institutions are
more fragile, suggesting that Chinese MNEs positively respond to environmental laxity in
economic systems where it is relatively easier to circumvent regulations or with lower
monitoring. Finally, the environmental race to the bottom characterises private Chinese
MNEs rather than State-owned enterprises. Contrarily to our expectations, instead, the level
of mobility of Chinese MNEs operating in different sectors does not conditions their location
behaviour: more or less footloose subsidiaries exhibit similar patterns of localisation when it
comes to the environmental performance of host economies. Importantly, our results are very
stable and robust to the inclusion of a wide number of co-variates and several endogeneity
checks, thus reassuring us on the goodness of our empirical setting.
From a policy perspective, our findings suggest that the wider international spread of Chinese
FDI – and possibly of EMNEs more generally – may represent a threat for the environmental
pressure that this dramatic expansion may trigger through a race to the bottom between
countries. To avoid this downward spiral in a key area of the Millennium Development
Goals, it is paramount that national governments coordinate internationally to set clear and
stringent environmental objectives, with associated monitoring and sanctions, for both
domestic and foreign companies. This should be aimed at (i) improving the national
environmental performance, (ii) promoting environmental protection as a societal value and
(iii) limiting an environmentally detrimental territorial competition to attract FDI. A renewed
and reinforced multilateral arena of global discussion and policy-making should be promoted
to allow the governments of developing nations and/or countries afflicted by institutional
deficiencies not to face these challenges in isolation.
References
Acemoglu D. and Johnson S., 2005. Unbundling Institutions. Journal of Political Economy 113(5),
949-995.
Alden C. and Davies M., 2006. A profile of the operations of Chinese multinationals in Africa. South
African Journal of International Affairs 13(1), 83-96. Alexandratos N. and Bruinsma J., 2012. World agriculture towards 2030/2050: the 2012 revision.
ESA Working paper No. 12-03. Rome, FAO.
Ascani A., Crescenzi R. and Iammarino S., 2016. Economic institutions and the location strategies of
European multinationals in their geographic neighborhood. Economic Geography 92(4), 401-429.
Baumol W.J. and Oates W.E., 1988. The Theory of Environmental Policy. Cambridge, UK:
Cambridge University Press. 2nd ed.
Bénassy-Quéré A., Coupet M. and Mayer T., 2007. Institutional Determinants of Foreign Direct
Investment. World Economy 30(5), 764-782.
Boddewyn J. J. and Brewer T. L., 1994. International-Business Political Behaviour. New Theoretical
Directions. Academic of Management Review 19(1), 119-143.
Buckley P. J., Clegg L. J., Cross A. R., Liu X., Voss H. and Zheng P., 2007. The determinants of
Chinese outward foreign direct investment. Journal of International Business Studies 38(4), 499-518.
Buckley P. J., Clegg L. J., Voss H., Cross A. R., Liu X. and Zheng P., 2018. A retrospective and
agenda for future research on Chinese outward foreign direct investment. Journal of International
Business Studies 49, 4-23.
Cameron A.C. and Trivedi P.K., 1998. Regression analysis of count data. Econometric Society
Monographs No. 30, Cambridge University Press.
Child J. and Rodrigues S.B., 2005. The internationalization of Chinese firms: A case for theoretical
extension? Management and Organization Review 1(3), 381-410.
Claessens S. and Feijen E., 2007. Financial sector development and the millennium development
goals. World Bank Working Paper No.89, The World Bank.
Cuervo-Cazurra A., Inkpen A., Musacchio A. and Ramaswamy K., 2014. Governments as owners:
State-owned multinational companies. Journal of International Business Studies 45, 919-942.
Duanmu J., 2014. A race to lower standards? Labor standards and location choice of outward FDI
from the BRIC countries. International Business Review 23(3), 620-634.
Ederington J., Levinson A. and Minier J., 2005. Footloose and pollution-free. The Review of
Economics and Statistics 87(1), 92–99.
Farole T. and Winkler D., 2014. Making Foreign Direct Investment Work for Sub-Saharan Africa,
Local Spillovers and Competitiveness in Global Value Chains, Washington, DC: World Bank.
Geng Y. and Doberstein B., 2008. Greening government procurement in developing countries:
Building capacity in China. Journal of Environmental Management 88(4), 932-938.
Giuliani E., 2008. Multinational corporations and patterns of local knowledge transfer in Costa Rican
high-tech industries. Development and Change 39(3), 385-407.
Giuliani E., Gorgoni S., Günther C. and Rabellotti R., 2014. Emerging versus advanced country
MNEs investing in Europe: A typology of subsidiary global-local connections. International Business
Review 23(4), 680-691.
Guariglia A. and Poncet S., 2008. Could financial distortions be no impediment to economic growth
after all? Evidence from China. Journal of Comparative Economics, 36(4), 633-657.
Han J., Chi X. and Li K., 2014. China’s ODI motivations, political risk, institutional distance and
location choice. Theoretical Economics Letters 4, 540-547.
Hausman J.A., Hall B.H and Griliches Z., 1984. Econometric models for count data with an
application to the patents–R & D relationship. Econometrica 52, 909-938.
Hilber C. A. L. and Voicu I., 2010. Agglomeration economies and the location of foreign direct
investment: empirical evidence from Romania. Regional Studies 44(3), 355-371.
Huang Y., 2003. Selling China. Cambridge University Press.
Iammarino S. and McCann P., 2013. Multinationals and Economic Geography. Location, Technology
and Innovation. Edward Elgar.
Kang Y. and Jiang F., 2012. FDI location choice of Chinese multinationals in East and Southeast
Asia: Traditional economic factors and institutional perspective. Journal of World Business 47, 45-53.
Kellenberg D.K., 2009. An empirical investigation of the pollution haven effect with strategic
environment and trade policy. Journal of International Economics 78(2), 242-55.
Kolk A. and van Tulder R., 2010. International business, corporate social responsibility and
sustainable development. International Business Review 19, 119–125. Kolstad I. and Wiig A., 2011. Better the devil you know? Chinese foreign direct investment in Africa.
Journal of African Business 12 (1), 31-50. Kolstad I. and Wiig A., 2012. What determines Chinese outward FDI? Journal of World Business 47,
26-34.
Konings J. and Murphy A. P., 2006. Do Multinational Enterprises Relocate Employment to Low-
Wage Regions? Evidence from European Multinationals. Review of World Economics 142(2), 267-
286.
Konisky D.M., 2007. Regulatory competition and environmental enforcement: Is there a race to the
bottom? American Journal of Political Science 51(4), 853-872.
Kostova T. and Zaheer S., 1999. Organizational legitimacy under conditions of complexity: The case
of the multinational enterprise. Academy of Management Review 24(1), 64-81.
Li J., Newenham-Kahindi A., Shapiro D and Chen V., 2013. The two tier bargaining model revisited:
Theory and evidence from China’s natural resource investment in Africa. Global Strategy Journal 3,
300-321.
Li D., Huang M., Ren S., Chen X. and Ning L., 2018. Environmental legitimacy, green innovation,
and corporate carbon disclosure: Evidence from CDP China 100. Journal of Business Ethics 150,
1089-1104.
Li J., Meyer K., Zhang H. and Ding Y., 2018. Diplomatic affinity and corporate networks: Bridges to
foreign locations. Journal of International Business Studies 49, 659-683.
Lu Y., Nakicenovic L.N., Visbeck M. and Stevance A., 2015. Five priorities for the UN Sustainable
Development Goals. Nature 520, 432-433.
Luxmore S.R., Hull C.E. and Tang Z., 2018.Institutional determinants of environmental corporate
social responsibility: Are multinationals entities taking advantage of weak environmental enforcement
in lower-income nations? Business and Society Review 123(1), 151-179.
Madsen P. M., 2009. Does corporate investment drive a “race to the bottom” in environmental
protection? A reexamination of the effect of environmental regulation on investment. Academy of
Management Journal 52, 1297-1318.
Meyer K., Ding Y., Li, J. and Zhang H., 2014. Overcoming distrust: How state-owned enterprises
adapt their foreign entries to institutional pressures abroad. Journal of International Business
Studies 45, 1005–1028.
Morck R., Yeung B. and Zhao M., 2008. Perspectives on China's outward foreign direct
investment. Journal of International Business Studies 39, 337-350.
North D. C., 1990. Institutions, institutional change and economic performance. Cambridge:
Cambridge University Press.
Phelps N. A., MacKinnon D., Stone I. and Braidford P., 2003. Embedding the Multinationals?
Institutions and the Development of Overseas Manufacturing Affiliates in Wales and North East
England. Regional Studies 37(1), 27-40.
Pinkse J., and Kolk A. 2012. Multinational enterprises and climate change: Exploring institutional
failures and embeddedness. Journal of International Business Studies 43, 332–341.
Poncet S., Steingress W. and Vandenbussche H., 2010. Financial constraints in China: Firm-level
evidence. China Economic Review 21(3), 411-422.
Qerimi Q. and Sergi B. S., 2012. The effects of economic freedom on institutional performance in the
Western Balkans countries. International Journal of Business Governance and Ethics 7, 18–36.
Quer D., Claver E., and Rienda L., 2012. Political risk, cultural distance, and outward foreign direct
investment: Empirical evidence from large Chinese firms. Asia Pacific Journal of Management,
29(4), 1089-1104.
Quer D., Claver E. and Rienda L., 2018. The influence of political risk, inertia and imitative behavior
on the location choice of Chinese multinational enterprises: Does state ownership matter?
International Journal of Emerging Markets 13(3), 518-535.
Ramamurti R. (2012). Commentaries What Is Really Different About Emerging. Global Strategy
Journal, 47, 41–47. https://doi.org/10.1111/j.2042-5805.2011.01025.x
Ramasamy B., Yeung M. and Laforet S., 2012. China’s outward foreign direct investment: Location
choice and firm ownership. Journal of World Business 47, 17-25.
Sarvajayakesavalu S., 2015. Addressing challenges of developing countries in implementing five
priorities for sustainable development goals. Ecosystem Health and Sustainability 1(7), 1-4.
Scott W. R., 1995. Institutions and organizations. Thousand Oaks, CA: Sage.
Tadesse S., 2005. Financial development and technology. William Davidson Institute Working Paper
No. 749.
Tan-Mullins May and Mohan G., 2013. The potential of corporate environmental responsibility of
Chinese state-owned enterprises in Africa. Environment, Development and Sustainability 15(2), 265-
284.
Tamazian A., Chousa J. and Vadlamannati K., 2009. Does higher economic and financial
development lead to environmental degradation: Evidence from BRIC countries. Energy Policy 37(1),
246-253.
Ulph A. and Valentini L., 2001. Is environmental dumping greater when plants are footloose?
Scandinavian Journal of Economics 103(4), 673-688.
Van Beveren I., 2007. Footloose multinationals in Belgium? Review of World Economics 143(3), 483-
507.
Voget J., 2011. Relocation of headquarters and international taxation. Journal of Public Economics
95, 1067-1081.
Voss H., Buckley P. J., and Cross A. R., 2010. The impact of home country institutional effects on the
internationalization strategy of Chinese firms. Multinational Business Review 18(3), 25-48.
Wang L., 2010. The changes of China’s environmental policies in the latest 30 years. Procedia
Environmental Sciences 2, 1206-1212.
Wang F. and Elliot E., 2014. China in Africa: presence, perceptions and prospects. Journal of
Contemporary China 23(90), 1012-1032.
Watmough G., Atkinson P., Saikia A. and Hutton C., 2016. Understanding the Evidence Base for
Poverty–Environment Relationships using Remotely Sensed Satellite Data: An Example from Assam,
India. World Development 78, 188-203.
Wendling Z. A., Emerson J. W., Esty D. C., Levy M. A., de Sherbinin A. et al., 2018. 2018
Environmental Performance Index. New Haven, CT: Yale Center for Environmental Law & Policy.
Windmeijer F. and Santos Silva J.M.C., 1997. Endogeneity in count data models: An application to
demand for health care. Journal of Applied Econometrics 12, 281-294.
Wooldridge J.M., 1999. Distribution-free estimation of some nonlinear panel data models. Journal of
Econometrics 90, 77-97.
Wooldridge J.M., 2010. Econometric Analysis of Cross Section and Panel Data. 2nd ed. Cambridge,
MA: MIT Press.
World Bank, 2017. Global Value Chain Development Report: Measuring and Analyzing the Impact of
GVCs on Economic Development, Washington, DC: The World Bank.
Wu H., Guo H., Zhang B. and Bu M., 2017. Westward movement of new polluting firms in China:
Pollution reduction mandates and location choice. Journal of Comparative Economics 45, 119-138.
Xing Y. and Kolstad C.D., 2002. Do lax environmental regulations attract foreign investment?
Environmental and Resource Economics. 21(1), 1-22.
Yiu D., Lau C. and Bruton G., 2007. International venturing by emerging economy firms: The effects
of firm capabilities, home country networks and corporate entrepreneurship. Journal of International
Business Studies 38, 519-540.
TABLES
Table 1: Global distribution of Chinese manufacturing subsidiaries
Region # of subsidiaries %
East Asia & Pacific 1172 18.1
Europe 3595 55.3
Central Asia 131 2.0
Latin America & Caribbean 261 4.0
Middle East & North Africa 33 0.5
North America 1142 17.6
South Asia 98 1.5
Sub-Saharan Africa 62 1.0
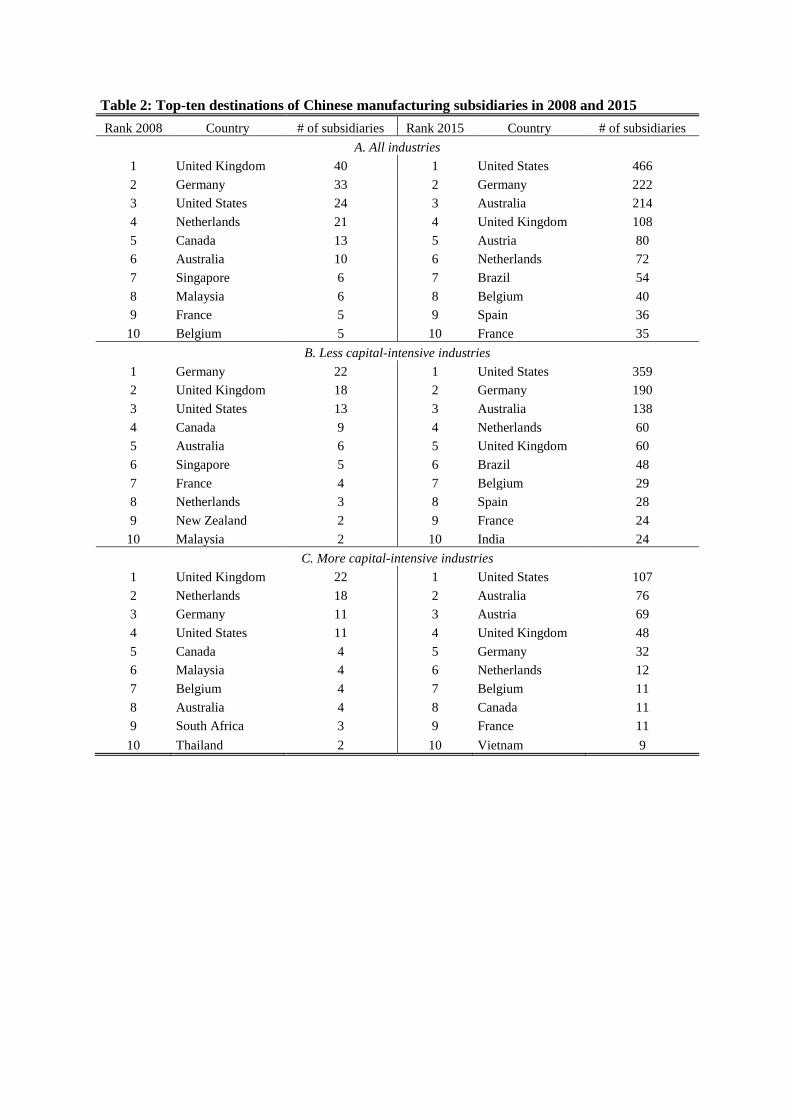
Table 2: Top-ten destinations of Chinese manufacturing subsidiaries in 2008 and 2015
Rank 2008 Country # of subsidiaries Rank 2015 Country # of subsidiaries
A. All industries
1 United Kingdom 40 1 United States 466
2 Germany 33 2 Germany 222
3 United States 24 3 Australia 214
4 Netherlands 21 4 United Kingdom 108
5 Canada 13 5 Austria 80
6 Australia 10 6 Netherlands 72
7 Singapore 6 7 Brazil 54
8 Malaysia 6 8 Belgium 40
9 France 5 9 Spain 36
10 Belgium 5 10 France 35
B. Less capital-intensive industries
1 Germany 22 1 United States 359
2 United Kingdom 18 2 Germany 190
3 United States 13 3 Australia 138
4 Canada 9 4 Netherlands 60
5 Australia 6 5 United Kingdom 60
6 Singapore 5 6 Brazil 48
7 France 4 7 Belgium 29
8 Netherlands 3 8 Spain 28
9 New Zealand 2 9 France 24
10 Malaysia 2 10 India 24
C. More capital-intensive industries
1 United Kingdom 22 1 United States 107
2 Netherlands 18 2 Australia 76
3 Germany 11 3 Austria 69
4 United States 11 4 United Kingdom 48
5 Canada 4 5 Germany 32
6 Malaysia 4 6 Netherlands 12
7 Belgium 4 7 Belgium 11
8 Australia 4 8 Canada 11
9 South Africa 3 9 France 11
10 Thailand 2 10 Vietnam 9
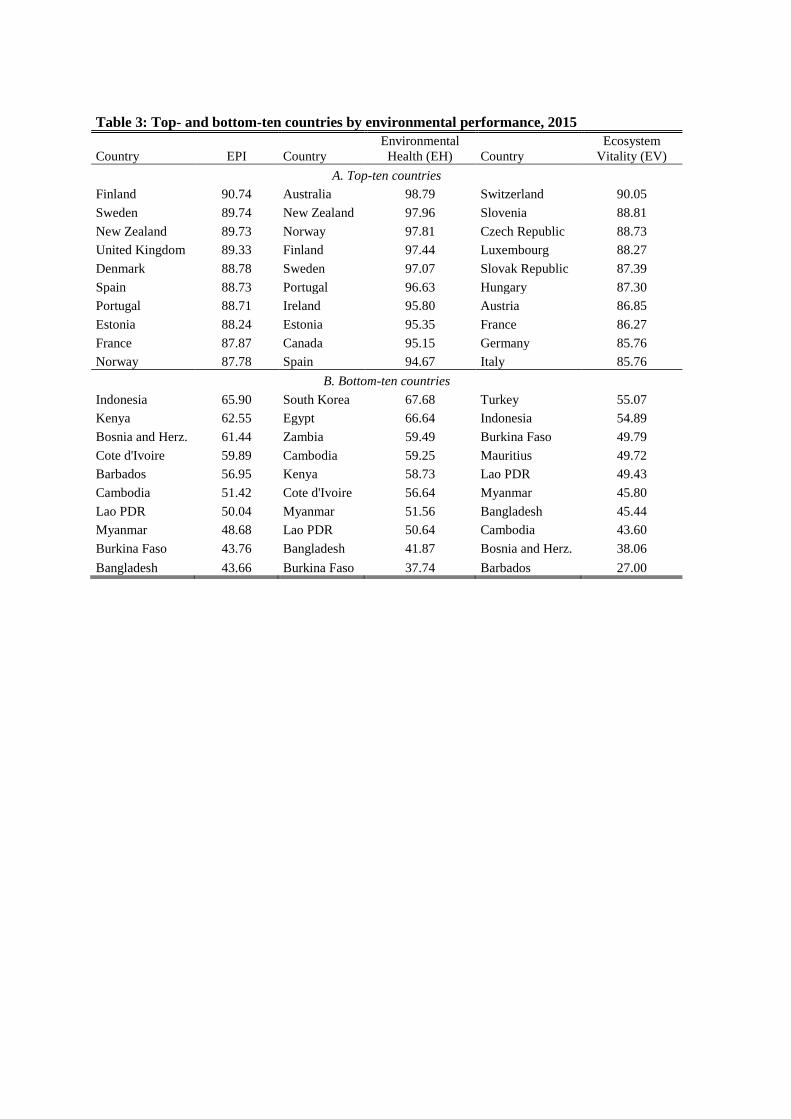
Table 3: Top- and bottom-ten countries by environmental performance, 2015
Country EPI Country
Environmental
Health (EH) Country
Ecosystem
Vitality (EV)
A. Top-ten countries
Finland 90.74 Australia 98.79 Switzerland 90.05
Sweden 89.74 New Zealand 97.96 Slovenia 88.81
New Zealand 89.73 Norway 97.81 Czech Republic 88.73
United Kingdom 89.33 Finland 97.44 Luxembourg 88.27
Denmark 88.78 Sweden 97.07 Slovak Republic 87.39
Spain 88.73 Portugal 96.63 Hungary 87.30
Portugal 88.71 Ireland 95.80 Austria 86.85
Estonia 88.24 Estonia 95.35 France 86.27
France 87.87 Canada 95.15 Germany 85.76
Norway 87.78 Spain 94.67 Italy 85.76
B. Bottom-ten countries
Indonesia 65.90 South Korea 67.68 Turkey 55.07
Kenya 62.55 Egypt 66.64 Indonesia 54.89
Bosnia and Herz. 61.44 Zambia 59.49 Burkina Faso 49.79
Cote d'Ivoire 59.89 Cambodia 59.25 Mauritius 49.72
Barbados 56.95 Kenya 58.73 Lao PDR 49.43
Cambodia 51.42 Cote d'Ivoire 56.64 Myanmar 45.80
Lao PDR 50.04 Myanmar 51.56 Bangladesh 45.44
Myanmar 48.68 Lao PDR 50.64 Cambodia 43.60
Burkina Faso 43.76 Bangladesh 41.87 Bosnia and Herz. 38.06
Bangladesh 43.66 Burkina Faso 37.74 Barbados 27.00
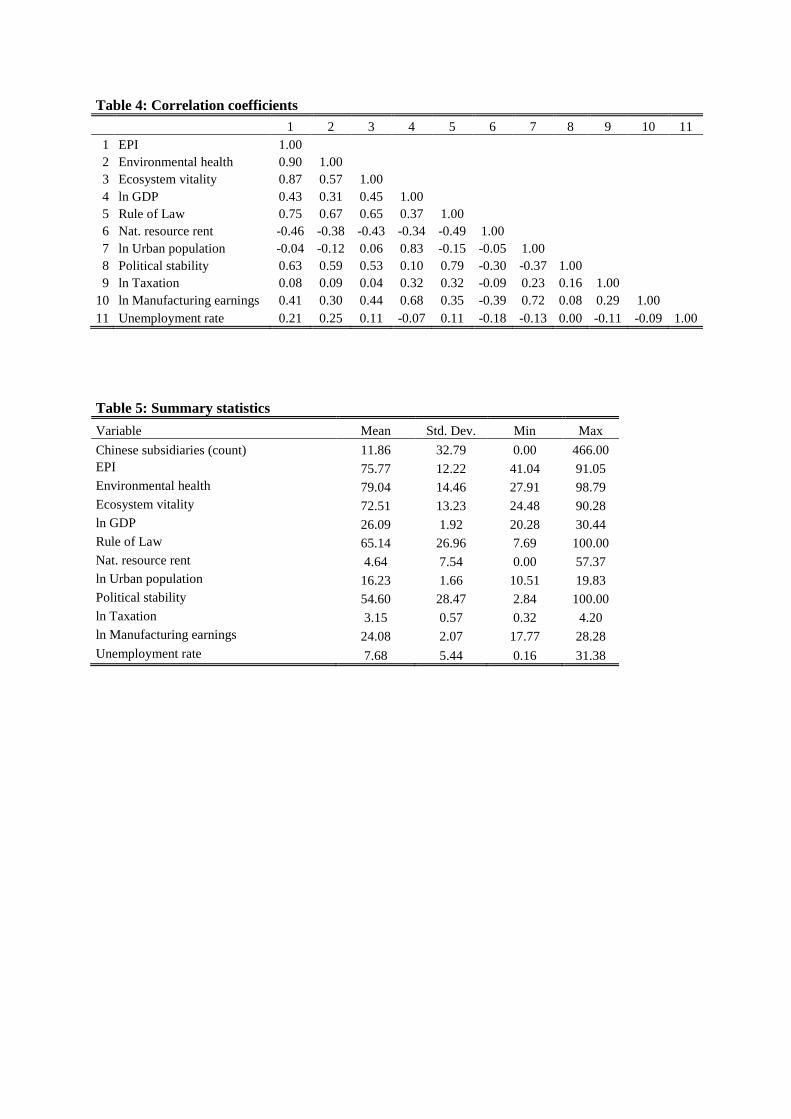
Table 4: Correlation coefficients
1 2 3 4 5 6 7 8 9 10 11
1 EPI 1.00
2 Environmental health 0.90 1.00
3 Ecosystem vitality 0.87 0.57 1.00
4 ln GDP 0.43 0.31 0.45 1.00
5 Rule of Law 0.75 0.67 0.65 0.37 1.00
6 Nat. resource rent -0.46 -0.38 -0.43 -0.34 -0.49 1.00
7 ln Urban population -0.04 -0.12 0.06 0.83 -0.15 -0.05 1.00
8 Political stability 0.63 0.59 0.53 0.10 0.79 -0.30 -0.37 1.00
9 ln Taxation 0.08 0.09 0.04 0.32 0.32 -0.09 0.23 0.16 1.00
10 ln Manufacturing earnings 0.41 0.30 0.44 0.68 0.35 -0.39 0.72 0.08 0.29 1.00
11 Unemployment rate 0.21 0.25 0.11 -0.07 0.11 -0.18 -0.13 0.00 -0.11 -0.09 1.00
Table 5: Summary statistics
Variable Mean Std. Dev. Min Max
Chinese subsidiaries (count) 11.86 32.79 0.00 466.00
EPI 75.77 12.22 41.04 91.05
Environmental health 79.04 14.46 27.91 98.79
Ecosystem vitality 72.51 13.23 24.48 90.28
ln GDP 26.09 1.92 20.28 30.44
Rule of Law 65.14 26.96 7.69 100.00
Nat. resource rent 4.64 7.54 0.00 57.37
ln Urban population 16.23 1.66 10.51 19.83
Political stability 54.60 28.47 2.84 100.00
ln Taxation 3.15 0.57 0.32 4.20
ln Manufacturing earnings 24.08 2.07 17.77 28.28
Unemployment rate 7.68 5.44 0.16 31.38
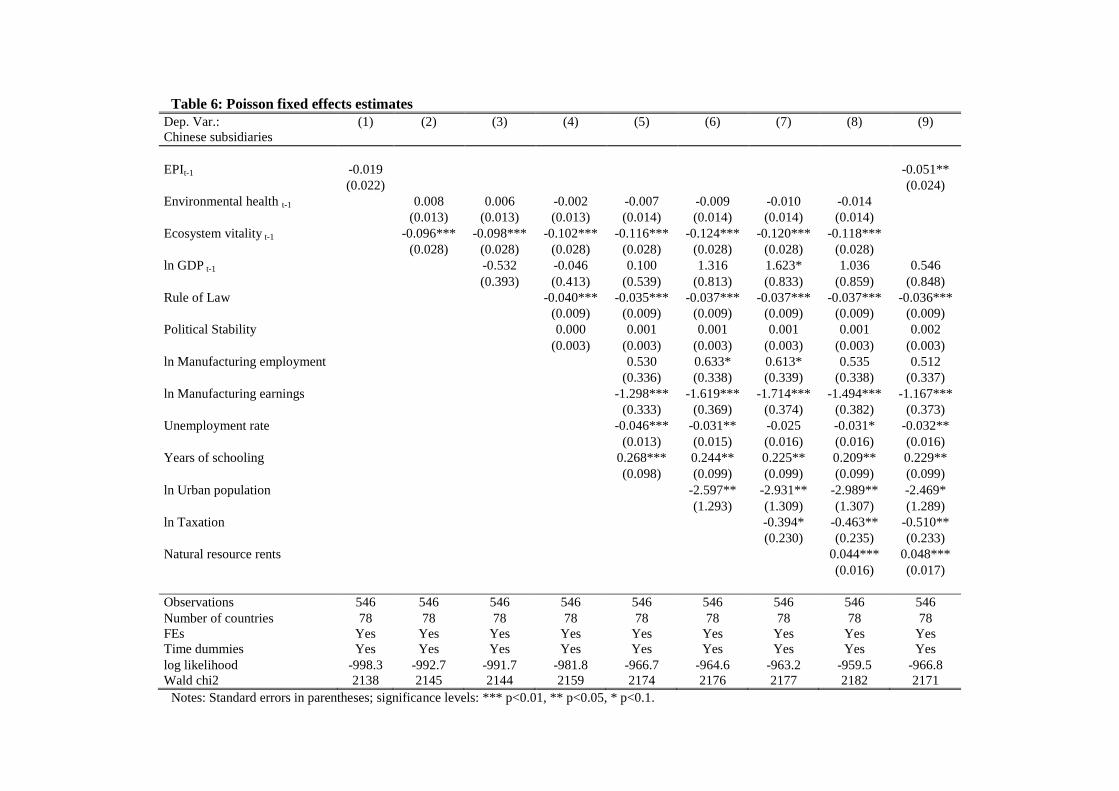
Table 6: Poisson fixed effects estimates
Dep. Var.: (1) (2) (3) (4) (5) (6) (7) (8) (9)
Chinese subsidiaries
EPIt-1 -0.019 -0.051**
(0.022) (0.024)
Environmental health t-1 0.008 0.006 -0.002 -0.007 -0.009 -0.010 -0.014
(0.013) (0.013) (0.013) (0.014) (0.014) (0.014) (0.014)
Ecosystem vitality t-1 -0.096*** -0.098*** -0.102*** -0.116*** -0.124*** -0.120*** -0.118***
(0.028) (0.028) (0.028) (0.028) (0.028) (0.028) (0.028)
ln GDP t-1 -0.532 -0.046 0.100 1.316 1.623* 1.036 0.546
(0.393) (0.413) (0.539) (0.813) (0.833) (0.859) (0.848)
Rule of Law -0.040*** -0.035*** -0.037*** -0.037*** -0.037*** -0.036***
(0.009) (0.009) (0.009) (0.009) (0.009) (0.009)
Political Stability 0.000 0.001 0.001 0.001 0.001 0.002
(0.003) (0.003) (0.003) (0.003) (0.003) (0.003)
ln Manufacturing employment 0.530 0.633* 0.613* 0.535 0.512
(0.336) (0.338) (0.339) (0.338) (0.337)
ln Manufacturing earnings -1.298*** -1.619*** -1.714*** -1.494*** -1.167***
(0.333) (0.369) (0.374) (0.382) (0.373)
Unemployment rate -0.046*** -0.031** -0.025 -0.031* -0.032**
(0.013) (0.015) (0.016) (0.016) (0.016)
Years of schooling 0.268*** 0.244** 0.225** 0.209** 0.229**
(0.098) (0.099) (0.099) (0.099) (0.099)
ln Urban population -2.597** -2.931** -2.989** -2.469*
(1.293) (1.309) (1.307) (1.289)
ln Taxation -0.394* -0.463** -0.510**
(0.230) (0.235) (0.233)
Natural resource rents 0.044*** 0.048***
(0.016) (0.017)
Observations 546 546 546 546 546 546 546 546 546
Number of countries 78 78 78 78 78 78 78 78 78
FEs Yes Yes Yes Yes Yes Yes Yes Yes Yes
Time dummies Yes Yes Yes Yes Yes Yes Yes Yes Yes
log likelihood -998.3 -992.7 -991.7 -981.8 -966.7 -964.6 -963.2 -959.5 -966.8
Wald chi2 2138 2145 2144 2159 2174 2176 2177 2182 2171
Notes: Standard errors in parentheses; significance levels: *** p<0.01, ** p<0.05, * p<0.1.
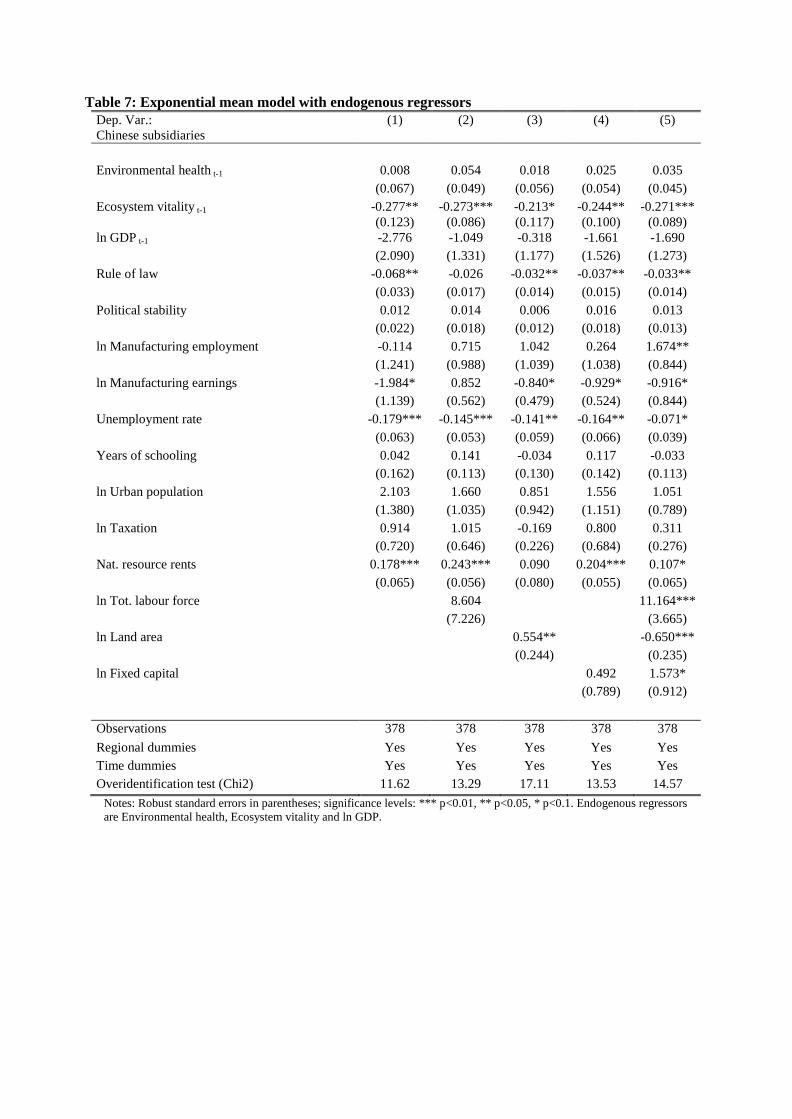
Table 7: Exponential mean model with endogenous regressors
Dep. Var.:
Chinese subsidiaries
(1) (2) (3) (4) (5)
Environmental health t-1 0.008 0.054 0.018 0.025 0.035
(0.067) (0.049) (0.056) (0.054) (0.045)
Ecosystem vitality t-1 -0.277** -0.273*** -0.213* -0.244** -0.271***
(0.123) (0.086) (0.117) (0.100) (0.089)
ln GDP t-1 -2.776 -1.049 -0.318 -1.661 -1.690
(2.090) (1.331) (1.177) (1.526) (1.273)
Rule of law -0.068** -0.026 -0.032** -0.037** -0.033**
(0.033) (0.017) (0.014) (0.015) (0.014)
Political stability 0.012 0.014 0.006 0.016 0.013
(0.022) (0.018) (0.012) (0.018) (0.013)
ln Manufacturing employment -0.114 0.715 1.042 0.264 1.674**
(1.241) (0.988) (1.039) (1.038) (0.844)
ln Manufacturing earnings -1.984* 0.852 -0.840* -0.929* -0.916*
(1.139) (0.562) (0.479) (0.524) (0.844)
Unemployment rate -0.179*** -0.145*** -0.141** -0.164** -0.071*
(0.063) (0.053) (0.059) (0.066) (0.039)
Years of schooling 0.042 0.141 -0.034 0.117 -0.033
(0.162) (0.113) (0.130) (0.142) (0.113)
ln Urban population 2.103 1.660 0.851 1.556 1.051
(1.380) (1.035) (0.942) (1.151) (0.789)
ln Taxation 0.914 1.015 -0.169 0.800 0.311
(0.720) (0.646) (0.226) (0.684) (0.276)
Nat. resource rents 0.178*** 0.243*** 0.090 0.204*** 0.107*
(0.065) (0.056) (0.080) (0.055) (0.065)
ln Tot. labour force 8.604 11.164***
(7.226) (3.665)
ln Land area 0.554** -0.650***
(0.244) (0.235)
ln Fixed capital 0.492 1.573*
(0.789) (0.912)
Observations 378 378 378 378 378
Regional dummies Yes Yes Yes Yes Yes
Time dummies Yes Yes Yes Yes Yes
Overidentification test (Chi2) 11.62 13.29 17.11 13.53 14.57
Notes: Robust standard errors in parentheses; significance levels: *** p<0.01, ** p<0.05, * p<0.1. Endogenous regressors
are Environmental health, Ecosystem vitality and ln GDP.

32
Table 8: Host countries’ heterogeneity
Dep. Var.: (1) (2) (3) (4)
Chinese subsidiaries High Income
Economies
Medium and Low
Income Economies
Strong
Rule of Law
Weak
Rule of Law
Environmental health t-1 -0.018 -0.019 -0.029 -0.043**
(0.018) (0.032) (0.019) (0.022)
Ecosystem vitality t-1 -0.042 -0.142** -0.068* -0.091**
(0.036) (0.068) (0.040) (0.036)
ln GDP t-1 2.535** 1.586 2.350 3.019
(1.290) (1.554) (1.468) (2.026)
Rule of Law 0.015*** -0.028*** -0.058*** -0.094***
(0.004) (0.009) (0.015) (0.028)
Political Stability 0.025* -0.001 0.005 0.008
(0.015) (0.015) (0.006) (0.006)
ln Manufacturing employment 0.064 1.422*** 1.103*** 1.891***
(0.757) (0.441) (0.405) (0.504)
ln Manufacturing earnings 0.064 -1.215** -1.572*** -1.013
(0.787) (0.540) (0.496) (0.622)
Unemployment rate 0.018 0.010 -0.031 -0.020
(0.022) (0.054) (0.029) (0.036)
Years of schooling 0.113 0.899*** -0.098 -0.179
(0.121) (0.250) (0.150) (0.180)
ln Urban population -4.881*** -4.475* -4.789** -2.875
(1.894) (2.343) (2.296) (2.918)
ln Taxation -1.007** 0.282 -0.794*** -1.894***
(0.399) (0.329) (0.301) (0.532)
Natural resource rents 0.021 0.178*** 0.098*** 0.175***
(0.021) (0.032) (0.023) (0.037)
Observations 267 279 273 273
FEs Yes Yes Yes Yes
Time dummies Yes Yes Yes Yes
log likelihood -622.5 -287.1 -555.6 -385.4
Wald chi2 2009 228.7 1862 1835
Notes: Standard errors in parentheses; significance levels: *** p<0.01, ** p<0.05, * p<0.1.
33
Table 9: Subsidiaries’ heterogeneity
Dep. Var.: (1) (2) (3) (4)
Chinese subsidiaries
High capital
intensity
Low capital
intensity
State-owned
enterprises
Private
companies
Environmental health t-1 0.017 -0.048 0.268 -0.016
(0.017) (0.047) (0.418) (0.014)
Ecosystem vitality t-1 -0.125*** -0.079*** 1.211 -0.116***
(0.038) (0.026) (1.270) (0.028)
ln GDP t-1 1.748 1.221 71.512** 0.845
(1.200) (1.274) (30.656) (0.862)
Rule of Law -0.035*** -0.039** 0.272 -0.039***
(0.012) (0.016) (0.191) (0.009)
Political Stability 0.008* -0.008 -0.189** 0.001
(0.004) (0.006) (0.079) (0.003)
ln Manufacturing employment 0.452 0.856 -1.518 0.580*
(0.427) (0.601) (9.041) (0.338)
ln Manufacturing earnings -2.054*** -0.845 -23.911* -1.428***
(0.523) (0.568) (12.799) (0.383)
Unemployment rate -0.027 -0.020 0.302 -0.032**
(0.021) (0.026) (0.609) (0.016)
Years of schooling 0.074 0.445** -1.478 0.209**
(0.122) (0.174) (1.716) (0.099)
ln Urban population -2.437 -4.860** -84.853 -2.790**
(1.772) (2.070) (57.190) (1.308)
ln Taxation 0.349 -0.716* -0.255 -0.468**
(0.303) (0.382) (8.409) (0.236)
Natural resource rents 0.046* -0.031 -0.043 0.041**
(0.025) (0.023) (0.311) (0.016)
Observations 462 399 77 546
FE Yes Yes Yes Yes
Time dummies Yes Yes Yes Yes
log likelihood -756.9 -566.8 -20.07 -956.2
Wald chi2 1664 547.7 24.17 2155
Notes: Standard errors in parentheses; significance levels: *** p<0.01, ** p<0.05, * p<0.1.
34
APPENDIX
Table A: Variables description
Variable Description Source
Chinese subsidiaries (count) Number of Chinese subsidiaries Bureau van Dijk Historical Orbis
EPI 0-100 Index Columbia University
Environmental health 0-100 Index Columbia University
Ecosystem vitality 0-100 Index Columbia University
ln GDP Log of Gross Domestic Product World Development Indicators
Rule of Law 0-100 Index World Governance Indicators
Nat. resource rent Total resource rent, % GDP World Development Indicators
ln Urban population Log of urban population World Development Indicators
Political stability 0-100 Index World Governance Indicators
ln Taxation Log of average tax rate World Development Indicators
ln Manufacturing earnings Log average earnings in manufacturing World Development Indicators
Education Average years of schooling World Development Indicators
Unemployment rate Unemployment rate World Development Indicators

35
GSSI – GRAN SASSO SCIENCE INSTITUTE
Viale Francesco Crispi, 7 – 67100 L’Aquila, Italy
WWW.GSSI.IT