growth trends and potential for crop and livestock productivity
TRANSCRIPT
Growth trends and potential for crop and livestock productivity
Fantu Bachewe; Guush Berhane; and Bart MintenIFPRI
The Future of Ethiopia’s Agriculture: Towards a Resilient System to End
Hunger and Undernutrition
Addis Ababa HiltonDecember 15, 2017Addis Ababa
1
Presentation plan Overview: role of agriculture in the overall economy
Livestock production and productivity in the last decade
(Fantu)
Crop production, productivity and drivers (Guush)
Looking into the future: Ethiopia’s agriculture in the context
of selected countries
CSA data is used unless otherwise mentioned
3
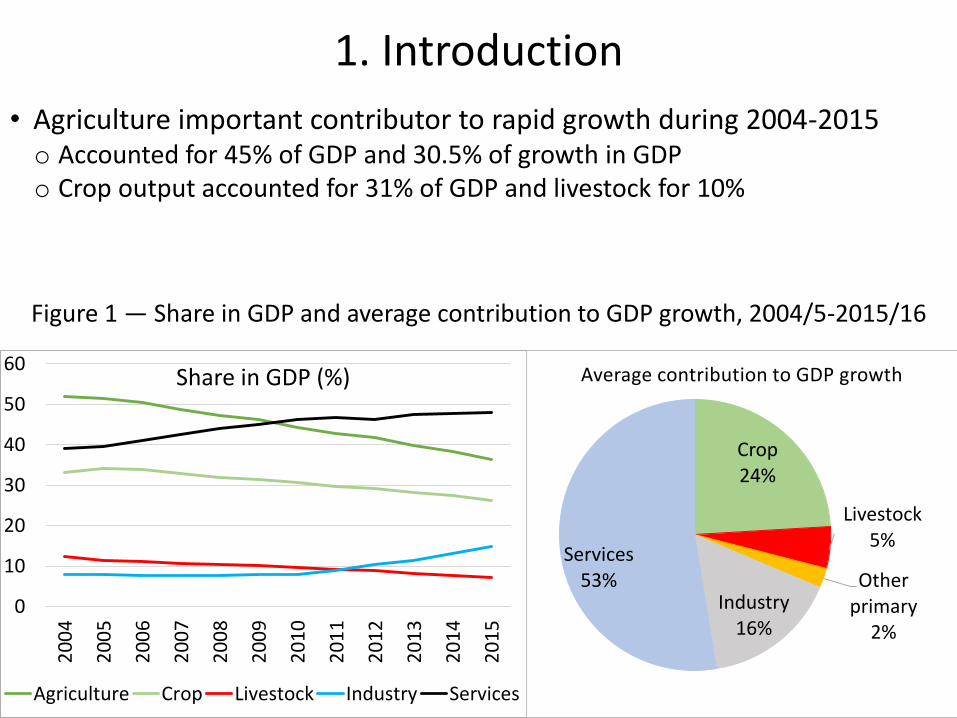
1. Introduction
• Agriculture important contributor to rapid growth during 2004-2015o Accounted for 45% of GDP and 30.5% of growth in GDP o Crop output accounted for 31% of GDP and livestock for 10%
Figure 1 — Share in GDP and average contribution to GDP growth, 2004/5-2015/16
0
10
20
30
40
50
60
20
04
20
05
20
06
20
07
20
08
20
09
20
10
20
11
20
12
20
13
20
14
20
15
Share in GDP (%)
Agriculture Crop Livestock Industry Services
Crop24%
Livestock5%
Other primary
2%
Industry16%
Services53%
Average contribution to GDP growth
ETHIOPIAN DEVELOPMENT RESEARCH INSTITUTE
Trends in livestock production, productivity, and input use in Ethiopia
Presenter: Fantu Bachewe
4
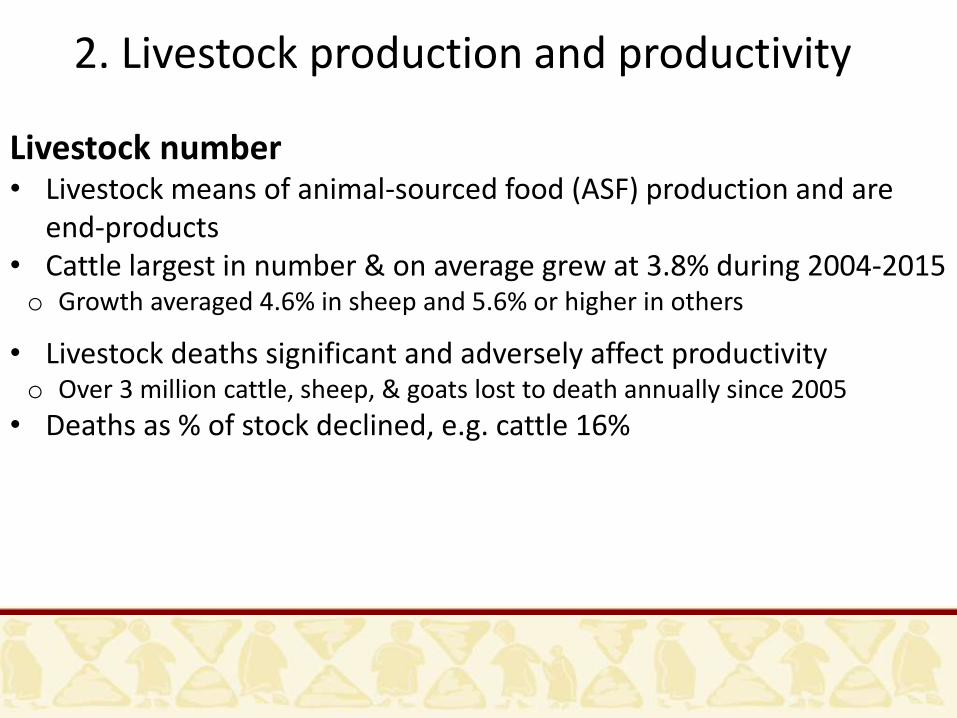
2. Livestock production and productivity
Livestock number• Livestock means of animal-sourced food (ASF) production and are
end-products• Cattle largest in number & on average grew at 3.8% during 2004-2015o Growth averaged 4.6% in sheep and 5.6% or higher in others
• Livestock deaths significant and adversely affect productivityo Over 3 million cattle, sheep, & goats lost to death annually since 2005
• Deaths as % of stock declined, e.g. cattle 16%
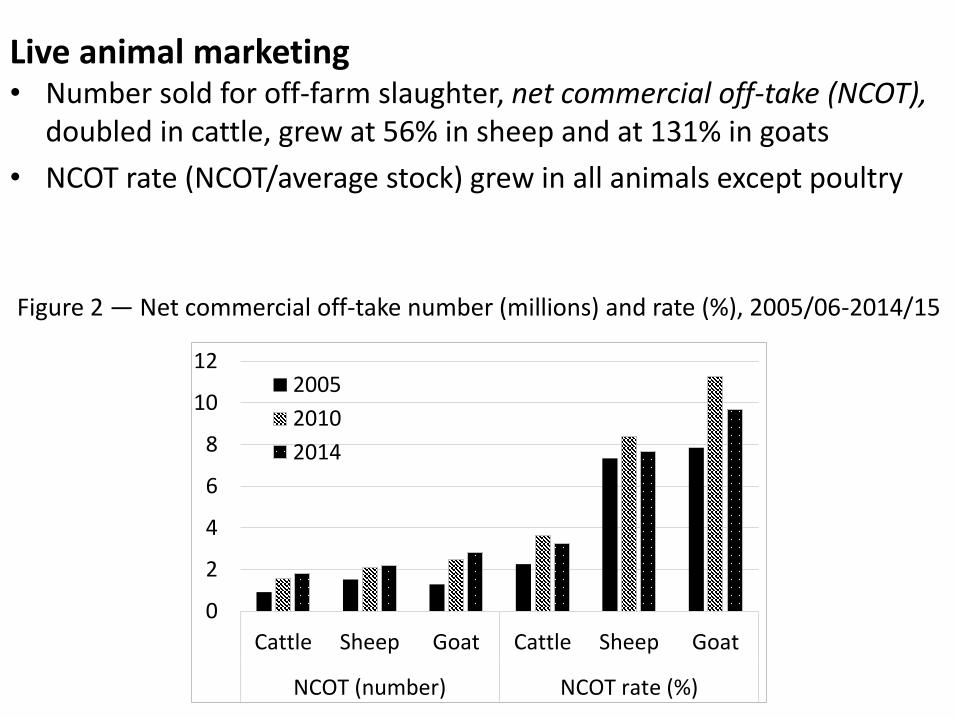
Live animal marketing• Number sold for off-farm slaughter, net commercial off-take (NCOT),
doubled in cattle, grew at 56% in sheep and at 131% in goats
• NCOT rate (NCOT/average stock) grew in all animals except poultry
Figure 2 — Net commercial off-take number (millions) and rate (%), 2005/06-2014/15
0
2
4
6
8
10
12
Cattle Sheep Goat Cattle Sheep Goat
NCOT (number) NCOT rate (%)
2005
2010
2014
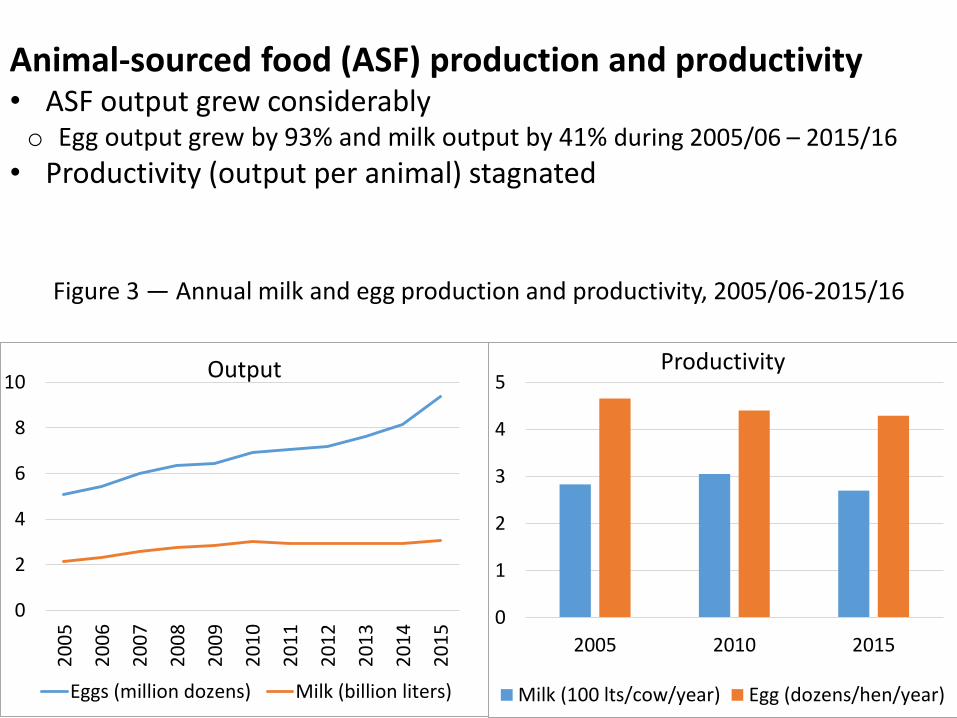
Animal-sourced food (ASF) production and productivity• ASF output grew considerablyo Egg output grew by 93% and milk output by 41% during 2005/06 – 2015/16
• Productivity (output per animal) stagnated
Figure 3 — Annual milk and egg production and productivity, 2005/06-2015/16
0
1
2
3
4
5
2005 2010 2015
Productivity
Milk (100 lts/cow/year) Egg (dozens/hen/year)
0
2
4
6
8
10
20
05
20
06
20
07
20
08
20
09
20
10
20
11
20
12
20
13
20
14
20
15
Output
Eggs (million dozens) Milk (billion liters)
8
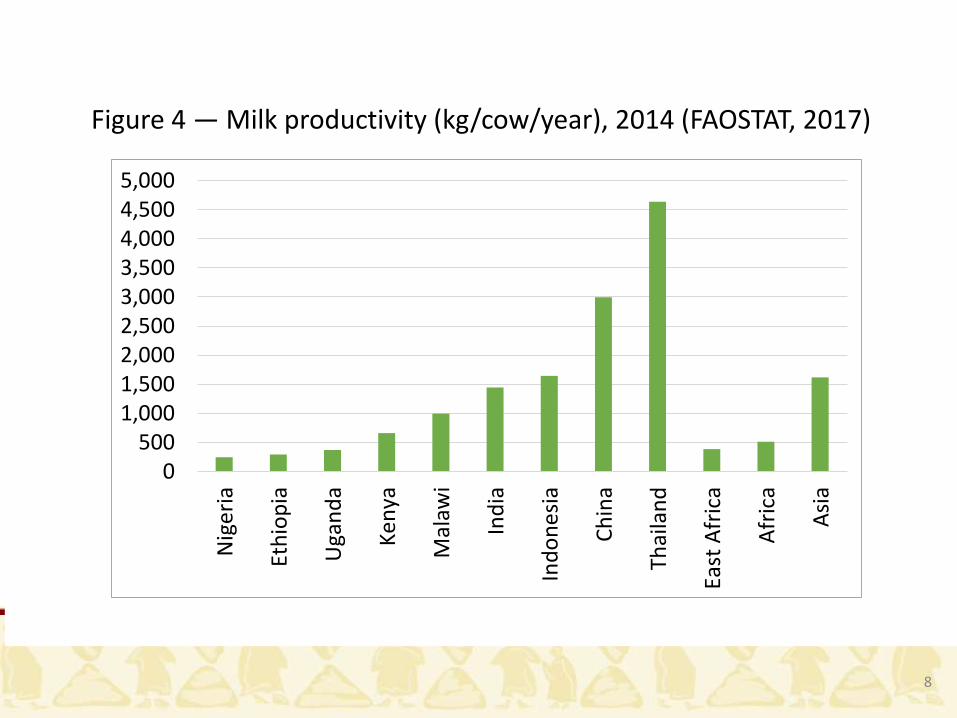
Figure 4 — Milk productivity (kg/cow/year), 2014 (FAOSTAT, 2017)
0500
1,0001,5002,0002,5003,0003,5004,0004,5005,000
Nig
eria
Eth
iop
ia
Uga
nd
a
Ken
ya
Mal
awi
Ind
ia
Ind
on
esia
Ch
ina
Thai
lan
d
East
Afr
ica
Afr
ica
Asi
a
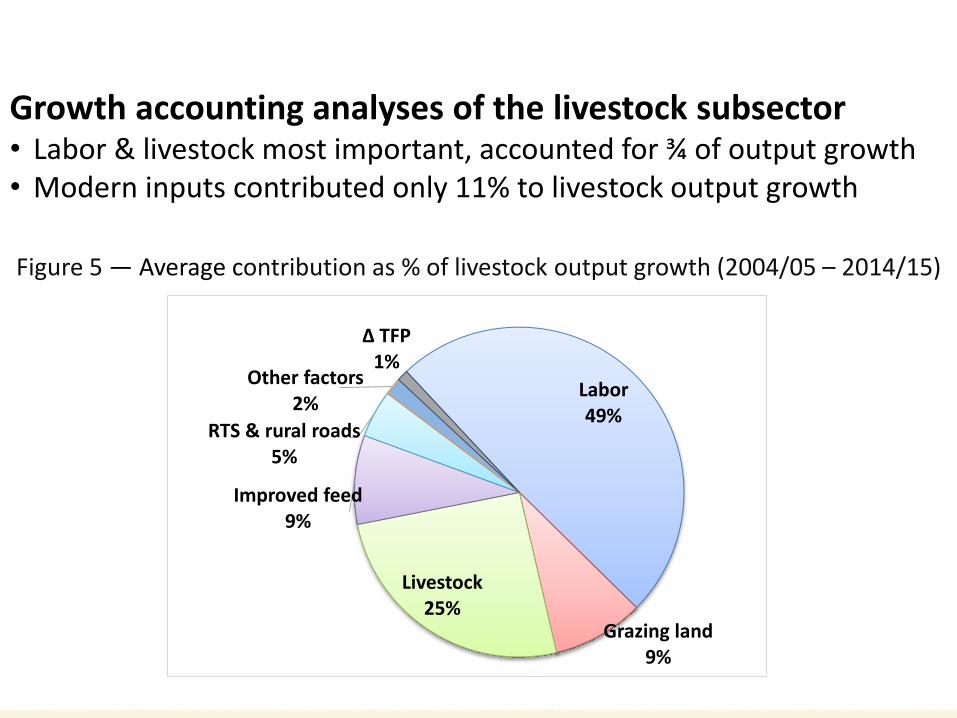
Growth accounting analyses of the livestock subsector• Labor & livestock most important, accounted for ¾ of output growth • Modern inputs contributed only 11% to livestock output growth
Figure 5 — Average contribution as % of livestock output growth (2004/05 – 2014/15)
Labor49%
Grazing land9%
Livestock25%
Improved feed9%
RTS & rural roads5%
Other factors2%
∆ TFP1%
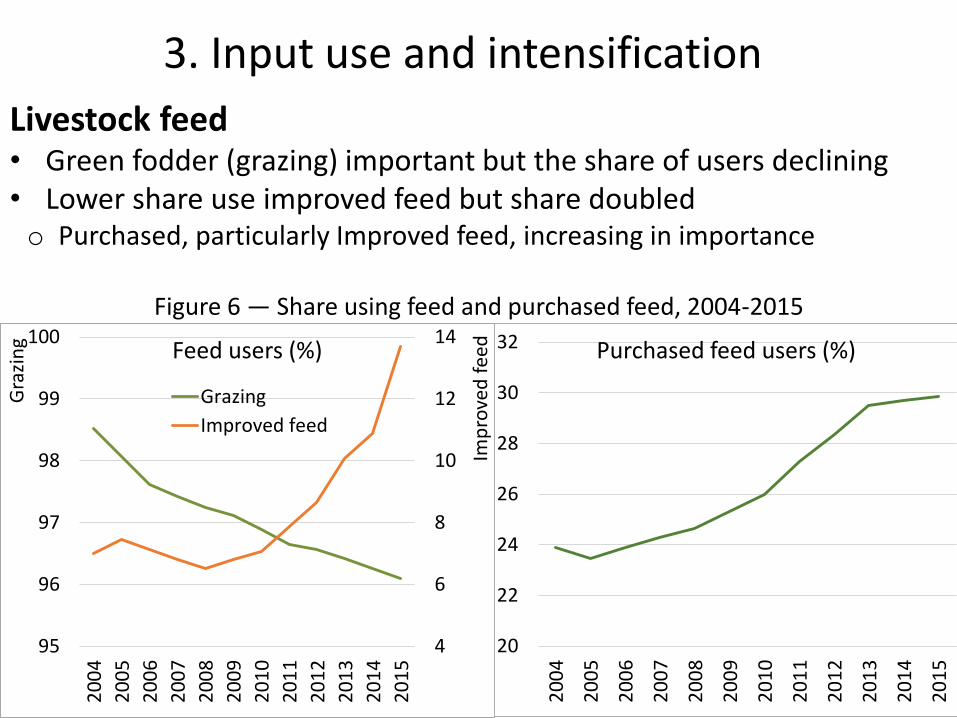
3. Input use and intensification
Livestock feed• Green fodder (grazing) important but the share of users declining• Lower share use improved feed but share doubledo Purchased, particularly Improved feed, increasing in importance
Figure 6 — Share using feed and purchased feed, 2004-2015
4
6
8
10
12
14
95
96
97
98
99
100
20
04
20
05
20
06
20
07
20
08
20
09
20
10
20
11
20
12
20
13
20
14
20
15
Imp
rove
d f
eed
Gra
zin
g Feed users (%)
Grazing
Improved feed
20
22
24
26
28
30
32
20
04
20
05
20
06
20
07
20
08
20
09
20
10
20
11
20
12
20
13
20
14
20
15
Purchased feed users (%)
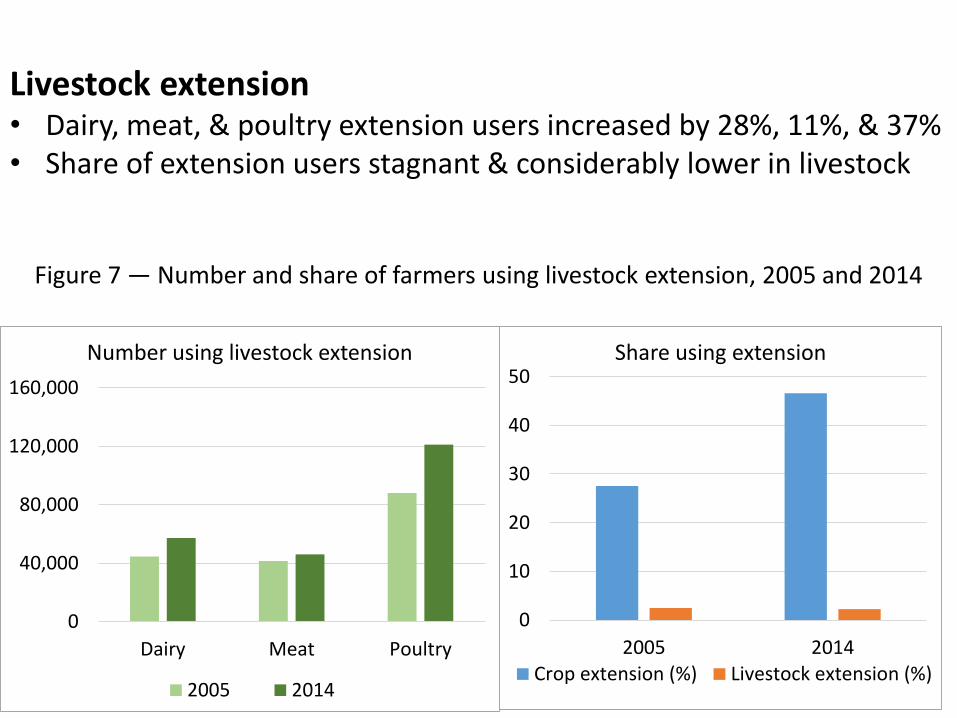
Livestock extension• Dairy, meat, & poultry extension users increased by 28%, 11%, & 37%• Share of extension users stagnant & considerably lower in livestock
Figure 7 — Number and share of farmers using livestock extension, 2005 and 2014
0
40,000
80,000
120,000
160,000
Dairy Meat Poultry
Number using livestock extension
2005 2014
0
10
20
30
40
50
2005 2014
Share using extension
Crop extension (%) Livestock extension (%)
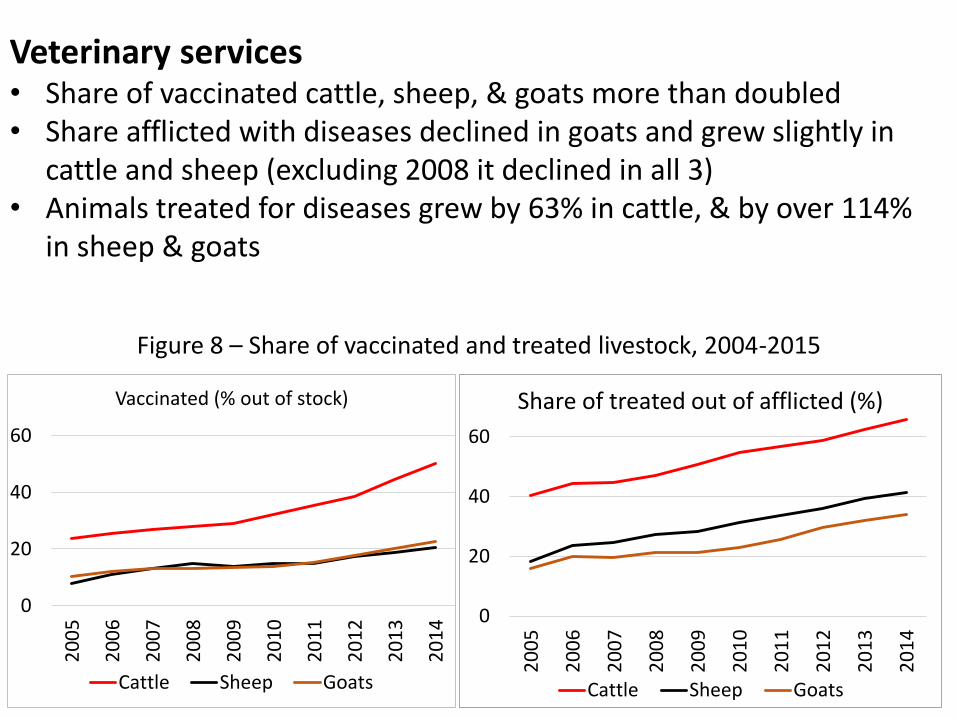
Veterinary services• Share of vaccinated cattle, sheep, & goats more than doubled• Share afflicted with diseases declined in goats and grew slightly in
cattle and sheep (excluding 2008 it declined in all 3)• Animals treated for diseases grew by 63% in cattle, & by over 114%
in sheep & goats
Figure 8 – Share of vaccinated and treated livestock, 2004-2015
0
20
40
60
20
05
20
06
20
07
20
08
20
09
20
10
20
11
20
12
20
13
20
14
Vaccinated (% out of stock)
Cattle Sheep Goats
0
20
40
60
20
05
20
06
20
07
20
08
20
09
20
10
20
11
20
12
20
13
20
14
Share of treated out of afflicted (%)
Cattle Sheep Goats
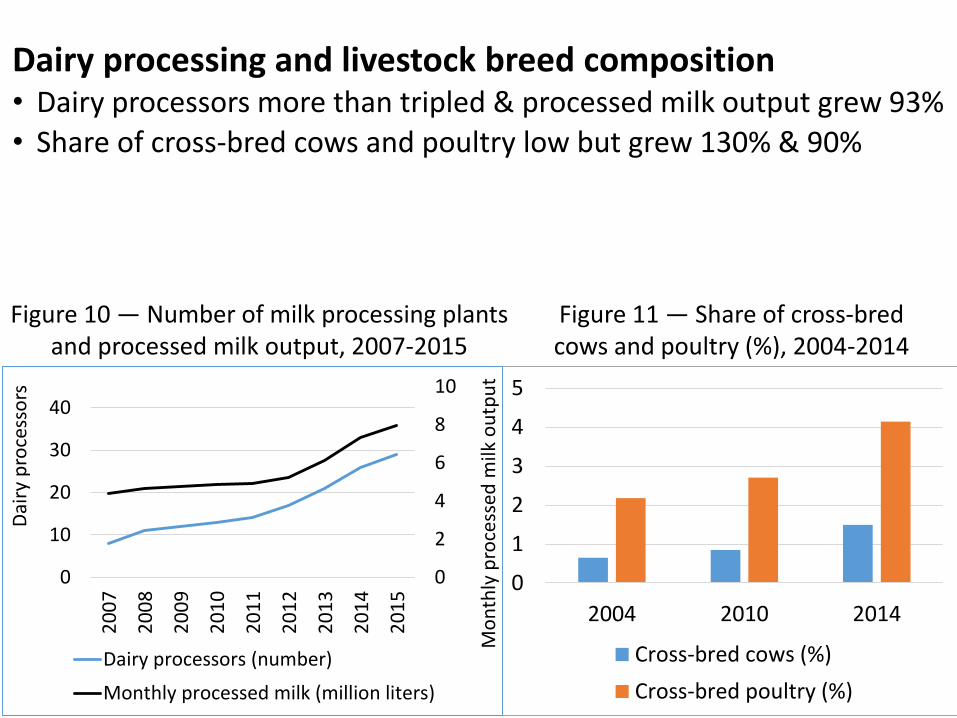
Dairy processing and livestock breed composition• Dairy processors more than tripled & processed milk output grew 93%
• Share of cross-bred cows and poultry low but grew 130% & 90%
Figure 11 — Share of cross-bred cows and poultry (%), 2004-2014
0
1
2
3
4
5
2004 2010 2014
Cross-bred cows (%)
Cross-bred poultry (%)
Figure 10 — Number of milk processing plants and processed milk output, 2007-2015
0
2
4
6
8
10
0
10
20
30
40
20
07
20
08
20
09
20
10
20
11
20
12
20
13
20
14
20
15
Mo
nth
ly p
roce
ssed
milk
ou
tpu
t
Dai
ry p
roce
sso
rs
Dairy processors (number)
Monthly processed milk (million liters)
4. Conclusions
• Livestock contributed little to GDP & importance declined
• Rapid growth in ASF output but productivity stagnant
• Modern inputs contributed little to output growth
• Improved feed & cross-bred livestock low but increasing in importance
• Livestock extension users low and stagnant
• Vaccination and treatment of sick livestock increased considerably while share afflicted with diseases overall declined
• Demand and supply side factors indicate considerable potential
1. Spending on ASF as well as livestock exports grew
o Further increase in spending expected with growth in income
2. Use levels of modern inputs low
3. Large and fast growing animal stocks but predominantly low-yielding breeds