growth process toolkit – new product development
TRANSCRIPT

growth team m e m b e r s h i p™
New Product DevelopmentAccelerating Growth through Unbiased and Rigorous Early-Stage Product Evaluation
growth process toolkit
SAMPLE
The contents of these pages are copyright © Frost & Sullivan. All rights reserved. 1
T A B L E O F C O N T E N T S Introduction...................................................................................................................................................………………..Page 4
How To Use this Toolkit ...................................................................................................................................................... Page 8
Preface: Securing Organizational Alignment………………………...…………………………………….……………….….Page 10
Phase One: Demand Assessment………………………………………..………………………………………………………Page 12
Activity One: Industry Analysis……………………………………………...……………………………………………………….Page 12
Step One: Market Analysis……………………………………………...…………………………………………………..…Page 13 Step Two: Competitor Analysis………………………..…………………………………………………………………..….Page 17 Step Three: Emerging Technologies Analysis……………………....……………………………………………………....Page 18
Activity Two: Customer Analysis……………………………………………...…………………………………………………..…Page 20
Step One: Lead Customer Identification……………………………..………………………………………………………Page 20 Step Two: Customer Needs Analysis………………………………..……………………………………………………….Page 22 Step Three: Customer Needs Prioritization…………………………...……………………………………………………..Page 24
Phase Two: Feasibility Assessment................................................................................................................................Page 28
Activity One: Capability Analysis……………………………………………...……………………………..………………………Page 29
Step One: Internal Resource Audit……………………………………..…………………………………………………….Page 29 Step Two: External Resource Audit……………………………………...…………………………………………………...Page 31
Activity Two: Financial Analysis………………………………………………...…………………………………………………...Page 32
Step One: Development Efficiency Assessment…………….………...………………………………………………........Page 32 Step Two: Profitability Assessment………………………………………………………………………………..………....Page 33 Step Three: Business Case Development…………………………………………………………………………...………Page 35
Activity Three: Organizational Analysis………………………………………………………..………………………..………….Page 37
Step One: Human Capital Analysis………………………………………………………………………………..………….Page 37 Step Two: Performance Analysis…………..…………………………………………...…………………………...………..Page 42
End Notes……………………………………………………………………………………………….…………...…………..…….Page 43
SAM
PLE

The contents of these pages are copyright © Frost & Sullivan. All rights reserved. 2
Frost & Sullivan’s Growth Team Membership would like to thank the following individuals who generously contributed their time and insights to the development of this toolkit:
Katherine Burns Growth Team Membership
Ken Herbert Business & Financial Services
Dan Colquhoun Customer Research
Franck Leveque Automotive & Transportation
Brian Cotton Information and Communications Technologies
Sandeep Maheshwari Economic Research & Analysis
Olivier Cousin Growth Consulting
Sandra Nelson Global Events
John Doherty Technical Insights
Keith O’Brien Growth Team Membership
James Evans Management Information Systems
Leo O’Connor Technical Insights
Cynthia Galvan-Cavazos Growth Team Membership
Joanne Pilger Global Events
Dan Goldenberg Growth Team Membership
Sarwant Singh Growth Consulting
S P E C I A L T H A N K S
SAM
PLE

The contents of these pages are copyright © Frost & Sullivan. All rights reserved. 3
INTRODUCTION Growth through New Product Development Companies looking to increase share of customer wallet, erode competitors’ market share, and boost revenue must incorporate new product (and service) development into their growth strategies. It is for this reason that investment in new product development is considered such a strong predictor of a company’s future value.1 Numerous sources attest to the significance of new product development (or innovation) to companies’ growth strategies, as outlined in part below. • More than 70 percent of senior executives in a recent McKinsey Quarterly survey cited innovation as one of the top three
drivers of growth for their companies in the next 3 to 5 years.2 • A survey of 601 senior executives in the US, UK, Germany, and Canada confirmed that innovation is a top corporate priority.3
• 66 percent of senior executives have also said that their organizations’ business strategy is either totally or largely dependent
on innovation.4 Given this nearly universal focus on a shared growth objective, the quality of new ideas, finely tuned customer understanding, and flawless product development take on critical significance. Put another way, if every company seeks growth through the same channel, the winner will be the one that successfully breaks away by executing better than its competitors.
The Risks of New Product Development Although most companies view new product development as a direct route to accelerated growth, the reality is that most new products fail in commercialization. Indeed, surveys suggest that on average:5 • More than 50 percent of new products launched by a company will fall short of executives’ expectations;
• 1 in 100 new products cover their development costs;
• 1 in 300 products make a significant difference to customer purchase behavior, the product category, or the company’s
growth trajectory It therefore appears that the foundation of many companies’ growth strategies is shaky: ideas with no market, disproportionately high development costs, and unsuccessful product launch seem endemic. Indeed, many executives admit that their new product development processes are often disorganized and unable to deliver expected business results: • 65 percent of senior executives who participated in a recent survey admitted they were only “somewhat”, “a little”, or “not at all”
confident about the decisions they make to stimulate innovation.6
• 19 percent of executives also confess that innovation does not factor into the strategic-planning process (in spite of being an important driver of growth).7
• 15 percent of executives surveyed said that they were “very satisfied” with their company’s ability to convert ideas
into service offerings, and only 13 percent said they can do it repeatedly.8
Put another way, while most companies acknowledge that effective NPD is the key to long-term competitive advantage and growth, most also acknowledge that they lack rigorous, repeatable processes for generating good ideas and converting those good ideas into profit. The Difference between NPD and Innovation One of the most troubling errors companies commit in their quest for new products is that they fail to understand that growth through NPD comes through two distinct but dependent channels: generation of good ideas (i.e., innovation) and commitment to systematic evaluation and development (i.e., NPD). It is important to note this distinction, since innovation and formal new product development processes are both necessary for commercial success.
(Continued on the following page)
SAM
PLE

The contents of these pages are copyright © Frost & Sullivan. All rights reserved. 4
INTRODUCTION (CONTINUED)
The Difference between NPD and Innovation (Continued) The Role of Innovation Frost & Sullivan defines innovation as the generation of breakthrough ideas or knowledge with the potential to address customer needs. Successful product launch and resulting revenues, profit, and growth begins with a moment of inspiration – and executives are right to invest in activities that can help make those moments of inspiration a regular occurrence at their companies. This is why many firms focus so intently on cultivating an innovation culture and stressing the importance of organizational commitment to that culture. That said, the difficulty of achieving such a culture poses a continual stumbling block for companies, as noted below.
• Only 21 percent of respondents in a recent survey said that their companies have a Chief Innovation Executive, and only 11
percent said that there is a C-suite executive in charge of the innovation process.9 • In another survey, 40 percent of senior executives said they do not have the right kinds of talent for the innovation projects they
pursue (interestingly, the employees surveyed defended their capabilities and argued the culture discourages innovation).10
• In the same survey, just 23 percent of employees said they believe their organizations encourage them to learn from failure.11 Put another way, companies battle myriad organizational and cultural barriers to sustainable, process-driven innovation. Assuming that an organization overcomes these barriers and surfaces an idea worthy of further development, the challenges do not disappear; they merely migrate to a different place. The Role of New Product Development Frost & Sullivan defines new product development as a systematic way of transforming promising ideas into products that can be successfully commercialized. No matter how strong an innovation concept might be, the idea will be wasted unless a company can be flexible enough to quickly get it into the hands of customers. The following case example shows how Xerox built a best-in-class innovation capability but mishandled opportunities to exploit its innovation concepts.12
Case-in-Point: Why Aren’t You Reading This on an Alto? Xerox’s Palo Alto Research Center
Situation: Due to its monopoly in photocopying, Xerox had become a wealthy and powerful company by the mid-1970s. Its net income had risen from US $3 million in 1959 to $348 million in 1974. In an effort to maintain this rapid growth, CEO Peter McColough commissioned the Palo Alto Research Center (PARC) to invent technologies around the then-new concept of information architecture. Xerox hoped to launch an entirely new suite of products as a result of PARC’s efforts, thereby further expanding its long-term growth potential. Action: PARC scientists achieved a fundamental breakthrough when they realized that mainframe computers could be brought to individual desktops. As a result of this insight, PARC invented a variety of computer-related technologies including a word processing language, a “local area network” through which computers could “talk” to each other, a laser printer, and a “mouse” for moving characters on the computer screen. Perhaps most significantly, PARC developed the Alto, generally considered to be the world’s first personal computer. Result: In spite of these significant accomplishments, PARC never achieved the kind of business success that should have accompanied these scientific breakthroughs. No single reason exists for this failure, but a significant cause can nonetheless be attributed to the absence of any rigorous process for (1) evaluating the commercial viability of PARC’s inventions, and (2) developing an idea worthy of further investment. Xerox failed to (1) understand the commercial potential of many of its innovations, and (2) take its products to market with any speed (when the Alto was finally released, it was too expensive and too slow to gain traction with end users). Ultimately, Xerox forfeited its first-mover advantage in the information architecture space to competitors that were better equipped to translate ideas into products. In spite of the commercial potential offered by the PARC scientists’ insights, Xerox is still known today primarily as a document company, rather than as a leader in the high-tech industry. Key Takeaway: Innovation is only half the battle. If you don’t have a process in place to take an idea from inspiration to implementation, one of your competitors will find a way to do it instead, thereby reaping the benefits of your missed opportunity.
(Continued on the following page)
SAM
PLE
The contents of these pages are copyright © Frost & Sullivan. All rights reserved. 5
INTRODUCTION (CONTINUED)
Where Development Goes Wrong If we accept that a rigorous product development process separates companies like Xerox from companies like Apple, Microsoft, or IBM, then we must also accept that it is the mechanics of development, perhaps more than anything else, that determine a company’s growth through NPD. It therefore follows that any company that doesn’t consistently convert good ideas into good products is at risk for repeating Xerox’s mistakes. There are many ways the development process can go wrong; two of the most common are outlined below.
Pitfall #1: Unpromising Ideas Continue to Receive Funding There are many reasons why a product might stay in development too long: poor management and bureaucratic inertia are surely causes, but one of the most pronounced seems to be what one author has termed “collective belief.” Collective belief refers to the tendency of an organization to seek only evidence supporting a preconceived notion (i.e., the potential of an innovation concept). Widespread belief in the inevitability of success can lead organizations to respond irrationally to compelling evidence that a project should be terminated.13 One of the most well-known instances of such a misstep is RCA’s failed launch of SelectaVision in the early 1980s (SelectaVision is a video play-back system using an analog needle and a groove system similar to phonograph records). When RCA developed its first prototype in 1970, many already considered the technology obsolete. Seven years later, with the improvement of VCR quality and the emergence of digital technology, every one of RCA’s top competitors abandoned videodisc research. In spite of these warning signs, RCA continued to invest heavily in its product. When the project was finally terminated in 1984, it had cost the company US $580 million in development costs and had tied up resources for 14 years (resulting in an incalculable opportunity cost).14 An efficient development process does not throw good money after bad ideas. It is not enough to have a development process in place – you must also adhere to a process for consistently evaluating a product’s commercial viability before you make significant investments in further development.
Pitfall #2: Promising Ideas Are Prematurely Removed from the Pipeline15 Conversely, an efficient development process continues to commit good money to good ideas. The system breaks down when inevitable setbacks during development are viewed unnecessarily harshly, resulting in premature termination of promising ideas. To reference the Xerox case example again, companies stand to lose significant revenue (and in some instances market share) if they fail to conduct the right research to understand a product’s potential. Organizational or personal biases against the project or a shortage of resources can also account for such errors. Just as a rigorous screening process can help eliminate bad ideas, so can it help frontload good ones by verifying an idea’s commercial potential with comprehensive and early-stage research. With such an approach in place before inevitable setbacks occur, it is possible to make investment decisions free of impulsiveness or undue bias. The above-mentioned pitfalls are often the most difficult to avoid throughout the development process. However, the majority of organizations tend to inadvertently promote each early-stage pitfall by focusing disproportionately on late-stage development (i.e., on moving a product as quickly as possible to launch). They tend to under-invest in the early, “truth-seeking” development stages whose explicit job is to head off commercial errors.16 Early-stage evaluation of a product’s potential can help expose losing ideas quickly and cost effectively.
The Solution Successful companies know how to balance a willingness to kill a product with the tenacity to persist until a product’s potential is realized. How do we walk this line, without over-investing in bad ideas and under-investing in good ones? As already suggested, the answer lies in the application of a rigorous, balanced process for evaluating any idea prior to entering the standard, stage-gate development process. By assessing a product’s viability against a set of basic criteria, companies can determine outright whether a product has the right market and customer base, and is supported by the internal capabilities necessary for a successful launch.
(Continued on the following page)
SAM
PLE

The contents of these pages are copyright © Frost & Sullivan. All rights reserved. 6
INTRODUCTION (CONTINUED)
How Should You Approach New Product Development? Frost & Sullivan structures the new product development process around the stages listed below.
NEW PRODUCT LAUNCH
DEMAND ASSESSMENT
FEASIBILITY ASSESSMENT
NEW PRODUCT FUNDING AND
DEVELOPMENT
Strategic analysis of all factors that could influence demand for the product or service (e.g., customer needs, competitor activity, market stability)
PHASE DESCRIPTION
Principled consideration of operational and organizational potential to support the development and launch of an innovation concept
Investment in the development and prototyping of approved innovation concepts; disciplined stage-gate evaluation process takes effect
Preparation for the commercialization of a product (this phase is the focus of a separate Growth Process Toolkit on New Product Launch)
THE FOUR PHASES OF NEW PRODUCT DEVELOPMENT As indicated by the shading above, this toolkit will focus on the first two phases of new product development: Demand Assessment and Feasibility Assessment. These phases are concentrated entirely on the selection of the most promising product ideas from the innovation pipeline. As noted previously, executives often underestimate the importance of these early-stage activities, spending too little time on determining product viability and too much time on preparing for product launch. This work therefore takes a close look at those phases and lists the key activities and tools that will help ultimately save time and money in new product development.
SAM
PLE
The contents of these pages are copyright © Frost & Sullivan. All rights reserved. 7
HOW TO USE THIS TOOLKIT The Growth Process Toolkit for New Product Development What it is: This toolkit will help you structure your evaluation of innovation concepts prior to investing in expensive development activities such as prototyping and testing. It will show you to predict a product’s future success by conducting comprehensive technological, operational, customer, and market research. On a more technical level, this Growth Process Toolkit presents Frost & Sullivan’s best thinking and work on new product development in a step-by-step implementation format. This research gives Growth Team Membership (GTM) members proven processes, tools, and templates to help them successfully manage the risks and pitfalls encountered in this key growth process. How it will help you: This toolkit will help you and your team cost-effectively execute new product development. While we recognize the importance of an innovation culture and the difficulty of generating good ideas, we believe that most organizations have no shortage of ideas – and struggle more with converting those ideas into profit. Therefore, we have decided to focus on this weakness and show you how a repeatable process for vetting ideas can improve or accelerate your long-term growth trajectory. How to use it: This book is divided into two sections: Demand Assessment and Feasibility Assessment. Within each section, we have outlined a variety of steps that you should complete. For each of those steps, you are provided with the tools, templates, scorecards, or checklists that you need to complete that activity to a Frost & Sullivan standard. You can read this book cover-to-cover, or you can reference the clickable table of contents to access specific sections. Be on the look-out for helpful reminders throughout this book. We will alert you at key stages when you should involve certain stakeholders, or when it might be a good idea to use additional GTM (or other) resources to aid your implementation. We encourage you to bookmark this toolkit, save particularly helpful tools to your desktop, and share it with your colleagues. We also encourage you to contact your Account Executive if at any point in your research you require assistance.
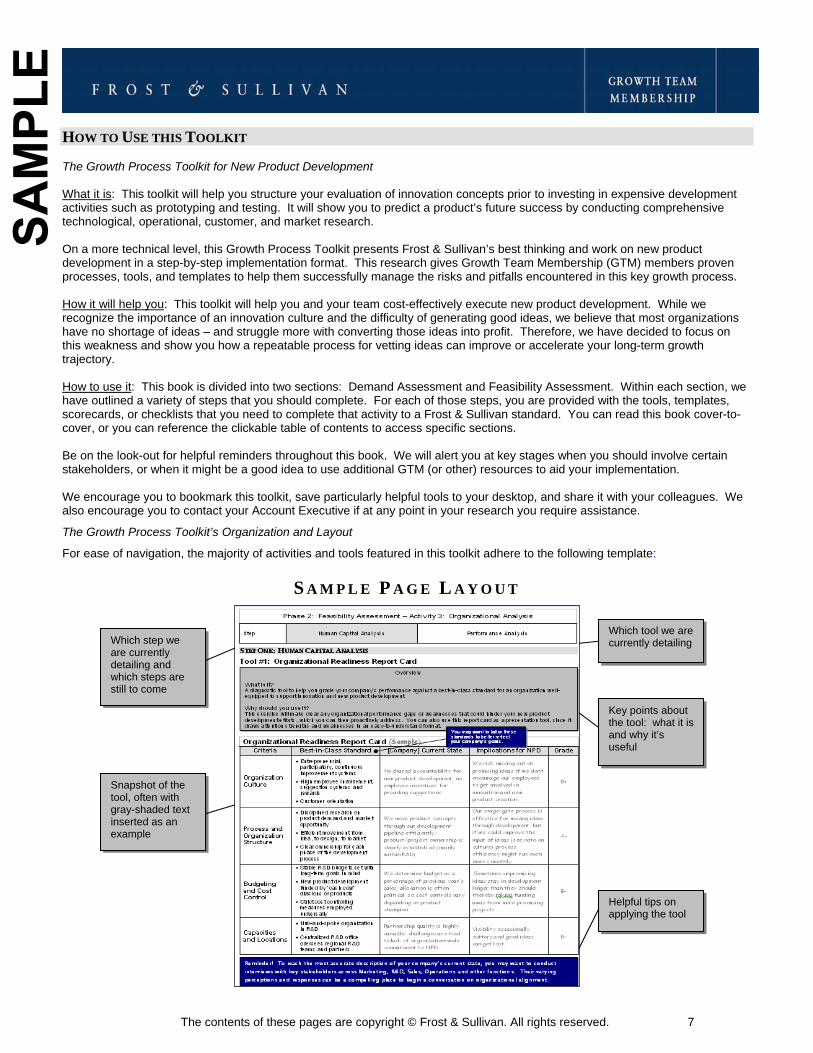
The Growth Process Toolkit’s Organization and Layout
For ease of navigation, the majority of activities and tools featured in this toolkit adhere to the following template:
S A M P L E P A G E L A Y O U T
Which step we are currently detailing and which steps are still to come
Which tool we are currently detailing
Key points about the tool: what it is and why it’s useful
Helpful tips on applying the tool
Snapshot of the tool, often with gray-shaded text inserted as an example
SAM
PLE

The contents of these pages are copyright © Frost & Sullivan. All rights reserved. 16
Phase 1: Demand Assessment – Activity 1: Industry Analysis
Step Market Analysis Competitor Analysis Emerging Technologies Analysis
STEP ONE: MARKET ANALYSIS (CONTINUED)
Tool #3: Market Strength and Breadth Scorecard
Overview
What is it? A growth opportunity evaluation tool that allows you to assess an existing product’s competitive advantages and its potential to be applied to a new market.
Why should you use it? You may want to consider whether a product from your current portfolio could fill the same need as a newly-developed product, but without the upfront risk and cost.
vb
Existing Product Strength and Breadth Scorecard Product Category: Paper Products (Sample) Step One: Score Market Strength (i.e., a product’s competitive advantages in its current market)
Existing Products & Scores Strength
Microencapsulation Paper Handling Protective Coatings
Capability Ability to deliver the product’s benefit
9 3 1
Uniqueness Difficulty of competition to replicate
1 1 -3
Cost Position Compared to competitors
9 9 3
Total: Sum of three scores 19 13 1
Complete Step Two for any product receiving a total score of 12 or more in Step One.
Score each product’s strength. (see scoring key).
Total the value of scores in each column.
List all products in your portfolio that you think could meet demand in a new market.
Step Two: Score Market Breadth (i.e., the applicability of the product’s strengths to a new market) Transferability Ease of transferring product to new markets
9 1 NA
Total Market Breadth: 9 1 NA
Any product that doesn’t score 12 or more is not evaluated in Step Two.
Score remaining products’ transferability.
Scoring Key
9 = Unique to your organization 3 = Valuable (but not unique) to your core business 1 = Commonly applied across industries -3 = Currently under-performing
Mark products with the highest total score for further consideration.
Reminder! To learn more about how you can introduce existing products into new markets, please reference Growth Team Membership’s best-practice profile of Appleton Papers’ Mature Product Reinvigoration Process.
SAM
PLE

The contents of these pages are copyright © Frost & Sullivan. All rights reserved. 29
Phase 2: Feasibility Assessment – Activity 1: Capability Analysis
Step Internal Resource Audit External Resource Audit
STEP ONE: INTERNAL RESOURCE AUDIT
Tool #1: New Product Concept Opportunity/Fit Matrix
Overview What is it? A framework for determining whether a new product concept is a good “fit” with your company’s resources (this format may be familiar to you: we applied a similar one to a customer segmentation exercise). Why should you use it? You need to assess the match between company capabilities and the resources required to develop a new product. Such a perspective will help you avoid wasting money on poor-fit concepts that cost more to develop than they are worth to the organization. Additionally, this exercise may help you identify any gaps that could be overcome through strategic partnerships.
*A Note on Opportunity and Fit
Frost & Sullivan defines “opportunity” as a product concept’s attractiveness (i.e., growth potential) and “fit” as alignment with your company’s current capabilities.
NEW PRODUCT CONCEPT OPPORTUNITY/FIT MATRIX
High
Low Priority No degree of capability fit can compensate for the unattractiveness of a potential product’s
market.
Double Down Good-fit, high-opportunity products should be the
core of your NPD strategy. Invest in any opportunities that fall into this “sweet spot.”
Low Avoid
Any action taken here will likely not contribute to your NPD revenue or growth goals.
Partner Serving this segment would require an expansion of
capabilities: new product development or M&A might help you improve the “fit” between this high-value
segment and your product or service offerings (see Partnership Selection Guidelines).
Low High
COMPANY FIT*
PRODUCT OPPORTUNITY*
(Directions listed on the following page)
SAM
PLE

The contents of these pages are copyright © Frost & Sullivan. All rights reserved. 30
Phase 2: Feasibility Assessment – Activity 1: Capability Analysis
Step Internal Resource Audit External Resource Audit
STEP ONE: INTERNAL RESOURCE AUDIT (CONTINUED)
Tool #1: Product Opportunity/Fit Matrix (Continued)
Directions
1. Plot each potential product you are considering according to responses to the questions listed below. 2. Rank each response those questions based on a High, Medium, Low scale. Take the average for each category and plot on the grid accordingly.
Questions A. Product Opportunity 1. How highly defined is the market need for [product]? 2. To what extent does this product meet the needs of our most profitable customer groups? 3. To what degree are technology advances in this market (see Technological Analysis Guidelines) creating a long-term market need for [product]? 4. How likely is it that the market can support a new product introduction (considering size of regional and/or global market and projected growth rate)? 5. To what degree is this product similar to one already offered by competitors? B. Company Fit 1. To what degree does this product align with our company’s long-term growth strategy? 2. To what extent do projected development costs for [product] align with our company’s NPD budget? 3. To what degree does our company’s infrastructure align with the stated market/customer need? 4. To what degree do we control the technology/IP required to develop and launch [product]? 5. How feasible would it be for us to develop this product without investing in significant or costly adjustments to our current operating model? Answer the following two questions only if your company is developing a tangible product rather than a new service: 6. To what degree does our distribution capability align with how this product should be taken to market? 7. To what extent do our current suppliers provide materials required to manufacture [product]? 8. To what degree is the profitability of the new product subject to commodity pricing pressures or restrictions?
SAM
PLE
The contents of these pages are copyright © Frost & Sullivan. All rights reserved. 42
Phase 2: Feasibility Assessment – Activity 3: Organizational Analysis
Step Human Capital Analysis Performance Analysis
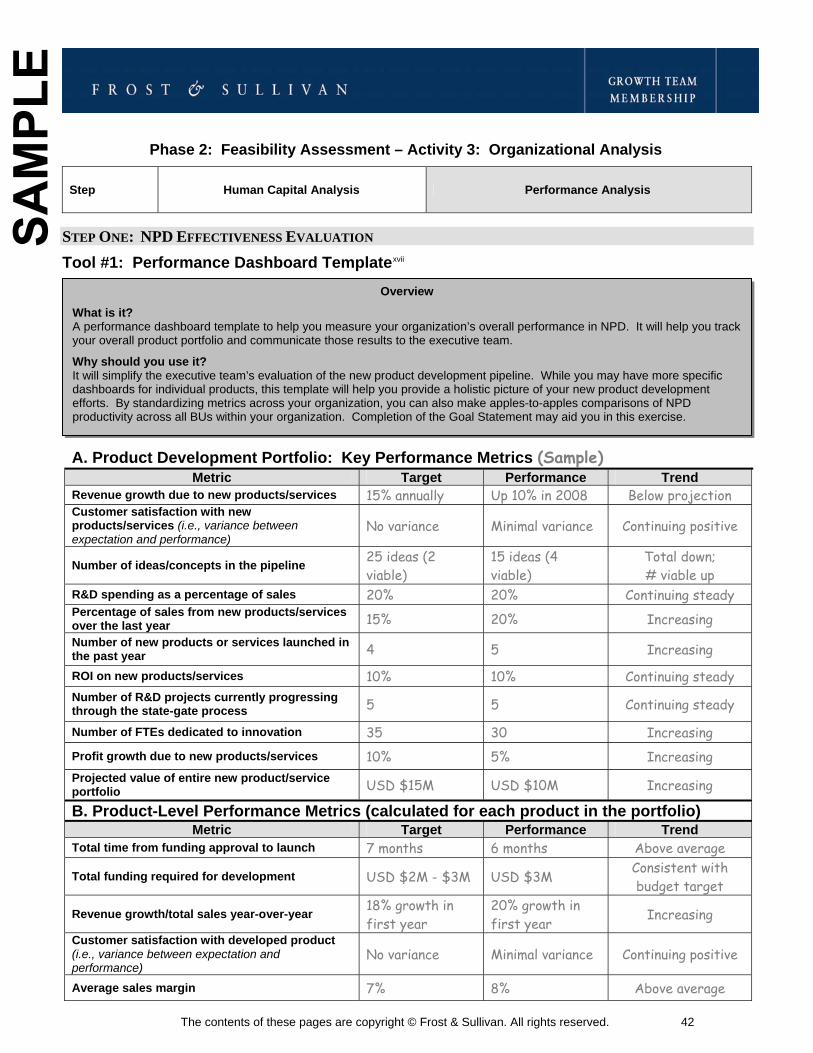
STEP ONE: NPD EFFECTIVENESS EVALUATION
Tool #1: Performance Dashboard Templatexvii
Overview
What is it? A performance dashboard template to help you measure your organization’s overall performance in NPD. It will help you track your overall product portfolio and communicate those results to the executive team.
Why should you use it? It will simplify the executive team’s evaluation of the new product development pipeline. While you may have more specific dashboards for individual products, this template will help you provide a holistic picture of your new product development efforts. By standardizing metrics across your organization, you can also make apples-to-apples comparisons of NPD productivity across all BUs within your organization. Completion of the Goal Statement may aid you in this exercise.
A. Product Development Portfolio: Key Performance Metrics (Sample) Metric Target Performance Trend
Revenue growth due to new products/services 15% annually Up 10% in 2008 Below projection Customer satisfaction with new products/services (i.e., variance between expectation and performance)
No variance Minimal variance Continuing positive
Number of ideas/concepts in the pipeline 25 ideas (2 viable)
15 ideas (4 viable)
Total down; # viable up
R&D spending as a percentage of sales 20% 20% Continuing steady Percentage of sales from new products/services over the last year 15% 20% Increasing Number of new products or services launched in the past year 4 5 Increasing
ROI on new products/services 10% 10% Continuing steady Number of R&D projects currently progressing through the state-gate process 5 5 Continuing steady
Number of FTEs dedicated to innovation 35 30 Increasing Profit growth due to new products/services 10% 5% Increasing Projected value of entire new product/service portfolio USD $15M USD $10M Increasing
B. Product-Level Performance Metrics (calculated for each product in the portfolio) Metric Target Performance Trend
Total time from funding approval to launch 7 months 6 months Above average
Total funding required for development USD $2M - $3M USD $3M Consistent with budget target
Revenue growth/total sales year-over-year 18% growth in first year
20% growth in first year Increasing
Customer satisfaction with developed product (i.e., variance between expectation and performance)
No variance Minimal variance Continuing positive
Average sales margin 7% 8% Above average
SAM
PLE
The contents of these pages are copyright © Frost & Sullivan. All rights reserved. 43
1 Craig R. Davis, “Calculated Risks: A Framework For Evaluating Product Development”, MIT Sloane Management Review,
Volume 43, Number 4, 2002, 71. 2 Joanna Barsh, Marla M. Lapozzi, and Jonathan Davidson, “Leadership and Innovation”, The McKinsey Quarterly, Number 1, 2008,
37. 3 “North American and European Executives Say Business Strategy Depends Largely on Innovation, Yet Corporate Responsibility
for Innovation Is Highly Fragmented”, Accenture Press Release, April 3 2008. 4 Ibid. 5 “Innovation Like Clockwork”, Raglan Tribe, December 2004, 2. 6 Joanna Barsh, Marla M. Lapozzi, and Jonathan Davidson, “Leadership and Innovation”, The McKinsey Quarterly, Number 1, 2008,
38. 7 Ibid., 39. 8 “North American and European Executives Say Business Strategy Depends Largely on Innovation, Yet Corporate Responsibility
for Innovation Is Highly Fragmented”, Accenture Press Release, April 3 2008. 9 Ibid. 10 Joanna Barsh, Marla M. Lapozzi, and Jonathan Davidson, “Leadership and Innovation”, The McKinsey Quarterly, Number 1,
2008, 44. 11 Ibid., 46. 12 David Graulich, “Book Review: Fumbling the Future: How Xerox Invented, then Ignored, the First Personal Computer”,
Washington Monthly, June 1989. 13 Isabelle Royer, “Why Bad Projects Are So Hard to Kill”, Harvard Business Review, February 2003, 6. 14 Ibid., 5. 15 Eric Bonabeau, Neil Bodick, and Robert W. Armstrong, “A More Rational Approach to New Product Development”, Harvard
Business Review, March 2008, 2. 16 Ibid., 5. xvii Vanessa Chan, Chris Musso, and Venkatesh Shankar, “Assessing Innovation Metrics”, McKinsey Global Survey Results,
October
2008, 4.
SAM
PLE