group threat, police officer diversity and the deadly use
TRANSCRIPT
Columbia Law School Columbia Law School
Scholarship Archive Scholarship Archive
Faculty Scholarship Faculty Publications
2016
Group Threat, Police Officer Diversity and the Deadly Use of Police Group Threat, Police Officer Diversity and the Deadly Use of Police
Force Force
Joscha Legewie [email protected]
Jeffrey Fagan Columbia Law School, [email protected]
Follow this and additional works at: https://scholarship.law.columbia.edu/faculty_scholarship
Part of the Law and Race Commons, and the Law Enforcement and Corrections Commons
Recommended Citation Recommended Citation Joscha Legewie & Jeffrey Fagan, Group Threat, Police Officer Diversity and the Deadly Use of Police Force, COLUMBIA PUBLIC LAW RESEARCH PAPER NO. 14-512 (2016). Available at: https://scholarship.law.columbia.edu/faculty_scholarship/1980
This Working Paper is brought to you for free and open access by the Faculty Publications at Scholarship Archive. It has been accepted for inclusion in Faculty Scholarship by an authorized administrator of Scholarship Archive. For more information, please contact [email protected].

Electronic copy available at: http://ssrn.com/abstract=2778692
COLUMBIA LAW SCHOOL PUBLIC LAW & LEGAL THEORY WORKING PAPER GROUP
PAPER NUMBER 14-512
GROUP THREAT, POLICE OFFICER DIVERSITY AND THE DEADLY USE OF POLICE FORCE
JOSCHA LEGEWIE &
JEFFREY FAGAN
December 2016

1
Group Threat, Police Officer Diversity and the Deadly Use of Police Force1
Joscha Legewie2 and Jeffrey Fagan3
Abstract
Officer-involved killings and racial bias in policing are controversial political issues. Prior
research indicates that (perceived) group threat is an important explanation for variations
in police killings across cities in the United States. We argue that a diverse police force
mitigates group threat and thereby reduces the number of officer-involved killings.
Count models support our argument. They show that group threat is largely driven by
the threat of black crime. Black-on-white homicides increase officer-involved killings of
African Americans but black-on-black homicides and measures for political and eco-
nomic threat do not. However, a diverse police force reduces the influence of group threat
lowering the number and rate of officer-involved killings of African Americans. The find-
ings represent one of the first analyses of an important contemporary issue based on a
recent and high-quality dataset from January 2013 to June 2016. By highlighting the in-
teraction between group threat and the representation of minority groups in police de-
partments, our research advances group conflict and threat theories with important the-
oretical and policy implications for law enforcement and representative bureaucracies
more broadly.
1 This project was supported by the Russell Sage Foundation (grant no. 93-17-04). 2 Yale University, Department of Sociology. E-mail: [email protected] 3 Columbia University, Law School. E-mail: [email protected]

2
Introduction
Around 12.02 pm on August 9, 2014, an 18-year old African-American teenager named
Michael Brown was fatally shot by Darren Wilson, a white 28 year-old Ferguson police
officer. Accounts of the incident differ widely, but the event and others like it drew na-
tional attention to killings of African Americans at the hands of police. The outrage in the
American public and the serious nature of the incidents make the use of lethal police force
a major concern for racial and ethnic disparities in criminal justice. Yet, research on the
structural predictors of police-caused homicides is surprisingly rare and impeded by low
quality data (Hirschfield 2015; Klinger 2012; Zimring forthcoming). This article uses a
new and contemporary dataset on officer-involved killings to examine variations in po-
lice use of deadly force across cities in the Unites States.
Extending theories of intergroup conflict and threat, we argue that a diverse police
force mitigates group threat and thereby reduces the number of officer-involved killings.
(Perceived) minority threat is a prominent account in research on variations in formal
levels of social control such as police use of force. A diverse and inclusive police force,
however, has the potential to reduce tensions and weaken the influence of factors that are
commonly associated with perceived group threat. Increased police legitimacy, the
knowledge and empathy of minority officers, and more frequent interracial interactions
within the police might attenuate tensions between the police and African-American
communities. Homogenous police departments, in contrast, might strengthen the “us
versus them” or “blue versus black” dynamic. This argument implies both a direct effect
of police diversity on officer-involved killings of blacks and, more importantly, a negative
interaction between factors related to group threat and an inclusive police force.
To test our argument, we examine variations in the number and rate of police-
involved deaths of African-Americans and non-Hispanic whites across cities with over
100,000 residents in the United States (supplementary analysis focus on smaller cities

3
with over 50,000 residents). For this purpose, we construct a comprehensive database of
officer-involved killings between January 2013 and June 2016 based on verified crowd-
sourced information from “Fatal Encounters” (Burghart 2016). We supplement these data
by incorporating information from other sources and by performing our own coding and
classification of fatal encounters with the police. Our dataset provides several key ad-
vantages compared to previous work based on “justifiable homicides of felons” from the
Federal Bureau of Investigation (FBI) (Jacobs and O’Brien 1998; Smith 2003; Willits and
Nowacki 2014; Zimring and Arsiniega 2015). First, it is a more complete sample of police-
involved killings that integrates information from several sources. Second, it is more
representative of the entire United States, overcoming the missing observations that re-
sult from the non-participation of some police agencies in some years in the FBI archive.
Third, it is based on a clear definition of officer-involved killings that is derived from
criminal law. We integrate the dataset on police killings with several other relevant da-
tasets for this analysis. For each major city, we link the number of officer involved killings
to population data from the U.S. Census, crime data from the F.B.I. Uniform Crime Re-
ports, and information on police agencies from the Law Enforcement Management and
Administrative Statistics (LEMAS) data series collected by the Bureau of Justice Statistics.
Using negative binomial regression, we find that the number and rate of officer-
involved killings of African-Americans but not non-Hispanic whites are higher in cities
with a larger rate of black-on-white homicides as a measure of black crime threat. Black-
on-black homicides, violent crimes more broadly and measures of political and economic
threat, however, are unrelated to officer-involved killings of blacks, indicating that the
threat of black crime is a major driver of officer-involved killings of African-Americans.
We also show that a diverse police force reduces the influence of black crime threat low-
ering the number of officer-involved killings of blacks. These findings are consistent for
the number of officer-involved killings, the rate per population and the rate per arrest.
4
They make new and substantial contributions to our understanding of a highly conten-
tious social, cultural and political issue, and inform policing behavior more broadly. By
highlighting the interaction between group threat and the representation of minority
groups in police departments, our research advances group conflict and threat theories
with important theoretical and policy implications for law enforcement and diverse
workforces in representative bureaucracies more broadly.
Minority Threat and the Deadly Use of Police Force
Over 20 years after the Rodney King beating sparked a public outcry about racism in the
police force, the excessive use of force remains a matter of great concern and a divisive
political issue making national headlines. A prominent explanation of racial and ethnic
disparities in many areas of criminal justice including the deadly use of police force builds
on political or threat explanations. Based on broader theories of race relations and group
threat (Blalock 1967; Blumer 1958), this explanation focuses on the ways in which domi-
nant or privileged groups use the police, criminal law and other state instruments to
maintain racial hierarchies and inequalities when their interests are threatened (Baumer,
Messner, and Rosenfeld 2003; Jacobs, Carmichael, and Kent 2005; Jacobs and O’Brien
1998; Liska 1992; Smith and Holmes 2014; Stults and Baumer 2007; Turk 1966). Racial
disparities in arrests, sentencing, the use of (deadly) police force and other coercive crime
control mechanisms are partly driven by deeply rooted social divisions that separate
dominant and subordinate racial and ethnic groups (Chambliss 2001; Liska 1992; Smith
and Holmes 2014).
An important empirical prediction from this tradition is the minority threat hypoth-
esis. It states that the minority population share increases the perceived level of threat in
the general population, which in turn motivates aggressive policing strategies including

5
the use of police force or at least gives the police additional leeway (Liska 1992). As dis-
cussed by Blalock (1967) and elaborated in subsequent work, people feel threatened by
the presence of out-group members because of real or perceived competition between
ethnoracial groups over scarce resources. The literature generally distinguishes between
political mobilization, economic competition, and the fear of minority crime as three dis-
tinct sources of racial or minority threat (Blalock 1967; Liska 1987; Liska & Chamlin 1984;
Eitle et al 2002; King and Wheelock 2007; Stults and Baumer 2007).
First, political threat (also known as power threat) is based on fears of increasing
political influence of African-Americans or other minority groups that challenge the
political dominance of whites (Blalock 1967). As the share of African-Americans in the
population rises or as they gain increasing political power in the form of representation
among political officials, political threat becomes salient among whites. They perceive
African-Americans as a threat to their political status and influence. However, if the black
population or political officials achieve majority, the political influence of blacks should
increase and as a result the amount of social control over blacks should decline (Blalock
1969; Horowitz 1985; Turk 1969). This argument implies a curvilinear relation between
black population share or political representation and police use of force.
Second, theories of group threat argue that minorities are perceived as posing an
economic threat (Blalock 1967; Liska and Chamlin 1984; Quillian 1995). This argument is
prominent in research on riots, lynchings (Beck & Tolnay 1990; Olzak 1990, 1992),
interracial killings (Jacobs & Wood 1999) and police use of force (Liska and Yu 1992). It
suggests that a high unemployment rate and competition between whites and blacks for
jobs or other finite economic resources results in an increase in perceived economic threat
and ultimatively higher levels of social control imposed on blacks.
Third, Turk (1966) and a number of subsequent authors (Eitle, D’Alessio, and
Stolzenberg 2002; Liska and Chamlin 1984; Stults and Baumer 2007) argue that perceived
threat is not necessaily based on political or economic factors but instead driven by threat

6
of black-on-white crime. Similar to other threat arguments, the threat of black crime
hypothesis postulates that the perception of crime threat increases the popular and
political demand for social control including the use of police force against African-
Americans. From this perspective, the decision making of the police and others actors in
the criminal justice system, however, is not based on political or economic factors but
instead driven by fear of black crime and white victimination at the hand of minorities.
In short, group threat theories suggest that minority populations trigger perceived
political, economic and crime threat among members of the majority population. Per-
ceived threat, in turn, raises popular and political support for aggressive policing strate-
gies including the use of police force or at least gives the police additional leeway. Ac-
cordingly, majorities, businesses, and political leaders demand increased social control
over minority communities, which ultimately leads to increased use of police force. Em-
pirical studies generally support the idea that the relative size of the black population is
related to different aspects of social control such as the size of the police force, arrests,
incarceration rates and other (Eitle et al. 2002; Jackson and Carroll 1981; Jacobs and Car-
michael 2002; Jacobs and O’Brien 1998; Legewie 2016; Liska 1992; Smith and Holmes 2014;
Stults and Baumer 2007). Focusing on the deadly use of force, Jacobs and O’Brien (1998)
use data from the early 1980s and find that the number of officer-involved killings of
blacks is higher in cities with a larger proportion and recent in-migration of African-
Americans. Ross (2015a) similarly links racial disparities in officer-involved shootings to
the proportion of black residents and the overall level of inequality. However, previous
research on officer-involved killings does not explicitly distinguish between political,
economic and crime threat as three distinct dimensions. Related work on race-specific
arrests and the size of the police force points at the importance of this distinction (Eitle
et al. 2002; King and Wheelock 2007; Stults and Baumer 2007). In particular, Eitle et al
(2002) use county-level data from South Carolina and find that black-on-white crime sub-

7
stantially increases black arrest rates. Black-on-black crime as well as political and eco-
nomic threat, however, are unrelated to arrests. Along similar lines, Stults and Baumer
(2007) explicitly measure perceived economic and political threat, whites’ fear of crime
and prejudice as key components of the underlying process. They find that fear of crime
and perceived economic threat account for a substantial part of the relation between mi-
nority population share and police size.
This study examines political, economic and crime threat as three distinct threat-
based explanations of police use of (deadly) force. Despite the prominence of racial threat,
previous research has largely ignored the racial/ethnic composition of the police depart-
ment as a potentially important moderating factor. Here, we argue that a diverse police
force mitigates group threat and thereby reduces the number of officer-involved killings.
Group threat and the racial composition of the police force
Group threat theories generally emphasize the interest and threat perception of the dom-
inant group as a driving factor for minority threat. Recent work, however, also highlights
that police are a distinct social group with their own interests such as concerns about
safety, legal protection, and public image (Holmes 2000; Smith and Holmes 2014). These
interests influence police behavior including responses to minority citizens on the street
such as the use of police force. Indeed, Holmes argues that the “salience of threats per-
ceived directly by the police should be more important than distal threats to the dominant
group in predicting their street-level responses to minorities” (Holmes 2000:350). Along
similar lines, Legewie (2016) shows that violent attacks against police officers increase the
subsequent use of police force against African-Americans but not against other groups.
From this perspective, group conflict based on the notion of the police against minority
groups and the perceived level of threat among officers are important drivers of police
use of (deadly) force. The contemporary debate reinforces this perspective with “blue

8
lives matter” emerging as a counter movement to “black lives matter”. The focus on po-
lice as a distinct social group also highlights potentially mitigating factors. Here, we ar-
gue that African-American officers in the police force mitigate group threat and thereby
reduce the number of officer-involved killings.
Diversifying the force and minority representation in policing emerged as an im-
portant issue in the 1960s (Stokes 1997). Partly in response to the urban riots and concerns
about tensions between police and minority groups, many argued that law enforcement
agencies should ethnically and racially represent the communities they serve. Indeed,
“virtually every national report on the police over the past twenty years has recom-
mended increased employment of minorities and women” (Walker 1985:555) including
President Obama’s Task Force on 21st Century Policing. The increasing calls for a pro-
portional representation of minorities in the ranks of the police led to a series of political
and administrative steps to hire African American officers (Stokes 1997; Walker and Katz
2011). As a result, the proportion of African-American officers increased substantially
over the last decades. In 2013, it reached 11.0% in our sample of cities compared to 19.2%
among residents.4 The overall increase in minority police conceals substantial variations
across cities in the United States. Minority members remain underrepresented in most
police departments (see Figure 2 in the results section). Prominently, the protests in Fer-
guson confronted a largely black community with a nearly all-white police force (3 out of
53 sworn officers in the Ferguson Police Department are African American).
Despite the consistent calls for increased racial diversity in the police force, few
empirical studies have examined the relation between the racial composition of police
departments and police use of force. The findings are mixed. Smith (2003), for example,
examines the relation between police officer racial diversity and the number of officer-
4 The estimates are based on LEMAS data (see below for further details).

9
involved killings using F.B.I. data from the Supplementary Homicide Reports. His find-
ings indicate that officer diversity is unrelated to the number of police killings. Along sim-
ilar lines, Hickman and Piquero (2009) and Ozkan et al (2016) find that minority repre-
sentation in the police force is unrelated to complaints about police use of force and the
number of assaults on police officers as a measure of perceived police legitimacy (also see
Barrick et al 2014). Smith and Holmes (2014), however, find that the proportional repre-
sentation of African-Americans in the police force is related to a lower number of com-
plaints about excessive use of police force. Willits and Nowacki (2014) report a similar
pattern in their sample of large cities. Aside from revisiting the ongoing debate about the
effect of officer diversity, our argument extends previous research by focusing on the link
between group threat and the representation of African-Americans in the police force.
Based on previous work on minority representation in police departments and
broader sociological theories, we argue that minority representation not only reduces po-
lice killings but also mitigates group threat. The presence of African American officers
influences policing through four processes. First, minority representation increases police
legitimacy among minority residents, which has important implications for police-citizen
interactions (Bell 2002; Theobald and Haider-Markel 2008; Weitzer 2000). Following the
literature on symbolic representation, public attitudes and behavior towards state bu-
reaucracies can change simply based on the characteristics of representatives or non-
elected officials (Gay 2002; Mansbridge 1999; Theobald and Haider-Markel 2008). Minor-
ity representation signals that police officers share similar values and experiences. The
officers are seen as more knowledgeable about minority concerns and culture, which in-
creases trust among minorities. Recent empirical evidence from police-citizen interac-
tions (Theobald and Haider-Markel 2008) and in other areas such as political institutions
(Banducci, Donovan, and Karp 2004; Gay 2002; Scherer and Curry 2010) supports this
argument. Increased trust and legitimacy, in turn, attenuate tensions between the police

10
and African-American communities and potentially de-escalates tensions in police-citi-
zen interactions (Bell 2002; Theobald and Haider-Markel 2008).
Second, minority officers are more knowledge and empathetic about minority con-
cerns and culture. This knowledge and empathy might influence their own behavior and
shape the overall department culture spreading to other officers. Similar to substantive
representation in parliaments, minority presence in the police introduces different views
that are aligned with and reflect minority interests (Sun and Payne 2004). A number of
studies indicate that black officers are less biased toward black citizens (Antonovics and
Knight 2009; Anwar and Fang 2006; Close and Mason 2007; Fagan et al. 2016; Fagan and
Geller 2010) although other findings are mixed (Sun and Payne 2004). The role of black
police associations over the last decades highlights the influence on the overall policing
community (Walker, Spohn, and DeLone 2012:180). After the Rodney King beating, the
National Black Police Association (NBPA), for example, highlighted that racism is wide-
spread in the police. Today, NBPA continues to push for an end to police brutality and
supports federal legislation that prohibits racial profiling. This response to recent events
stands in contrast to the reaction of other police organizations. It highlights how minority
officers provide a different perspective that influences policing culture and eases tensions
between the police and African American communities. This perspective may partly be
driven by a sense of linked fate between black officers and citizens (Dawson 1994; Simien
2005).
Third, a higher number of minority officers in the police provides opportunities for
contact and interactions between white and minority officers. The experiences and infor-
mation from these interactions increase familiarity and reduce hostility. They contribute
to a more positive view of minority communities and potentially alter police culture
(Goldstein 1977; Smith 2003). This argument is closely related to inter-group contact the-
ory. Contact theory posits that contact between groups facilitates inter-group relations by
improving attitudes towards the out-group and by reducing stereotypes (Pettigrew

11
1998). Allport’s (1954) classical formulation of the theory and many subsequent studies
focus on situational factors such as equal status, common goals, and cooperation as con-
ditions for the positive effect of inter-group interactions. Police-citizen interactions usu-
ally do not fulfill these conditions with a clear hierarchy and often opposing goals be-
tween the officer and the citizen. Interactions between officers, however, do. They are
generally among equal or similar status positions. The interactions involve cooperation
to achieve a common goal. Accordingly, interactions between white and minority police
officers and the direct contact with close friends or coworker can improve attitudes to-
wards the out-group among all officers, mitigate negative sentiments and reduce stereo-
types about African-Americans. Bolton and Feagin’s (2004 Cha. 6) in-depth interviews
with police officers, for example, document how African-American officers from time to
time challenge and confront everyday racism and thereby change policing culture.
Fourth, minority officers can weaken the solidarity within the police community
particularly when confronted with threats (Smith 2003; Walker et al. 2012:180). The link
between solidarity and diversity has been studied across the social sciences. In an influ-
ential article, Portes and Sensenbrenner (1993) distinguish between four sources of social
capital. They argue that bounded solidarity is not based on shared values or reciprocal ex-
changes between individual, but on “the situated reaction of a class of people faced with
common adversities […] It is limited to members of a particular group who find them-
selves affected by common events in a particular time and place” (Portes and
Sensenbrenner 1993:1325). From this perspective, homogenous police departments are
likely to respond to perceived threats with higher solidarity that is based on the notion
of “us” against “them” or blue versus black. Along similar lines, research on friendship
networks suggests denser ties and consequently solidarity in homogenous settings. The
response by African American police organizations to the Rodney King beating or recent

12
events and the linked fate perspective described above support this argument. They high-
light how minority officers introduce a different perspective that undermines a uniform
response to certain events and perceived threats.
Together these factors might reduce the overall level of police use of (deadly) force
and weaken the role of factors that are commonly associated with group conflict and
threat. Increased police legitimacy, the knowledge and empathy of minority officers and
more frequent interracial interactions within the police might attenuate tensions between
the police and African-American communities. Weakened police solidarity might under-
mine the narrative of the police versus black youth, and reduce the salience of archetypes
such as the “symbolic assailant” that shape interactions between police and minority
youth (Skolnick, 1968). Homogenously white departments, in contrast, might strengthens
the notion of the us versus them or “blue versus black”, and reinforce the stereotypes that
lead to collective suspicion or actuarial decision making by patrol officers. Based on this
argument, we expect that minority representation not only reduces the number of officer-
involved killings directly but also mitigates the role of factors that are commonly associ-
ated with group threat. This argument implies both a direct effect of police diversity and
a negative interaction between various factors of group threat and an inclusive police
force.
Data and Methods
To address our questions, we examine variations in the number of police-involved kill-
ings of African-Americans and non-Hispanic whites across major cities in the United
States. Our sample consists of all 266 U.S. Census designated places with a population
over 100,000 in 2010. The focus on large cities provides several advantages. Tensions be-
tween the police and minority communities are particularly strained, information on key
13
independent variables is more complete, and many of the smaller cities have a low num-
ber of incidents so that the distribution of the outcome variable is highly skewed. How-
ever, only about one third of all officer-involved deaths happen in larger cities raising
some concerns about the external validity of our findings. To address this concern, we
conduct supplementary analyses that replicate our findings for 635 smaller cities with a
population of over 50,000 showing that the findings hold across different city types. As
discussed below, one of the key challenges of previous research on officer-involved kill-
ings is the limited data available on fatal police violence (Klinger 2012). To address this
problem and measure the number of police killings in each city, we construct a compre-
hensive database of all officer-involved killings between January 2013 and June 2016
based on verified crowd sourced information from “Fatal Encounters” (Burghart 2016),
The Counted from The Guardian, and a database on fatal police shootings compiled by
the Washington Post. Overall, our database contains 3,833 incidents of officer-involved
killings. 1,293 or 33.7% of these cases involved police agencies in our sample and 463
involved African-American victims (1,585 and 526 for the supplementary sample with
over 50,000 residents).6 For each city, we link the number of officer involved killings to
population data from the U.S. Census, crime data from the F.B.I. Uniform Crime Reports,
and information on police agencies from the Law Enforcement Management and Admin-
istrative Statistics (LEMAS) data series collected by the Bureau of Justice Statistics. Using
negative binomial regression, we model the number of officer-involved killings of blacks
as a function of population characteristics, crime rates, three measures of political, eco-
nomic and crime threat and the racial/ethnic composition of the police department.
6 Some incidents involved multiple police agencies. However, there is no overlap in our sample because these cases usually involved a municipal agency together with a federal, state or adjacent sheriff agency.

14
Definition of Officer-Involved Killings
We define police-involved killings or deaths as any interaction with the police where the
officer uses force and the person dies during or immediately after the interaction.7 Police
officers’ use of fatal force may be lawful or unlawful, and our definition includes both
killings that can be classified as lawful or unlawful.8 We include cases that result in death
as a consequence of being shot, beaten, arrested, restrained, pepper sprayed, tasered, or
otherwise harmed by police officers, whether on-duty or off-duty. Following the Model
Penal Code (Dubber 2015), this definition includes deaths resulting from acts that may
be: (a) intentional, (b) unintentional but result from the reckless use of force, or (c) unin-
tentional but the result of the negligent use of force. In addition to the use of force directly
on a suspect, the definition includes acts where one or more police officers set in motion
a chain of events that leads to the death of a suspect or another individual if the original
act involved the use of police force. These cases might include high speed chases or in-
stances where a police officer kills a bystander when shooting at a suspect. The definition
excludes (a) suicides, (b) accidents caused by suspects themselves (e.g. a fleeing suspect
who causes a deadly car crash), and (c) police-caused accidents unrelated to the use of
force (e.g. a car crash under normal traffic conditions that is not related to the vehicular
pursuit of a suspect). Based on this definition, we classify and code officer-involved kill-
7 The definition is informed by basic concepts in criminal law on the culpability of actors, and by the defi-nitions of homicide that are commonly found in state statutes on the justifiable use of deadly force (Flanders and Welling 2016). The Model Penal Code, a set of legal standards that inform criminal statutes in nearly two thirds of the states in the U.S., sets forth definitions of both acts that result in death and the standards for determining the culpability of actors for those deaths (Dubber 2015). In the special case of police killings, some of these acts are lawful but would be considered unlawful if committed by non-po-lice persons. These are considered “justifiable” or “excusable” homicides. We include these in our defini-tion. 8 Also see a discussion about lawful and unlawful officer-involved killings by Joseph Goldstein in the New York Times at http://nyti.ms/2a3KEbv.

15
ings in two categories: “Intentional or purposeful police killing” and “Unintentional po-
lice killing but result of extremely reckless, reckless or negligent use of force”. The coding
scheme includes two additional categories that are excluded from our definition (acci-
dental police killing and self or suspect-inflicted killing). Box 1 describes the four catego-
ries in detail.
[Box 1 about here]
Constructing a Comprehensive Database on Police Killings
As widely publicized in the media and discussed in recent academic publications, the
federal government in the United States does not collect reliable information on police
killings (Hirschfield 2015; Ross 2015a; Zimring and Arsiniega 2015).9 The most commonly
used official information source is the annual F.B.I. Supplementary Homicide Reports
(SHR), a special data series that is part of the Uniform Crime Reports (UCR).10 SHR is an
important data source for research on homicides and was essential for previous work on
9 Here are some of the media reports: Washington Post (http://blogs.wsj.com/numbers/why-the-data-on-justifiable-homicide-just-wont-do-1725/), the New York Times (http://www.ny-times.com/2015/05/01/us/no-sharp-rise-seen-in-police-killings-though-increased-focus-may-suggest-oth-erwise.html), the Guardian (http://www.theguardian.com/us-news/2015/mar/18/police-killings-govern-ment-data-count) and FiveThirtyEight (http://fivethirtyeight.com/features/how-many-americans-the-po-lice-kill-each-year/). 10 There are two alternative, official data sources. First, the Centers for Disease Control and Prevention’s National Vital Statistics System (NVSS) is based on death certificates and includes a category for homi-cide by “legal intervention”. Second, the Bureau of Justice Statistics published an independent count of “arrest-related homicides” from 2003 to 2009 but suspended the data series and acknowledged that the count is not complete (Burch 2011; Planty et al. 2015). The yearly count for both alternative data sources resembles the data from the Supplementary Homicide Reports and is far below recent crowd-sourced and media-initiated data collection projects (Klinger 2012; Loftin et al. 2003). A third official data source with some promise is the Centers for Disease Control and Prevention’s National Violent Death Reporting System but as of January 2016 it only covers 32 states (Barber et al. 2016).

16
officer-involved killings (Jacobs and O’Brien 1998; Liska and Yu 1992; Sorensen, Mar-
quart, and Brock 1993; Willits and Nowacki 2014). However, SHR has limitations for
work on officer-involved deaths (Hirschfield 2015; Klinger 2008, 2012; Loftin et al. 2003).
It includes a category for “felon killed by police” that tallies about 400 cases per year.
Reporting by state and local police agencies is voluntary and “felon killed by police” nar-
rowly defines police killings as justifiable police homicides involving felons (Hirschfield
2015; Loftin et al. 2003). Indeed, comparisons with recent crowd-sourced and media-ini-
tiated data collection projects suggest that the SHR only captures a subset of all police-
involved killings (Loftin et al. 2003). In particular, SHR includes 40.3% fewer cases com-
pared to our own data in 2013 and 2014 (more recent SHR data is not available). There
are two sources of missing information. First, SHR data are missing for 19.5% of the cities
in our sample. Second, cities that are part of SHR underreport the number of cases by
29.5%. Biased reporting is a concern considering that police agencies make their own de-
cisions about contributing to SHR. Another possible reason for the discrepancies is that
SHR focuses on police-involved homicides whereas our own definition is broader and
directly motivated by our research interest. Klinger (2012) discusses these limitations and
concludes that previous research is “troubling because it produces findings about the
correlates of deadly police violence that are of dubious validity” (Klinger 2012:79). To
address this problem, we construct a comprehensive database of officer-involved killings
between January 2013 and June 2016. The database is based on our definition of officer-
involved killings. It uses crowd-sourced and newspaper collected information from “Fa-
tal Encounters”, The Counted from the Guardian, and the Washington Post. We verify
and extend this information with our own data collection and coding. The construction
of the database proceeded through five steps and is described in Appendix A. We link
our database to other data sources about population characteristics, crime and police
agencies, which is key to understand the determinants of police killings. There are several

17
important advantages of our database compared to SHR or other official statistics on of-
ficer-involved killings. It is more complete, unaffected by reporting bias, representative
of the entire United States, and based on a clear definition of officer-involved killings.
Estimation Strategy and Model Specification
Our analysis uses the number of officer-involved killings of African Americans and non-
Hispanic whites in each city as the dependent variable and various group-threat
measures, crime rates and minority representation in the police force as the main inde-
pendent variables. The outcome is a count variable confined to positive integers. Poisson
regressions are well suited to model such count data. However, the underlying distribu-
tion assumes that the mean and variance are equal (Gelman and Hill 2007:114; Hilbe
2011). An alternative is to model the number of police killings with negative binomial
regressions to allow for excess variability (over-dispersion) among the outcome (Long
and Freese 2005:Cha. 8).20 Formally, the model can be expressed as
!" = exp() + +", + -." + /"0 + 1") where !" is the number of officer involved killings in city 3. The coefficients in the vector
, for the different group threat measures in the matrix +" estimate the relation between
the main independent variables and the outcome variable conditional on the covariates
in /". The share of African American officers is represented by ." with the corresponding
coefficient -. To evaluate our argument that minority representation mitigates group
threat, we extend this model with two-way interaction terms between the group-threat
measures and the share of African-American officers 45(6"×.") etc.
20 An inflated number of zero counts are another common concern with count data (Gelman and Hill 2007:126). Zero-inflated models address this problem by using two components that correspond to differ-ent processes. The first is a binary model to analyze structural zeros and the second is a count model to predict the counts. There is, however, no reason to believe that the number of police killings is driven by two distinct processes (Allison 2012:Cha. 9 also see http://statisticalhorizons.com/zero-inflated-models).

18
Offset Variables: Modeling the Number, Rate per Population and Rate per Arrest
The negative binomial regressions model the number of officer-involved killings as a
function of various city characteristics but fail to standardize for a baseline (Hipp, Tita,
and Boggess 2011; Osgood 2000). They do not account for variations in the size of the
African-American population across cities or differences across racial groups in their ex-
posure to the police. Offset or exposure variables transform count models of officer-in-
volved killings to a model of per capita or per police-encounter rates (Osgood 2000). The
transformed models capture the risk or rate of police killings per population or per police-
citizen interaction. We define the exposure variable (also called offset) in two ways. First,
the offset is the natural logarithm of the population size in 100,000’s with a coefficient
that is fixed to 1. With this exposure variable, our models focus on the per capita rate of
officer-involved killings. Second, we use the natural logarithm of race-specific arrests in
100,000’s as an exposure or offset variable. Race-specific arrests are a proxy for police-
citizen interactions and therefore capture the number of officer-involved killings per ar-
rest. Killings per arrest adjust for the disproportionate minority exposure to police. Given
the number of arrests, the analyses capture whether police officers act differently and
presumably feel more threatened in interactions with minority citizens. They account for
an important reason of the disproportionate risk faced by African-Americans (see begin-
ning of results sections for a more detailed discussion). Accordingly, we conduct separate
analysis for the number of police killings, the rate per population, and the rate per arrest as
three important dimensions for our understanding of officer-involved killings.
Multicollinearity and Influential Outliers
We supplement our analysis with several regression diagnostics. First, we assess the
goodness of fit by comparing the empirical with the fitted count of officer-involved kill-
ings (Kleiber and Zeileis 2016). The results show a close alignment between the expected

19
and observed counts indicating that overdispersion and/or excess zero counts are not a
problem with our modeling strategy. Various test statistics confirm this conclusion. Se-
cond, we test for multicollinearity. Multicollinearity occurs when two or more covariates
are highly correlated and can lead to erratic changes in coefficient estimates. To quantify
the severity of multicollinearity, we calculate the variance inflation factor (VIF) in ordi-
nary least squares regressions that replicate our main analysis. The results reveal one
problem. The VIF value for proportion black is 9.4. This value is close to the critical level
of 10 with potentially serious consequences for coefficient estimates (Neter et al. 1996:
387). The main reason for the high VIF value is the close relation between proportion
black in the population and among city council members (the Pearson correlation coeffi-
cient is 0.85). Removing the proportion of black council members from the regression
reduces the VIF value for the proportion black residents to 5.3, which might lead to in-
flated standard errors but not significant distortions in the coefficient estimates (Neter et
al. 1996: 387). To address this problem, we carefully include different combinations of the
two variables in the regression models below. The key findings remain the same. For
other variables, the VIF value remains below 4.2 so that other variables are not seriously
affected by multicollinearity. Finally, we conduct sensitivity analyses to examine whether
influential outliers affect our results. An examination of studentized residuals and Cook’s
D reveals between 1 and 4 potential outliers in the different model specifications. Many
of the cases are cities with a small African-American population and one officer-involved
killing of African-Americans. As a result, the rate per population (or per arrests) is sub-
stantially higher than predicted based on our model. For example, Arvada City in Colo-
rado has 828 African-American residents and one incident in which the police killed an
African-American, which translates to about 120 police-killings per 100,000 black resi-
dents – the highest rate observed in our sample. To address problems related to influen-
tial outliers, we re-estimate our models after removing influential cases. The results do
not indicate any changes to our substantive findings.

20
Variables and Missing Data
The dependent variable is the number of officer-involved killings in each city between
January 2013 and June 2016. Aggregating multiple years of data is important considering
the low number of cases in many jurisdictions. The main independent variables are pop-
ulation and crime-related measures of group threat, minority representation in police de-
partments, and a comprehensive set of control variables that adjust for other important
determinants of police killings. The variables used in the analysis are based on the U.S.
Census, crime data from the F.B.I. Uniform Crime Reports, and information on police
agencies from the Law Enforcement Management and Administrative Statistics (LEMAS)
data series collected by the Bureau of Justice Statistics. Table 1 includes a list of all varia-
bles together with basic summary statistics.
[Table 1 about here]
We focus on four measures of group threat. These measures are an important part
of our theoretical argument outlined above and capture political, economic and crime
threat as distinct dimensions of group threat.
First, we measure the proportion of African-Americans in each city based on data
from the 2010 United States Census. The size of the minority population is central to the
minority threat hypothesis. While the measure is tied to different forms of threat, it is
particularly closely related to political threat as a proxy for the voting population (the
correlation between the general and voting population is 0.96).
Second, we measure political threat as the proportion of African-American political
representation in the city council (e.g. LaVeist 1992; Shihadeh and Flynn 1996; Stults and

21
Baumer 2007).21 The measure captures whether African-Americans have made inroads in
the political system. This challenge to the political status of whites is particularly salient
and shapes whites’ perception of threat. However, if the black political officials achieve
majority, the political influence of blacks should increase and as a result the amount of
social control over blacks should decline (Blalock 1969; Horowitz 1985; Turk 1969). To
capture this curvilinear linear relation predicted by Blalock and others, we also test for a
non-linear relation with a quadratic term in the regression equation.
Third, we measure economic threat as the white unemployment rate (Eitle 2002; Ja-
cobs & Wood 1999; Olzak 1992). Many prior studies used measures that are not race-
specific such as the Gini index (e.g. Liska and Chamlin 1984). The white unemployment
rate is sensitive to race and captures variations across cities in the economic status of
whites and therefore the potential level of economic threat posed by minority groups.
Fourth, we use the black-on-white homicide rate based on data from the UCR Sup-
plementary Homicide Report (SHR) from 2009 to 2013 to measure threat of black crime.
Homicides are salient and induce fear among whites, which is at the core of the argument
about black crime threat. Like the outcome variable, cross-racial homicides are rare. To
address this problem, we define our measure as the number of black-on-white homicides
per 100,000 residents over a five-year period. The models also condition for the black-on-
black homicide rate as a control variable defined in the same way.
The second central concept is the minority representation in police departments. We
measure minority representation with two distinct variables. First, we use the proportion
of African-American sworn police officers for our main analysis presented below. The
key theoretical argument about increased police legitimacy, the knowledge and empathy
of minority officers, and the attenuation of tensions between the police and African-
21 The data was obtained from the International City/County Management Association (ICMA), which surveys 8,000 cities every five years. Missing information was completed by our own online searches.

22
American communities is directly related to the presence of black police officers. We code
the variable so that a one unit change corresponds to a 10% increase in the share of Afri-
can-American officers, which allows for an easy and compelling interpretation of the
findings. Second, we use the Proportional Representation Index (PRI) based on the Equal
Employment Opportunity Index in supplementary analysis with similar results com-
pared to the ones presented below (Hickman and Piquero 2009; Lewis 1989; Ozkan et al.
2016; Smith 2003). It is defined as the proportion of African-American sworn police offic-
ers divided by the proportion of African-American residents in the population. Both
measures are based on data from the 2013 Law Enforcement Management and Adminis-
trative Statistics (LEMAS) data series collected by the Bureau of Justice Statistics.
Our analyses use two distinct offset variables: the logged, race-specific population
size in 100,000s and the logged number of race-specific (black or white) arrests from the
UCR “Arrests by Age, Sex, and Race” data-series. For details on the offset variables see
separate section above.
Finally, we include several control variables that adjust for other important deter-
minants of police killings. First, we include population characteristics based on the U.S.
Census and the American Community Survey 2010-2013 3-year estimates. The measures
are (a) the population density as the number of residents per square mile, (b) the race-
specific unemployment rate, and (c) black-white segregation measured in terms of the
dissimilarity index. The unemployment rate is a measure of socioeconomic disadvantage
and a key predictor in research on crime, disorder and policing (Jacobs and O’Brien 1998;
Sampson and Groves 1989; Taylor and Covington 1988). This link between the unem-
ployment rate and crime, disorder and policing makes it an important, potentially con-
founding control variable. The segregation or dissimilarity index is based on census tract
data from each of the cities in our sample. It is defined as 0.5× ;<= −
?<@
A"B5 where C" is
the black population in census tract 3, D is the total black population and E" and F are

23
the corresponding counts for whites. The index measures the spatial separation between
African-Americans and whites across census tracts in each city. Liska and Yu (1992) and
others have argued that segregated neighborhoods with concentrated minority popula-
tion might be especially threatening to the majority population. Accordingly, controlling
for segregation is important to adjust for the spatial arrangement of minority and major-
ity groups.
Next, we control for the violent crime rate based on the Uniform Crime Report
data series “Offenses Known and Clearances by Arrest”. The measure captures the over-
all level of crime and is defined as the number of violent crimes per 100,000 residents.22
Violent crime is an alternative explanation for police use force. In particular, the commu-
nity violence hypothesis postulates that police-caused deaths are largely driven by the
level of crime and violence in communities (Fyfe 1980; Jacobs and O’Brien 1998; Klinger
et al. 2016; Liska and Yu 1992; Ross 2015a; Smith 2003). In contrast to subjective percep-
tions of threat at the center of the group threat perspective, the community violence hy-
pothesis focuses on objective threats related to crime and violence. Adjusting for the gen-
eral crime rate is essential to rule out that police-caused killings are not just driven by
variations in crime across cities in the United States.
Third, we include a set of organizational police department factors. Hiring minor-
ity officers might be part of larger police reforms that increase legitimacy and reduce ex-
cessive force. Thus, our estimates for minority representation might be confounded by
other organizational factors. To address this problem, we include the number of officer
per 100,000 residents as a measure of police size, the proportion of female officers, an
index for community policing based on six indicators, and two indicator variables for the
presence of a personnel performance monitoring or assessment system for officers and a
22 The definition of violent crimes is based on the Uniform Crime Reports (UCR) part I. Violent crimes in-clude murder, manslaughter, forcible rape, robbery, and aggravated assault.

24
civilian complaint review board or agency for use of force complaints. The index for com-
munity policing is based on eight binary indicators from the LEMAS database (for a
similar measure see Smith and Holmes 2014).23 The two indicator variables are based on
the same data source.
Finally, we include indicator variables for geographic region and Black city ma-
jor.24 Controlling for geographic region adjusts for historical differences in race relations
and inequalities that continue to affect the presence (North, Midwest, South, Southwest,
and Northwest). Black city mayor adjusts for political arrangements in the city admin-
istration. Cities with an African-American mayor might be more progressive and re-
straint in their use of police against African-Americans.
Imputation of Missing Data
An important advantage of our database on police-caused deaths is that it covers the en-
tire United States so that there is no missing data on the dependent variable. There is,
however, missing information on several of the covariates. Most importantly, some police
departments do not report data to the Supplementary Homicide Report used for the five
year black-on-white homicide rate (Maltz 1999). Out of 266 cities in our main sample, 71
(27.7%) did not consistently report SHR data every single year and 26 cases (9.8%) never
23 It includes indicators for whether the mission statement refers to community policing, whether new re-cruits receive at least eight hours of training in community policing, whether sworn officers receive similar in-service training, whether officers are encouraged to engage in SARA-type problem solving, whether problem solving is part of officer evaluation, whether the police department has problem-solving partner-ships with local organizations, whether officers are assigned to specific areas and finally whether the de-partment uses information from a community survey about satisfaction with law enforcement (Cronbach's alpha is 0.72). 24 The information on black city mayors was obtained from http://blackdemographics.com/culture/black-politics/black-mayors/ (accessed on August 2, 2016).

25
reported data over the five-year period. Most cases without any reporting are from Flor-
ida, which did not report any SHR data over the last decade or so. We took two steps to
address this problem of potentially systematic missing data. First, we obtained complete
Florida SHR data from 1998 to 2014 through a Freedom of Information Act (FOIA) request
from the Florida Department of Law Enforcement. These data have previously been un-
available for research and addresses concerns about systematic missing SHR data. Se-
cond, we use data from single years and previous years to impute aggregated information
for the entire period.
Specifically, we use multiple imputation based on the chained equation approach
to impute missing SHR data and other missing values (Van Buuren and Groothuis-
Oudshoorn 2011). Aside from the variables and interaction terms that are part of the final
analyses, we include additional covariates based on previous years of UCR data. For ex-
ample, consider a department that reported SHR data in two years over the five-year
period from 2009 to 2013 and in some of the previous years. In this case, the aggregated
count is imputed from the two years with available information and from measures of
the black-on-white homicides rate in previous years (2004 to 2008). These additional var-
iables substantially improve our imputation model.
Results
[Figure 1 about here]
Across the United States, the police killed 3,833 people between January 2013 and June
2016, including 1,293 incidents in our sample of major cities with over 100,000 residents.
Figure 1 shows the geographical distribution of all incidents. African-Americans are dis-
proportionally affected by the lethal use of police force. Indeed, our data show that the
rate of police killings per 100,000 residents is 3.05 for African-Americans compared to

26
1.33 for non-Hispanic whites, a ratio of 2.29 killings of Blacks compared to non-Hispanic
Whites. This finding is in line with recent research based on various sampling and meas-
urement conditions (Miller et al. 2016; Ross 2015a; Zimring and Arsiniega 2015).
Several recent studies suggest that these racial disparities in police killings are
largely a result of differences by race in police exposure (Fryer 2016; Goff et al. 2016;
Miller et al. 2016; Mullainathan 2015). From this perspective, excessive rates of minority
arrests and police stops would explain the increased risk of police-caused deaths among
African-Americans, and not necessarily racial bias in officer’s decisions given a police
citizen-interaction. Miller et al (2016), for example, estimate that 1 out of 291 police stops
or arrests resulted in hospital-treated injury or death of a suspect or bystander with no
significant differences between racial and ethnic groups. Our own data show a similar
pattern. While the rate of police killings per population is substantially higher for Afri-
can-American than whites, the number of killings per arrest is roughly the same across
different racial groups. In particular, Table 2 shows that we find 31.38 police killings per
100,000 arrests for African-Americans compared to 21.69 for whites, again in our set of
cities with over 100,000 residents. Accordingly, the rate of police killings per arrests of
African-Americans is 45% higher compared to whites, which is substantially below the
130% difference in the risk for the rate per population. Focusing on arrests related specif-
ically to violent crimes further reduces the difference in the rate across racial groups.
[Table 2 about here]
This finding, based on previous research as well as our own data, points to the im-
portance of lowering arrests and police stops to reduce officer-involved killings. It does
not, however, rule out structural discrimination in policing or racial bias in the decision
to stop or arrest citizens as a driving factor for officer-involved killings. The finding also
ignores substantial variations across cities in the United States. Table 2 shows the number

27
of police killings, police killings per 100,000 residents, and police killings per 100,000 ar-
rests for non-Hispanic whites and African-Americans across major cities in the United
States (population over 500,000). The variations are substantial.
For example, Chicago has the highest number of officer-involved killings of African-
Americans with 36 cases between January 2014 and June 2016. This corresponds to a rate
of 4.17 per 100,000 residents and 43.12 per 100,000 arrests. For non-Hispanic whites, how-
ever, the rate is 0.23 per 100,000 residents and 6.99 per 100,000 arrests indicating that po-
lice-caused deaths per arrests are about 6.17 times higher among African-Americans com-
pared to whites. In other cities, however, this ratio between the number of police killings
per arrests among African-Americans and whites varies around 1.0, indicating that
Blacks and whites are equally likely to be killed by police given arrests as a metric to
estimate race differences in police-citizen interactions. These variations across cities in the
United States highlight the importance of “locally-resolved studies that address the prin-
ciple empirical drivers of police killings operating in a given county or [police] depart-
ment” (Ross 2015b:1). Focusing on cities with over 100,000 residents, the following anal-
ysis examines the structural correlates of the numbers of police killings, the rate per
100,000 residents, and rate per 100,000 arrests.
Structural Correlates of Police Killings across U.S. Cities
Focusing on cities with over 100,000 residents, we continue our analysis by reexamining
the role of racial threat as a key structural predictor of police use of deadly force. Whereas
most prior studies on police use of force focus on the share of the minority population,
we measure and examine political, economic and black crime threat as distinct and com-
plementary dimensions of minority threat. Table 3 presents the results from six negative-
binomial regression models. They show the relation between the different measures of
minority threat, population characteristics, crime rates and other factors with the number

28
and rate of officer-involved killings between January 2013 and June 2016 across 266 cities
in the United States. Table A3 presents the corresponding results for a larger set of cities
with over 50,000 residents. Models I – III present the results for African Americans and
Models IV and VI for whites.
[Table 3 about here]
Models I – III show that the proportion of African-Americans residents is unre-
lated to the number and rate of officer-involved killings of blacks after adjusting for a rich
set of covariates.25 This result is consistent across our three models for the number of po-
lice killings, the rate per capita and the rate per arrest. In additional analysis, we also
examine whether the relation between the proportion of African-Americans residents
and officer-involved killings is quadratic as suggested by the power-threat hypothesis.
However, we find no support for this argument (the coefficient estimate for the squared
term ranges from -0.04 to 0.18 with p-values consistently above 0.10). Instead, the coeffi-
cient for the size of the black population in Model I indicates that the number of police
killings of blacks is higher in cities with a larger black population. The risk of being killed
by the police defined as the rate of killings per population (Model II) or per arrests (Model
III), however, is unrelated to the proportion of African-American residents. These results
challenge the component of the minority threat hypothesis that is based on population
shares.
We next focus on three distinct measures for political, economic and crime threat
as more proximate predictors for minority threat that extend the focus on population
25 The negative point estimates are partly a result of the multicollinearity problems discussed in the data and methods section. Removing the proportion of black council members from the regression model sub-stantially reduces the point estimates for proportion black without other noticeable changes to the coeffi-cient estimates.

29
shares. In particular, our models include measures for the share of African-American city
council members as a measure of political threat, the white unemployment rate as a meas-
ure of economic threat, and the black-on-white homicide rate as a measure of crime
threat. The findings indicate that group threat is largely driven by the threat of black
crime. The incidence-rate ratio for the black-on-white homicide rate is 1.390, indicating
that a one standard deviation change in the black-on-white homicide rate is associated
with a 39.0% higher number of police killings of blacks.
We find a similar pattern for the rate of police killings per population and per ar-
rests. Indeed, the rate of officer-involved killings per population and per arrests is 28.7%
and 51.6% higher in cities with a one standard deviation change in the black-on-white
homicide rate respectively. Accordingly, black-on-white crime is associated both with the
number and with the rate of officer-involved killings per population and per arrest. This
finding indicates that the relation between black-on-white homicides and police killings
of African-Americans is not driven only by changes in the exposure of African-Americans
to the police. The relation is also based on changes in the way in which police-citizen
interactions play out insofar as the rate of killings per arrest partly captures whether po-
lice officers act differently and presumably feel more threatened in interactions with mi-
nority citizens.
The black-on-black homicides rate and measures for political and economic threat,
however, are unrelated to the number and rate of police killings of African-Americans.
Separate models with a quadratic term for the proportion of black council members show
no support for a curve-linear relation as suggested by the power-threat hypothesis. Po-
lice-caused deaths of whites are driven by different factors (see Model IV and VI). They
are unrelated to black-on-white homicide rates, minority population shares and others
measures of group threat. Instead, the violent crime rate and economic conditions are an
important predictor suggesting that (deadly) force against whites is largely driven by the
level of crime and violence in communities.

30
These findings revisit and improve previous research on group threat and the
structural determinants of police-caused deaths. They reveal a clear race-specific pattern.
Officer-involved shootings of African-Americans are higher in cities with a higher rate of
black-on-white homicides whereas black-on-black homicides and measures for political
and economic threat are unrelated to police killings. This pattern suggests a race-specific
response to crime with a high value attached to a white victim and racial fears of author-
ities that lead to both a higher number and rate of police killings. Officer-involved shoot-
ings of whites, however, are simply a function of violent crimes and economic conditions
indicating that the level of crime and violence is the primary predictor.
Group Threat and the Race Gap in America’s Police Departments
[Figure 2 about here]
In the second part of our analysis, we focus on the relationship between minority repre-
sentation in police departments and the use of deadly police force. Our argument sug-
gests that a high share of African-American police officers in a department not only re-
duces the number of officer-involved killings, but more importantly mitigates various
factors associated with group threat. To examine this argument, we extend our model
with the proportion of black sworn officers and also an interaction term of black police
officer share with our measure of black-on-white crime. We code the proportion of black
officers so that one-unit refers to a 10% change. Supplementary analysis with similar re-
sults focus on the proportional representation index (PRI) defined as the share of black
police officers divided by the share of the black population.
Figure 2 illustrates the two variables across our sample. It shows the share of black
police officers and black population on the left side and the distribution of the index on
31
the right side across the cities in our sample. A value of one indicates equal representation
insofar the share of African-Americans in the police force is the same as the share in the
general population. Lower values indicate an underrepresentation of African Americans
in the police.
Table 4 presents the results from the negative binomial regressions. Table A2
shows the same results for white victims and Table A4 shows results for our larger set of
cities of over 50,000 residents. Models I - III first show the effect of the proportion of Black
officers on the number of police-caused deaths, the rate per population and the rate per
arrest. The point estimates for the proportion of Black officers are negative and substan-
tial, indicating that the number and rate of officer-involved killings of blacks might be
lower in cities with a higher share of black officers in the police force. However, the coef-
ficient estimates are not statistically significant, so that we cannot draw clear conclusions
about the relation between the rate of police killings and the representation of African-
Americans in the police force. Still, this finding is in line with previous research showing
mixed evidence for the effect of minority representation in police departments (Hickman
and Piquero 2009; Smith 2003; Smith and Holmes 2014). Accordingly, the finding about
an overall effect of Black officer representation on the number and rate of officer-involved
killings of blacks is inconclusive.
[Table 4 about here]
Models IV – VI extend the regressions with an additional interaction term between
the proportion of black officers and the black-on-white homicide rate as our measure of
group threat. The interaction term is negative and substantial across the different models
for the number and rate of officer-involved killings. It indicates that the proportion of
black officers decreases the effect of crime threat. The incidence-rate ratio for the black-
on-white homicide rate is 1.26 when the proportion of black officers is at the mean of 11%.

32
At this level, a one standard deviation change in the black-on-white homicide rate corre-
sponds to a 26% higher number of officer-involved killings of blacks. In cities with a
higher level of African-American officers in the police department, however, the strength
of the relation is lower or, correspondingly, higher at lower representation levels. This
pattern is consistent across the three models with diverse outcome measures: the number
of police-caused deaths, the rate per population and the rate per arrest.
Accordingly, the proportion of black officers and the black-on-white homicide rate
is not only related to the number of police killings of African-Americans but also the rate
per population and the rate per arrest. Figure 3 illustrates this pattern for the black-on-
white homicide rate. It shows the incidence-rate ratio for a one standard deviation change
in the black-on-white homicide rate as a function of the proportion of black officers. The
marginal distribution of the proportion of black officers across the police departments in
our sample is shown on the x-axis. In cities with no African-American police officers, the
conditional marginal effect is large with a 40.6% increase in the number of officer-in-
volved killings of blacks for a one standard deviation change in the black-on-white hom-
icide rate. Similarly, the rate of officer-involved killings per arrests is 83.7% higher when
the black-on-white homicide rate changes by one standard deviation. As the representa-
tion of African-Americans in the police improves, however, the effect of a one standard
deviation change in the black-on-white homicide rate decreases substantially. In depart-
ments at the extreme with about half of African-American police officers (3.0% of depart-
ments), the conditional marginal effect is around zero for the number and rate of officer-
involved killings.
[Figure 3 about here]
A central concern is that other police reforms confound the coefficient estimates
for the proportion of African-American officers. Indeed, hiring minority officers might be

33
part of a series of police reforms that are designed to increase legitimacy and reduce ex-
cessive force. The regression results presented above, however, control for prominent po-
lice reforms including an index of community policing, two indicator variables for the
presence of a civilian complaint review board and a performance monitoring system, and
the proportion of female police officers. The findings remain consistent and are in line
with earlier research showing that officer representation is important independent of
other police reforms (Smith and Holmes 2014; Willits and Nowacki 2014). Moreover, the
effects of officer racial composition are not racially symmetrical. Table A2 presents the
same results for non-Hispanic whites. They show that the representation of African-
Americans is unrelated to the number and rate of white police shootings. This finding
supports the argument that racial dynamics rather than other organizational factors are
the key mechanism explaining the observed pattern.
Overall, it remains unclear whether the representation of African-American in the
police is related to the number and rate of officer-involved killings itself. But the interac-
tion term indicates that inclusive police departments with a high proportion of African-
American officers are less sensitive to minority threat. A diverse police force mitigates
group threat and thereby reduces the number and rate of officer-involved killings.
Conclusion
Understanding the structural determinants of officer involved killings across the United
States is a nascent research area (Hirschfield 2015; Klinger 2012; Zimring forthcoming).
Aided by a comprehensive and unique data collection effort, this study makes important
progress towards understanding the structural factors that drive police killings. But the
implications are broader. Officer-involved killings represent the end of a continuum of
force, so that the findings inform a much larger universe of police behaviors.
34
Accordingly, the contributions of our analyses are manifold. First, our results re-
visit and improve previous research on group threat. They indicate that police-caused
killings of African-Americans are not simply driven by population shares, as suggested
by previous studies. Instead, they reveal a race-specific pattern in the ways in which the
police respond to crime. Indeed, the black-on-white homicide rate is a significant predictor
of officer-involved killings whereas black-on-black homicides and measures for political
and economic threat are unrelated to police killings. Similar to recent research focused on
arrest rates and the size of the police force (Eitle et al. 2002; Stults and Baumer 2007), these
results provide support for the threat of black crime hypothesis. The finding that police
killings of African-Americans increase as a function of the black-on-white homicide rate
is consistent with a body of social science evidence of police discrimination toward mi-
nority citizens observed by social scientists under a wide variety of sampling and meas-
urement conditions (Epp, Maynard-Moody, and Haider-Markel 2014; Gelman, Fagan,
and Kiss 2007; Kochel, Wilson, and Mastrofski 2011; Legewie 2016; see, generally O’Fla-
herty 2015). Several studies find that when blacks victimize whites, the high value at-
tached to a white victim and the racial fears of authorities engender severe treatment
(Baldus, Woodworth, and Pulaski 1990; Paternoster, Brame, and Bacon 2007).
Second, minority representation in the police might not reduce the number of of-
ficer-involved killings itself, but their presence mitigates group threat. Indeed, our find-
ings indicate that the relation between black-on-white homicide rate and the number of
officer-involved killings is weaker in settings with increasing representation of African-
Americans in the police force. These findings make new and substantial contributions to
our understanding of a highly contentious social, cultural and political issue. They indi-
cate that group threat continues to be an important driver of officer-involved killings.
These findings have implications for a decades old push to diversify the nation’s
police-forces. Prior research on the benefits of a diverse police force reached no conclu-
sion. Other than a normative argument, there was no reliable evidence that a diverse

35
police force was either more effective in responding to crime, or able to bridge the racial
breach in trust in the police. Our results provide evidence that a high proportion of black
officers might not necessarily reduce the number of officer-involved killings directly, but
mitigates the role of group threat and thereby eases tensions between the police and Af-
rican-American communities.
Third, our study has broader implications for group-threat theories and minority
representation in state agencies and bureaucracies. Previous research on group threat has
generally emphasized the interest of the dominant group as a driving factor for minority
threat (for an exception see Holmes 2000; Smith and Holmes 2014). From this perspective,
police use of (deadly) force is driven by structural factors that create pressure to maintain
racial hierarchies and inequalities. Our argument, however, highlights the importance of
considering the police as a distinct social group that contributes to the ways in which
group threat plays out. From this perspective, the police, both through behavior and their
social identity, can aggravate or alleviate intergroup conflict, such as through the diver-
sity of police officers. This argument extends previous research on inter-group conflict
and group threat that has largely focused on population dynamics without considering
the mediating role of state agencies. It also points to the importance of minority represen-
tation in bureaucracies as a social good. Indeed, a diverse workforce is an important issue
in nearly every sector of society. While previous research has largely focused on the role
of descriptive representation in parliament or public office for substantive representation
on policy issues (e.g. Lloren 2015) or on minority and women representatives as role mod-
els (e.g. Beaman et al. 2012), our research shows that minority representation in govern-
ment bureaucracies or the police can mitigate conflict and group threat.
Finally, we compile a comprehensive database of police-caused killings between
January 2013 and June 2016 that can aid further inquiry into the determinants of police
killings. Previous research largely relied on data about “justifiable homicides of felons”
irregularly reported to the Federal Bureau of Investigation (FBI) by a non-representative

36
subset of police agencies. While it is impossible to determine whether our database is
complete, the information is far more comprehensive than government sources, unaf-
fected by reporting bias, representative of the entire United States, and based on a clear
definition of officer-involved killings. The 2004 National Research Council Committee to
Review Police Policy and Practices asserted that “there is no more important piece of data
regarding police behavior than that on the exercise of lethal force” (Skogan and Frydl
2004:157). We make our database available to other researchers to advance research on
officer-involved killings.
While our dataset on police killings overcomes important data limitations from pre-
vious research and the analyses control for important covariates, the findings are limited
by the observational nature of the data (Legewie 2012; Morgan and Winship 2014). Future
research should use experimental or quasi-experimental designs to examine the role of a
diverse police force for the police use of (deadly) force and other outcomes.
References
Allison, Paul. 2012. Logistic Regression Using SAS: Theory and Application. Cary, N.C: SAS
Institute.
Allport, Gordon W. 1954. The Nature Of Prejudice. Cambridge: Perseus Books.
Antonovics, Kate and Brian G. Knight. 2009. “A New Look at Racial Profiling: Evidence
from the Boston Police Department.” Review of Economics and Statistics 91(1):163–
77.
Anwar, Shamena and Hanming Fang. 2006. “An Alternative Test of Racial Prejudice in
Motor Vehicle Searches: Theory and Evidence.” American Economic Review
96(1):127–51.

37
Baldus, David C., George Woodworth, and Charles A. Pulaski. 1990. Equal Justice and the
Death Penalty: A Legal and Empirical Analysis. Boston: Northeastern University
Press.
Banducci, Susan A., Todd Donovan, and Jeffrey A. Karp. 2004. “Minority Representa-
tion, Empowerment, and Participation.” Journal of Politics 66(2):534–556.
Barber, Catherine et al. 2016. “Homicides by Police: Comparing Counts From the Na-
tional Violent Death Reporting System, Vital Statistics, and Supplementary Hom-
icide Reports.” American Journal of Public Health 106(5):922–27.
Baumer, Eric P., Steven F. Messner, and Richard Rosenfeld. 2003. “Explaining Spatial
Variation in Support for Capital Punishment: A Multilevel Analysis.” American
Journal of Sociology 108(4):844–875.
Beaman, Lori, Esther Duflo, Rohini Pande, and Petia Topalova. 2012. “Female Leader-
ship Raises Aspirations and Educational Attainment for Girls: A Policy Experi-
ment in India.” Science 335(6068):582–86.
Bell, Jeannine. 2002. Policing Hatred: Law Enforcement, Civil Rights, and Hate Crime. NYU
Press.
Blalock, Hubert M. 1967. Toward a Theory of Minority-Group Relations. New York: Capri-
corn Books.
Blumer, Herbert. 1958. “Race Prejudice as a Sense of Group Position.” The Pacific Socio-
logical Review 1(1):3–7.
Bohannon, John. 2016. “Mechanical Turk Upends Social Sciences.” Science
352(6291):1263–64.

38
Bolton, Kenneth and Joe Feagin. 2004. Black in Blue: African-American Police Officers and
Racism. Routledge.
Burch, Andrea M. 2011. “Arrest-Related Deaths, 2003-2009 - Statistical Tables.”
Burghart, Brian. 2016. “Fatal Encounters: A Step toward Creating an Impartial, Compre-
hensive and Searchable National Database of People Killed during Interactions
with Law Enforcement.”
Chambliss, William J. 2001. Power, Politics, and Crime. Boulder, Colo: Westview Press.
Close, Billy R. and Patrick Leon Mason. 2007. “Searching for Efficient Enforcement: Of-
ficer Characteristics and Racially Biased Policing.” Review of Law & Economics
3(2):263–321.
Dawson, Michael C. 1994. Behind the Mule: Race and Class in African-American Politics.
Princeton University Press.
Dubber, Markus D. 2015. An Introduction to the Model Penal Code. New York: Oxford
University Press.
Eitle, D., S. J. D’Alessio, and L. Stolzenberg. 2002. “Racial Threat and Social Control: A
Test of The Political, Economic, and Threat of Black Crime Hypotheses.” Social
Forces 81(2):557–76.
Enos, Ryan D. 2016. “What the Demolition of Public Housing Teaches Us about the Im-
pact of Racial Threat on Political Behavior.” American Journal of Political Science
60(1):123–42.
Epp, Charles R., Steven Maynard-Moody, and Donald P. Haider-Markel. 2014. Pulled
Over: How Police Stops Define Race and Citizenship. University of Chicago Press.

39
Fagan, Jeffrey, Anthony A. Braga, Rod K. Brunson, and April Pattavina. 2016. “Stops
and Stares: Street Stops, Surveillance, and Race in the New Policing.” Fordham
Urban Law Journal 43.
Fagan, Jeffrey and Amanda Geller. 2010. Profiling and Consent: Stops, Searches and Sei-
zures after Soto. Rochester, NY: Social Science Research Network.
Flanders, Chad and Joseph C. Welling. 2016. “Police Use of Deadly Force: State Statues
30 Years after Garner.” St. Louis University Public Law Review, Forthcoming.
Fryer, Roland G. 2016. An Empirical Analysis of Racial Differences in Police Use of Force.
National Bureau of Economic Research.
Fyfe, James J. 1980. “Geographic Correlates of Police Shooting: A Microanalysis.” Jour-
nal of Research in Crime and Delinquency 17(1):101–13.
Gay, Claudine. 2002. “Spirals of Trust? The Effect of Descriptive Representation on the
Relationship between Citizens and Their Government.” American Journal of Politi-
cal Science 46(4):717–32.
Gelman, Andrew, Jeffrey Fagan, and Alex Kiss. 2007. “An Analysis of the New York
City Police Department’s ‘Stop-and-Frisk’ Policy in the Context of Claims of Ra-
cial Bias.” Journal of the American Statistical Association 102(479):813–23.
Gelman, Andrew and Jennifer Hill. 2007. Data Analysis Using Regression and Multi-
level/Hierarchical Models. Cambridge: Cambridge University Press.
Goff, Phillip Atiba, Tracey Lloyd, Amanda Geller, Steven Raphael, and Jack Glaser.
2016. The Science of Justice: Race, Arrests, and Police Use of Force. Center for Polcing
Equity.

40
Goldstein, Herman. 1977. “Policing a Free Society.” Policing a Free Society Cambridge,
Mass: Ballinger Pub. Co.
Hickman, Matthew J. and Alex R. Piquero. 2009. “Organizational, Administrative, and
Environmental Correlates of Complaints About Police Use of Force Does Minor-
ity Representation Matter?” Crime & Delinquency 55(1):3–27.
Hilbe, Joseph M. 2011. Negative Binomial Regression. Cambridge University Press.
Hipp, John R., George E. Tita, and Lyndsay N. Boggess. 2011. “A New Twist on an Old
Approach: A Random-Interaction Approach for Estimating Rates of Inter-Group
Interaction.” Journal of Quantitative Criminology 27(1):27–51.
Hirschfield, Paul J. 2015. “Lethal Policing: Making Sense of American Exceptionalism.”
Sociological Forum 30(4):1109–17.
Holmes, Malcolm D. 2000. “Minority Threat and Police Brutality: Determinants of Civil
Rights Criminal Complaints in U.S. Municipalities.” Criminology 38(2):343–368.
Jackson, Pamela I. and Leo Carroll. 1981. “Race and the War on Crime: The Sociopoliti-
cal Determinants of Municipal Police Expenditures in 90 Non-Southern US Cit-
ies.” American Sociological Review 46(3):290–305.
Jacobs, David and Jason T. Carmichael. 2002. “The Political Sociology of the Death Pen-
alty: A Pooled Time-Series Analysis.” American Sociological Review 67(1):109–31.
Jacobs, David, Jason T. Carmichael, and Stephanie L. Kent. 2005. “Vigilantism, Current
Racial Threat, and Death Sentences.” American Sociological Review 70(4):656–77.

41
Jacobs, David and Robert M. O’Brien. 1998. “The Determinants of Deadly Force: A
Structural Analysis of Police Violence.” American Journal of Sociology 103(4):837–
62.
King, Ryan D. and Darren Wheelock. 2007. “Group Threat and Social Control: Race,
Perceptions of Minorities and the Desire to Punish.” Social Forces 85(3):1255–80.
Kleiber, Christian and Achim Zeileis. 2016. “Visualizing Count Data Regressions Using
Rootograms.” The American Statistician 70(3):296–303.
Klinger, David A. 2008. “On the Importance of Sound Measures of Forceful Police Ac-
tions.” Criminology & Public Policy 7(4):605–17.
Klinger, David A. 2012. “On the Problems and Promise of Research on Lethal Police Vi-
olence A Research Note.” Homicide Studies 16(1):78–96.
Klinger, David, Richard Rosenfeld, Daniel Isom, and Michael Deckard. 2016. “Race,
Crime, and the Micro-Ecology of Deadly Force: Micro-Ecology of Deadly Force.”
Criminology & Public Policy 15(1):193–222.
Kochel, Tammy Rinehart, David B. Wilson, and Stephen D. Mastrofski. 2011. “Effect of
Suspect Race on Officers’ Arrest Decisions.” Criminology 49(2):473–512.
LaVeist, Thomas A. 1992. “The Political Empowerment and Health Status of African-
Americans: Mapping a New Territory.” American Journal of Sociology 1080–1095.
Legewie, Joscha. 2012. “Die Schätzung von Kausalen Effekten: Überlegungen Zu Me-
thoden Der Kausalanalyse Anhand von Kontexteffekten in Der Schule.” Kölner
Zeitschrift Für Soziologie Und Sozialpsychologie 64(1):123–53.

42
Legewie, Joscha. 2016. “Racial Profiling and Use of Force in Police Stops: How Local
Events Trigger Periods of Increased Discrimination.” American Journal of Sociology
122(2):379–424.
Lewis, William G. 1989. “Toward Representative Bureaucracy: Blacks in City Police Or-
ganizations, 1975-1985.” Public Administration Review 49(3):257.
Liska, Allen E. 1992. Social Threat and Social Control. Albany: SUNY Press.
Liska, Allen E. and Mitchell B. Chamlin. 1984. “Social Structure and Crime Control
among Macrosocial Units.” American Journal of Sociology 383–395.
Liska, Allen E. and Jiang Yu. 1992. “Specifying and Testing the Threat Hypothesis: Po-
lice Use of Deadly Force.” P. 53- in Social Threat and Social Control, edited by A. E.
Liska. SUNY Press.
Lloren, Anouk. 2015. “Women’s Substantive Representation: Defending Feminist Inter-
ests or Women’s Electoral Preferences?” The Journal of Legislative Studies
21(2):144–67.
Loftin, Colin, Brian Wiersema, David McDowall, and Adam Dobrin. 2003. “Underre-
porting of Justifiable Homicides Committed by Police Officers in the United
States, 1976-1998.” American Journal of Public Health 93(7):1117–1121.
Long, J.Scott and Jeremy Freese. 2005. Regression Models for Categorical Dependent Varia-
bles Using Stata. 2nd ed. College Station, Texas: Stata Press.
Maltz, Michael D. 1999. Bridging Gaps in Police Crime Data. Washington, D.C.: Bureau of
Justice Statistics.

43
Mansbridge, Jane. 1999. “Should Blacks Represent Blacks and Women Represent
Women? A Contingent ‘Yes.’” The Journal of Politics 61(03):628–657.
Miller, Ted R. et al. 2016. “Perils of Police Action: A Cautionary Tale from US Data
Sets.” Injury Prevention injuryprev-2016-042023.
Morgan, Stephen L. and Christopher Winship. 2014. Counterfactuals and Causal Inference:
Methods and Principles for Social Research. Cambridge: Cambridge University
Press.
Mullainathan, Sendhil. 2015. “Police Killings of Blacks: Here Is What the Data Say - NY-
Times.com.”
O’Flaherty, Brendan. 2015. The Economics of Race in the United States. Cambridge, MA:
Harvard University Press.
Osgood, D.Wayne. 2000. “Poisson-Based Regression Analysis of Aggregate Crime
Rates.” Journal of Quantitative Criminology 16(1):21–43.
Ozkan, Turgut, John L. Worrall, and Alex R. Piquero. 2016. “Does Minority Representa-
tion in Police Agencies Reduce Assaults on the Police?” American Journal of Crimi-
nal Justice 41(3):402–23.
Paternoster, Raymond, Robert Brame, and Sarah Bacon. 2007. The Death Penalty: Amer-
ica’s Experience with Capital Punishment. New York: Oxford University Press.
Pettigrew, Thomas F. 1998. “Reactions Toward the New Minorities of Western Europe.”
Annual Review of Sociology 24(1):77–103.
Planty, Michael et al. 2015. Arrest-Related Deaths Program: Data Quality Profile. U.S. De-
partment of Justice.

44
Portes, Alejandro and Julia Sensenbrenner. 1993. “Embeddedness and Immigration:
Notes on the Social Determinants of Economic Action.” American Journal of Sociol-
ogy 98(6):1320–1350.
Quillian, Lincoln. 1995. “Prejudice as a Response to Perceived Group Threat: Population
Composition and Anti-Immigrant and Racial Prejudice in Europe.” American So-
ciological Review 60(4):586–611.
Ross, Cody T. 2015a. “A Multi-Level Bayesian Analysis of Racial Bias in Police Shoot-
ings at the County-Level in the United States, 2011–2014.” PLoS ONE
10(11):e0141854.
Ross, Cody T. 2015b. “Identifying the Drivers of the Exceptionally-High Rates of Lethal
and Racially-Biased Violence by Police in the United States Requires Geograph-
ically-Resolved Data and Analysis.” Sociological Forum.
Rubin, Donald B. 2004. Multiple Imputation for Nonresponse in Surveys. John Wiley &
Sons.
Sampson, Robert J. and W.Byron Groves. 1989. “Community Structure and Crime: Test-
ing Social-Disorganization Theory.” American Journal of Sociology 94(4):774–802.
Scherer, Nancy and Brett Curry. 2010. “Does Descriptive Race Representation Enhance
Institutional Legitimacy? The Case of the U.S. Courts.” The Journal of Politics
72(01):90–104.
Shihadeh, Edward S. and Nicole Flynn. 1996. “Segregation and Crime: The Effect of
Black Social Isolation on the Rates of Black Urban Violence.” Social Forces
74(4):1325–52.

45
Simien, Evelyn M. 2005. “Race, Gender, and Linked Fate.” Journal of Black Studies
35(5):529–50.
Skogan, Wesley and Kathleen Frydl. 2004. Fairness and Effectiveness in Policing: The Evi-
dence. Washington, DC: National Academies Press.
Smith, Brad and Malcolm D. Holmes. 2014. “Police Use of Excessive Force in Minority
Communities: A Test of the Minority Threat, Place, and Community Accounta-
bility Hypotheses.” Social Problems 61(1):83–104.
Smith, Brad W. 2003. “The Impact of Police Officer Diversity on Police-Caused Homi-
cides.” Policy Studies Journal 31(2):147–62.
Sorensen, Jonathan R., James W. Marquart, and Deon E. Brock. 1993. “Factors Related to
Killings of Felons by Police Officers: A Test of the Community Violence and Con-
flict Hypotheses.” Justice Quarterly 10(3):417–440.
Stokes, L. D. 1997. “Minority Groups in Law Enforcement.” in Contemporary policing:
Personnel, issues and trends, edited by M. L. Dantzker. Boston: Butterworth Heine-
man.
Stults, Brian J. and Eric P. Baumer. 2007. “Racial Context and Police Force Size: Evaluat-
ing the Empirical Validity of the Minority Threat Perspective.” American Journal
of Sociology 113(2):507–46.
Sun, Ivan Y. and Brian K. Payne. 2004. “Racial Differences in Resolving Conflicts: A
Comparison between Black and White Police Officers.” Crime & Delinquency
50(4):516–41.
Taylor, Ralph B. and Jeanette Covington. 1988. “Neighborhood Changes in Ecology and
Violence.” Criminology 26(4):553–90.

46
Theobald, N. A. and D. P. Haider-Markel. 2008. “Race, Bureaucracy, and Symbolic Rep-
resentation: Interactions between Citizens and Police.” Journal of Public Admin-
istration Research and Theory 19(2):409–26.
Turk, Austin T. 1966. “Conflict and Criminality.” American Sociological Review 31(3):338–
352.
Van Buuren, Stef and Karin Groothuis-Oudshoorn. 2011. “Mice: Multivariate Imputa-
tion by Chained Equations in R.” Journal of Statistical Software 45(3).
Walker, Samuel. 1985. “Racial Minority and Female Employment in Policing: The Impli-
cations of ‘glacial’ Change.” Crime & Delinquency 31(4):555–572.
Walker, Samuel and Charles M. Katz. 2011. The Police in America: An Introduction. Dubu-
que, Iowa: McGraw-Hill.
Walker, Samuel, Cassia Spohn, and Miriam DeLone. 2012. The Color of Justice: Race, Eth-
nicity, and Crime in America. Cengage Learning.
Weitzer, Ronald. 2000. “Racialized Policing: Residents’ Perceptions in Three Neighbor-
hoods.” Law & Society Review 34(1):129–55.
Willits, Dale W. and Jeffrey S. Nowacki. 2014. “Police Organisation and Deadly Force:
An Examination of Variation across Large and Small Cities.” Policing and Society
24(1):63–80.
Zimring, Franklin E. forthcoming. When Police Kill: The Character and Control of Violence
in Uniform. Cambridge MA: Harvard University Press (forthcoming).
Zimring, Franklin E. and Brittany Arsiniega. 2015. “Trends in Killing of and by Police: A
Preliminary Analysis.” Ohio State Journal of Criminal Law 13(1):247–64.

47
Appendix A - Construction of Database on Police Killings
The construction of our dataset is based on five steps. First, we use information from four
crowd-sourced and newspaper initiated data collection efforts. Most importantly, this in-
cludes information from “Fatal Encounters” (Burghart 2016) from January 2013 to June
2016. The goal of Fatal Encounters is to “create a comprehensive national database of
people who are killed through interactions with police” from 2000 to today (Burghart
2016). It is the most comprehensive data collection project that tracks officer-involved
killings over multiple years (for a comparison of different data sources see Table A1 and
subsection “Data Quality”). The project relies on paid researchers, public records requests
and crowd-sourced data. As of September 2016, the archive considers the information
complete from January 2013 to June 2016. Fatal Encounters includes information on any
interaction with police that results in death. This definition is broader compared to our
own definition and includes accidents and deadly domestic violence involving police of-
ficers as perpetrators. We supplement information from Fatal Encounters with three ad-
ditional data collection projects that only cover part of the entire period: “Mapping Police
Violence” from 2013 to 2015,26 “The Counted” from January 2015 to June 2016 compiled
by the Guardian,27 and data collected by the Washington Post from January 2015 to June
2016.28 These three data sources contain a small number of additional cases and allow us
to cross-validate information on race. From all four data sources, we identify 4,802 unique
cases.
Second, we use the coding scheme detailed in Box 1 to categorize all 4,802 unique
cases identified in the first step. The coding is done by two independent coders from
26 http://mappingpoliceviolence.org/ (accessed on August 17, 2016). 27 https://www.theguardian.com/us-news/ng-interactive/2015/jun/01/about-the-counted (accessed on July 22, 2016). 28 https://github.com/washingtonpost/data-police-shootings (accessed on July 22, 2016).

48
Amazon Mechanical Turk.29 Each coder received a short description of the incident and
was instructed to categorize the case into one of the four categories outlined in Box 1 with
the additional options for “other” and “unknown”. All cases with ambiguous coding
were examined by the authors (3.4% of all cases). 3,512 cases were classified as “Inten-
tional or purposeful”, 321 as “Unintentional but result of extremely reckless, reckless or
negligent use of force”, 135 as “Accidental unrelated to the use of force”, and 688 as “Self-
inflicted death or accident caused by suspect”. The following analysis focuses on the 3,833
cases in the first two categories excluding accidental and self-inflicted deaths. Accord-
ingly, many cases from Fatal Encounters were excluded considering that they do not fit
into our own definition of officer-involved killings.
Third, we verified and completed missing information for each of the 3,833 rec-
ords. While the database is comprehensive and well-maintained, there are occasional er-
rors and cases with missing information. Most important, information on victim race is
missing for about 30% of all cases and considered unreliable for others. To address this
problem, we use two independent coders from Amazon Mechanical Turk to verify and
complete the information for all 3,833 cases. We gave each coder the victim’s name, date
of the incident and the state in which it occurred. They were asked to collect information
on the race of the victim, the involved police agencies and the city in which the incident
occurred from newspaper sources. We personally cross-validated all cases for which the
information from Fatal Encounters, the first and second coders were not identical. This
cross-validation and the comparison between the two independent coders ensures the
29 Amazon Mechanical Turk (https://www.mturk.com/mturk) is an online platform or marketplace that allows researchers (known as Requesters) to post jobs (usually small data collection or coding tasks and surveys) (Bohannon 2016). Workers can select existing jobs and complete them for a monetary payment. The platform provides access to over 500,000 workers and thereby makes it possible to complete data col-lection and coding task within hours instead of months. A common critique of the platform is that it often involves sub-minimum wage labor. To ensure a fair compensation of workers, we coded 100 cases our-selves and used the time estimate to calculate an hourly wage of $13.

49
quality and accuracy of the data verification process. Aside from verifying key infor-
mation, the procedure completes information on the race of the victim for 74% of the cases
with missing information on victim’s race.
Fourth, we use name and place-based imputation for the remaining cases with
missing information on race. Our procedure largely resembles Enos’ approach (2016). It
uses information from the racial demographics of the census block where the victim lived
together with the likelihood that a victim’s surname is linked to a racial or ethnic group
based on the U.S. Census Bureau counts of names by race. For example, Smith as the most
common name in the United States is 73.4% white, 22.2% black, 0.4% Asian and Pacific
Islander, 0.9% American Indian, 1.6% mixed race, and 1.6% Hispanic. Following Enos
(2016), we combine the frequencies for each victim’s surname and the racial de-
mographics of the census block using Bayes’ rule (see Enos 2016 for details on the ap-
proach). Based on this approach, we obtain the probability that each victim is white,
black, Hispanic, Asian and Pacific Islander, American Indian, or mixed race.30
Finally, we link our database with population data from the U.S. Census, crime
data from the F.B.I. Uniform Crime Reports, and information on police agencies from the
Law Enforcement Management and Administrative Statistics (LEMAS) data series col-
lected by the Bureau of Justice Statistics. Linking each record to these different data
30 To account for the uncertainty inherent in these probabilities and the overall imputation proce-
dure, we obtain ten plausible race/ethnicities for each case with missing information based on random draws from a multinomial distribution using the name and place-based probabilities as parameters for the distribution. A victim that is 80% white and 20% black based on their name and address, for example, might receive eight plausible race values “white” and two plausible race “black” (note that for most cases the probability for one of the different racial/ethnic groups is above 80%). Similar to multiple imputation, we repeat all of our analyses for each of the different plausible values and combine the result using Ru-bin's (2004) repeated imputation summary statistics (for a similar approach to measurement error see Blackwell, Honaker, and King 2015; or Legewie and Schaeffer 2016 for an application to a different area). As a result, the final analyses account for the uncertainty from the imputation procedure.

50
sources requires matching keys for police agencies and census designated places (or
counties if the incident does not fall in a census designated place). In both cases, we use
name-based matching with manual corrections for cases without exact matches. As a re-
sult, we obtain the Originating Agency Identifier (ORI) code from the “Law Enforcement
Agency Identifiers Crosswalk” database created by the Bureau of Justice Statistics31 and
the census designated place 5-digit code. These matching keys allow us to link each case
to various data-sources including population data from the U.S. Census, crime data from
the F.B.I. Uniform Crime Reports, and information on police agencies from the Law En-
forcement Management and Administrative Statistics (LEMAS) data series.
The result of this procedure is a comprehensive database on officer-involved kill-
ings between January 2013 and June 2016. The database not only includes verified infor-
mation on all officer-involved killings but also links this information to other data
sources. Linking these different data sources is a key part of understanding the determi-
nants of police.
[Table A1 about here]
Data Quality
Table A1 compares our final database to Fatal Encounters (FE), The Counted from The
Guardian and The Washington Post’s list of police killings in 2015 (a comparison for 2013
and 2014 is not possible because the Counted and the Washington Post datasets only fo-
cus on 2015 and beyond). The table shows the number of cases in 2015 (“Cases”), the
number of cases that fit our definition of officer-involved killings (“Cases fitting our
31 The crosswalk includes over 36,000 law enforcement agencies in the United States and assigns each agency the Originating Agency Identifier (ORI) code, which makes it possible to merge various data sources that have no common match keys.

51
Def.”), the unique cases that were only found in this data source (“Unique Cases”), the
missing cases that are not part of this dataset (“Missing Cases”), and the proportion of
cases with missing information on race (“% Race Missing”). Of the three data sources, FE
is the most complete source. It includes 37 unique cases in 2015. We exclude many other
cases from FE because they do not fit our definition of officer-involved killings. However,
our dataset also includes 33 cases that are missing from FE in 2015. The Counted and the
Washington Post include less unique and substantially more missing cases (note that
Washington Post only focuses on shooting deaths). However, the quality of information
on victim’s race is substantially lower in the original FE database. Our coding procedure
described above substantially improves on that and is closely aligned with The Counted
and The Washington Post estimates. For 2015, there are just 14 cases or 1.2% for which
the race coding is not the same so that the error rate is very small.
Most importantly, there is substantial overlap between the different sources,
which increases our confidence in the completeness of our dataset. Overall, the compari-
son with the two alternative data sources indicates that (a) FE is the most complete enu-
meration of officer-involved shootings in 2015; (b) it is the only collection effort that co-
vers multiple years, and (c) the quality of the information on victim’s race is low in the
original database but substantially improved through our own data collection. The fact
that FE covers multiple year is important considering that our analyses of officer-in-
volved killings can aggregate data across years and thereby avoid scarcity by city due to
the low number of cases for many jurisdictions.
In sum, it is impossible to ascertain whether there are police killings that eluded
our data collection process. Indeed, extrapolating from our comparison based on data
from 2015 suggests that we might miss 66 cases in 2013 and 2014 or about 1.7% of our
entire enumeration. This estimate is even smaller for major cities (0.8%), which are the
focus of our analysis. But the database is far more complete than SHR or other commonly
used sources. In the two years with overlapping data (2013-2014), SHR contains 40.3%

52
fewer cases compared to our own data. This underreporting is partly based on selective
reporting of agencies (19.5% of the agencies in our sample do not report to SHR) and
partly based on underreporting by agencies that are part of SHR (in the cities that are part
of our sample and part of SHR, our database contains 29.5% more incidents).

53
Box 1 - Categorization of Officer-involved Killings
5. Intentional or purposeful police killing Police officer takes a life with the conscious objective to cause death, whether lawful or unlawful. Intentional killings also include cases in which an officer acts with the awareness that as a result of his/her conduct, it is nearly certain that the conduct will cause death. Examples: (1) After battering a police officer, a person is fatally shot by the officer. (2) After being stopped by an officer, a person flees and is fatally shot in the back.
6. Unintentional police killing but result of extremely reckless, reckless or neg-ligent use of force A police officer uses force with disregard or ignorance to a (substantial) risk that death will result from his/her conduct. Examples: (1) An officer is engaged in a shootout with a suspect and hits a bystander who dies. (2) During an encounter with a suspect, an officer repeatedly either uses a Taser, forcefully restrains a suspect using a mechanical restraint, uses a chokehold or another type of physical force. As a result, the suspect suffocates or suffers cardiac ar-rest and dies. (3) An officer intentionally rams a suspect during a car chase and pushes him/her of the road, which results in a deadly car crash. (4) An officer mistakes a fire-arm for a taser and shoots a suspect who dies. (5) An officer pushes a suspect into on-coming traffic during a violent struggle and the suspect is killed by a vehicle.
(Category 3 and 4 are excluded from our definition)
7. Accidental policing killing unrelated to the use of force A police officer accidentally kills a suspect in an incident that is unrelated to the use of police force. Examples: An officer is involved in a deadly car crash during normal traffic conditions.
8. Self-inflicted death or accident caused by suspect The death is self-inflicted such as a suicide or an accident caused by the suspect that kills the suspect or bystanders. Examples: (1) A suspect shoots himself after a confrontation with the police. (2) A sus-pect hits a tree during a car chase and dies. (3) Suspect hits another car during a car chase and kills the driver in the other vehicle.

54
Table 1 - Description and Summary Statistics of Variables by Source Variable Description Mean SD Pol. Killings of Blacks Number of Officer-involved killings of blacks 1.78 3.91 Pol. Killings of Whites Number of Officer-involved killings of whites 1.71 2.82 Census and American Community Survey Population (Black) Black city population in 100,000s (offset) 0.58 1.48 Population (White) White city population in 100,000s (offset) 1.29 2.05 Population Density Population density per square mile 4266.5 3341.2 Prop. Black Proportion black residents 0.17 0.17 Prop. Unemployment Black
Proportion unemployed among blacks 0.16 0.05
Prop. Unemployment White
Proportion unemployed among whites 0.09 0.03
Black-White Segregation Dissimilarity index for Black-White Segregation 0.42 0.16 Uniform Crime Reports, Various Data Series Arrests Black (log) Number of black arrests for homicides, violent
or property crimes, and weapon charges in 100,000s (offset)
0.06 0.11
Arrests White (log) Number of white arrests for homicides, violent or property crimes, and weapon charges in 100,000s (offset)
0.08 0.10
Violent Crime Rate Number of violent crimes per 100,000 residents 560.05 381.86 Homicide Rate: Black on Black
Number of black on black homicides over five-year period (2009-2013) per 100,000 residents
10.65 17.13
Homicide Rate: Black on White
Number of black on white homicides over five-year period (2009-2013) per 100,000 residents
1.86 1.95
Law Enforcement Management and Administrative Statistics (LEMAS) Officers per 100,000 Number of police officers per 100,000 residents 187.26 85.03 Prop. Black Officers Proportion of black police officers 0.11 0.12 Prop. Female Officers Proportion of female police officers 0.12 0.04 Community Policing Index
Index based on six indicators (see text) 5.34 1.59
Officer Monitoring System Personnel performance monitoring or assess-ment system for officers
0.54 0.50
Civ. Complaint Review Board
Civilian complaint review board or agency for use of force complaints
0.27 0.44
Other Sources Black Mayor Binary indicator for black city mayor 0.10 0.30 Prop. Black Council Members
Proportion of black members in city council 0.17 0.21
Region Binary indicator for North, Midwest, South, Southwest, and Northwest (reference North)
- -
Note: Descriptive variables based on (imputed) sample of 266 cities with more than 100,000 residents. All continuous variables except Prop. Black Officers are standardized for the analysis.

55
Figure 4 - Officer-Involved Killings across the United States, January 2013- June 2016

56
Table 2 - Officer-Involved Killings across major U.S. cities, January 2013 – June 2016 Killings of Blacks Killings of Whites Risk Ratio (Black/White)
City Pop. Prop. Black Count
Rate per Pop.
Rate per Arrests Count
Rate per Pop.
Rate per Arrests
Rate per Pop.
Rate per Arrests
Chicago, IL 27.06 0.32 36 4.17 43.12 2 0.23 6.99 18.17 6.17 New York, NY 82.69 0.23 25 1.33 166.15† 6 0.22 21.49† 6.07 7.73† Los Angeles, CA 38.27 0.09 19 5.49 58.49 12 1.10 14.99 5.00 3.90 Houston, TX 21.35 0.23 19 3.86 30.72 6 1.09 11.26 3.54 2.73 Columbus, OH 8.01 0.27 18 8.20 228.60 4 0.85 58.60 9.70 3.90 Oklahoma City, OK 5.91 0.14 14 16.55 143.77 10 3.02 62.59 5.49 2.30 Baltimore, MD 6.21 0.63 13 3.34 18.70 2 1.15 16.83 2.91 1.11 Washington, DC 6.19 0.49 12 3.92 111.40† 0 0.00 0.00† - - Philadelphia, PA 15.37 0.42 12 1.86 14.82 2 0.36 5.19 5.22 2.86 Memphis, TN 6.51 0.63 9 2.20 17.63 4 2.24 54.90 0.98 0.32 Dallas, TX 12.22 0.24 9 3.04 30.76 9 2.52 32.24 1.21 0.95 Milwaukee, WI 5.96 0.39 7 3.02 19.41 1 0.45 9.92 6.65 1.96 Boston, MA 6.29 0.23 6 4.17 64.94 0 0.00 0.00 - - San Antonio, TX 13.59 0.06 6 6.88 48.85 6 1.66 8.28 4.14 5.90 Fort Worth, TX 7.61 0.19 5 3.51 33.23 6 1.91 24.85 1.84 1.34 Phoenix, AZ 14.74 0.06 4 4.22 27.85 26 3.79 41.66 1.11 0.67 Jacksonville, FL 8.30 0.30 4 1.61 29.94† 1 0.22 92.25† 7.29 0.32† Las Vegas, NV 5.91 0.11 4 6.23 12.58 16 5.77 28.06 1.08 0.45 San Francisco, CA 8.18 0.06 3 6.53 33.75 3 0.88 28.32 7.43 1.19 Seattle, WA 6.25 0.07 3 6.64 49.16 9 2.16 104.32 3.07 0.47 Tucson, AZ 5.23 0.05 2 8.27 41.12 5 2.05 14.61 4.04 2.81 Fresno, CA 5.01 0.08 2 5.27 27.55 4 2.70 12.67 1.95 2.17 Detroit, MI 7.07 0.81 2 0.35 11.12 0 0.00 0.00 - - Albuquerque, NM 5.50 0.03 2 12.48 94.12 8 3.47 31.75 3.60 2.96 Austin, TX 8.37 0.08 2 3.10 16.64 14 3.41 40.86 0.91 0.41 El Paso, TX 6.61 0.03 2 10.28 96.29 3 3.10 11.61 3.32 8.29 San Diego, CA 13.23 0.06 1 1.18 7.72 9 1.54 22.81 0.77 0.34 San Jose, CA 9.69 0.03 1 3.67 37.85 4 1.48 19.90 2.48 1.90 Denver, CO 6.19 0.10 0 0.00 0.00 7 2.15 35.14 0.00 0.00 Portland, OR 5.95 0.06 0 0.00 0.00† 6 1.40 56.67† 0.00 0.00† Cities 500k+ residents 379.5 0.21 242 3.03 36.16 185 1.35 23.23 2.25 1.56 Cities 100k+ residents 807.6 0.19 473 3.05 31.38 456 1.33 21.69 2.30 1.45 Cities 50k+ residents 1064 0.17 536 2.89 27.8 601 1.22 19.88 2.37 1.4
Note: 30 U.S. cities with over 500,000 residents sorted by number of black police killings. Population and arrests are in 100,000s. † imputed black and white arrests.

57
Table 3 - Group Threat and Killings by Police Officers across U.S. Cities Killings of Blacks Killings of Whites
Model I Model II Mode III Model IV Mode V Model VI
(Count) (Rate per Pop.)
(Rate per Arrests) (Count) (Rate per
Pop.) (Rate per Arrests)
Prop. Black -0.213 -0.258 -0.147 -0.425* -0.383 0.263 (0.169) (0.168) (0.226) (0.201) (0.199) (0.228)
Prop. Black Council Members 0.184 0.183 0.328 -0.091 -0.079 -0.157 (0.115) (0.115) (0.167) (0.139) (0.139) (0.158)
Prop. Unemployment White -0.103 -0.096 -0.123 0.161* 0.158* -0.075 (0.085) (0.083) (0.132) (0.079) (0.079) (0.106)
Homicide Rate: Black on White 0.249** 0.252** 0.416** 0.124 0.128 0.159 (0.089) (0.086) (0.138) (0.087) (0.087) (0.119)
Homicide Rate: Black on Black -0.025 -0.023 -0.239 0.038 0.040 -0.182 (0.086) (0.086) (0.129) (0.128) (0.129) (0.154)
Control Variables Pop. Black or White (log) 1.026*** 0.913*** (0.079) (0.091) Population Density -0.060 -0.054 0.276 -0.183* -0.178* -0.064
(0.061) (0.060) (0.135) (0.077) (0.077) (0.097) Prop. Unemployment Black 0.223* 0.215* 0.194 -0.091 -0.079 -0.071 (0.107) (0.104) (0.151) (0.082) (0.081) (0.095) Violent Crime Rate 0.004 0.005 -0.039 0.204* 0.209* 0.041
(0.078) (0.078) (0.124) (0.083) (0.083) (0.111) Black-White Segregation 0.015 0.037 0.004 0.272** 0.225* 0.190
(0.123) (0.103) (0.172) (0.104) (0.091) (0.127) Black Mayor 0.290 0.291 0.350 0.006 -0.027 0.059
(0.178) (0.178) (0.288) (0.252) (0.250) (0.299) Officers per 100,000 Pop. 0.092 0.095 -0.152 0.020 -0.006 -0.146
(0.072) (0.071) (0.124) (0.093) (0.089) (0.112) Prop. Female Officers -0.029 -0.028 0.068 -0.101 -0.114 -0.021 (0.077) (0.077) (0.104) (0.072) (0.071) (0.082) Community Policing Index -0.046 -0.047 -0.114 0.022 0.027 -0.019
(0.075) (0.074) (0.129) (0.077) (0.079) (0.073) Officer Monitoring System -0.072 -0.064 0.134 -0.141 -0.165 -0.070 (0.138) (0.136) (0.185) (0.129) (0.127) (0.154) Civ. Complaint Review Board 0.072 0.077 0.145 0.186 0.156 0.318 (0.154) (0.154) (0.232) (0.143) (0.139) (0.165) Region Yes Yes Yes Yes Yes Yes Constant 1.291*** 1.262*** 3.290*** -0.032 0.021 3.164***
(0.188) (0.167) (0.167) (0.258) (0.154) (0.181) Note: N=266; Estimates based on negative-binomial regressions. Rate models include offset defined as the logged Black/White population or arrests in 100,000s. All continuous variables are standardized. p < 0.05, ** p < 0.01, *** p < 0.001; std. errors in parenthesis.

58
Figure 5 - The Race Gap in Police Agencies across the United States, 2013

59
Table 4 - Representation of Black Police Officers and Police Killings of Blacks Model I Model II Mode III Model IV Mode V Model VI
(Count) (Rate per Pop.)
(Rate per Arrests) (Count) (Rate per
Pop.) (Rate per Arrests)
Prop. Black -0.442* -0.438* -0.276 -0.482** -0.481** -0.378 (0.187) (0.186) (0.272) (0.178) (0.178) (0.273)
Prop. Black Council Members 0.180 0.179 0.327 0.158 0.157 0.311 (0.118) (0.118) (0.163) (0.110) (0.109) (0.161)
Prop. Unemployment White -0.214* -0.212* -0.126 -0.157 -0.159 -0.084 (0.085) (0.083) (0.137) (0.086) (0.084) (0.134)
Homicide Rate: Black on White 0.189* 0.187* 0.413** 0.341*** .343*** 0.608***
(0.082) (0.080) (0.134) (0.096) (0.095) (0.146) Homicide Rate: Black on Black -0.023 -0.022 -0.239 0.133 0.131 -0.018
(0.086) (0.086) (0.129) (0.098) (0.098) (0.168) Prop. Black Officers (PBO) -0.124 -0.126 -0.017 0.021 0.021 0.188 (0.090) (0.089) (0.157) (0.102) (0.102) (0.173) PBO x Homicide Rate: -0.100** -0.100** -0.139*
Black on White (0.037) (0.037) (0.060)
Control Variables Population Black 1.012*** 0.992*** (0.079) (0.077) Population Density -0.063 -0.061 0.276 -0.038 -0.039 0.298*
(0.061) (0.059) (0.135) (0.059) (0.058) (0.136) Prop. Unemployment Black 0.028 0.025 0.099 0.017 0.020 0.078 (0.107) (0.103) (0.157) (0.104) (0.101) (0.153) Violent Crime Rate 0.028 0.028 -0.035 -0.049 -0.049 -0.122
(0.079) (0.079) (0.122) (0.082) (0.082) (0.122) Black-White Segregation 0.040 0.050 0.005 0.014 0.007 -0.044
(0.123) (0.102) (0.168) (0.120) (0.099) (0.165) Black Mayor 0.308 0.309 0.398 0.246 0.245 0.277
(0.177) (0.177) (0.301) (0.173) (0.173) (0.304) Officers per 100,000 Pop. 0.115 0.117 -0.150 0.043 0.042 -0.260*
(0.073) (0.072) (0.123) (0.076) (0.075) (0.126) Prop. Female Officers 0.003 0.004 0.071 0.001 0.000 0.066 (0.079) (0.079) (0.110) (0.076) (0.076) (0.107) Community Policing Index -0.035 -0.036 -0.112 -0.064 -0.063 -0.144
(0.075) (0.075) (0.134) (0.073) (0.073) (0.147) Officer Monitoring System -0.076 -0.073 0.132 -0.020 -0.023 0.222 (0.137) (0.135) (0.191) (0.131) (0.131) (0.196) Civ. Complaint Review Board 0.075 0.077 0.143 0.175 0.174 0.252 (0.155) (0.154) (0.230) (0.152) (0.151) (0.221) Region Yes Yes Yes Yes Yes Yes Constant 1.328*** 1.316*** 3.298*** 1.155*** 1.164*** 3.093***
(0.189) (0.171) (0.259) (0.194) (0.178) (0.265) Note: N=266; Estimates based on negative-binomial regressions. Rate models include offset defined as the logged Black population or arrests in 100,000s. All continuous variables are standardized except “Prop. Black Officers” for which one-unit refers to a 10% change. p < 0.05, ** p < 0.01, *** p < 0.001; std. errors in parenthesis.
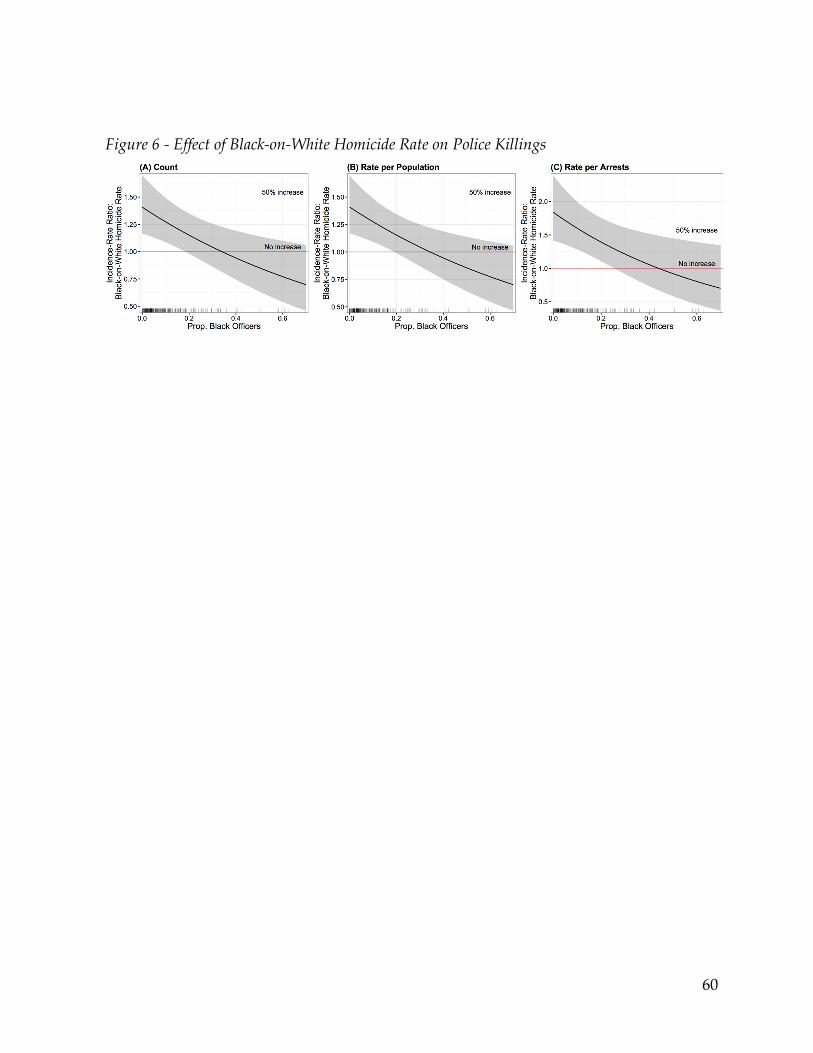
60
Figure 6 - Effect of Black-on-White Homicide Rate on Police Killings

61
Table A1 - Comparison of Data Sources on Police Killings, 2015
Source Method and Definition Cases
Cases fitting
our Def. Unique Cases
Missing Cases
% Race Missing
Fatal Encounters
Crowd-sourced information, police reports, monitoring of news outlets, freedom of information requests. Definition: All interactions with the police that result in death (including off-duty officers).
1,351 1,114 37 33 18.4%
The Counted (The Guardian)
Police reports, witness statements, monitoring regional news outlets, research groups and open-source re-porting projects. Definition: Any deaths arising directly from encoun-ters with law enforcement.
1,146 1,098 13 49 2.0%
Washing- ton Post
News reports, public records, Inter-net databases and original report-ing. Definition: All shooting deaths from on-duty police officers.
990 963 0 184 2.8%
Our Data See description in text. 1,147 1,147 - - 0.9% Note: Our definition of officer-involved killings is outlined in Box 1 (category 1 and 2). The columns “Unique Cases” and “Missing Cases” are in reference to our data. For example, 13 unique cases in The Counted refers to the number of cases in our data that were only found in The Counted but not in Fatal Encounters or the Washington Post database. The data from all three sources was downloaded on August 22, 2016.

62
Table A2 - Representation of Black Police Officers and Police Killings of Whites
Model I Model II Mode III Model IV Mode V Model VI
(Count) (Rate per Pop.)
(Rate per Arrests) (Count) (Rate per
Pop.) (Rate per Arrests)
Prop. Black -0.290 -0.249 0.391 -0.300 -0.254 0.353 (0.228) (0.227) (0.286) (0.230) (0.228) (0.291)
Prop. Black Council Members -0.091 -0.079 -0.166 -0.093 -0.080 -0.164 (0.139) (0.139) (0.161) (0.140) (0.140) (0.159)
Prop. Unemployment White 0.152 0.150 -0.083 0.156 0.152 -0.081 (0.079) (0.079) (0.108) (0.080) (0.080) (0.109)
Homicide Rate: Black on White 0.096 0.101 0.235 0.120 0.116 0.305*
(0.090) (0.091) (0.124) (0.105) (0.105) (0.131) Homicide Rate: Black on Black 0.058 0.060 -0.161 0.085 0.078 -0.082
(0.130) (0.131) (0.159) (0.144) (0.144) (0.204) Prop. Black Officers (PBO) -0.168 -0.162 -0.173 -0.147 -0.148 -0.103 (0.140) (0.142) (0.177) (0.148) (0.150) (0.192) PBO x Homicide Rate: -0.024 -0.016 -0.065
Black on White (0.056) (0.055) (0.082)
Control Variables Population White 0.907*** 0.901*** (0.092) (0.093) Population Density -0.171* -0.167* -0.049 -0.170* -0.166* -0.044
(0.078) (0.078) (0.099) (0.078) (0.078) (0.098) Prop. Unemployment Black -0.083 -0.070 -0.061 -0.088 -0.073 -0.070 (0.082) (0.082) (0.097) (0.083) (0.082) (0.097) Violent Crime Rate 0.220** 0.224** 0.059 0.215* 0.221** 0.042
(0.084) (0.084) (0.116) (0.085) (0.085) (0.112) Black-White Segregation 0.281** 0.231* 0.203 0.278** 0.227* 0.181
(0.103) (0.091) (0.125) (0.103) (0.092) (0.133) Black Mayor 0.041 0.003 0.098 0.040 0.001 0.078
(0.252) (0.250) (0.291) (0.252) (0.250) (0.289) Officers per 100,000 Pop. 0.039 0.011 -0.121 0.031 0.004 -0.150
(0.095) (0.091) (0.114) (0.097) (0.094) (0.115) Prop. Female Officers -0.081 -0.096 0.001 -0.081 -0.096 -0.004 (0.074) (0.073) (0.087) (0.074) (0.073) (0.087) Community Policing Index 0.033 0.038 -0.009 0.031 0.037 -0.016
(0.077) (0.079) (0.074) (0.077) (0.079) (0.076) Officer Monitoring System -0.152 -0.178 -0.087 -0.146 -0.175 -0.072 (0.129) (0.127) (0.154) (0.131) (0.128) (0.158) Civ. Complaint Review Board 0.182 0.150 0.303 0.188 0.153 0.320 (0.143) (0.139) (0.167) (0.145) (0.140) (0.164) Region Yes Yes Yes Yes Yes Yes Constant 0.102 0.109 3.300*** 0.091 0.102 3.259***
(0.191) (0.191) (0.218) (0.193) (0.193) (0.225) Note: N=266; Estimates based on negative-binomial regressions. Rate models include offset defined as the logged White population or arrests in 100,000s. All continuous variables are standardized except “Prop. Black Officers” for which one-unit refers to a 10% change. p < 0.05, ** p < 0.01, *** p < 0.001; std. errors in parenthesis.

63
Table A3 - Group Threat and Killings by Police Officers across U.S. Cities (50,000+ population) Killings of Blacks Killings of Whites
Model I Model II Mode III Model IV Mode V Model VI
(Count) (Rate per Pop.)
(Rate per Arrests) (Count) (Rate per
Pop.) (Rate per Arrests)
Prop. Black -0.551** -0.527*** -0.241 -0.380* -0.399* 0.095 (0.133) (0.135) (0.173) (0.159) (0.157) (0.160)
Prop. Black Council Members 0.171 0.171 0.222 0.005 0.002 -0.036 (0.109) (0.114) (0.161) (0.126) (0.124) (0.129)
Prop. Unemployment White -0.114 -0.104 0.020 0.122* 0.119* -0.030 (0.077) (0.075) (0.091) (0.060) (0.060) (0.069)
Homicide Rate: Black on White 0.186** 0.166* 0.266** 0.072 0.069 0.143 (0.069) (0.068) (0.084) (0.067) (0.067) (0.076)
Homicide Rate: Black on Black -0.028 -0.016 -0.142 0.034 0.035 -0.072 (0.067) (0.066) (0.088) (0.092) (0.092) (0.105)
Control Variables (see Table 3) Yes Yes Yes Yes Yes Yes
Note: N=635; Replication of findings from Table 3 with sample of cities with a population of over 50,000. p < 0.05, ** p < 0.01, *** p < 0.001; std. errors in parenthesis.
Table A4 - Representation of Black Police Officers and Police Killings (50,000+ population) Killings of Blacks Killings of Whites
Model I Model II Mode III Model IV Mode V Model VI
(Count) (Rate per Pop.)
(Rate per Arrests) (Count) (Rate per
Pop.) (Rate per Arrests)
Prop. Black -0.527** -0.512*** -0.266 -0.303* -0.322 0.069 (0.102) (0.105) (0.194) (0.172) (0.168) (0.182)
Prop. Black Council Members 0.181 0.183 0.233 0.009 0.007 -0.036 (0.102) (0.105) (0.158) (0.126) (0.125) (0.136)
Prop. Unemployment White -0.088 -0.080 0.038 0.119* 0.116 -0.026 (0.077) (0.076) (0.093) (0.060) (0.060) (0.069)
Homicide Rate: Black on White 0.299*** 0.289*** 0.386*** 0.075 0.076 0.193* (0.081) (0.079) (0.100) (0.081) (0.081) (0.092)
Homicide Rate: Black on Black 0.099 0.114 -0.008 0.071 0.077 -0.012 (0.082) (0.080) (0.108) (0.108) (0.107) (0.120)
Prop. Black Officers (PBO) 0.012 0.005 -0.021 -0.109 -0.105 -0.031 (0.088) (0.087) (0.102) (0.120) (0.118) (0.127)
PBO x Homicide Rate: -0.093** -0.098** -0.101* -0.021 -0.026 -0.058 Black on White (0.035) (0.035) (0.043) (0.051) (0.050) (0.054)
Control Variables (see Table 4) Yes Yes Yes Yes Yes Yes
Note: N=635; Replication of findings from Table 4 (Model IV-VI) and A2 (Model IV-VI) with sample of cit-ies with a population of over 50,000. p < 0.05, ** p < 0.01, *** p < 0.001; std. errors in parenthesis.