group technology and cellular manufacturing
DESCRIPTION
Group Technology and Cellular Manufacturing. MARCH 2013. What is Group Technology (GT)?. GT is a theory of management based on the principle that similar things should be done similarly - PowerPoint PPT PresentationTRANSCRIPT
Group Technology and Cellular Manufacturing
MARCH 2013

What is Group Technology (GT)?• GT is a theory of management based on the
principle that similar things should be done similarly• GT is the realization that many problems are similar,
and that by grouping similar problems, a single solution can be found to a set of problems thus saving time and effort
• GT is a manufacturing philosophy in which similar parts are identified and grouped together to take advantage of their similarities in design and production
2 ENM 324 Facilities PlanningPrepared by: Asst. Prof. Dr. Nevra
AKBILEK

Implementing GT
Where to implement GT?• Plants using traditional batch production and
process type layout• If the parts can be grouped into part familiesHow to implement GT?• Identify part families• Rearrange production machines into machine
cells
3 ENM 324 Facilities PlanningPrepared by: Asst. Prof. Dr. Nevra
AKBILEK

Types of LayoutIn most of today’s factories it is possible to divide all the made components into families and all the machines into groups, in such a way that all the parts in each family can be completely processed in one group only. The three main types of layout are: • Line (product) Layout• Functional Layout• Group Layout
4 ENM 324 Facilities PlanningPrepared by: Asst. Prof. Dr. Nevra
AKBILEK

Line (product) Layout•It involves the arrangements of machines in one line, depending on the sequence of operations. In product layout, if there is a more than one line of production, there are as many lines of machines.•Line Layout is used at present in simple process industries, in continuous assembly, and for mass production of components required in very large quantities.
5 ENM 324 Facilities PlanningPrepared by: Asst. Prof. Dr. Nevra
AKBILEK

Functional Layout•In Functional Layout, all machines of the same type are laid out together in the same section under the same foreman. Each foreman and his team of workers specialize in one process and work independently. This type of layout is based on process specialization.
6 ENM 324 Facilities PlanningPrepared by: Asst. Prof. Dr. Nevra
AKBILEK

Group Layout•In Group Layout, each foreman and his team specialize in the production of one list of parts and co-operate in the completion of common task. This type of layouts based on component specialization.
7 ENM 324 Facilities PlanningPrepared by: Asst. Prof. Dr. Nevra
AKBILEK
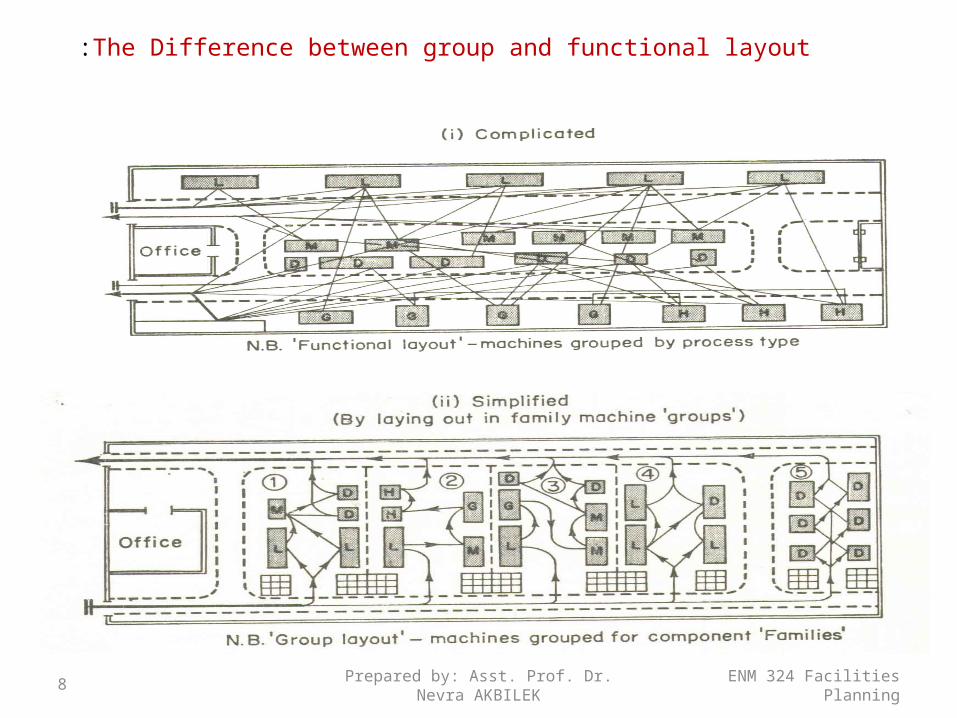
The Difference between group and functional layout:
8 ENM 324 Facilities PlanningPrepared by: Asst. Prof. Dr. Nevra
AKBILEK

Large manufacturing system can be decomposed into smaller subsystems of part families based on similarities in
1. design attributes and
2. manufacturing features
9
Identifying Part Families
ENM 324 Facilities PlanningPrepared by: Asst. Prof. Dr. Nevra
AKBILEK

Design Attributes: part configuration (round or prismatic) dimensional envelope (length to diameter
ratio) surface integrity (surface roughness,
dimensional tolerances) material type raw material state (casting, forging, bar stock,
etc.)10
Identifying Part Families
ENM 324 Facilities PlanningPrepared by: Asst. Prof. Dr. Nevra
AKBILEK

Part Manufacturing Features: operations and operation sequences (turning,
milling, etc.) batch sizes machine tools cutting tools work holding devices processing times
11
Identifying Part Families
ENM 324 Facilities PlanningPrepared by: Asst. Prof. Dr. Nevra
AKBILEK

Group technology emphasis on part families based on similarities in design attributes and manufacturing, therefore GT contributes to the integration of CAD and CAM.
12
Identifying Part Families
ENM 324 Facilities PlanningPrepared by: Asst. Prof. Dr. Nevra
AKBILEK

GT Benefits
ENM 324 Facilities PlanningPrepared by: Asst. Prof. Dr. Nevra
AKBILEK13
1. Better human relations
2. Improved operator expertise
3. Less in-process inventory and material handling
4. Faster production setup

ENM 324 Facilities PlanningPrepared by: Asst. Prof. Dr. Nevra
AKBILEK14
1. Grouping parts into families that follow a common sequence of steps.
2. Identifying dominant flow patterns of parts families as a basis for location or relocation of processes.
3. Physically grouping machines and processes into cells.
Group Technology :Transition from Process Layout

GT Advantages
ENM 324 Facilities PlanningPrepared by: Asst. Prof. Dr. Nevra
AKBILEK15
By grouping, higher machine utilizations
Smoother flow lines and shorter travel distances
Team spirit and job enlargement
Greater labor skills for team Balancing individual cells Unbalanced flow may result in
work-in-process

Clustering Approaches
ENM 324 Facilities PlanningPrepared by: Asst. Prof. Dr. Nevra
AKBILEK16
Rank order clustering Direct clustering algorithm Bond energy Row and column masking Similarity coefficient Mathematical Programming
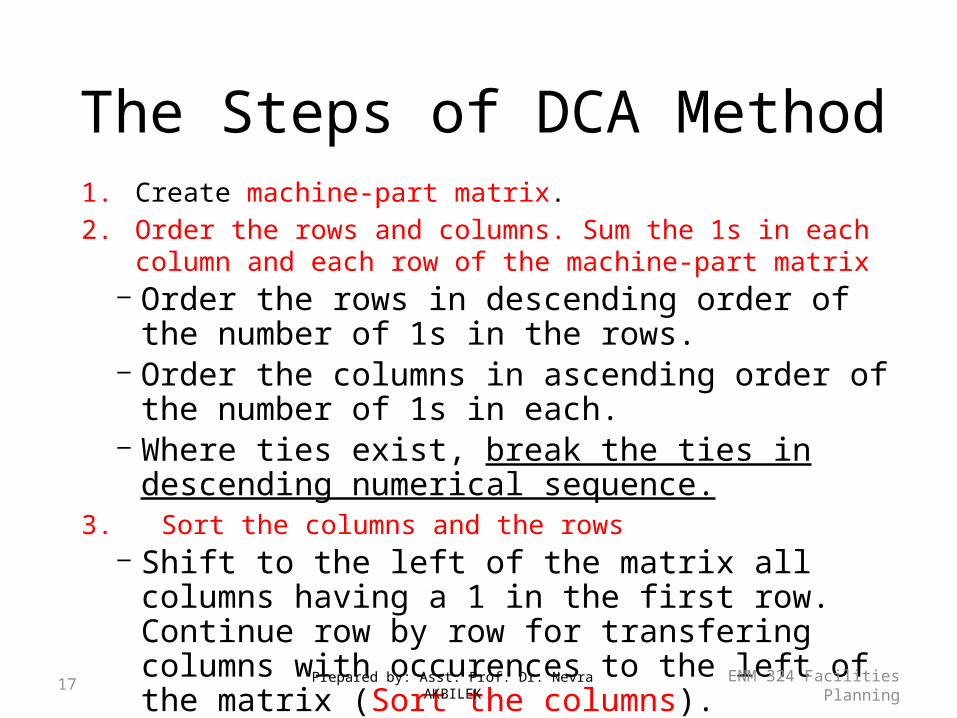
The Steps of DCA Method1. Create machine-part matrix.2. Order the rows and columns. Sum the 1s in each column
and each row of the machine-part matrix– Order the rows in descending order of the number of 1s in
the rows.– Order the columns in ascending order of the number of 1s
in each.– Where ties exist, break the ties in descending numerical
sequence.3. Sort the columns and the rows
– Shift to the left of the matrix all columns having a 1 in the first row. Continue row by row for transfering columns with occurences to the left of the matrix (Sort the columns).
Prepared by: Asst. Prof. Dr. Nevra AKBILEK ENM 324 Facilities Planning17
The steps of DCA Method
ENM 324 Facilities PlanningPrepared by: Asst. Prof. Dr. Nevra
AKBILEK18
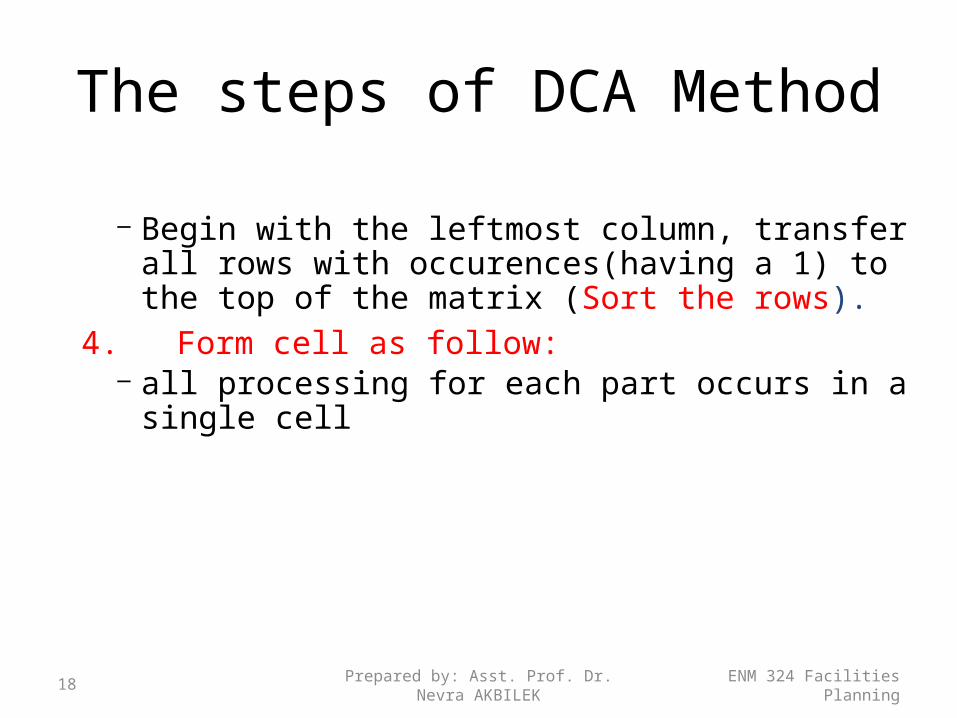
– Begin with the leftmost column, transfer all rows with occurences(having a 1) to the top of the matrix (Sort the rows).
4. Form cell as follow: – all processing for each part occurs in a single cell
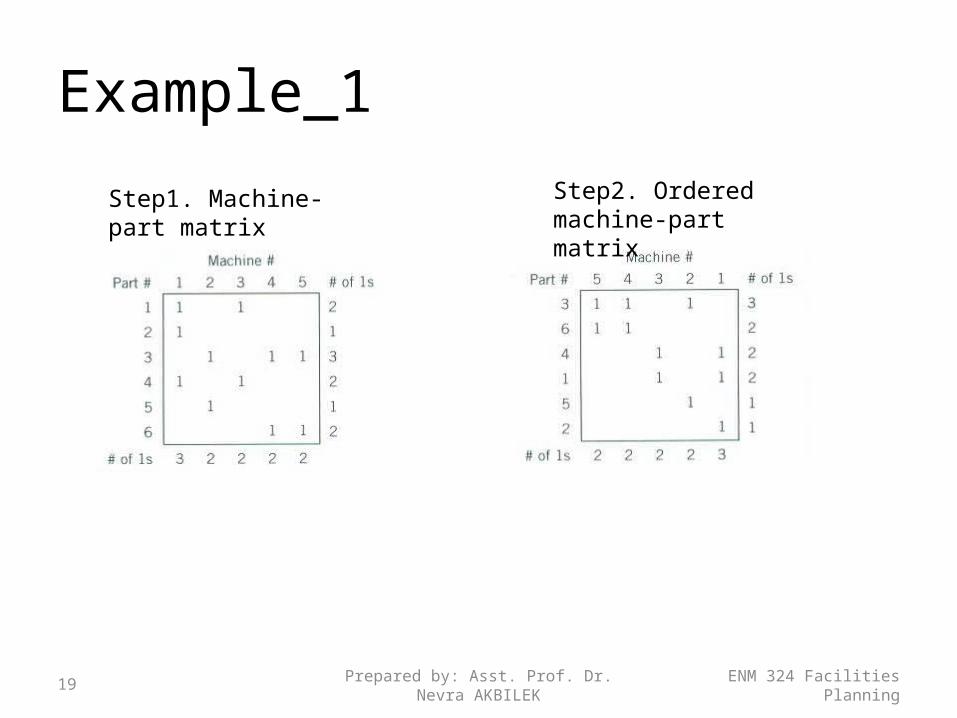
Example_1
Step1. Machine-part matrix
Step2. Ordered machine-part matrix
Prepared by: Asst. Prof. Dr. Nevra AKBILEK
ENM 324 Facilities Planning19

Example_1
Prepared by: Asst. Prof. Dr. Nevra AKBILEK
ENM 324 Facilities Planning20
Step 4. Formation of two cells.
Step 3. Column-sorted machine-part matrix
Step 3. Row-sorted machine-part matrix

Example_2
ENM 324 Facilities PlanningPrepared by: Asst. Prof. Dr. Nevra
AKBILEK21
Step2. A machine-part matrix

Example_2
ENM 324 Facilities PlanningPrepared by: Asst. Prof. Dr. Nevra
AKBILEK22
Step2. Ordered machine-part matrix
Example_2
ENM 324 Facilities PlanningPrepared by: Asst. Prof. Dr. Nevra
AKBILEK23
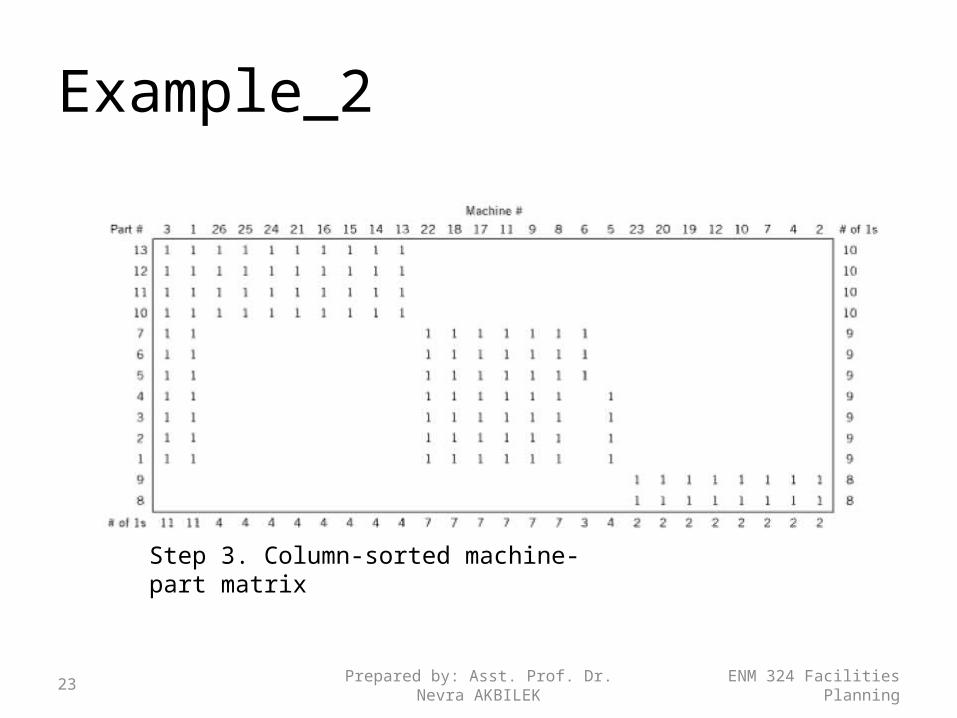
Step 3. Column-sorted machine-part matrix

Example_2
ENM 324 Facilities PlanningPrepared by: Asst. Prof. Dr. Nevra
AKBILEK24
Step 3. Clustered machine parts to form two cells: Cell A, Cell B

Example_2
ENM 324 Facilities PlanningPrepared by: Asst. Prof. Dr. Nevra
AKBILEK25
Step 3. Clustered machine parts to form three cells: Cell A, Cell B, and Cell C
Locate machines 1 and 3 at the boundary between cells A and B to minimize material handling between cells.

Example_2
ENM 324 Facilities PlanningPrepared by: Asst. Prof. Dr. Nevra
AKBILEK26
Step 3. Final solution
If multiple machines are feasible, then three ‘pure’ cells can be formed for this example.

Example_3
ENM 324 Facilities PlanningPrepared by: Asst. Prof. Dr. Nevra
AKBILEK27
Step 1 Step 2

Example_3
ENM 324 Facilities PlanningPrepared by: Asst. Prof. Dr. Nevra
AKBILEK28
Step 4
Machines 2 and 3 can be located relatively close to one another.
Example_3
ENM 324 Facilities PlanningPrepared by: Asst. Prof. Dr. Nevra
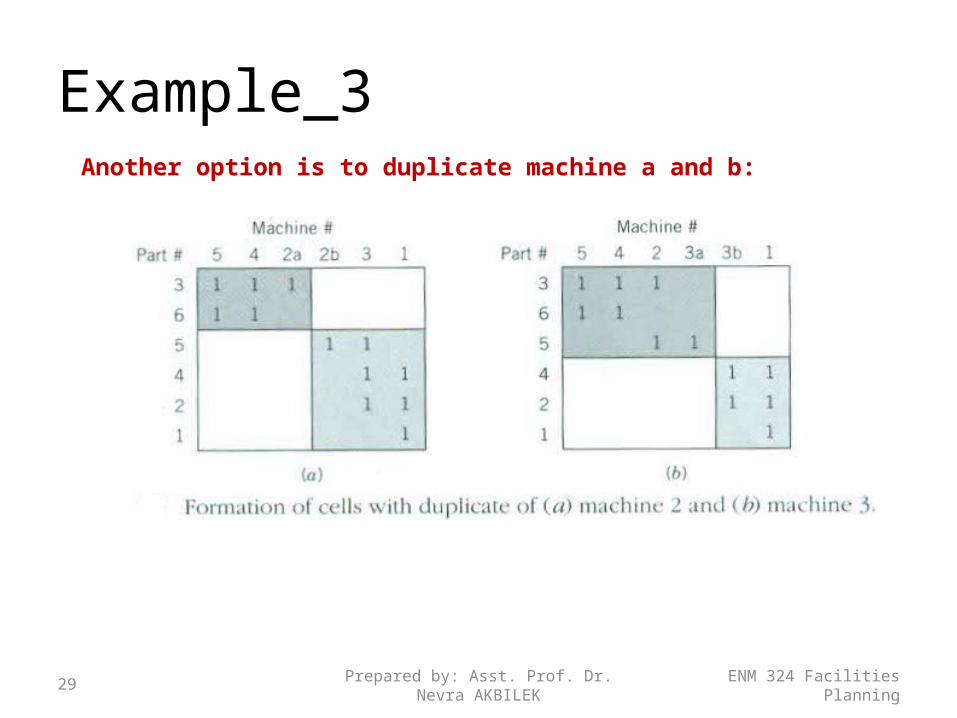
AKBILEK29
Another option is to duplicate machine a and b:

Similarity Method
ENM 324 Facilities PlanningPrepared by: Asst. Prof. Dr. Nevra
AKBILEK30
Using Process Similarity methods:– Create machine – part matrices– Compute Similarity Coefficient for a pair of machines :
– is similarity coefficient for machines K and L.– is of parts processed by both machines K and L.– is of parts processed by machine K.– is of parts processed by machine L.
𝑆𝐾𝐿𝑀 =
𝑁𝐾𝐿𝑃
(𝑁𝐾 𝐾𝑃 +𝑁 𝐿𝐿
𝑃 −𝑁𝐾𝐿𝑃 )
𝑆𝐾𝐿𝑀

Example
ENM 324 Facilities PlanningPrepared by: Asst. Prof. Dr. Nevra
AKBILEK31
Part ‘Number’
Machine ID
X 1 2 3 4 5 6A 1 1B 1 1C 1 1D 1 1 1E 1 1 1

Solution
ENM 324 Facilities PlanningPrepared by: Asst. Prof. Dr. Nevra
AKBILEK32
Total Number is: C(N,2)= [(N-1)N]/2 = [(5-1)5]/2 = 10 For the machines (typical number in a small Job Shop) Sij values :
1.33
2 2 10
02 2 02
.672 3 2
MAB
MAC
MAD
S
S
S
!
( , )! !
n
C n rr n r

Solution
ENM 324 Facilities PlanningPrepared by: Asst. Prof. Dr. Nevra
AKBILEK33
Using Process Similarity methods:– If the similarity coefficient is
0.33 consider clustering– This criteria means
clustering: A&D, A&B, B&D C & E
– Declustering: A&C, A&E, B&C, B&E and
C&D, D&E
00
2 3 00
02 2 02
.672 3 20
02 3 00
02 3 02
.672 3 20
03 3 0
MAE
MBC
MBD
MBE
MCD
MCE
MDE
S
S
S
S
S
S
S

Solution
ENM 324 Facilities PlanningPrepared by: Asst. Prof. Dr. Nevra
AKBILEK34
Examine the matrix and the clustered ‘machine cells,’ we develop 2 part families:
For the Cell A/D/B: Part Numbers 2, 3 & 5 For the Cell C/E: Part Numbers 1, 4 & 6
Care must be taken (in most cases) to assure that each cell has all the machines it needs – sometimes a couple of families need a key machine
In this case, the manager must decide to either replicate the common machine or share it between the cells creating a bottleneck and scheduling problem for each cell
This is typically one of the cost problems in CMS systems

Summarizing
ENM 324 Facilities PlanningPrepared by: Asst. Prof. Dr. Nevra
AKBILEK35
Make Machine/Part Matrix Compute Similarity Coefficients Cluster Machines with SC Determine Part Families for the clusters (cells) Decide if machine replication is cost effective Re-layout facility and Cross Train workforce Start counting your new found cash Court customers to grow part families on Cell-by-Cell
basis
Single-Linkage Cluster Analysis
ENM 324 Facilities PlanningPrepared by: Asst. Prof. Dr. Nevra
AKBILEK36
SLCA : Hierarchical machine grouping method using similarity coefficients between machines
Single linkage clustering computes the similarity between two groups as the similarity of the closest pair of observations between the two groups.
Similarity coefficients are used to construct a tree called a dendrogram, hierarchical tree.
SLCA Algorithm
ENM 324 Facilities PlanningPrepared by: Asst. Prof. Dr. Nevra
AKBILEK37
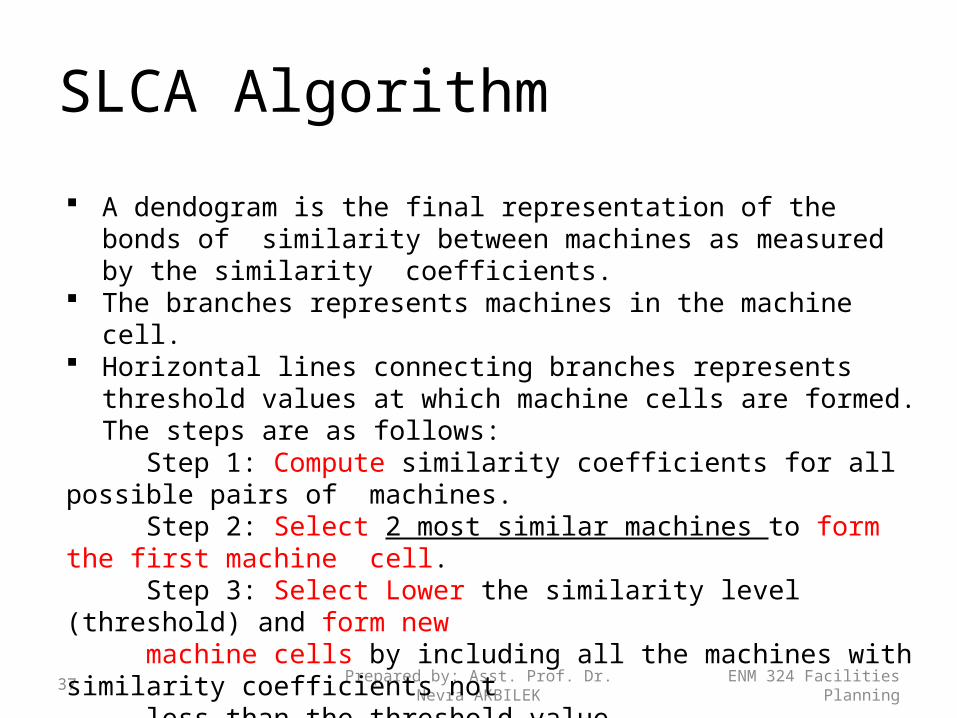
A dendogram is the final representation of the bonds of similarity between machines as measured by the similarity coefficients.
The branches represents machines in the machine cell. Horizontal lines connecting branches represents threshold values at which
machine cells are formed. The steps are as follows: Step 1: Compute similarity coefficients for all possible pairs of machines. Step 2: Select 2 most similar machines to form the first machine cell. Step 3: Select Lower the similarity level (threshold) and form new machine cells by including all the machines with similarity coefficients not less than the threshold value. Step 4: Continue step 3 untill all the machines are grouped into a single cell.
SLCA-Example
ENM 324 Facilities PlanningPrepared by: Asst. Prof. Dr. Nevra
AKBILEK38
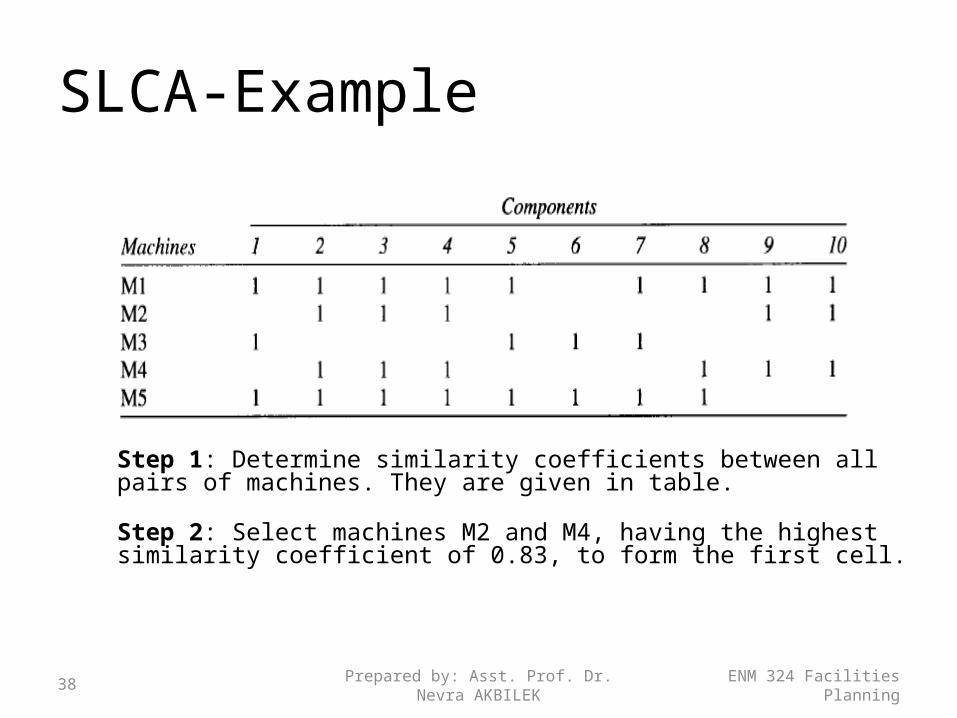
Step 1: Determine similarity coefficients between all pairs of machines. They are given in table.
Step 2: Select machines M2 and M4, having the highest similarity coefficient of 0.83, to form the first cell.

SLCA-Example
ENM 324 Facilities PlanningPrepared by: Asst. Prof. Dr. Nevra
AKBILEK39
Step 3:The next lower sc is between machines M1 and M5. Use these to form the second cell.
Step 4:The next lower sc is 0.67 between machines M1 and M4. At this threshold value machines M1,M2,M4, and M5 will form one machine group.
The next one is 0.55 between machines M1 and M2, which is dominated by sc of 0.67.
The lowest nondominated sc is 0.5 between machines M3 and M5, at which all machines belong to one cell.

SLCA-Example
ENM 324 Facilities PlanningPrepared by: Asst. Prof. Dr. Nevra
AKBILEK40
Threshold values
1 cell
2 cells
3 cells
5 cells

SLCA Algorithm – Example 2
ENM 324 Facilities PlanningPrepared by: Asst. Prof. Dr. Nevra
AKBILEK41
P a r t
P1 P2 P3 P4 P5 P6
M M1 1
a M2 1 1 1
c M3 1 1 1
h M4 1 1
i M5 1 1
n M6 1 1
e M7 1 1

ENM 324 Facilities PlanningPrepared by: Asst. Prof. Dr. Nevra
AKBILEK42
Machine groups
Similarity coefficient
(1-2) 0(1-3) 0(1-4) 0,5(1-5) 0(1-6) 0,5(1-7) 0(2-3) 0,5(2-4) 0(2-5) 0,66(2-6) 0(2-7) 0,25(3-4) 0(3-5) 0,25(3-6) 0(3-7) 0,25(4-5) 0(4-6) 1(4-7) 0(5-6) 0(5-7) 0,33(6-7) 0
1
2
3
Step 1: Determine similarity coefficients between all pairs of machines. They are given in table.
4
5
ENM 324 Facilities PlanningPrepared by: Asst. Prof. Dr. Nevra
AKBILEK43
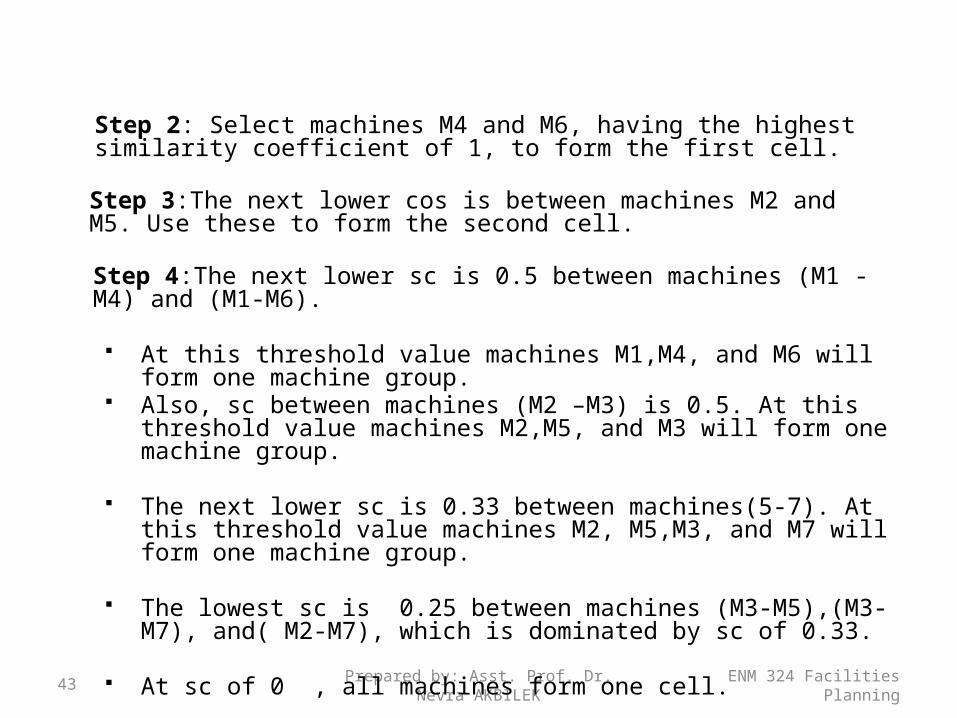
Step 2: Select machines M4 and M6, having the highest similarity coefficient of 1, to form the first cell.
Step 3:The next lower cos is between machines M2 and M5. Use these to form the second cell.
Step 4:The next lower sc is 0.5 between machines (M1 -M4) and (M1-M6).
At this threshold value machines M1,M4, and M6 will form one machine group.
Also, sc between machines (M2 –M3) is 0.5. At this threshold value machines M2,M5, and M3 will form one machine group.
The next lower sc is 0.33 between machines(5-7). At this threshold value machines M2, M5,M3, and M7 will form one machine group.
The lowest sc is 0.25 between machines (M3-M5),(M3-M7), and( M2-M7), which is dominated by sc of 0.33.
At sc of 0 , all machines form one cell.

SLCA Algorithm
ENM 324 Facilities PlanningPrepared by: Asst. Prof. Dr. Nevra
AKBILEK44

Rank Order Clustering Steps
ENM 324 Facilities PlanningPrepared by: Asst. Prof. Dr. Nevra
AKBILEK45
Step 1: Assign binary weight BWj = 2m-j to each column j of the part-machine processing indicator matrix.
• m is the total number of columns• j is the number of coloumn
Step 2: Determine the decimal equivalent DE of the binary value of each row i using the formula
• aij is either 0 or 1 depending upon the matrix
Step 3: Rank the rows in decreasing order of their DE values. Break ties arbitrarily. Rearrange the rows based on this ranking. If no rearrangement is necessary, stop; otherwise go to step 4.
1
2m
m ji ij
j
DE a

Rank Order Clustering Steps
ENM 324 Facilities PlanningPrepared by: Asst. Prof. Dr. Nevra
AKBILEK46
Step 4: For each rearranged row of the matrix, assign binary weight BWi = 2n-i.
• n is the total number of rows• i is the number of row
Step 5: Determine the decimal equivalent of the binary value of each column j using the formula
Step 6: Rank the columns in decreasing order of their DE values. Break ties arbitrarily. Rearrange the columns based on this ranking. If no rearrangement(no change in position of element in each row and coloumn) is necessary, stop; otherwise go to step 1.

Rank Order Clustering
ENM 324 Facilities PlanningPrepared by: Asst. Prof. Dr. Nevra
AKBILEK47
Part ‘Number’
Machine ID
X 1 2 3 4 5 6A 1 1B 1 1C 1 1D 1 1 1E 1 1 1

Step 1
ENM 324 Facilities PlanningPrepared by: Asst. Prof. Dr. Nevra
AKBILEK48
Part Numbers D. Equiv Rank
Machine ID
1 2 3 4 5 6
B. Wt: 25 24 23 22 21 20
A 1 1 23+21 = 10 5
B 1 1 24+23 = 24 4
C 1 1 25+22=36 2
D 1 1 1 24+23+21 = 26 3
E 1 1 1 25+22+20=37 1
Step 2: Must Reorder!Step 2: Must Reorder!

Step 3
ENM 324 Facilities PlanningPrepared by: Asst. Prof. Dr. Nevra
AKBILEK49
Part Number
B. WT. 1 2 3 4 5 6
Machine ID
E 24 1 1 1
C 23 1 1
D 22 1 1 1
B 21 1 1
A 20 1 1
D. Equiv 24+23 = 24
22+21= 6
22+21+20=7
24+23=24
22+20=5 24=16
Rank 1 5 4 2 6 3
Step 4: Must Reorder!Step 4: Must Reorder!

Last Step
ENM 324 Facilities PlanningPrepared by: Asst. Prof. Dr. Nevra
AKBILEK50
Part Number D. Eqv Rank
1 4 6 3 2 5
B Wt: 25 24 23 22 21 20
Machine ID
E 1 1 1 25+24+ 23=56 1
C 1 1 25+24= 48 2
D 1 1 1 22+21+ 20 = 7 3
B 1 1 22+21=6 4
A 1 1 22+20=5 5
Cluster Result!
Order is same: STOP!

Example_2
ENM 324 Facilities PlanningPrepared by: Asst. Prof. Dr. Nevra
AKBILEK51
BINARYWEIGHT
1. Calculate the binary value(D.EQV.) for each row1. Calculate the binary value(D.EQV.) for each row

ENM 324 Facilities PlanningPrepared by: Asst. Prof. Dr. Nevra
AKBILEK52
2. Sort the rows in descending order2. Sort the rows in descending order
ENM 324 Facilities PlanningPrepared by: Asst. Prof. Dr. Nevra
AKBILEK53
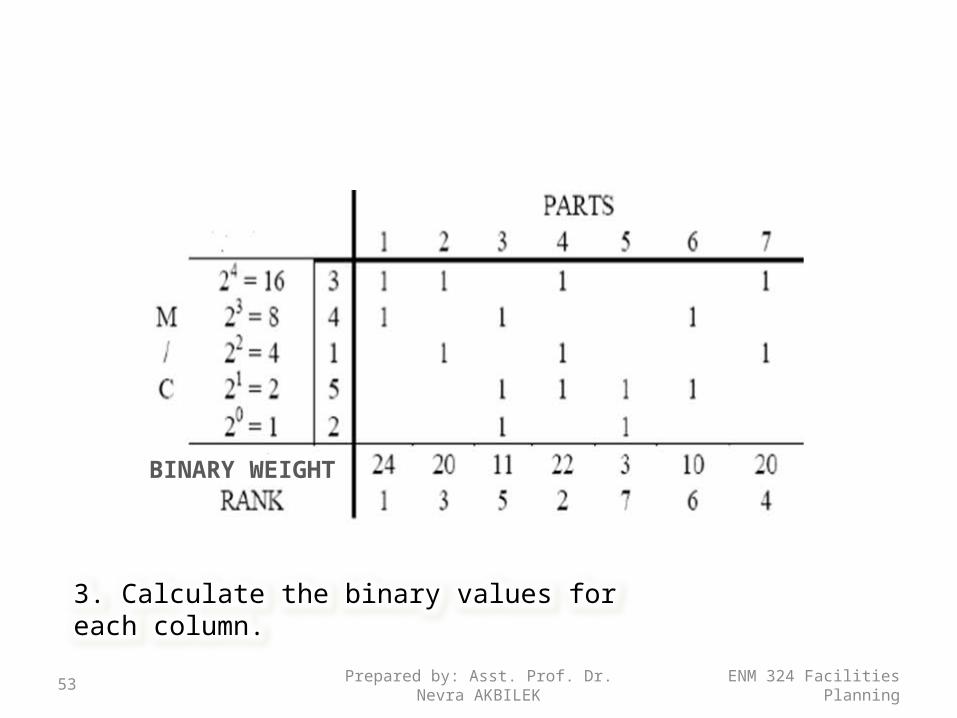
3. Calculate the binary values for each column.3. Calculate the binary values for each column.
BINARY WEIGHT

ENM 324 Facilities PlanningPrepared by: Asst. Prof. Dr. Nevra
AKBILEK54
Exceptional ElementsVoids
4. Sort the columns in descending order.4. Sort the columns in descending order.
5.Repeat the row and then column interchanges untill no change happen.5.Repeat the row and then column interchanges untill no change happen.

Exceptional Parts and bottleneckmachines
ENM 324 Facilities PlanningPrepared by: Asst. Prof. Dr. Nevra
AKBILEK55
Not always to get neat cells Some parts are processed in more than one cell
Exceptional parts Processing of these machines are called
bottleneck machines This is typically one of the cost problems in
CMS(GT) systems

Solutions for overcoming this problem?
ENM 324 Facilities PlanningPrepared by: Asst. Prof. Dr. Nevra
AKBILEK56
Duplicate machines Alternate process plans Subcontract these operations

Prepared by: Asst. Prof. Dr. Nevra AKBILEK
57
Service Layout
• Service layouts can be categorized as: product, process, or fixed position
• Service layout requirements are somewhat different due to such factors as:– Degree of customer contact– Degree of customization
• Common service layouts:– Warehouse and storage layouts– Retail layouts– Office layouts
ENM 324 Facilities Planning

Prepared by: Asst. Prof. Dr. Nevra AKBILEK
58
Goal--maximize net profit per square foot of floor space.
Servicescapes Ambient Conditions Spatial Layout and Functionality Signs, Symbols, and Artifacts
Retail Service Layout
ENM 324 Facilities Planning

LOCATION ALLOCATION
1 .Set Covering Model2 .Uncapacitated Location-Allocation Model3 .Comprehensive Location-Allocation Model
Set Covering Method
ENM 324 Facilities PlanningPrepared by: Asst. Prof. Dr. Nevra
AKBILEK60
SCM is necessary to ensure that each customer is covered by at least one service facility.
For example, fire stations, libraries, colleges.
Each customer is within a certain range of distance from at least one facility
If a customer is within the desired range, customer is covered.

Set Covering Method
ENM 324 Facilities PlanningPrepared by: Asst. Prof. Dr. Nevra
AKBILEK61
4

Example
ENM 324 Facilities PlanningPrepared by: Asst. Prof. Dr. Nevra
AKBILEK62
A county administration wants to locate several madical emergency response units so that they can respond to any call in the county within 8 minutes. The county has 7 population zones. The distance between the centers of the zones are given in the matrix in the following figure. The units can be located in the center of the zones 1-7 at a cost of 100,80,120, 110, 90, 90, and 110, respectively.
Distance between the zones.

Solution
ENM 324 Facilities PlanningPrepared by: Asst. Prof. Dr. Nevra
AKBILEK63
>8, 8 yield values of 0,1respectively. We can then set up the [aij] matrix on figure left side matrix: