implementing cellular manufacturing methodologies to
TRANSCRIPT

Implementing Cellular Manufacturing Methodologies to Improve thePerformance of a Manufacturing Operation
By
Manuel CorreaB.S. Mechanical Engineering, Rice University, 2004
Submitted to the MIT Sloan School of Management and the Engineering Systems Division in PartialFulfillment of the Requirements for the Degrees of
Master of Business Administration MASSACHUand OFTE
Master of Science in Engineering Systems
In conjunction with the Leaders for Global Operations Program at theMassachusetts Institute of Technology LIB
June 2011
C 2011 Manuel Correa. All rights reserved.The author hereby grants MIT permission to reproduce and to distribute publicly copies of this thesis
document in whole or in part in any medium now known or hereafter created.
Signature of Author:May 6,2011
MIT Sloan School of ManagementEngineering Systems Division
Certified by:Dr. Damel hitney, Theiupervisor
Sr. Research Scientist, Engineering ystems Division
Certified by:IW/Roy Welsch, Thesis Supervisor
Professor of Statistics and Management.Science. Sloan School of Management
Accepted by:
Accepted by:
S SVeoi iBerechmanof MBA Program, MIT Sloan School of Management
Dr. Nancy LevesonProfessor of Aeronautics anc Astronautics and Engineering Systems
Chair, Engineering Systems Division Education Committee
SETTS INSTITUTECHNOLOGY
15 2011
RARIES

This page intentionally left blank.
N '146'V

Implementing Cellular Manufacturing Methodologies to Improve thePerformance of a Manufacturing Operation
By
Manuel CorreaB.S. Mechanical Engineering, Rice University, 2004
Submitted to the MIT Sloan School of Management and the Engineering Systems Divisionon May 6, 2011 in Partial Fulfillment of the Requirements for the Degrees of
Master of Business AdministrationAND
Master of Science in Engineering Systems
AbstractMany traditional high-mix, low-volume manufacturing facilities utilize process villages, whereby similaroperations are grouped together in an effort to gain efficiencies. While process villages can improvecertain metrics and increase capacity utilization, many wastes can be created that outweigh most benefits.In many cases process villages operate with large batch sizes, which result in longer lead-times andincreased inventories. A different approach, for an appropriate range of product mixes and volumes, is toform production cells for common products that group different processes together to form completevalue streams. The manufacturing cells focus on completely finishing products before handing them offand result in reduced lead-times and inventories. This thesis presents a methodology for implementingsuch production cells in a manufacturing environment.
The author spent six months at a leading aerospace company implementing cellular manufacturingprinciples in designing several production cells for a transmission component manufacturing departmentas part of a lean transformation effort. The cell design methodology implemented consisted of severalkey processes such as process flow design, material handling design, workplace organization, andstaffing. The process flow design consisted of activities such as grouping products into families,designing value streams, and performing capacity analyses. Material handling design developed solutionsfor how products physically flow through the cell and managing work-in-process. Workplaceorganization focused on utilizing visual factory and 5S principles to ensure strong communication andinformation flow as well as first class equipment organization and housekeeping. Finally, workloadanalyses were performed to appropriately staff the cells to minimize costs and ensure efficient operations.
Ultimately, the goal of any transformation effort is to reduce waste and add value, which would not bepossible if the culture of the organization did not support the physical and operational design changes.Hence the final, and arguably most important piece of the transformation, which the author participatedin, was engaging the workforce to drive the culture change.
Thesis Supervisor: Roy WelschTitle: Professor of Statistics and Management Science, Sloan School of Management
Thesis Supervisor: Daniel WhitneyTitle: Sr. Research Scientist, Engineering Systems Division

This page intentionally left blank.

Acknowledgements
First, I would like to acknowledge the Leaders for Global Operations Program for their support of this
work and for the opportunity to participate in such an excellent program. The last two years have been
some the most memorable of my life. I would like to thank the employees at RazorAircraft for making
my internship experience so memorable, especially Brian and Lory. Without their direction and
supervision, this thesis would not have been possible. I would also like to thank my thesis supervisors,
Roy Welsch and Daniel Whitney, for their support, advice, and insight. I would like to thank my peers in
the LGO program for their amazing friendship during these last two years. I will definitely miss all of
you. Finally, I would like to thank my wife, Nancy, for her unconditional love and support. She has been
and will always be a guiding light in my life and source of strength and encouragement.

This page intentionally left blank.

Table of Contents
Abstract ............ .......................................................................................................................................... 3
Acknowledgem ents, ....................................................................................................................................... 5
Table of Contents .......................................................................................................................................... 7
List of Figures ............................................................................................................................................... 9
List of Tables ................................................................................................................................................ 9
Disguised Inform ation................................................................................................................................. 10
Chap ter 1: Introduction ............................................................................................................................... I 1
1.1 RazorA ircraft Background ................................................................................................................ 11
1.2 Thesis Outline ................................................................................................................................... 12
Chapter 2: The Problem .............................................................................................................................. 14
2.1 Situation at RazorA ircraft ................................................................................................................. 14
2.2 Transm ission Component Departm ent Current State .................................................................... 15
2.3 Transm ission Com ponent M anufacturing Process ........................................................................ 18
Chapter 3: Cellular M anufacturing .......................................................................................................... 20
3.1 Process V illages ................................................................................................................................ 20
3.1 From Process Villages to Cellular Manufacturing ................................ 22
3.2 Lean M anufacturing at RazorAircraft............................................................................................ 24
Chapter 4: Transm ission Component Shop Transform ation.................................................................. 25
4.1 Cell Design Process According to RazorA ircraft ......................................................................... 25
4.2 Analysis of Constraints and Ideal Conditions.............................................................................. 27
4.3 Progress M ade Prior to Author's Internship at RazorAircraft ...................................................... 29
4.4 Transform ation Steering Com m ittee and Plan of Action............................................................. 31
4.5 Process Flow Design......................................................................................................................... 32
4.6 M aterial Handling ............................................................................................................................. 41
4.7 W orkplace Organization ................................................................................................................... 46
4.8 Staffing Plan......................................................................................................................................50
4.9 Cultural Transform ation.................................................................................................................... 53
Chapter 5: Results of Transformation ..................................................................................................... 56
5.1 Current Progress and Lessons Learned ......................................................................................... 56
7

5.2 Results and Predicted Improvements............................................................................................ 57
5.3 Cost / Benefit Analysis ..................................................................................................................... 58
Chapter 6: Conclusions ............................................................................................................................... 60
6.1 General Fram ework of the Problem .............................................................................................. 60
Bibliography................................................................................................................................................ 62
8
List of Figures
Figure 1: RazorAircraft Revenue Growth.............................................................................................. 12
Figure 2: Transm ission Dem and Growth................................................................................................. 14
Figure 3: Process Village Diagram .......................................................................................................... 16
Figure 4: Transm ission Component Spaghetti Diagram ......................................................................... 17
Figure 5: Transm ission Com ponent Fabrication Value Stream ............................................................. 19
Figure 6: Process Village Diagram .......................................................................................................... 21
Figure 7: Production Cell Diagram ....................................................................................................... 23
Figure 8: Balanced Process......................................................................................................................... 27
Figure 9: Transm ission Component Cell Diagram .................................................................................. 31
Figure 10: Sample Product Cycle and Takt Tim es .................................................................................. 36
Figure 11: Final Cell Design with Process Flow .......................................................... 41
Figure 12: Tabletop Simulation .................................................................................................................. 43
List of Tables
Table 1: Cell Takt Tim e.............................................................................................................................. 33
Table 2: Cell Product Takt Time................................................................................................................. 33
Table 3: Sample Product Process Plan................................................................................................... 34
Table 4: Sum m ary of Capacity Analysis ................................................................................................ 35
Table 5: Every Part Every Interval Example ......................................................................................... 39
Table 6: M aterial Handling Cart Routes ................................................................................................ 46
Table 7: Example W orkload Analysis ........................................................................................................ 52
Table 8: Exam ple W orkload Analysis - Setups ...................................................................................... 52
Table 9: W orkload Analysis - Final............................................................................................................53
Table 10: Sum m ary of Predicted Operational Im provem ents ............................................................... 58
Table 11: Financial Analysis of Transformation Project (Thousands of Dollars).................................. 59
9
Disguised Information
This thesis is the result of the author's internship experiences working at a leading aerospace/aircraft
manufacturing company in the United States. In order to ensure that competitors do not gain an
advantage from the information gathered, the company's name will be disguised as RazorAircraft. Per
RazorAircraft's request, potentially sensitive information will be protected. Specific identifying
information has been disguised, several sources have been masked, and the scale has been removed from
a number of graphs.
Chapter 1: Introduction
The pressure for companies to perform has never been greater than it is today. As globalization has taken
off, competition among companies all over the world has only grown stronger. Older, slower, well-
established companies are being laid to waste by younger, more agile ones. As companies struggle to
compete, the need to find more efficient ways of operating is more important than ever.
Manufacturing organizations in particular have been hard hit in recent years, facing relentless competition
from companies operating in ever-lower cost countries. As these companies attempt to survive, they look
for whatever opportunities they can find to become more effective, more efficient, and to lower costs.
Many tools exist today that help companies by eliminating waste and transforming their operations. Lean
Manufacturing, Six Sigma, and the Toyota Production System, are all philosophies and systems designed
to improve the performance of business and manufacturing processes. Among these principles is the
concept of cellular manufacturing, a form of organizing the physical layout of a manufacturing process in
order to improve the performance and reduce waste. Even though the fundamental ideas have existed for
decades, many companies even to this day fail to understand and implement its important concepts. The
author spent an internship at RazorAircraft, focused on transforming one such operation by implementing
cellular manufacturing methodologies. The transmission component department at RazorAircraft was
struggling to keep up with rising demand, and it was becoming obvious that its traditional method of
operations would no longer suffice. By rearranging the shop into several production cells, each focused
on a different product family, the shop would be able to focus and simplify its operations. The challenge,
of course, is effectively implementing the necessary methodologies to improve the performance of the
operations. In the case of the cell transformation effort at RazorAircraft, the expected benefits for one
product family include: a 73% reduction in inventory, an 84% reduction in lead time, a 40% reduction in
staffing levels, and a 62% reduction in part travel.
1.1 RazorAircraft Background'
RazorAircraft is a leading American aerospace and aircraft manufacturing company with operations in
many different parts of the world. The company has several business units focused on a variety of
different products for both commercial and military aerospace applications. RazorAircraft has a long and
rich history of strong innovation and pioneering many of the technologies still in use today. They have
also had impressive growth and remarkable financial performance, which is highlighted in Figure 1
below.
(RazorAircraft)
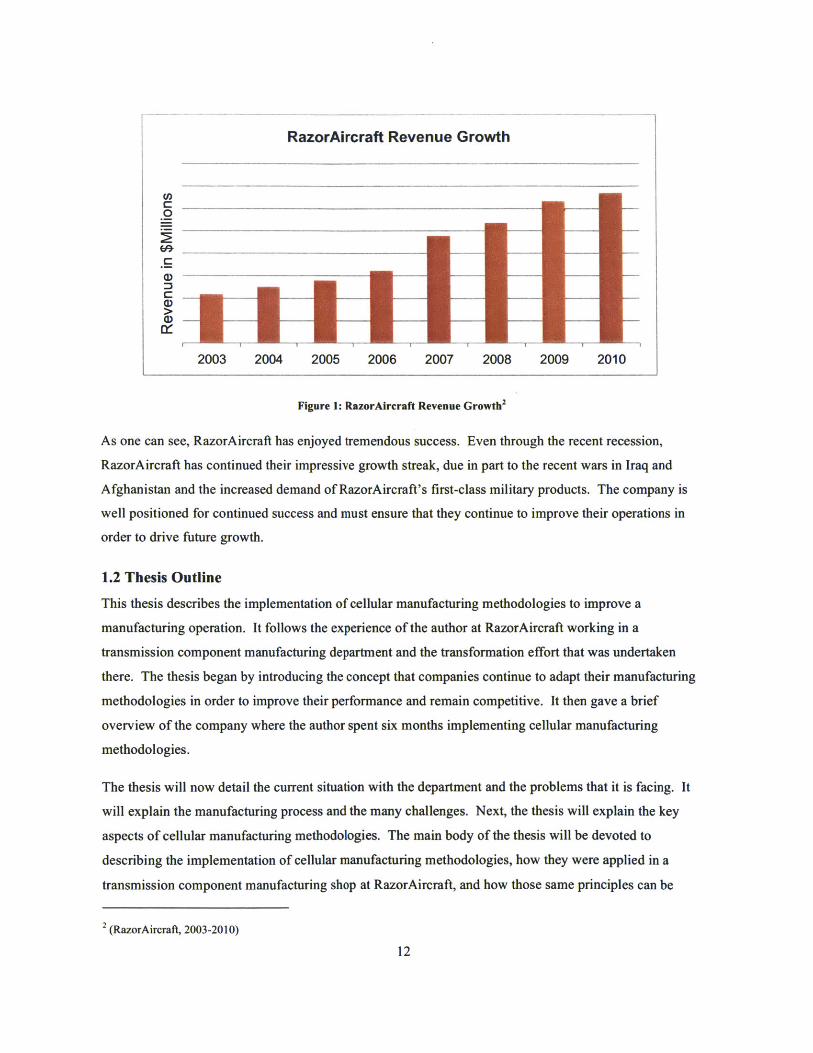
RazorAircraft Revenue Growth
2003 2004 2005 2006 2007 2008 2009 2010
Figure 1: RazorAircraft Revenue Growth2
As one can see, RazorAircraft has enjoyed tremendous success. Even through the recent recession,
RazorAircraft has continued their impressive growth streak, due in part to the recent wars in Iraq and
Afghanistan and the increased demand of RazorAircraft's first-class military products. The company is
well positioned for continued success and must ensure that they continue to improve their operations in
order to drive future growth.
1.2 Thesis Outline
This thesis describes the implementation of cellular manufacturing methodologies to improve a
manufacturing operation. It follows the experience of the author at RazorAircraft working in a
transmission component manufacturing department and the transformation effort that was undertaken
there. The thesis began by introducing the concept that companies continue to adapt their manufacturing
methodologies in order to improve their performance and remain competitive. It then gave a brief
overview of the company where the author spent six months implementing cellular manufacturing
methodologies.
The thesis will now detail the current situation with the department and the problems that it is facing. It
will explain the manufacturing process and the many challenges. Next, the thesis will explain the key
aspects of cellular manufacturing methodologies. The main body of the thesis will be devoted to
describing the implementation of cellular manufacturing methodologies, how they were applied in a
transmission component manufacturing shop at RazorAircraft, and how those same principles can be
2 (RazorAircraft, 2003-2010)

applied to other operations. It will explain the plan of action, the frameworks used, and the importance of
each. Finally the progress made and results will be discussed along with concluding comments and
thoughts.

Chapter 2: The Problem
2.1 Situation at RazorAircraft
RazorAircraft had been a relatively stable growth company for many years. However, beginning in the
early twenty-first century, the company began an impressive growth spurt fueled by the ongoing war
efforts in the Middle East and beyond. Demand for their popular military products began to surge, and
RazorAircraft struggled to keep up with demand. As the demand for their products increased, the demand
for their transmission components increased proportionally. Not only were orders for new aircraft driving
demand for transmission components, but the aircraft that had been in service in the extremely harsh
desert environments needed transmission overhauls and transmission component replacements as well.
The combination of products needed to satisfy new orders as well as spares was pushing the shop to its
limits. For the next few years, the orders continued to climb as shown below in Figure 2.
40% Volume Growth in Transmission Demand
C,
0
'06Avg '07Avg '08Avg '09Q1 '09Q2 '09Q3 '09Q4 '1OQ1 '10Q2 '10Q3 '10Q4per per per Avg per Avg per Avg per Avg per Avg per Avg per Avg per Avg per
Month Month Month Month Month Month Month Month Month Month MonthU Production N Spares R Prior Years
Figure 2: Transmission Demand Growth
Unfortunately, during this time, not much was done to change the way the transmission component shop
operated. Each day it was becoming more painfully obvious that the shop was not equipped to handle the
influx of orders. Within a few short years, the shop was being asked to produce twice as many
components as it historically had with essentially the same machines, workforce, and processes. As the
orders continued to pour in, the shop began to lose control. Inventories started accumulating, lead-times
increased, quality issues were cropping up, and the shop was becoming more and more difficult to
manage. However, because management was so focused on fighting the day-to-day fires, there was no
time to devote to overhauling the operations. Finally, the decision was made to undergo a transformation
effort.
2.2 Transmission Component Department Current State
The Precision Transmission Component Department at RazorAircraft is a high-mix, low-volume machine
shop that manufactures transmission components for use in both commercial and military aircraft. It is
responsible for manufacturing over a hundred different components. The shop contains many different
types of machines and is capable of manufacturing a completed product beginning with a raw forging.
The shop houses dozens of machines ranging in type from horizontal and vertical lathes, to milling and
drilling machines, to surface grinding machines. The basic transmission component manufacturing value
stream consists of rough machining of a raw forging, followed by carburizing and heat treating, final
machining, and then surface finishing and final inspection. The machine shop itself contains the majority
of the manufacturing value stream process steps for transmission components, with the exception of the
chemical and heat-treating activities. While the shop only manufactures the individual transmission
components, ultimately the goal of the parent organization is to produce complete transmission
assemblies or "ship sets" to be installed onto the aircraft. This plays an important role in how the
organization functions because it requires the shop to produce a wide variety of products on a regular
basis in order to ensure complete ship sets can be assembled.
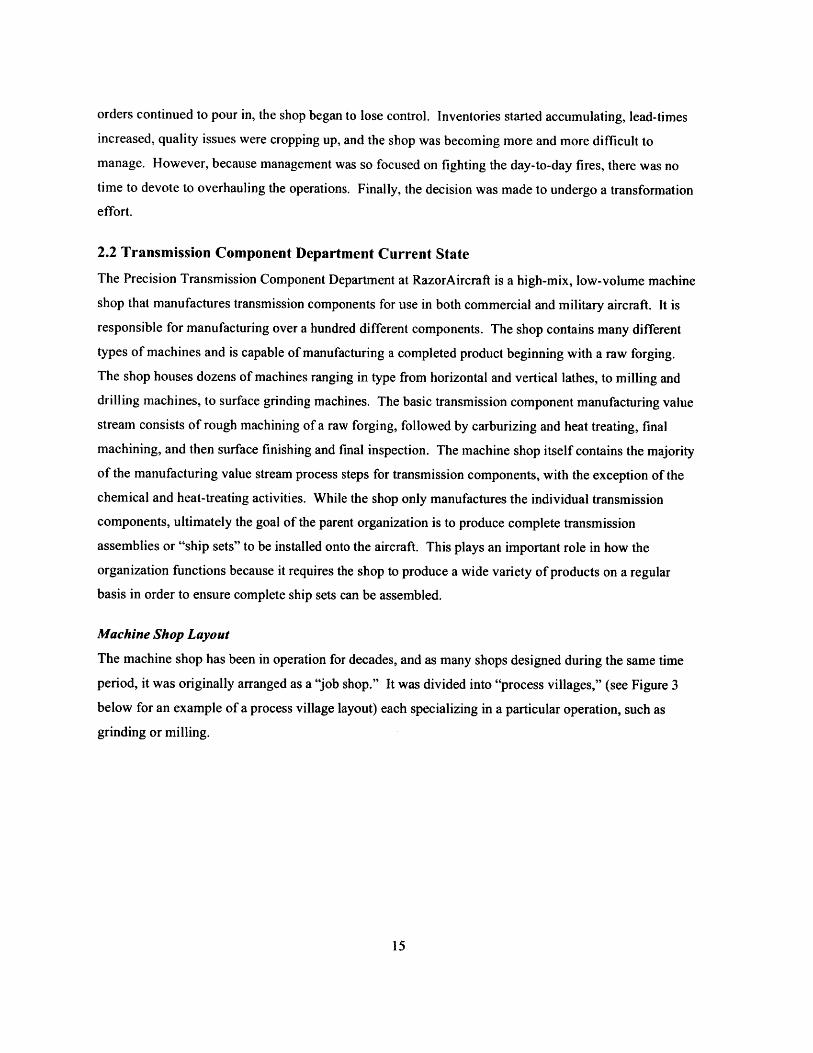
Machine Shop Layout
The machine shop has been in operation for decades, and as many shops designed during the same time
period, it was originally arranged as a "job shop." It was divided into "process villages," (see Figure 3
below for an example of a process village layout) each specializing in a particular operation, such as
grinding or milling.
Process Village Layout
Figure 3: Process Village Diagram
However, over the years, the shop has grown organically without following much of a true pattern. Old
machines have been removed, and new machines have been installed wherever room was available. Due
to the limitations in physical space allocated to the shop, machines were sometimes placed outside of their
process village. Obviously it would take a tremendous amount of work to relocate machines every time a
new machine was purchased. Over time, this has led to the current state of the shop, which is lacking a
sense of organization.
Process Flow
The machine shop processes many different kinds of transmission components, ranging in size and shape.
No two products are exactly alike, and no two are made exactly the same way. Generally speaking, while
each component goes through roughly the same set of processes, the specific detailed operations differ
and are not always performed in the same order. At the same time, machines are shared amongst many
different products. As previously mentioned, machines are located with the design remnants of process
villages. As a result, the work through the machine shop is difficult to manage. There is no semblance of
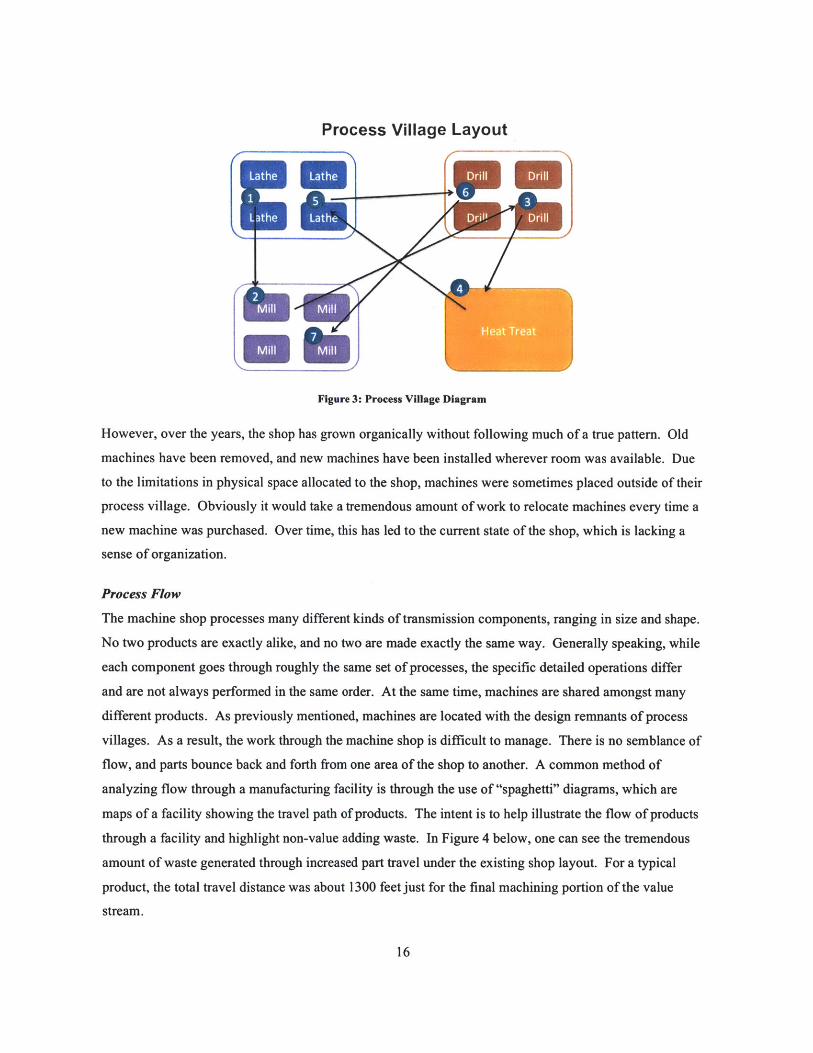
flow, and parts bounce back and forth from one area of the shop to another. A common method of
analyzing flow through a manufacturing facility is through the use of "spaghetti" diagrams, which are
maps of a facility showing the travel path of products. The intent is to help illustrate the flow of products
through a facility and highlight non-value adding waste. In Figure 4 below, one can see the tremendous
amount of waste generated through increased part travel under the existing shop layout. For a typical
product, the total travel distance was about 1300 feet just for the final machining portion of the value
stream.
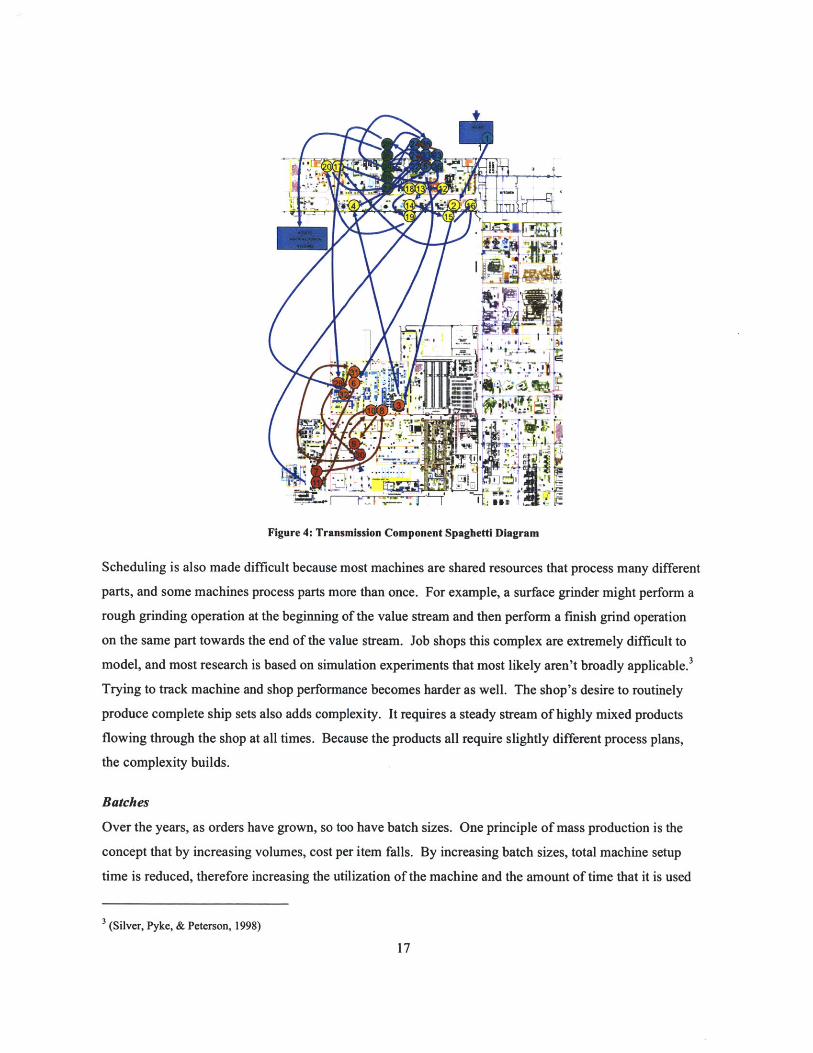
Figure 4: Transmission Component Spaghetti Diagram
Scheduling is also made difficult because most machines are shared resources that process many different
parts, and some machines process parts more than once. For example, a surface grinder might perform a
rough grinding operation at the beginning of the value stream and then perform a finish grind operation
on the same part towards the end of the value stream. Job shops this complex are extremely difficult to
model, and most research is based on simulation experiments that most likely aren't broadly applicable.3
Trying to track machine and shop performance becomes harder as well. The shop's desire to routinely
produce complete ship sets also adds complexity. It requires a steady stream of highly mixed products
flowing through the shop at all times. Because the products all require slightly different process plans,
the complexity builds.
Batches
Over the years, as orders have grown, so too have batch sizes. One principle of mass production is the
concept that by increasing volumes, cost per item falls. By increasing batch sizes, total machine setup
time is reduced, therefore increasing the utilization of the machine and the amount of time that it is used
3 (Silver, Pyke, & Peterson, 1998)
for value-added work.4 While this logic is in fact correct, increasing batch sizes has many negative
effects as well. For one, increasing batch sizes leads to more inventory on the factory floor. Increased
inventory levels not only tie up capital that could be used elsewhere, but also take up more floor space,
thereby adding clutter and chaos. Another negative effect of increasing batch sizes is that the lead-times
of individual products often increase, because in many cases the whole batch is held until the last part is
finished. Because parts have to wait for one another in a batch, the total amount of time that each part
spends waiting increases; therefore, the total lead-time increases. As will be discussed in detail later,
RazorAircraft looked at the possibility of releasing individual parts within a batch in order to solve this
problem. Increasing batch sizes also results in less flexibility in the manufacturing process. With large
batch sizes, it is very difficult to respond to changes in production orders or customer demands.
Likewise, defects take longer to identify, and it results in larger quantities of parts requiring rework, or in
some cases to be discarded. For the transmission component shop's most highly demanded product,
average lead-times for just one portion of the value stream were in excess of 40 days, with actual
processing time of just 45 hours.
It was clear that the machine shop was far from efficient before the transformation effort went underway.
Management knew that the old legacy "job shop" processes that were in place could no longer support the
increasing demand that the shop was facing, and drastic changes were needed.
2.3 Transmission Component Manufacturing Process
In order to understand the cell design process that took place at the transmission component shop at
RazorAircraft, it is helpful to understand the transmission component manufacturing process. Aircraft
transmission components are not average pieces of machined hardware. They are precision-machined
parts with extremely tight tolerances that in some cases are measured in millionths of an inch. There is
virtually no margin for error, and they are, therefore, extremely difficult to manufacture. Fabrication is a
long and tedious process that involves many steps, many different pieces of equipment, and a
considerable amount of time. See Figure 5 below for a simplified value stream map of the fabrication
process.
4 (Womack & Jones, 1996)

Rough Machining Heat Treat Final Machining Finishing
Rough Turning Copper Plating Grinding PolishingShaping Carburization Turning Final Inspection
Hardening Milling / Drilling
Figure 5: Transmission Component Fabrication Value Stream
As one can see from the figure, the fabrication process is essentially broken down into four key stages.
At the beginning of the value stream, the part starts as a raw forging. The first series of processes involve
rough machining operations to give the part its general shape. From here, the part goes through several
chemical and heat-treating processes designed to give the metal its final properties, such as a specific
hardness and strength. After being heat-treated, the part goes through a long series of final machining
operations to bring the part within its ultimate set of dimensions. The final machining includes surface
grinding, turning, milling, and drilling. Once these operations are complete, the part is run through a few
finishing operations such as polishing and various types of final inspections before being incorporated in
the transmission assembly process and ultimately installed on an aircraft.
The machine shop is responsible for both rough and final machining operations, with the heat-treating and
fmishing operations taking place in another area. Again, one of the reasons for the difficulties facing the
shop is that many individual machines are utilized at different stages in the process for different parts.
Therefore, scheduling parts becomes a complex task that requires perfect coordination to properly
function.
In this chapter, the author presented the problem facing RazorAircraft and described the current operating
conditions of the transmission component shop, such as lack of flow, large batch sizes, and long lead
times. The general transmission component manufacturing process was also explained to highlight the
challenges with this environment. In the next chapter, the author will present an overview of cellular
manufacturing by describing different manufacturing layouts and the principles behind each one.

Chapter 3: Cellular Manufacturing
For as long as people have been manufacturing products, they have sought to find more efficient
production methods. One of the most fundamental factors in determining how work is accomplished in a
manufacturing operation is in the layout of the work and processes. Manufacturing layouts play a vital
role in how work is performed, how products and information flow, how workers communicate with one
another, and the resulting operational performance. For example, a production shop that consists of
separate, isolated processes will obviously behave very differently than one where all activities take place
within one open area.
Before discussing the different manufacturing layouts, it's useful to think about the spectrum of
manufacturing environments that exist along the two dimensions of product mix and volume. At one end
of the spectrum would be a mass production environment perhaps producing only one product at very
high volumes. At the other end of the spectrum would be an environment with very high product mix,
each in very low volumes. An example of this would be an artisan shop where every product is different
and only made once. If we think about how different these environments are, it becomes clear that certain
manufacturing layouts may be more useful than others in each of these scenarios.
Prior to 1915 and the rise of mass production, most manufacturing was essentially done in craft shops
with skilled workers performing all steps to complete a product in the same workspace. Mass production
introduced the concept of dividing up manufacturing work into small portions, each performed by
specialized workers trained only on that specific operation, and then performed in a sequence.5 Mass
production principles were also responsible for creating the notion of a moving assembly line, which laid
the foundations for one-piece flow production methods that are now integral to lean and cellular
manufacturing. While the moving assembly line worked great for low-mix, high-volume manufacturing,
the concepts were less often applied to high-mix, low-volume operations, which generally remained craft
shops.
3.1 Process Villages
Process villages refer to manufacturing facilities that are organized by process as opposed to by value
stream (such as an assembly line in a mass production facility). In a machine shop, this may mean
locating all of the lathes in one area, all of the milling machines together in another area, etc. See Figure
6 below for an example of what a factory could look like arranged into process villages.
5 (Womack, Jones, Roos, & Carpenter, 1990)

Process Village Layout
Figure 6: Process Village Diagram
Thinking again about the spectrum of manufacturing environments that exists, process villages may be
more useful in an environment of very high product mix and very low volumes. In this environment,
products are very different from one another and perhaps follow very different process paths, so it may
make sense to collocate processes. In fact, a given product made be made only once. Many times
manufacturing facilities begin on this end of the spectrum, but over time as business grows, so do
volumes, and perhaps products are standardized, or low volume products are eliminated, therefore
decreasing the variety of products. Many facilities may choose to keep their process village arrangement
in an effort to increase individual process efficiencies. Rather than looking at continuously improving the
whole value stream of each product, process village production methods seek to isolate processes and
focus on increasing efficiencies within processes, leading to local optimums at the expense of the whole.
By dividing up value streams into chunks and managing each separately, each process group has an
incentive to maximize efficiency at the expense of the others. The process villages become experts in
their respective tasks, and so their individual utilization and throughput increase. However, it is important
to note that the output of the entire value stream does not necessarily increase. As work is introduced into
the process village, the leader can balance the work across each machine and maintain very high levels of
utilization, assuming there is enough work to be done. One important downside is that each process
group has an incentive to increase batch sizes in order to improve their metrics. With larger batches, total
setup time falls, so utilization and throughput increase. In extreme cases with inadequate inventory
management, huge buffers will pile up downstream of each process village as each group seeks to
maximize their throughput. The buffers result in increased lead-times, which negatively affects the entire
value stream and the ability to respond to customer needs. Ultimately, the process villages do not place a
priority on the throughput of the entire value stream and the importance of satisfying customer demand
rates.
3.1 From Process Villages to Cellular Manufacturing
Cellular manufacturing reverses the concepts of process villages and instead collocates operations such
that families of similar parts can have a series of operations performed in a sequence within a single
workspace. It is essentially a form of lean production and utilizes the same basic principles but in a
mixed model environment when more than one product is being manufactured. The basic underlying
principle is that rather than have work grouped by process in order to achieve process efficiencies; the
work is grouped into separate complete value streams for each product family. Along the spectrum of
manufacturing environments, cellular manufacturing principles are applicable in a wide range of volume
and product mixes, but not at the extreme end of the low-volume, high-mix environments. In these cases,
there would be a need for a very high number of cells, each of which may not have enough volume to fill
it, leading to very low utilization of equipment and a waste of capital. Cells are most appropriate when
there is a reasonable number of products or product families, and they are made again and again.
Cellular manufacturing methodologies include the clustering of processes and machines that are needed to
completely finish a part. In simplest terms, once a part is started, it is finished before it moves on. The
goal is, therefore, to improve value stream efficiencies. As much of the value stream as possible is co-
located in order to facilitate flow, reduce part travel, reduce buffer inventories and waste in general. From
the classic lean book Lean Thinking, the lean process was defined as first identifying the value, then
mapping the value stream, creating flow, creating pull, and finally creating perfection through continuous
improvement. 6 Cellular manufacturing attempts to achieve these lean goals and break up the complexity
of multi-product manufacturing by creating complete value streams each with their own flow and pull. It
applies the fundamental lean principles to individual product families within a multi-product
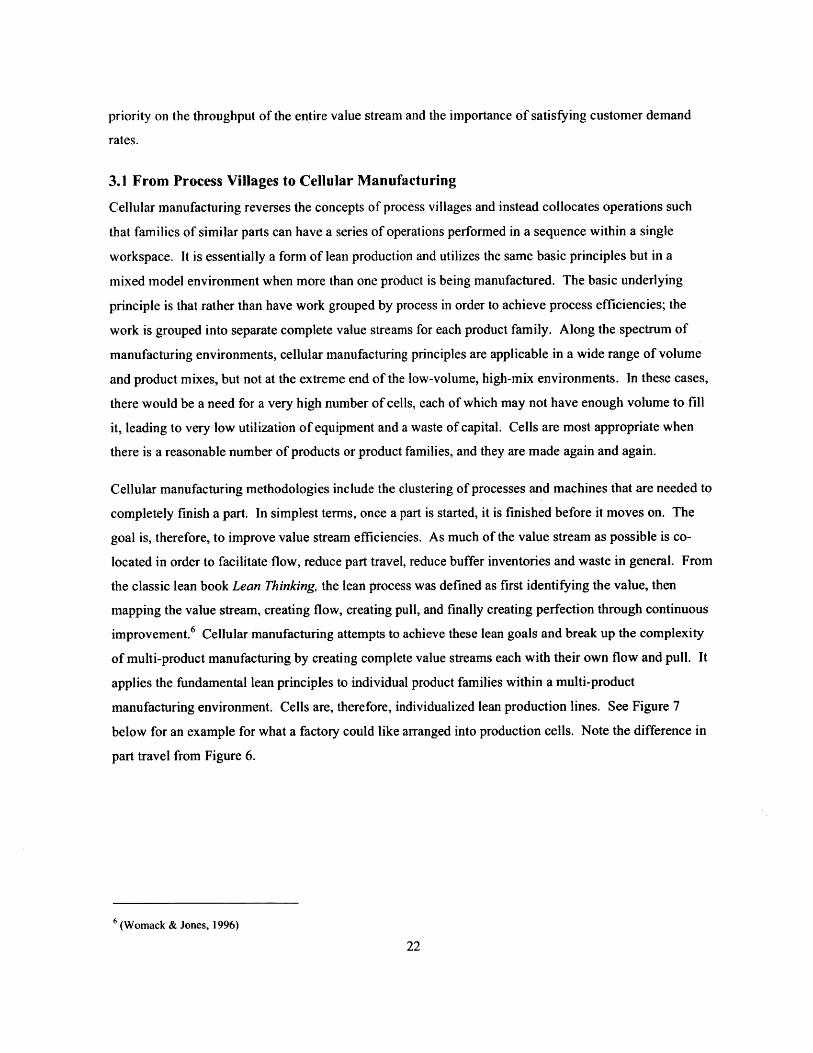
manufacturing environment. Cells are, therefore, individualized lean production lines. See Figure 7
below for an example for what a factory could like arranged into production cells. Note the difference in
part travel from Figure 6.
6 (Womack & Jones, 1996)
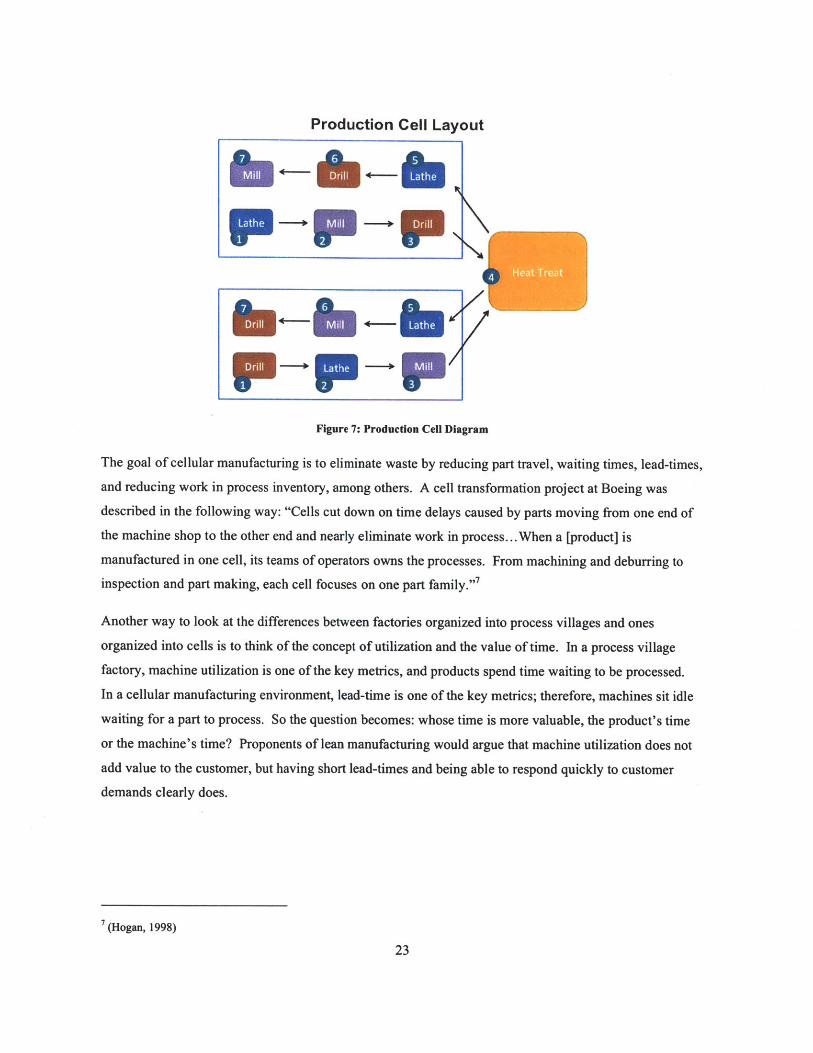
Production Cell Layout
4LHattrea
Figure 7: Production Cell Diagram
The goal of cellular manufacturing is to eliminate waste by reducing part travel, waiting times, lead-times,
and reducing work in process inventory, among others. A cell transformation project at Boeing was
described in the following way: "Cells cut down on time delays caused by parts moving from one end of
the machine shop to the other end and nearly eliminate work in process.. .When a [product] is
manufactured in one cell, its teams of operators owns the processes. From machining and deburring to
inspection and part making, each cell focuses on one part family." 7
Another way to look at the differences between factories organized into process villages and ones
organized into cells is to think of the concept of utilization and the value of time. In a process village
factory, machine utilization is one of the key metrics, and products spend time waiting to be processed.
In a cellular manufacturing environment, lead-time is one of the key metrics; therefore, machines sit idle
waiting for a part to process. So the question becomes: whose time is more valuable, the product's time
or the machine's time? Proponents of lean manufacturing would argue that machine utilization does not
add value to the customer, but having short lead-times and being able to respond quickly to customer
demands clearly does.
(Hogan, 1998)
3.2 Lean Manufacturing at RazorAircraft8
RazorAircraft has long been a proponent of lean manufacturing principles and processes. Beginning in
the late 1980s, they strived to implement many of the principles pioneered by Toyota in their Toyota
Production System. In the late 1990s, they developed a unique operating system, designed to function as
a continuous improvement program utilizing many of the principles of lean manufacturing, the Toyota
Production System, and Six Sigma. The program is process oriented and data driven with the goal of
eliminating waste and adding value to the customer as the primary focus. It has several key components,
such as lean tools and cultural values, each with many elements. For example, the lean tools include
detailed processes on how to perform standard work, how to utilize 5S visual workplace techniques, value
stream process management, etc.
Even though the corporate office developed a comprehensive operating system designed to take
advantage of the latest manufacturing principles and to achieve continuous improvement, rolling it out to
the factory floor has been a completely different challenge. The adoption of the program throughout the
company has been much slower than the developers would have wanted. Certainly, some areas of the
company have been quicker than others to utilize the techniques provided. As a company grows in size,
certain elements and divisions do not always share the same culture and practices as others, to which
RazorAircraft is no exception. The facility where the author spent his internship implementing cellular
manufacturing methodologies had its share of difficulties attempting to adopt even the most basic lean
manufacturing principles. It is a struggle that many passionate employees have fought to overcome, and
will continue to take much time.
8 (RazorAircraft)
Chapter 4: Transmission Component Shop Transformation
The transmission component shop at RazorAircraft had been the subject of transformation effort talks for
many years. It seemed to be well understood that there were problems with inventory management,
process flow, and others that were common to job shops with similar structures. There had been talk of
transforming the shop into production cells, but nothing ever materialized. Finally, in 2008, a
comprehensive case for change was made. A new aerospace program was in development, and it was
going to need additional manufacturing space. A section of the transmission component shop had been
identified as the future location of one portion of the manufacturing for the new program, so this space
would have to be vacated. At the same time, a nearby location had just been recently vacated and was
identified as the new home for the displaced equipment from the shop. The transmission component shop
management, realizing the amount of work that relocating the equipment would take, identified it as an
opportunity to step back and rethink the entire structure and layout of the shop. Perhaps now was their
chance to transform the shop once and for all.
Once the opportunity to create manufacturing cells was identified, the transformation process could begin.
As with any major endeavor, a significant amount of pre-work, design, and planning needs to take place
to ensure a successful transformation. Restructuring a job shop to a cell-based operation is not a simple
task, requires a tremendous amount of work to be coordinated between many stakeholders, and there are
many important considerations that need to be made.
4.1 Cell Design Process According to RazorAircraft
As previously mentioned, the company that underwent this transformation had a comprehensive lean
operating system in place. As part of this system, a series of tools had been developed to help perform
various continuous improvement activities, one of which is a cell design process. The process provided a
very valuable framework for the design of the transmission component cell that the author performed.
The process defined by RazorAircraft's operating system consists of about twenty detailed process steps,
but can be thought of as having four key phases.
Phase One: Product Grouping
In the first phase, all of the products that the organization currently manufactures are compared to one
another on several measures, such as demand, physical properties of each product, etc. The process to
manufacture each product is also analyzed, and key similarities and differences are noted. From the
analysis, a matrix is built showing how each product relates to one another. Using the matrix as a guide,
the products can then be grouped together in a logical manner. The products in each group will share
many physical similarities, follow similar manufacturing processes, have similar cycle times, etc.25
Phase Two: Process Flow
Once the products have been grouped with one another, each group or family can then be analyzed
independently. Ideally, a different cell would be designed and built for each product family. However, as
I will discuss in detail, there are many potential constraints that could limit an organization's ability to do
this. The key activities during the process flow phase would then be to build value stream maps for each
product family and look for opportunities to modify the manufacturing processes of individual products
so that products within each product family follow the same process. Another element of this phase is to
identify the preliminary layout of the cell. This can be done in a variety of ways, but one especially
useful technique is through the use of spaghetti diagrams, which track the physical movement of the
products through the manufacturing process. Ultimately, in an effort to eliminate waste, one goal of the
transformation process would be to design efficient cells that significantly reduce the distance the
products travel.
Phase Three: Activity Analysis
The third phase of activities focuses on the detailed operation of the cell and how each activity within the
cell will be performed. This consists of exercises such as takt time planning, which helps dictate the pace
that the cell needs to perform at. Time observations of the existing processes and operations are also
completed to see how balanced the cell will be. Alongside that, a detailed capacity analysis is completed
to ensure that the machines and/or operators within the cell will be able to meet the demand for each
product and product family.
Phase Four: Final Layout and Standard Work
In the fourth phase of the cell design process, the main objective is to synthesize the analysis that has been
done and develop the final layout of the cell. Along with the layout, standard work sheets are developed
to show how exactly how the cell will operate. Standard worksheets detail each operation that is
performed within a cell, how long it takes, what's required to complete the operation, etc. Finally, a
future state value stream map is built to help illustrate what process changes are being made. The future
state value stream map remains a green document that must be revisited on a periodic basis to ensure
continuous improvement of the cell and manufacturing processes.
The cell design process provided through RazorAircraft's operating system is a useful framework for
approaching any job shop to cell transformation effort, and the author relied extensively on this
methodology. However, there are some important subjects that the framework does not take into account.
RazorAircraft's framework is heavily operations focused and ignores many other aspects of the cell
design process. As will be detailed in the coming sections, the author, as part of the transformation

steering committee at RazorAircraft, expanded upon the existing cell design process and divided it up intofour subject areas, only one of which was focused on the standard operational elements of the process.
4.2 Analysis of Constraints and Ideal Conditions
Prior to beginning any transformation effort, it is important to note what constraints the project is subject
to. Obviously, achieving the perfect manufacturing system through a transformation is not realistic.
There will in many cases be significant limitations that impact the results of the project, and the
transformation effort at RazorAircraft was no different.
First of all, it is important to note the differences between a transformation of an existing facility and a"greenfield" project. Companies looking to build an entirely new manufacturing plant with state of the
art machinery and manufacturing best practices would face a much different set of circumstances than a
legacy facility. Simply having new equipment would immediately give the new plant a distinct
advantage. Machining equipment has improved substantially over the years with advances in speed,
quality, controls, and precision. Older machines, while technologically less sophisticated, also suffer
from wear and tear, which makes them less accurate and consistent over time.
RazorAircraft was faced with two major constraints that are common to many transformations and that
significantly impacted its efforts: physical space and capital. Under ideal conditions, RazorAircraft
would have had the capital to purchase brand new equipment specifically designed for the revised cellular
flow process as well as have the physical space to arrange the machinery in the most efficient and
effective manner. In this scenario, the cell could be designed perfectly balanced, meaning each machine
would perform its series of operations in the same amount of time, so there would be no need for work-in-
process inventory between operations. The cell could operate in perfect flow with perfect pull.
Scheduling would be entirely eliminated, and the only inventory within the cell would be physically
working in each machine. There would be no need for buffer inventory between each machine. This
assumes that every product manufactured in the cell follows the same process path and has the same cycle
times. See Figure 8 below for an example of a balanced process.
2 hr/part
1 hr/part 1 hr/part D hr/part 1 hr/part
2 hr/part
Figure 8: Balanced Process

As a result of limited capital, existing assets could restrict the cell design process. Suppose four new cells
are to be built, and each cell needs a particular machine. If there are not four machines currently
available, and no funding exists to purchase additional machines, then the cells would have to be designed
in a different and potentially less efficient manner. A decision would have to be made on how to share
the limited resources. For example, the cells lacking the necessary machines may be required to send
their products outside the cell in the middle of the manufacturing process in order to have the required
operation completed. Obviously this would add waste in the form of traveling products and non-value
adding time. Likewise, it would add complexity in coordinating the movement of products and the
sharing of the limited machines. In a sense, it would create many of the problems that currently exist as a
result of the design of the job shop.
Another significant constraint that RazorAircraft faced is the manufacturing process itself. Even after
grouping the transmission components into product families, significant differences still exist between
how products within the same family are made. As a result, the operation of the cell is limited in a
serious way. Some products are forced to follow different paths within the cell and have operations
performed in different sequences. This creates waste in the form of increased product travel and time.
More inventory than ideal is required to be kept within the cell to act as a buffer for several of these
process steps to keep the cell flowing smoothly. Similar to other constraints, this adds complexity to the
operation of the cell. Additional scheduling, coordination, and supervision are required to keep the cell
operating properly. Unfortunately, this constraint is one that is very difficult to relax. The products being
manufactured are incredibly highly engineered and have very precise tolerances and specifications.
Making changes to the manufacturing process is not something that can be taken lightly. These
components are being used in both civilian and military aircraft, and therefore very strict regulations
dictate the flexibility that is allowed.
One final constraint facing this shop is related to labor agreements. Because this company has a union
represented hourly workforce, many strict labor rules have been put in place and negotiated over the
years. One of the most important rules in place relates to job function. One of the peculiarities of the
labor rules in place is that not all machinists are considered equivalent, and there are actually separate job
classifications for different types of machinists. For example, lathe operators have a different code than
grinder operators. As a result, the company is restricted by who can operate what machine. It is therefore
much more difficult to staff a production area in the most efficient way possible. Obviously if a company
were to build a new facility, they would ensure the work rules put in place from the start would be as
flexible as possible to avoid this situation. Ideally, the company would like to staff the cell with as few
individuals as possible, meaning each operator would potentially be operating multiple machines. With
28
the current labor agreements, however, this poses a significant challenge that may not be possible to
overcome without changing the labor rules.
It is important to make note of these constraints to recognize the reality that no lean transformation will be
without significant challenges. Ultimately, compromises will have to be made to ensure a successful
transformation. The transformation will not be one giant revolution but rather a number of evolutions that
will take place over time as some constraints are eventually relaxed.
4.3 Progress Made Prior to Author's Internship at RazorAircraft
The transformation planning process at RazorAircraft had begun almost an entire year before the arrival
of the author, and a significant amount of work had already been done. As noted earlier, the first phase of
the process involved product grouping. All 100 of the different products manufactured by the department
were compared against one another on a variety of different factors, and many patterns and similarities
quickly emerged. After careful analysis, it was determined to group the various products into three main
families. However, the initial planning team recognized the need for an extra production cell to serve as a
hospital, or "re-work" cell and for miscellaneous small volume products. Therefore, the decision was
made to redesign the transmission component department into four new production cells. Three of the
cells would serve to manufacture individual product families, and a fourth cell would serve as additional
support. As mentioned previously, the transmission component shop was losing a portion of its real
estate for the manufacturing of a new aerospace program. As a result, not all four cells would fit within
the remaining space in the shop. One cell would, therefore, have to be built in the new portion of real
estate identified near the shop.
Once the products had been grouped accordingly, the planners began outlining how each cell would
function, where each cell would be located, and how to allocate the existing machinery within the cells
according to the second phase of the cell design process. The planners carefully reviewed value stream
maps of all the products and attempted to identify potential modifications to enable all products within a
product family to follow the same process plan. Potential layouts were designed and evaluated, and
obvious gaps in existing capital equipment were also highlighted. Allocating machinery to each
individual cell proved challenging. As noted above in the analysis of constraints, certain pieces of
machinery can be critical to more than one product family. Based on the chosen allocation, a plan for
capital equipment purchases was completed to prevent a lack of equipment from crippling the operations
of the cells.
As previously discussed, the manufacturing process for these transmission components involves both
rough and final machining, with heat-treating taking place in between. The management recognized that29

utilizing the same machinery for both sets of operations posed serious limitations with capacity and
operating lean cells with smooth flow. As a result, a long-term strategy was developed that would
outsource the rough machining of the raw forgings. In reality, this practice had already begun in many
cases as a way to deal with the increasing demand the shop faced. Therefore, management decided that
the cells would only perform finish-machining work, which would have several important benefits. For
one, the shop could focus their efforts at improving their competency in precision machining, which is
their true competitive advantage. At the same time, by outsourcing rough machining, machines that were
either dedicated to roughing or performing both, could be solely dedicated to final machining, thereby
actually increasing the capacity of the transmission component shop without requiring the purchase of
new equipment. It was a difficult but necessary decision in order to allow the creation of truly lean
production cells.
Production Preparation Process
As the planning process continued and key decisions were made, the basic design of the cells was starting
to come together. At this point, the transformation manager decided to organize a production preparation
process event, also known as a "3P" event. The production preparation process is a lean tool that was
adopted and modified by RazorAircraft and included in their lean operating system.9 It provides a
framework for developing a production or process system that requires the least amount of time or capital
resources. It is a non-traditional, and typically multi-day, hands-on learning event to develop and design
processes that better meet customer needs and eliminate waste. It involves the use of simulation that
helps determine how the process will function in reality and helps foster teamwork and collaboration
within the organization.' 0
For the 3P event, the transformation manager put together a diverse team of key stakeholders and
arranged to have a large open area be used for purposes of simulation. The team built actual size
mockups of the various machines in the shop using cardboard boxes and used them to simulate different
potential layouts for the new cells. The fundamental purpose of the exercise was, given how much space
is available in the shop for the cells, to see how the cells could best be arranged such that everything fit
accordingly. The mockups provided the ability to physically see the space between each machine, how
different size aisles would impact the ability to move around within the cells, etc. The team could also
simulate how parts would physically move within the cell and where potential logistical difficulties would
be encountered. The team built mockups of all the various auxiliary equipment and items that would also
9 (RazorAircraft)10 (Kastango & Jagiela, 2010)

be included in the cells such as tool cabinets and workbenches. The idea was to provide the most realistic
vision of the cells possible to ensure that once built, they would function according to plan. The value of
a real simulation cannot be overstated. It is one thing to look at a two-dimensional drawing of a cell, but
it is entirely different to actually see it firsthand in three dimensions. Many details come to light that
otherwise would not be noticed.
From the 3P event and the extensive simulations, the team was able to agree on a layout for the cells that
would satisfy all of the important criteria. Additionally, the team now had all of the information
necessary to complete a request for the funding for the full cost of the construction of the cells. The costs
would include the construction of the new cell outside of the existing shop, the purchase of some new
equipment, and the relocation of existing equipment within the shop. Due to the precise tolerances
required by the manufacturing of these products, the cell outside the shop would require an enclosed and
environmentally controlled room.
Surface Surface 1ID /OD) ID / ODGrinder1 Grinder2 Grinder1 Grinder2Inspection (CMM) Room
CMM1Surface SurfaceChern Grinder4 Grinder3Treat
Figure 9: Transmission Component Cell Diagram
In Figure 9, one can see the final cell design that was chosen for the cell outside the existing shop at the
conclusion of the 3P event. The cell would include the final machining operations as well as a stress
relief oven, a separate chemical treatment room, and a separate inspection room. A preliminary design
for the cells within the existing shop was also agreed upon.
4.4 Transformation Steering Committee and Plan of Action
Not long after the gear shop management was given the approval to reconstruct the shop and build the
manufacturing cells, the author arrived at RazorAircraft for his six-month internship. Following the cell
design process, the products had been grouped into families based on different parameters such as product
type and manufacturing process plan. The general structure of the cells had been designed based on those
part families, and the different machines within the gear shop had been allocated to each of the different
cells. In addition, a proposal for new capital equipment had been submitted and approved. The goal of
the author was to continue the cell design process as outlined by RazorAircraft's lean operating system.
In order to focus the remaining effort, and to supplement the existing cell design process, a transformation
steering committee was created, with the author as its leader and responsible for its progress. The belief
was that while the existing cell design process had many of the tools needed to define the operating
parameters of the cell, there were many other important details that required planning. The committee
identified four key areas of the cell design process that would guide the remainder of the work: (1)
Process Flow Design, (2) Material Handling, (3) Workstation Design, and (4) Staffing. The steering
committee created formal teams around each of the key areas to ensure a diverse group of stakeholders
and employees were represented throughout the remainder of the cell design work. The author,
throughout his internship, had a major role on each of the four teams as either a team leader and/or direct
contributor.
4.5 Process Flow Design
Process flow design can be thought of as the traditional operational activities that a cell transformation
effort would entail. The goals of process flow design are largely the same as those outlined by the cell
design process discussed earlier. This includes tasks such as building value stream maps of the cell,
creating spaghetti diagrams to show how the products will flow through the cell, takt time planning, and
performing an analysis of the operations within the cell to understand potential capacity constraints as
potential imbalances. Process flow design would also include building standard worksheets to document
and standardize all operations within the cell.
The process flow design team for the transformation effort at RazorAircraft largely followed the existing
cell design process as outlined above. It was up the team to build off the work done at the 3P event and
continue to define the operating details. The team used the existing current state value stream map as a
starting point to understand the current process and define how it envisioned the future state process to
operate. The team validated all of the data used to build the value stream map and walked through the
process step by step to ensure that every operation was accounted for. Once the current state process map
was firmly in place, the team then began the process of determining what the future state value stream
map would look like.
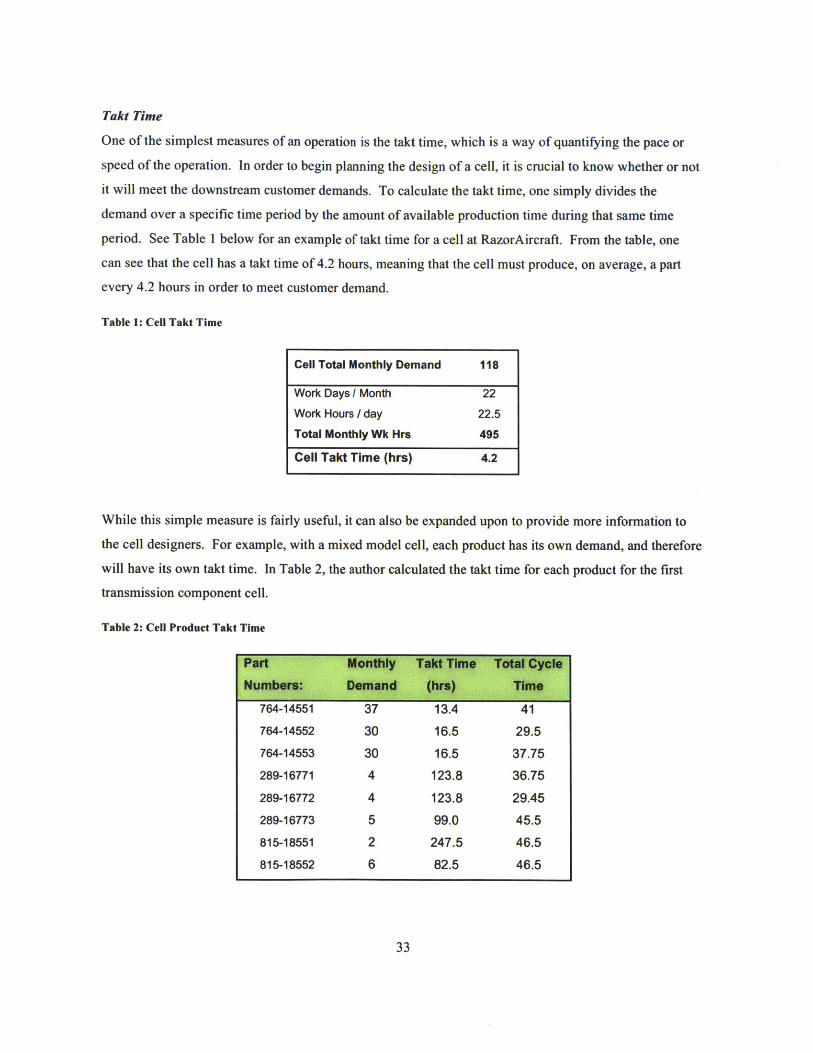
Takt Time
One of the simplest measures of an operation is the takt time, which is a way of quantifying the pace or
speed of the operation. In order to begin planning the design of a cell, it is crucial to know whether or not
it will meet the downstream customer demands. To calculate the takt time, one simply divides the
demand over a specific time period by the amount of available production time during that same time
period. See Table I below for an example of takt time for a cell at RazorAircraft. From the table, one
can see that the cell has a takt time of 4.2 hours, meaning that the cell must produce, on average, a part
every 4.2 hours in order to meet customer demand.
Table 1: Cell Takt Time
Cell Total Monthly Demand 118
Work Days / Month 22
Work Hours / day 22.5
Total Monthly Wk Hrs 495
Cell Takt Time (hrs) 4.2
While this simple measure is fairly useful, it can also be expanded upon to provide more information to
the cell designers. For example, with a mixed model cell, each product has its own demand, and therefore
will have its own takt time. In Table 2, the author calculated the takt time for each product for the first
transmission component cell.
Table 2: Cell Product Takt Time
Part Monthly Takt Time Total CycleNumbers: Demand (hrs) Time
764-14551 37 13.4 41
764-14552 30 16.5 29.5
764-14553 30 16.5 37.75
289-16771 4 123.8 36.75
289-16772 4 123.8 29.45
289-16773 5 99.0 45.5
815-18551 2 247.5 46.5
815-18552 6 82.5 46.5
Another takt time that can be computed is the machine takt time. In a mixed model cell, not every part
necessarily follows the exact same process, and some parts will take longer to make than others.
Therefore, machines/processes will have different takt times. Even within a cell, a certain machine may
have to process the same part more than once, meaning it may have a shorter takt time than the generic
cell takt time. The machine takt times can be calculated after the full capacity analysis is completed,
which is detailed below.
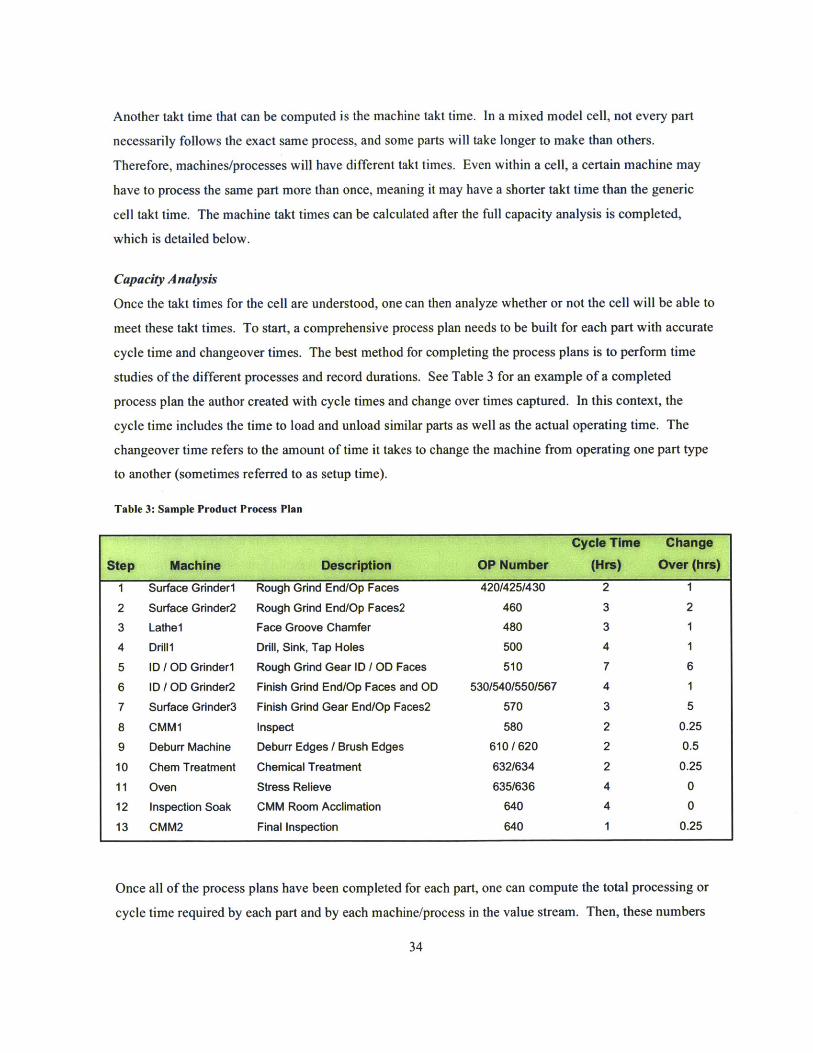
Capacity Analysis
Once the takt times for the cell are understood, one can then analyze whether or not the cell will be able to
meet these takt times. To start, a comprehensive process plan needs to be built for each part with accurate
cycle time and changeover times. The best method for completing the process plans is to perform time
studies of the different processes and record durations. See Table 3 for an example of a completed
process plan the author created with cycle times and change over times captured. In this context, the
cycle time includes the time to load and unload similar parts as well as the actual operating time. The
changeover time refers to the amount of time it takes to change the machine from operating one part type
to another (sometimes referred to as setup time).
Table 3: Sample Product Process Plan
Cycle Time Change
Step Machine Description OP Number (Hrs) Over (hrs)
1 Surface Grinder1 Rough Grind End/Op Faces 420/425/430 2 1
2 Surface Grinder2 Rough Grind End/Op Faces2 460 3 2
3 Lathel Face Groove Chamfer 480 3 1
4 Drilli Drill, Sink, Tap Holes 500 4 1
5 ID / OD Grinder1 Rough Grind Gear ID / OD Faces 510 7 6
6 ID / OD Grinder2 Finish Grind End/Op Faces and OD 530/540/550/567 4 1
7 Surface Grinder3 Finish Grind Gear End/Op Faces2 570 3 5
8 CMM1 Inspect 580 2 0.25
9 Deburr Machine Deburr Edges / Brush Edges 610 / 620 2 0.5
10 Chem Treatment Chemical Treatment 632/634 2 0.25
11 Oven Stress Relieve 635/636 4 0
12 Inspection Soak CMM Room Acclimation 640 4 0
13 CMM2 Final Inspection 640 1 0.25
Once all of the process plans have been completed for each part, one can compute the total processing or
cycle time required by each part and by each machine/process in the value stream. Then, these numbers
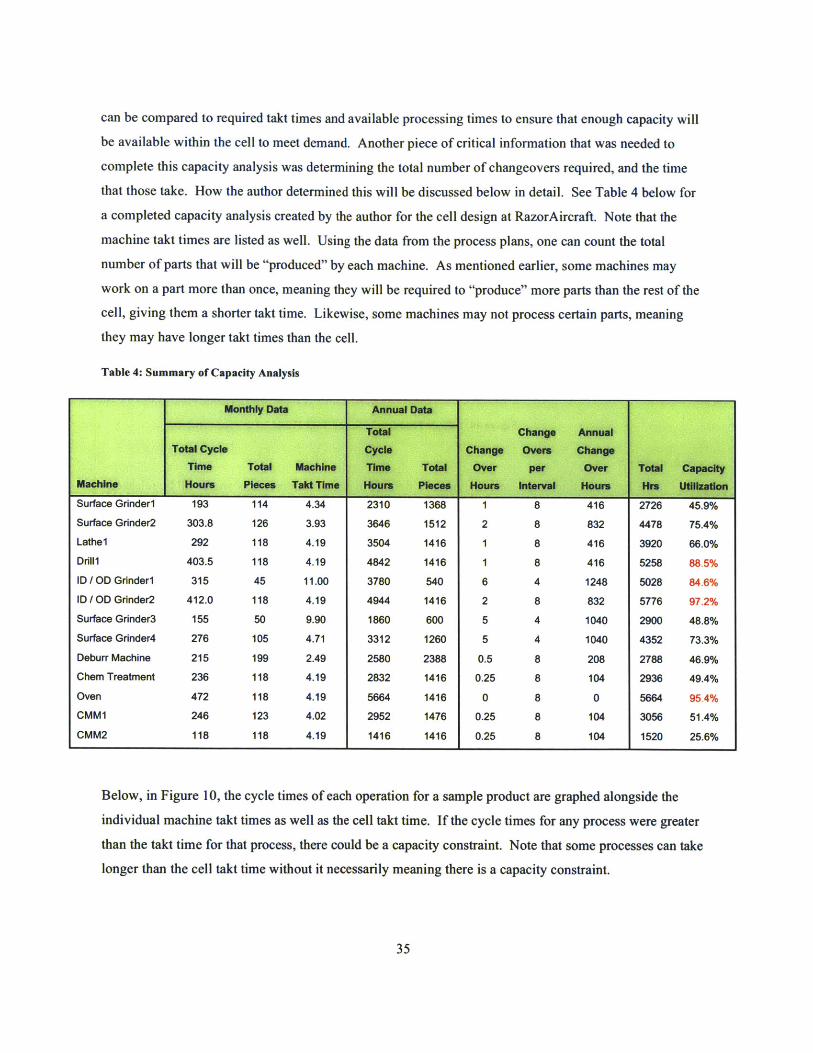
can be compared to required takt times and available processing times to ensure that enough capacity will
be available within the cell to meet demand. Another piece of critical information that was needed to
complete this capacity analysis was determining the total number of changeovers required, and the time
that those take. How the author determined this will be discussed below in detail. See Table 4 below for
a completed capacity analysis created by the author for the cell design at RazorAircraft. Note that the
machine takt times are listed as well. Using the data from the process plans, one can count the total
number of parts that will be "produced" by each machine. As mentioned earlier, some machines may
work on a part more than once, meaning they will be required to "produce" more parts than the rest of the
cell, giving them a shorter takt time. Likewise, some machines may not process certain parts, meaning
they may have longer takt times than the cell.
Table 4: Summary of Capacity Analysis
Monthly Data Annual Data
Total Change AnnualTotal Cycle Cycle Change Overs Change
Time Total Machine Time Total Over per Over Total CapacityMachine Hours Pieces Takt Time Hours Pieces Hours interval Hours Hr. UtilizationSurface Grinderl 193 114 4.34 2310 1368 1 8 416 2726 45.9%Surface Grinder2 303.8 126 3.93 3646 1512 2 8 832 4478 75.4%Lathel 292 118 4.19 3504 1416 1 8 416 3920 66.0%Drilli 403.5 118 4.19 4842 1416 1 8 416 5258 88.5%ID / OD Grinder1 315 45 11.00 3780 540 6 4 1248 5028 84.6%ID / OD Grinder2 412.0 118 4.19 4944 1416 2 8 832 5776 97.2%Surface Grinder3 155 50 9.90 1860 600 5 4 1040 2900 48.8%Surface Grinder4 276 105 4.71 3312 1260 5 4 1040 4352 73.3%Deburr Machine 215 199 2.49 2580 2388 0.5 8 208 2788 46.9%Chem Treatment 236 118 4.19 2832 1416 0.25 8 104 2936 49.4%
Oven 472 118 4.19 5664 1416 0 8 0 5664 95.4%
CMM1 246 123 4.02 2952 1476 0.25 8 104 3056 51.4%
CMM2 118 118 4.19 1416 1416 0.25 8 104 1520 25.6%
Below, in Figure 10, the cycle times of each operation for a sample product are graphed alongside the
individual machine takt times as well as the cell takt time. If the cycle times for any process were greater
than the takt time for that process, there could be a capacity constraint. Note that some processes can take
longer than the cell takt time without it necessarily meaning there is a capacity constraint.
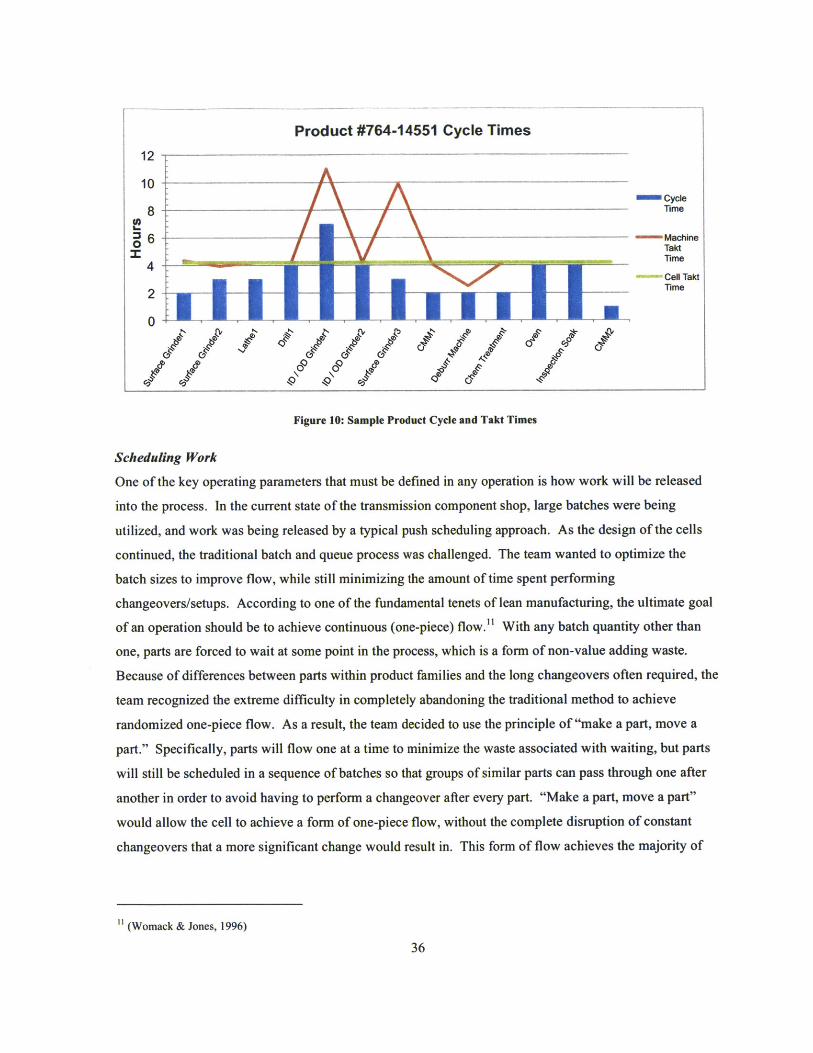
Product #764-14551 Cycle Times
12
10Cycle
8 Time
4
-MachineTaktTime
Cell TaktTime
00 0l 0 I
Figure 10: Sample Product Cycle and Takt Times
Scheduling Work
One of the key operating parameters that must be defined in any operation is how work will be released
into the process. In the current state of the transmission component shop, large batches were being
utilized, and work was being released by a typical push scheduling approach. As the design of the cells
continued, the traditional batch and queue process was challenged. The team wanted to optimize the
batch sizes to improve flow, while still minimizing the amount of time spent performing
changeovers/setups. According to one of the fundamental tenets of lean manufacturing, the ultimate goal
of an operation should be to achieve continuous (one-piece) flow." With any batch quantity other than
one, parts are forced to wait at some point in the process, which is a form of non-value adding waste.
Because of differences between parts within product families and the long changeovers often required, the
team recognized the extreme difficulty in completely abandoning the traditional method to achieve
randomized one-piece flow. As a result, the team decided to use the principle of "make a part, move a
part." Specifically, parts will flow one at a time to minimize the waste associated with waiting, but parts
will still be scheduled in a sequence of batches so that groups of similar parts can pass through one after
another in order to avoid having to perform a changeover after every part. "Make a part, move a part"
would allow the cell to achieve a form of one-piece flow, without the complete disruption of constant
changeovers that a more significant change would result in. This form of flow achieves the majority of
" (Womack & Jones, 1996)
L
the benefits of one-piece flow and only sacrifices some of the flexibility that true one-piece flow would
allow.
This example helps illustrate one of the challenges of any transformation effort. The team recognized the
benefits of true one-piece flow and the flexibility that it would give operations in the ability to make any
part on demand. However, it also knew that because of changeovers and other constraints, it could not
achieve this goal in the short term. Likewise, it is often not practical to completely revolutionize an
operation in one step. It can in many cases be more appropriate for the people within an organization as
well as the operating systems in place to transition over smaller "evolutionary" steps over time. That is
not to say that the transformation effort that RazorAircraft's transmission component shop was
undertaking was not already ambitious. They simply recognized their current limitations and the
opportunity for continuous improvement. With the general strategy for production scheduling
determined, it was now up to the author to analyze the data and define the optimal batch sizes.
Every Part Every Interval
One of the most important aspects of managing manufacturing operations is production scheduling. In
operations that consist of machines that are shared resources, it is very important to determine both the
order of parts that will be run through those machines, and in what quantity batches they will be run. In
an ideal situation, where machines are dedicated to run only one type of part, scheduling becomes much
simpler. The only variable to control is batch size, and one can calculate the most economic batch size.
As discussed, the shop would utilize one piece flow in the form of "make a part, move a part" but at the
same time still utilize batches for scheduling and to optimize changeover times. One of the most common
calculations for determining optimal batch sizes is known as the Economic Order (or production)
Quantity (EOQ). The EOQ is defined as the order/production quantity at which the sum of the ordering
costs (in manufacturing, this can be thought of as the cost to prepare or set up a batch) and the holding
costs associated with carrying inventory are minimized.12 As the size of batches increases, the total
ordering or setup costs decrease, because they are performed less often and spread across more units. At
the same time, the total holding costs increase because more inventory is being held in the system. At
some point along a continuum of batch sizes, the sum of these two costs will be minimized. While the
theory is simple, applying the EOQ can actually be quite complicated. In many cases, it is very difficult
to determine accurate ordering costs, and it is likewise a challenge to define all of the costs associated
with carrying inventory. For example, there is the holding cost associated with tying up the working
capital, the cost of the warehouse space dedicated to holding the inventory, the cost of shrinkage or of
(Anupindi, Chopra, Deshmukh, Van Mieghen, & Zemel, 2006)
37

obsolescence, etc. Accurately estimating these costs is challenging because it is not always obvious. In
the case of warehouse space, what is the cost of holding one additional unit? If that additional unit is
simply stacked on top of another, it may be nothing, or it could potentially mean building an entire
additional warehouse.
Calculating ordering/setup costs is also more complicated than one may think. In most manufacturing
cases, the changeover or setup cost is simply someone's time and whatever disposable resources are used.
Depending on the situation, an operator performing a setup would perhaps otherwise not perform any
other value-adding task, but he/she is nonetheless paid for his/her time. So, is there a real cost? Perhaps
the cost is the opportunity cost of the time not spent producing while the setup is being performed. But if
the shop continues to meet all demand and no orders are missed, is there a real cost to the organization of
that additional changeover? Again, certain situations increase the difficulty in calculating appropriate
batch sizes for parts.
When determining the EOQ for each part number in the cell, several more challenges were presented.
First of all, each part number has a different physical cost associated with it. And more importantly, the
changeover times (ordering costs) vary not only by part number but also by machine and operation. As a
result, each part number will have a different EOQ for each machine and operation. One can see that this
can quickly become more and more complicated. Likewise, when comparing between multiple EOQ's
for the same part, it is not clear which is the optimal EOQ. Because the cell is designed for parts to flow
continuously through it, each part can ultimately only have one order/batch quantity. Therefore, trying to
choose between competing EOQ's becomes cumbersome. In the end, the simple calculation turns into a
practical nightmare. Lastly, the EOQ only takes into account tradeoffs between ordering and holding
costs, and does not account for the need to cycle through a mix of products on a frequent basis. In the
case of the transmission component shop, because producing complete ship sets of gears is so important,
it is critical to ensure a steady mix of products are made, which may be in conflict with the batch sizes
that the EOQ determines.
As a result of the difficulties presented with using an EOQ model in a mixed model cell, an alternative
method was utilized, known as the "Every Part, Every Interval" method or EPEI. EPEI seeks to cycle
through product mixes as frequently as possible given constraints such as changeover times, which would
therefore benefit the shop and allow them to manufacture complete ship sets routinely. The basic
principle of this methodology is that for a defined time period, or interval, one must produce every part
that is demanded during that interval. In simplest terms, if one needs to produce 100 widgets every year,
and the interval is defined as one week, then assuming 50 weeks in a year, one must produce 2 widgets

every week. For a mixed model production environment, where each product has a different demand, one
would calculate what each product's demand is for the defined interval and use that as the batch quantity.
Then, each interval, one would produce one batch of each product in a defined sequence. Therefore,
within each interval, only one setup would be needed for each product made. The larger the interval, the
fewer setups that will be performed on an annual basis, and the larger the batches will be. Likewise, the
smaller the interval, the more setups that will be performed on an annual basis and the smaller the batches
will be. The key variable that management must determine, therefore, is the appropriate interval. Using
this methodology, the optimal interval is always the smallest interval in which one can still produce the
required amount of products, taking into account the time required to perform setups. See Table 5 below
for an example of how to calculate EPEI. In this example, with an interval of I day, each setup cannot
take more than 1.5 hours on average. One assumption is that because there are four parts, there will be
four setups per interval. Assuming 22.5 available hours in the day for working, and that setups on
average take 2 hours, a I-day interval will not work. So, the best interval is the next shortest interval that
requires setups no less than 2 hours, which is two days in this case. A 3-day interval will also work, but
will not be as efficient.
Table 5: Every Part Every Interval Example
EPES Exam le 1 DAY 2 DAY 3 DAYPart D Run Total Total TotalType Demand Time Pcs Run PCs Run PCs Run
per PC Time Time TimeA 3 1.5 3 4.5 6 9 9 13.5
B 1 3.25 1 3.25 2 6.5 3 9.75
C 1 3.5 1 3.5 2 7 3 10.5
D 1 5.25 1 5.25 2 10.5 3 15.75
Total Run Time 16.5 33 49.5
Available Time 22.5 45 67.5
Time Remaining for Setups 6 12 18
Total Number of Setups per 4Interval
The theory behind the EPEI method is that it minimizes total operating costs by optimizing the time not
spent producing parts. In order to calculate what the appropriate interval is, one starts by adding up the
39

time it takes to produce every part demanded during an interval. That time is then subtracted from the
total available time, to give the remaining time that can be used for setups. This remaining time is then
divided by the number of setups that are to be performed during that interval (one setup per product) to
give the average time that the setups must be less than in order to meet production demand. If current
setups are longer than this time, then the interval must be increased. EPEI makes the important
assumption that setups cost nothing. In other words, the time would otherwise be wasted. Therefore, it
seeks to make batch sizes, and therefore overall inventory, as small as possible while still meeting
production targets. The other benefit of having smaller intervals is that your entire product mix is cycled
through within a shorter time period. In the case of the shop, this is very important because it gives them
the ability to produce complete ship sets within a shorter time period. Otherwise, an aircraft could be
waiting on a transmission assembly due to just one or two gears, even as the shop continues to produce
many other gears. As mentioned earlier, the goal of the organization is to produce a complete
transmission assembly for each aircraft, so it is very important that complete ship sets be produced at the
fastest rate possible to meet rising demand.
Using the process plan data as discussed earlier, the author performed an EPEI calculation for each part to
be processed within the cells. Because of the differences within each part, each part had a slightly
different optimal interval. Based on the data, and other practical considerations, the team decided to use
the shortest possible interval that could accommodate all of the parts while also making scheduling as
simple as possible. Therefore, the team finally decided on an interval of one week, meaning every week,
the production would cycle through one batch of each part, with the size of the batches being the weekly
demands for each part.
Based on all of the work performed by the author and the process flow design team at RazorAircraft, the
final design of the cells was determined. In Figure 11 below, one can see the final design of one cell
showing the process flow through the cell and numbered process steps. Note that perfect flow was not
achieved given the constraints faced by RazorAircraft.
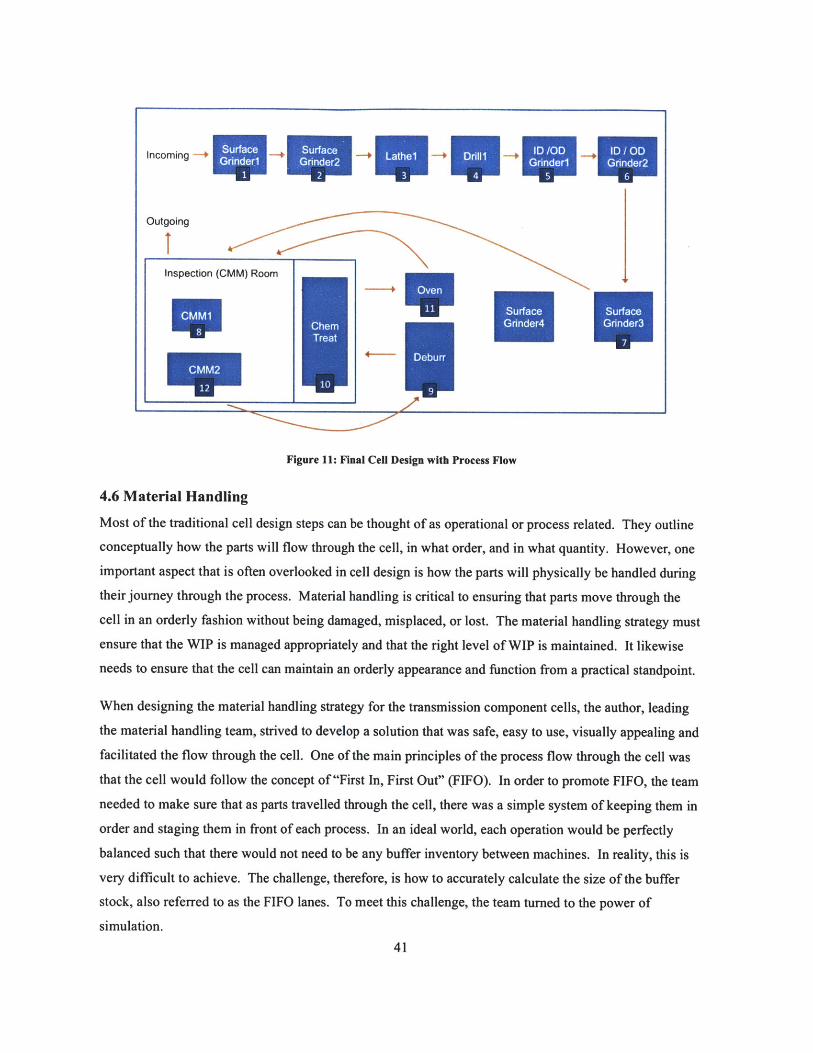
Incoming -+
Outgoing
SurfaceSufcGrinder4 Gidr
~45~75E+54I
Su
Figure 11: Final Cell Design with Process Flow
4.6 Material Handling
Most of the traditional cell design steps can be thought of as operational or process related. They outline
conceptually how the parts will flow through the cell, in what order, and in what quantity. However, one
important aspect that is often overlooked in cell design is how the parts will physically be handled during
their journey through the process. Material handling is critical to ensuring that parts move through the
cell in an orderly fashion without being damaged, misplaced, or lost. The material handling strategy must
ensure that the WIP is managed appropriately and that the right level of WIP is maintained. It likewise
needs to ensure that the cell can maintain an orderly appearance and function from a practical standpoint.
When designing the material handling strategy for the transmission component cells, the author, leading
the material handling team, strived to develop a solution that was safe, easy to use, visually appealing and
facilitated the flow through the cell. One of the main principles of the process flow through the cell was
that the cell would follow the concept of "First In, First Out" (FIFO). In order to promote FIFO, the team
needed to make sure that as parts travelled through the cell, there was a simple system of keeping them in
order and staging them in front of each process. In an ideal world, each operation would be perfectly
balanced such that there would not need to be any buffer inventory between machines. In reality, this is
very difficult to achieve. The challenge, therefore, is how to accurately calculate the size of the buffer
stock, also referred to as the FIFO lanes. To meet this challenge, the team turned to the power of
simulation.
Inspection (CMM) Room
CWem

Tabletop Simulation
A critical component of any transformation effort is finding ways to validate the work being performed in
order to ensure the designed changes will work as intended once implemented. One of the best methods
for performing such validation is through the use of simulation. Many different ways to perform
simulations exist. In the case of the operational design of a manufacturing operation, there are many
software solutions that are designed to simulate how an operation will function.
Although it is not included in the cell design process of RazorAircraft's lean operating system, the author
recognized the importance of performing some type of simulation in order to help illustrate how the cell
would function and ensure no obvious flaws in the operational design of the cell existed. A key
component of the Production Preparation Process (3P) was simulation, and the value of that was clearly
noted. The simulation performed at the 3P event brought to light many of the practical issues that a 2D
drawing can't capture. Likewise, a visual simulation of the cell operating would highlight many of the
issues that simple engineering calculations cannot.
The author researched many of the simulation options in an effort to find a simple, cost-effective solution
to simulate the operations of the cells as they were being designed. Specifically, the team looked to
understand how the "every part, every interval" analysis that was calculated would perform in a real
world setting. What had not yet been determined was the order in which parts would be released within
the cells. The EPEl calculations defined the quantities within each batch but not the order that the batches
would be released in the cell. The author concluded that the best method for determining this optimal
schedule would be through trial and error simulation. After researching the available options, the author
decided that the best method for simulating the operation of the cells would be through old-fashioned
tabletop simulation. This was clearly the simplest solution and had significant benefits, but was not
without its drawbacks.
The most distinct advantage that tabletop simulations have over software or computer based simulations
is the ability for multiple people to experience the simulation together. By working on the simulation in a
group, everyone can understand the algorithms used in running the simulation and see the results first
hand. From a change management perspective, the value of this collaboration cannot be understated.
One could spend countless hours developing the most complex and precise computer model to capture the
behavior of an operation. However, without the buy-in of the key stakeholders, this model would be
completely useless. People would be reluctant to accept the model without having participated in its
creation. The value of the tabletop simulation is that multiple stakeholders are involved in the process,
and everyone participates, understands, and learns together. The other strong benefits of the tabletop

simulation are that it is low-cost and also takes very little up front work to set up. The majority of the
time is spent running the simulation and actually participating in the learning process. With computer
simulations, the majority of the time is spent building the model. In order for the model to be useful, it
must have a significant number of details built into it. Often, simulation programs are too rigid and not
flexible enough to account for different factors or conditions. The tabletop simulation does have a
drawback in that each simulation run takes time. Running large numbers of simulations can be
impractical depending on the situation. In this case, the author chose to pursue a tabletop simulation
given its distinct advantages, and it was indeed one of the most valuable tools utilized throughout the cell
design process.
To perform the tabletop simulations in the cell design process at RazorAircraft, the material handling
team printed out a large scaled drawing of the cell. Using multicolored, labeled chips to signify the
different products, the team simulated the flow of those products through the cell by keeping track of the
time, knowing the precise length of time each process operation and machine setup takes. From the
simulation, different production schedules were experimented with. The results of the EPEI analysis were
validated, and the team could see the effect of varying the order of processing the products in the cell.
See Figure 12 below for a picture taken during one of the simulation runs.
Figure 12: Tabletop Simulation
Based on the simulations, the team knew that the cell would not be perfectly balanced in the short term.
So, the team focused on how best to manage the small amount of buffer inventory between each machine
that would help smooth the flow through the cell. Rather than spending a tremendous amount of effort
43

and time calculating what the ideal buffer quantities would be or specifying what they should be, the team
essentially let the "every part, every interval" strategy and machine cycle times determine what queues
would form on their own accord. By performing the tabletop simulations of intervals using the EPEI
strategy, the team was able to see where the queues formed and how large they became. By analyzing
several simulation runs, maximum queue sizes were calculated. From this, the team could determine how
big to make the FIFO lanes.
FIFO Storage
Once the size of the FIFO lanes has been determined, one can then design the physical FIFO storage
units. Again, the goal should be to find a solution that is safe, simple, and prevents damage to the parts.
Another important consideration that should be made is how the inventory storage impacts the available
real estate within the cell. If real estate is an issue, it is desirable to design a solution that does not impede
the ability of operators to move within the cell or create unsafe working conditions.
Based on the 3P cardboard mockups of the cell that had been built, the team knew that space was limited,
and it was critical to design a space efficient solution. Therefore, the team looked at options that involved
a rack system, whereby parts could be stacked on shelves to minimize the footprint of the storage. In
designing the shelves, the team could not forget the important fact that the parts the cell would be
working with are relatively large and heavy. In this case, the average part was about 2 feet in diameter
and weighed 45 lbs. Therefore, the use of shelves, while potentially a good idea, also posed certain risks.
The shelving system had to be very stable, and the parts had to be easy for the operators to access with an
overhead crane to avoid lifting the parts themselves.
The team settled on a six-shelf rack system with rollout shelves, which was actually based on an existing
part transport rack that was currently in use in the shop. The team recognized the value in being able to
use existing equipment with minor modifications. Each rack would hold one part per shelf for a total of
six parts. Based on the WIP levels that the team had estimated using the simulations, it was decided that
there would be one rack at each machine to serve as WIP storage and as a FIFO lane.
Transfer System
Along with the physical FIFO storage units, a strategy still needs to be developed that dictates how parts
physically move through the cell. In the case of this cell transformation effort, the team decided that
machines would only have incoming FIFO lanes, and there would be no outgoing lanes. What this means
is that parts would flow from incoming lane to machine to the next incoming lane. Therefore, to transfer
parts within the cell, an operator, using an overhead crane, would pick up a part from the incoming rack
and load it in the machine. Once finished with the part, the operator would again pick up the part from44

the machine with an overhead crane and transfer it to the incoming cart of the next machine according to
the flow of the cell. One of the benefits of manufacturing cells is that machines are located so that part
travel is minimized, thereby making it easy for operators to transfer parts from one to another.
The strategy of using storage racks at each machine works very well in many cases. However, one item
that this system fails to address is when the part needs to be moved a greater distance. In the case at
RazorAircraft, because the parts were large and heavy enough to require being moved by overhead crane,
transferring parts over long distances was not possible. The cranes had limited movement and were
designed for use around individual machines. Unfortunately, due to the many constraints elaborated on
earlier, in several cases, parts could not simply flow from one machine to the next, but had to move across
the length of the cell. To solve the problem, the material handling team used a methodology to devise a
comprehensive transfer system that would use small, mobile, single-piece carts to shuttle parts wherever
they needed to go.
The methodology begins by listing all of the different routes that need to be addressed. For each route,
the following is determined: starting location, ending location, description of route, who moves the cart,
who returns the cart, and number of carts needed on that route. One key to the framework is to
understand the right number of carts that are needed such that there is always a cart where someone needs
it. For example, suppose one route is from Machine A to Machine B. When an operator moves a part
from A to B, he/she puts the part on the empty cart at Machine A and takes it to Machine B. If he/she
were to leave the cart at B and return to work at A, when the time came to take another part to B, there
would be no cart available at A. Therefore, at least two carts need to be specified for that route, with at
least one stationed at A and another at B. That way, once the part is brought to B, the operator can take
the empty cart stationed at B and return it to A to be used when the time comes. One would specify more
than two carts whenever a queue is expected to form. For example, if machine B has a long cycle time,
several empty carts may be stationed at machine B for operators to use. The other main principle behind
this methodology is that carts are strictly restricted to only one route by labeling both the stations where
they reside and the carts themselves. Similarly, in order for the system to work, whenever someone
moves a cart, he/she needs to return a cart on the same route to where the original cart was located. While
this does result in more carts than absolutely necessary, it guarantees that a cart will always be a available
when and where an operator needs one, so there is no confusion, and operators are never left scavenging
for carts. See Table 6 below for an example of a listing of cart routes.
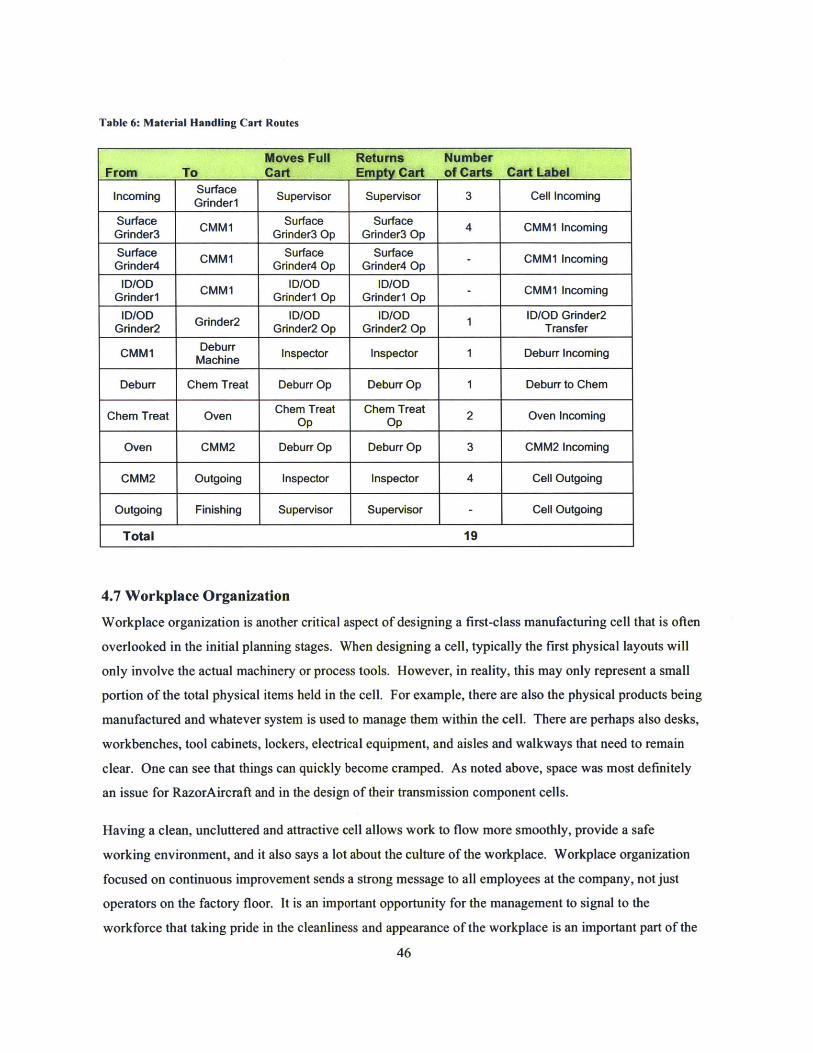
Table 6: Material Handling Cart Routes
Moves Full Retums NumberFrom To Cart Empty Cart of Carts Cart Label
Incoming Gnnder Supervisor Supervisor 3 Cell Incoming
Surface CM1 Surface Surface 4 CMM1 IncomingGrinder3 Grinder3 Op Grinder3 OpSurface Surface SurfaceGrinder4 CMM1 Grinder4 Op Grinder4 Op - CMM1 Incoming
ID/OD CMM1 ID/OD ID/OD- CMM1 IncomingGrinderl Grinder1 Op Grinder1 Op
ID/OD Grinder2 ID/OD ID/OD ID/OD Grinder2Grinder2 Grinder2 Op Grinder2 Op Transfer
CMM1 Machin Inspector Inspector 1 Deburr Incoming
Deburr Chem Treat Deburr Op Deburr Op 1 Deburr to Chem
Chem Treat Oven Chem Treat Chem Treat 2 Oven IncomingOp Op
Oven CMM2 Deburr Op Deburr Op 3 CMM2 Incoming
CMM2 Outgoing Inspector Inspector 4 Cell Outgoing
Outgoing Finishing Supervisor Supervisor - Cell Outgoing
Total 19
4.7 Workplace Organization
Workplace organization is another critical aspect of designing a first-class manufacturing cell that is often
overlooked in the initial planning stages. When designing a cell, typically the first physical layouts will
only involve the actual machinery or process tools. However, in reality, this may only represent a small
portion of the total physical items held in the cell. For example, there are also the physical products being
manufactured and whatever system is used to manage them within the cell. There are perhaps also desks,
workbenches, tool cabinets, lockers, electrical equipment, and aisles and walkways that need to remain
clear. One can see that things can quickly become cramped. As noted above, space was most definitely
an issue for RazorAircraft and in the design of their transmission component cells.
Having a clean, uncluttered and attractive cell allows work to flow more smoothly, provide a safe
working environment, and it also says a lot about the culture of the workplace. Workplace organization
focused on continuous improvement sends a strong message to all employees at the company, not just
operators on the factory floor. It is an important opportunity for the management to signal to the
workforce that taking pride in the cleanliness and appearance of the workplace is an important part of the
46

success of the operation. Careful and deliberate workplace organization leads to a safe, efficient working
environment and should be a goal of any manufacturing operation, and the benefits are well documented.
As management encourages and enforces these commitments, workers themselves will begin to adopt the
necessary attitude and level of accountability to ensure the continuous improvement of the workplace
organization."
The simplest way to view workplace organization is as a method for maintaining housekeeping standards.
While housekeeping is an important aspect of workplace organization, it should not be the main focus.
Instead, workplace organization should be a comprehensive system that sets standards for cleanliness,
visual controls, and standard work, and provides clear guidelines for continuous improvement. One
famous system of workplace organization is known as 5S, whose principles are well documented, and
much literature exists on the practice and benefits of using the principles. 5S stands for sort, straighten,
shine, standardize, and sustain. The intent here is not to explain in great detail the principles of 5S but
merely to state that when designing a cell, it is important to understand how the workplace organization of
the cell will impact the operations. 5S is an important part of many organizations' operating systems, and
it was no different at RazorAircraft. In fact, RazorAircraft's operating system utilized a 6S system, with
the sixth 'S' representing safety. RazorAircraft stressed that 6S was not just about spring cleaning, but
about setting clear standards for visual controls and standard work.' 4
Workstation Design
One of the most important aspects of workplace organization is the design of the individual operator
workstations. In order for a cell to function as efficiently and effectively as possible, operators must have
easy access to whatever they need to perform their job when and where they need it. Therefore, it is
important that great care be put into designing the individual workspaces of the operators. In addition to
being efficient, the workspace must also be safe because, ultimately, a safe environment will be a
productive one.
When designing workstations, one of the fundamental principles is known as point-of-use, which signifies
that the operator has access to what they need exactly where they need it. There are many ways of
accomplishing this, but one of the simplest is by providing the operator with different tool cabinets,
shelves, or other storage units at different locations based on frequency of use of the tools. For example,
if there were a particular tool that the operator uses multiple times a day and every time he/she sets up a
part at the machine, it would make sense to provide a tray for this tool to be kept directly at the point of
13 (Lanigan, 2004)14 (RazorAircraft)

use. If there is a group of tools that the operator uses often but not every time, these tools could be kept in
an easy to locate cabinet on a desk next to the machine. And finally, the rest of the tools that the operator
uses could be kept in a nearby tool cabinet. By employing this simple organizing system based on
frequency of use, the operator has what he/she uses most often right where he/she uses them.
Once the location of the tools and the method for storing them has been determined, it is important that a
system be established to keep them as organized as possible. One simple and effective way to keep tools
organized is through the use of shadowboxing. Shadowboxing is a term used to describe inlaying a tool
in a material such as foam by cutting out a precise footprint of the tool in the material. The tool can then
be placed neatly within the cutout area. A label can also be applied next to the cutout to indicate what
tool is designated for that location. It helps an organization keep track of tools, locate them when needed,
and identify when tools are missing.
While shadowboxing and point-of-use are great methods for organizing tools, in the spirit of continuous
improvement, one can take workspace organization even further. For example, suppose one were to
organize the tools of a particular workspace in a cabinet to be located next to the machine. There are
several options for determining how to arrange the tools. The simplest and most common method would
be to arrange the tools by classification, all the wrenches together, all of the screwdrivers together, etc.
While there is nothing wrong with this arrangement, there could potentially be a better option. Perhaps a
more efficient way would be to study the different jobs that are performed at the workstation and organize
the tools by job. Now, rather than have to open several different drawers or cabinets to assemble all of
the tools for one job, all of the tools are already located together and ready for use. If the same tool is
required for more than one job, then it may be justified to purchase a separate tool for each job, assuming
it is not cost prohibitive. If setup times are important, and the organization is looking for ways to increase
productivity, then this could be a simple and effective way. Finally, there is even one step further that one
could take workstation design. Having tools neatly shadowboxed and organized in an efficient manner in
a tool cabinet is very helpful, but it still requires the operator to physically open drawers to see the tools
that are available. Therefore one additional step that could be taken is to build clear case shadowboxed
cabinets. That way, a quick glance is enough for an operator to be able to see what tools are available and
whether any required tools are missing. As part of an effort to transform a job shop to a manufacturing
cell, a goal could be to reach the first level of shadowboxing mentioned. Then, as part of continuous
improvement efforts, a plan could be put in place to continue the journey and reach the next levels of
workplace organization. In reality, the first step is probably the most difficult step to achieve. Current
tool inventories need to be taken, and a comprehensive list of required tools needs to be gathered, which
involves many interviews with operators, supervisors, inspectors, engineers, and others. It is only then
that the organization of the tools can begin.
As part of any shadowboxing or workstation organization program, a system of controls needs to be put
in place to ensure the continued success of the program. For example, once all of the required tools have
been identified, organized in their respective tool cabinets or shelves, and shadowboxed accordingly,inspection checklists need to be built that match the current state. It should then be required as part of
daily operator activities to review designated workspaces and inspect for lost, missing or damaged tools.
This should be done both to ensure tools do not disappear often and to ensure that operators have
everything they need to perform their jobs as productively as possible.
At RazorAircraft, the author, leading the workstation design team, spent a great deal of effort in ensuring
a successful design. Aside from spending the time to shadowbox all of the required tools, great detail was
put into other visual and physical aspects of the cell. For example, all of the machines were oriented such
that parts could be loaded and unloaded from the same direction. Also, workspace desks and benches
were all located perpendicular to each machine and offset to one side. Not only would this result in a
pleasant symmetry within the cell, but it would also keep the front of each machine, where the parts are
being loaded, clear of any obstacles. Other opportunities to create symmetry and standardization within
the workplaces were also identified.
Visual Factory Tools
Another important component of workspace organization is known as the visual factory. The visual
factory is a comprehensive system of workplace organization that involves many types of visual controls.
One goal of a visual factory is to provide employees with as much visual information as needed to
perform their jobs as effectively as possible. It should focus on providing the right information at the
right location, at the right time. Clear communication of what is taking place at each stage of the process,what the important metrics that are being measured are, and how the operation is performing against those
metrics is the focus of visual factory. Visual factory tools should allow employees to easily monitor the
performance of an operation, identify an abnormal situation or operating condition, and allow someone to
stop the process if necessary. Some of the information provided by visual factory tools should include
work flow information, location of equipment and products, status of work, communication methods, etc.
The results of good visual factory tools are improved process flow, reduced waiting, lower inventories,
less waste, fewer defects, etc.
According to the lean operating system of RazorAircraft, visual factory includes process, work, quality,
and object controls. Process controls could include items such as a production control board, daily49
schedule, standard work sheets, kanban cards, process maps, etc. Quality controls could include graphs
depicting defects over time, a defects display table, and displayed inspection checklists. Work controls
could involve documentation defining how products are handled and transported. Object controls could
be tool storage checklists, inventory storage levels, supply controls, machine inspection checklists, etc.' 5
Visual factory methods have been well documented and a great deal of literature exists on the subject.
The intent here is to point out that a first class cell design process will ensure that the visual factory be
taken into consideration at an early stage to ensure that all important pieces of information are clearly
noted, marked and communicated to all personnel. The author, in developing the visual factory strategy
with the workstation design team, focused on several areas. One of the keys was that each machine,
workstation, and operation be clearly marked, identified and explained in relation to the whole cell
process. Each machine was to have signage displaying information about the process being performed,
what process step supplied the machine, what process was its customer, etc. All auxiliary items such as
FIFO racks, tool cabinets, transfer carts and such were also to be clearly marked and labeled.
4.8 Staffing Plan
Once the cell has been designed and planned from a physical and operational standpoint, it must be
staffed appropriately. Obviously a cell could not function without adequate human capital, and so clearly
this is a crucial element of the cell design process. Ultimately, the goal should be to staff production cells
as efficiently as possible based on the workload within the cells and the level of productivity that can
reasonably be expected from the individual operators. This is based on the number of different activities
taking place in the cells, how long each of those activities takes, and the pace or takt time of the cells.
The first step in approaching a staffing plan of a cell is to carefully understand the work that is being
completed in the cell through a standard work analysis. This should include a detailed step-by-step
account of every activity that a part must go through from start to finish. For each activity or process
step, the standard work analysis should note the different ways time is spent, such as through
transportation, manual process time, and automatic process time. The transportation time refers to the
amount of time it takes for a part to be transported from one location to another. It is important to take
into account whether the transportation is completed by operators, automatically (i.e. conveyor belt), or
by some other group of employees other than the actual operators. For example, at RazorAircraft, there is
a material handling organization whose job it is to move batches of parts from one process or machine to
another, while the operators stay at their individual machines and workspaces. As previously mentioned,
(RazorAircraft)
one of the goals of RazorAircraft's cell design for their transmission component shop is to implement a"make a part, move a part" one-piece flow system that requires the operators to move parts themselves to
the next machine. In the existing shop, a part may need to be moved several hundred feet from one
process step to the next. The manual process time refers to the time spent by the operator performing
manual tasks such as loading the part into the machine, inputting parameters into the machine, etc. The
automatic process time would then be the time spent by the machine to process the part without requiring
intervention by the operator. For now, the "changeover" time (sometimes referred to as "setup time"),which is the time required to change a machine from processing product model 'A' to product model 'B'
will be ignored. The changeover time is not to be confused with the loading and unloading of a product
from a machine.
If the cell were a multi-product cell, as in the case of the new transmission component cell at
RazorAircraft, then the analysis would be repeated for each of the other products. Once all of the
products have been accounted for, one can then perform a complete examination of the manual operator
workload of the cell. Depending on the complexity of the operations and the level of precision required,
an approximation can usually be made. For each product, the total number of operations can be
multiplied by an average manual workload per operation to get the total manual workload per unit. This
average manual workload includes the time to load, unload and move parts as well as initiate the
automatic processing of the parts. In the case of RazorAircraft, moving parts from one machine to the
next represented a very small percentage of time relative to the processing time and is included in the
average manual time per operation. The demand for each product would then be multiplied by its
respective workload to get the total manual workload per product for the given time period (of demand).
Finally, all of those workloads would be added together to get the total manual workload for the cell for
the given time period. The total workload calculated would then be divided by the number of hours one
operator position is worth over that time period. It is important to make the distinction between operator
and operator position because in reality, it could be several operators for one position, in the case of
multiple shifts per day or 7 days/week operations. This would give the total number of operator positions
needed per shift.
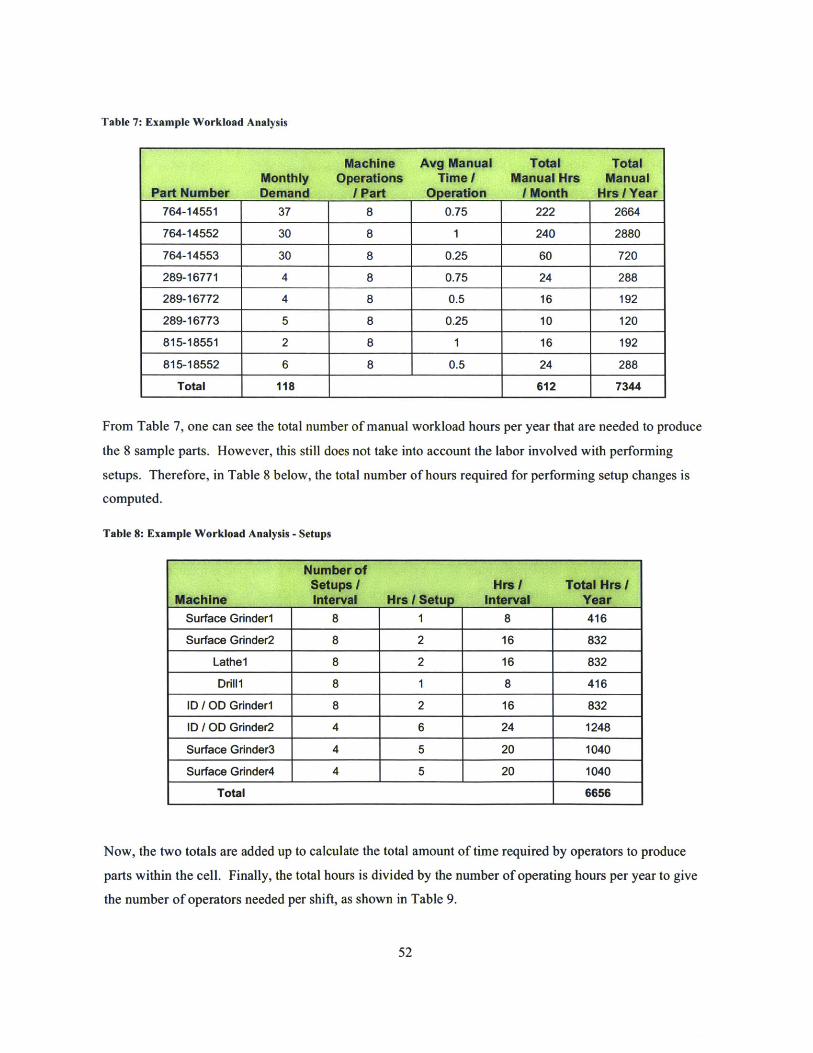
Table 7: Example Workload Analysis
Machine Avg Manual Total TotalMonthly Operations Time I Manual Hrs Manual
Part Number Demand I Part Operation Month Hrs 1 Year764-14551 37 8 0.75 222 2664
764-14552 30 8 1 240 2880
764-14553 30 8 0.25 60 720
289-16771 4 8 0.75 24 288
289-16772 4 8 0.5 16 192
289-16773 5 8 0.25 10 120
815-18551 2 8 1 16 192
815-18552 6 8 0.5 24 288
Total 118 612 7344
From Table 7, one can see the total number of manual workload hours per year that are needed to produce
the 8 sample parts. However, this still does not take into account the labor involved with performing
setups. Therefore, in Table 8 below, the total number of hours required for performing setup changes is
computed.
Table 8: Example Workload Analysis - Setups
Number ofSetups / Hrs Total Hrs
Machine Interval Hrs Setup interval YearSurface Grinder1 8 1 8 416
Surface Grnder2 8 2 16 832
Lathel 8 2 16 832
Drill1 8 1 8 416
ID / OD Grnderl 8 2 16 832
ID / OD Grnder2 4 6 24 1248
Surface Grinder3 4 5 20 1040
Surface Grnder4 4 5 20 1040
Total 6656
Now, the two totals are added up to calculate the total amount of time required by operators to produce
parts within the cell. Finally, the total hours is divided by the number of operating hours per year to give
the number of operators needed per shift, as shown in Table 9.
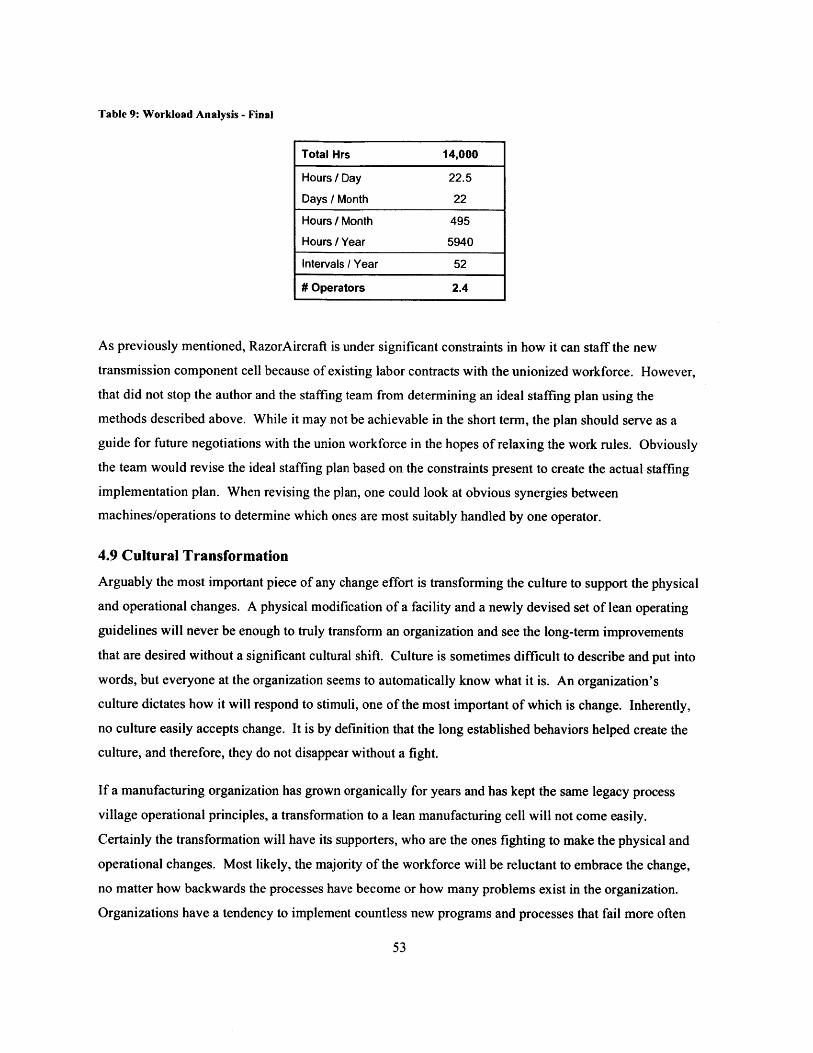
Table 9: Workload Analysis - Final
Total Hrs 14,000
Hours / Day 22.5
Days / Month 22
Hours / Month 495
Hours /Year 5940
Intervals / Year 52
# Operators 2.4
As previously mentioned, RazorAircraft is under significant constraints in how it can staff the new
transmission component cell because of existing labor contracts with the unionized workforce. However,
that did not stop the author and the staffing team from determining an ideal staffing plan using the
methods described above. While it may not be achievable in the short term, the plan should serve as a
guide for future negotiations with the union workforce in the hopes of relaxing the work rules. Obviously
the team would revise the ideal staffing plan based on the constraints present to create the actual staffing
implementation plan. When revising the plan, one could look at obvious synergies between
machines/operations to determine which ones are most suitably handled by one operator.
4.9 Cultural Transformation
Arguably the most important piece of any change effort is transforming the culture to support the physical
and operational changes. A physical modification of a facility and a newly devised set of lean operating
guidelines will never be enough to truly transform an organization and see the long-term improvements
that are desired without a significant cultural shift. Culture is sometimes difficult to describe and put into
words, but everyone at the organization seems to automatically know what it is. An organization's
culture dictates how it will respond to stimuli, one of the most important of which is change. Inherently,
no culture easily accepts change. It is by definition that the long established behaviors helped create the
culture, and therefore, they do not disappear without a fight.
If a manufacturing organization has grown organically for years and has kept the same legacy process
village operational principles, a transformation to a lean manufacturing cell will not come easily.
Certainly the transformation will have its supporters, who are the ones fighting to make the physical and
operational changes. Most likely, the majority of the workforce will be reluctant to embrace the change,
no matter how backwards the processes have become or how many problems exist in the organization.
Organizations have a tendency to implement countless new programs and processes that fail more often
than not. As a result, the workforce gets weary of being dragged along for the changes only to result in
the situation deteriorating and usually reverting back to the original state.
The transformation steering committee responsible for the transmission component cell design process at
RazorAircraft knew the important role that culture played within the organization. As a result, the
committee wanted to ensure that efforts were made to help transform the culture along with the
operational and physical changes being made. The most effective way to begin the cultural
transformation is by getting the buy-in of all the key stakeholders. Rather than trying to force change
onto the organization without warning, it is critical to communicate the vision of the change and attempt
to get everyone on board. To begin, one must make a strong case for change. For RazorAircraft, and the
transmission component shop, it was clear that there were problems. As described earlier, operations on
the shop floor were quite hectic. It was obvious to the management and many of the frontline leaders,
engineers, and other support staff that changes needed to be made. Slowly but surely lean manufacturing
principles and methods were being disseminated to these individuals through RazorAircraft's operating
system, and so they began to recognize better ways of operating. With many of the influential personnel
on board, the case for change still needed to be made to the workforce, which was not an easy task. A
workforce will typically be hesitant to change regardless of how bad the current state is, because that is
what they have grown accustomed to.
If the workforce is reluctant to buy into the case for change and the vision, it is still important to move
forward and not get bogged down in endless debates. As long as a critical mass of supporters within
various parts of the organization is secured, the transformation effort has to keep going. It is therefore
important to rely on the key influential people within the group of supporters to use their networks and
help influence those skeptical people around them.
One of the critical aspects of the cultural transformation is to be very open and transparent with
communications throughout the process. It is important that everyone have access to what the
transformation effort is about, what changes are involved, what the time frame is, and understand how
they will be affected. The best way to communicate with the workforce is to simply have them be
involved, which leads into another critical component of the cultural transformation process. If a culture
is truly to be transformed, they must be engaged in the process and can't simply be told what's happening
while on the sidelines. Therefore, engagement is essential to ensure that the transformation is a success.
All stakeholders need to be active members of the process and have their opinions and ideas heard. The
transformation team at RazorAircraft did this by including representatives from all stakeholder groups
within the different teams. This included operators, engineers, supervisors, quality personnel, inspectors,

etc. Aside from including them as members, the teams as part of their work reached out to others not on
the teams to communicate with them, hear more diverse opinions, and get a higher level of involvement
from the workforce. As the level of engagement and two-way communication increased, it was obvious
that the interest in the transformation increased as well. Many members of the workforce saw the benefits
and joined the group of supporters. Over time, this group will surely continue to grow. There will be
some that never join, but as long as they remain in the minority, the transformation should be successful.
Chapter 5: Results of Transformation
5.1 Current Progress and Lessons Learned
As of this writing, the transformation of the transmission component shop at RazorAircraft continues, and
machines are in the process of being relocated into their new cell positions. The original intent was to
have the transformation completed during the author's onsite internship, but unfortunately that goal was
not realized. The reasons for the delays, however, can serve as important lessons for future cell design
implementations. It is evident that the transformation steering committee underestimated several
challenges and did not address them early enough in the cell design process to avoid the delays that were
experienced.
The biggest setback in the implementation process was developing a production schedule with operations
that met their needs while the machines were being relocated. Obviously a key component of the
transformation process is the actual physical move of the machines from the old job shop into the newly
designed cells. However, the machines in question are large and complex devices that operate within
extremely tight tolerances. Moving them is not a trivial task. In many cases, they require specially built
foundations that isolate them from the rest of the building and any potential vibrations or movement.
Depending on the machine, moving them can take anywhere from a few days to almost two weeks of
working around the clock. Obviously, during this time, operations does not have access to them. If no
spare machine exists or if there is not enough spare capacity, operations can be significantly impacted.
Had the steering team recognized the significant challenge, it would have begun working with operations
earlier to develop a comprehensive strategy for dealing with this.
The other main reason for delays was as a result of attempting to modify the way several of the parts are
manufactured. As previously discussed, with mixed-model cells, even though the cell will manufacture
parts within only one product family, it does not necessarily mean that all parts will be able to follow the
exact same process plan. As a result, not all of the components may be able to flow through the cell in
perfect order, and may have to bounce from one process or machine to another. This increases the
complexity of the operations, and it could impact the performance of the cell. Therefore, the process flow
team attempted to analyze whether the process plans of certain components could be revised in order to
mitigate this issue. Working with the manufacturing engineers to revise the process plans proved more
difficult than originally anticipated. Again, the transformation steering committee should have
recognized the difficulty of this work and incorporated the manufacturing engineers earlier on in the
process to attempt to resolve this difficulty.
Even though the cell is not fully operational, there has been a great deal of progress made. The climate-
controlled room that will house the first cell has been completed, and roughly half of the machines have
been relocated into the room and are up and running. Finally, the operations of the cell have been fully
designed and planned as discussed throughout the thesis.
5.2 Results and Predicted Improvements
Although the transformation of the transmission component shop at RazorAircraft has not been
completed, the transformation steering committee is confident of the value that is being created.
Ultimately, the goal of the changes the shop is making is to provide more value with less waste, primarily
in the form of reduced lead-times, increased quality, lower inventories, lower manufacturing costs,
increased throughput, and reduced complexity of managing the operations.
The most tangible benefits that will result from the new production cells are reduced lead-times and
inventories for all of the products. As discussed throughout the thesis, the fundamental purpose of
production cells is to have an entire value stream for a product or product family located together so parts
can flow smoothly with minimal travel, and reduced buffer inventories between process steps. The
production cells are designed to reduce the amount of time parts have to wait to be processed and can
therefore be manufactured in less time. While it does not necessarily result in increased capacity or
throughput, production cells make it easier for operations to highlight where the existing bottlenecks are,
which paves the way for increasing the capacity and throughput of the entire production process. The
increased quality results from having separate cells devoted to individual product families. Again, the
simplification of the operations allows everyone the ability to better see what is taking place and identify
issues and problems. The lower inventories means operations can't rely on large buffer inventories when
problems arise, and instead is forced to act on them. Because the cells are so focused and designed to run
smoothly, fewer operators are needed, which therefore lowers manufacturing costs. The fewer defects
that result from increased quality also serves to lower manufacturing costs.
To calculate the estimated inventory levels and lead-times of the parts within the cells, the author used the
data from the simulations. During the simulations, the author kept data that showed, in a steady state
condition, how long parts remained in the cell, how many parts were in the cell at any given time, and
how many parts were completed over a given time period. Using Little's Law, which simply states that
the level of inventory in a system is equal to the expected lead-time of a part times the throughput of the
system, the author validated the data. The average value of each part was used to then quantify the
reduction in inventory to a dollar amount. To calculate the reduction in part travel, the author used the
actual dimensions of the new cells and the designed process path that parts will take through the cells and
57

compared that to their current travel paths through the existing shop. A summary of predicted operational
improvements is included below in Table 10.
Table 10: Summary of Predicted Operational Improvements
Category Current State Future State PercentImprovement
Lead Time 45 Days 7 Days 84%
WIP Amount 82 22 73%
WIP Value $850,000 $230,000 73%
Staffing 10 6 40%
Part Travel Distance 1290 ft 490 ft 62%
5.3 Cost / Benefit Analysis
It is important to analyze any project's total economic impact. Based on the predicted improvements
discussed, the costs and benefits of the transformation project are quantified. As previously discussed,
the benefits of the project were clear from the beginning. If inventory, lead-times, and costs are reduced,
there is an obvious financial benefit to the company. The question remains, however, whether the
benefits outweigh the costs of the project. A typical transformation project might not involve the level of
investment that this project entailed due to various constraints that were outlined earlier. In this case, an
entirely new climate-controlled room was constructed, which involved significant capital investment. In
addition, the relocation of all of the machines required capital costs. Several of the larger, more critical
machines required new foundations to be built, and all required new utility lines. An attempt was made at
understanding the financial impact of the project using a net present value calculation taking into account
the discounted cash flows of the costs and benefits of the project. For the calculation, the author used a
discount rate of 10%. See Table 11 below for a summary of the financial costs and benefits of the project
as well as the calculated NPV.
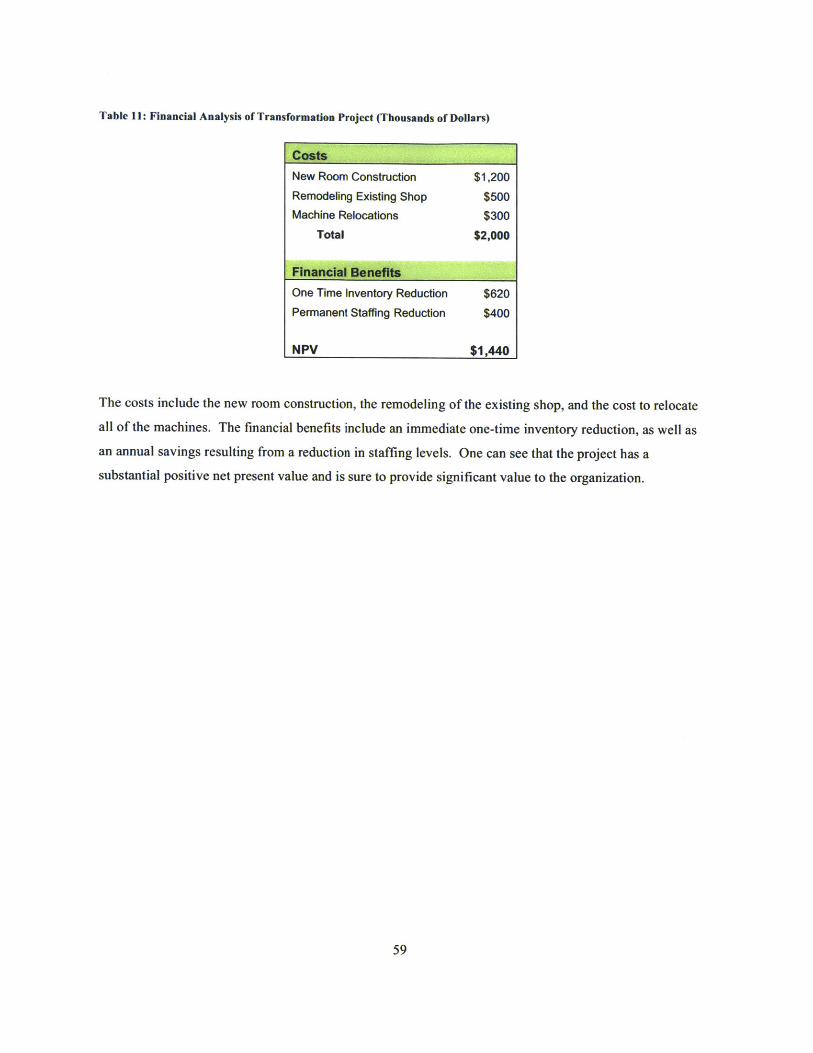
Table 11: Financial Analysis of Transformation Project (Thousands of Dollars)
The costs include the new room construction, the remodeling of the existing shop, and the cost to relocate
all of the machines. The financial benefits include an immediate one-time inventory reduction, as well as
an annual savings resulting from a reduction in staffing levels. One can see that the project has a
substantial positive net present value and is sure to provide significant value to the organization.
CostsNew Room Construction $1,200Remodeling Existing Shop $500Machine Relocations $300
Total $2,000
Financial BenefitsOne Time Inventory Reduction $620Permanent Staffing Reduction $400
NPV $1,440
Chapter 6: Conclusions
The transmission component shop transformation is sure to result in long-term improvements in its
operations. By creating cells and arranging the equipment in a manner that promotes flow, many of the
issues that plague the shop will disappear. Parts will become much easier to track, equipment will no
longer have to be scheduled, and employees will be able to spend more of their time addressing
bottlenecks and tackling other ways to increase throughput and quality.
As of this writing, the cell design implementation continues at RazorAircraft. The machines are in the
process of being relocated according to the plan developed in conjunction with operations. As discussed,
the goal of the plan is to ensure that operations can continue to produce according to their production
schedule. Unfortunately, this has taken longer than originally anticipated. Once the first cell has been
completed, plans can continue to build the three remaining cells in the existing shop space. These new
cells will only add to the existing anticipated benefits and increase the total value of the project to the
organization.
Of course, the lean transformation journey will not be completed once the machines are relocated, and the
cells are operational. In the spirit of continuous improvement, new opportunities to remove waste and
increase the value of the operations will need to be identified, prioritized, and addressed.
6.1 General Framework of the Problem
The problems faced by RazorAircraft and the transmission component department are not unique. These
same operational problems exist in many manufacturing companies and factories all over the world.
Ultimately, any organization that seeks to transform their facility through the use of cellular
manufacturing can utilize the methodologies contained herein to achieve its goals. The author has
attempted to present simultaneously the general framework of the cell design process while also
illustrating an experience of using these methodologies at a leading aerospace manufacturing company.
The general problem presented is that of an organization currently using a process village layout in its
mixed model manufacturing operation. While there is nothing inherently wrong with utilizing process
villages, there are generally wastes that are created in the form of increased inventories, lead-times, and
part travel, to name a few. Cellular manufacturing can eliminate much of this waste by grouping together
an entire value stream for one product family. With improved flow, inventory buffers can be reduced or
completely eliminated, batch sizes can be reduced, and part travel can also be reduced. The cells help
simplify many of the complexities of managing operations by focusing the organization on understanding
and optimizing product value streams.

The basic methodologies that are described in this thesis are to separate the cell design process into key
areas. One is focused on process flow, which can be thought of as the traditional operational design
elements of cellular manufacturing. Another area is material handling, which describes how product and
material will physically flow through the cell and how work in process inventory will be managed.
Workplace organization, helps ensure that the cell is well organized and employs the latest visual factory
tools to promote communication and the flow of information. Finally, the cell is appropriately staffed by
carefully analyzing the workload in the cell, the productivity of workers, and what synergies exist
between machines and operations. By dividing up the transformation process into manageable subjects,
an organization can more effectively handle the complex nature of the effort. Arguably the most
important piece is to build strong teams of diverse stakeholders to ensure all views are well represented
and that the workforce is fully engaged in the process. Utilizing practices such as the Production
Preparation Process helps build teamwork and collaboration and provides a foundation for an effective
transformation project.
Transforming manufacturing operations will never be easy. There will always be many challenges along
the way, but if the cell design process methodologies discussed are used as a guide, the organization will
be better prepared to succeed.
Bibliography
Womack, J. P., & Jones, D. T. (1996). Lean Thinking. Simon & Schuster.
Womack, J. P., Jones, D. T., Roos, D., & Carpenter, D. S. (1990). The Machine That Changed the World.
Free Press.
RazorAircraft. (n.d.). About RazorAircraft. Retrieved February 28, 2011, from RazorAircraft Website.
RazorAircraft. (n.d.). About RazorAircraft Lean Operating System. Retrieved June 10, 2010, from
RazorAircraft Lean Operating System Website.
RazorAircraft. (n.d.). RazorAircraft Visual Factory Principles. Retrieved June 10, 2010, from
RazorAircraft Lean Operating System Website.
Anupindi, R., Chopra, S., Deshmukh, S., Van Mieghem, J., & Zemel, E. (2006). Managing Business
Process Flows: Principles of Operations Management. Pearson Education, Inc.
Hogan, B. J. (1998). Cells Raise Boeing's Capacity. Manufacturing Engineering, 120 (3), 114.
Kastango, N., & Jagiela, S. W. (2010). Collaboration Makes the Process Better. Industrial Engineer, 42
(5), 42-47.
Lanigan, J. (2004). 5S Provides Competitive Lean Foundation. SMT: Surface Mount Technology, 18 (5),
70-72.
Silver, E. A., Pyke, D. F., & Peterson, R. (1998). Inventory Management and Production Planning and
Scheduling. John Wiley & Sons, Inc.