groundnut production - welcome to e-lis repositoryeprints.rclis.org/15746/1/a global mapping system...
TRANSCRIPT

F A O A G R I C U L T U R A L I N F O R M A T I O N M A N A G E M E N T S E R I E S
1
A GlobalMappingSystem
for BambaraGroundnutProduction
“ This report describes anapproach to assess locations and arealexpanses that have potential for theproduction of bambara groundnut (Vignasubterranea L. Verdc) across the world.The methodology was applied both toregions such as Africa, where the crop iswidely cultivated but where experimentalevidence is limited, and to new regionsthat have not previously been associatedwith bambara groundnut but whereenvironmental factors are conducive forproductive growth.
A weather generator and a crop simulationmodel of bambara groundnut (BAMnut)were incorporated into a GeographicalInformation System (GIS) to predict, forthe first time, bambara groundnutproduction for the world. BAMnut is aprocess-based model that usesphysiological principles to describe thecapture and use of environmentalresources, principally solar radiation andsoil moisture. This mechanistic approachallows crop growth and yield to bepredicted for regions beyond those usedin the development of the model orregions where bambara groundnut iscurrently cultivated.
The preliminary identification of potentiallysuitable areas for production, based onthe agro-ecological requirements of thecrop, serve as a useful prelude to detailedfield investigations on bambara groundnutto identify appropriate managementpractices and may provide a basis for asimilar assessment on many otherunderutilized crops. ”
A Global Mapping System for Bambara Groundnut Production
FA
O
1
ISSN 1020-8712
F A O A G R I C U LT U R A L
I N F O R M A T I O N M A N A G E M E N T
S E R I E S
1
A GlobalMappingSystem
for BambaraGroundnutProduction
FOOD AND AGRICULTURE
ORGANIZATION OF THE UNITED NATIONS
Rome, 2001
Sayed Azam-AliUnversity of Nottingham
United Kingdom
José Aguilar-ManjarrezWaicent-Fao
Rome, Italy
Mohammad Bannayan-AvvalUniversity of Nottingham
United Kingdom

The designations employed and the presentation of material inthis information product do not imply the expression of anyopinion whatsoever on the part of the Food and AgricultureOrganization of the United Nations concerning the legal statusof any country, territory, city or area or of its authorities, orconcerning the delimitation of its frontiers or boundaries.
All rights reserved. Reproduction and dissemination of material in thisinformation product for educational or other non-commercial purposes areauthorized without any prior written permission from the copyright holdersprovided the source is fully acknowledged. Reproduction of material in thisinformation product for resale or other commercial purposes is prohibited withoutwritten permission of the copyright holders. Applications for such permissionshould be addressed to the Chief, Publishing and Multimedia Service,Information Division, FAO, Viale delle Terme di Caracalla, 00100 Rome, Italyor by e-mail to [email protected]
© FAO 2001
ISBN 92-5-104579-8

Preface
This is the first study that estimates the potential production for any underutilisedcrop on a global basis. Our long-term aim is to demonstrate how this approach,initially for bambara groundnut, can be used to assess the potential productivityof many underutilised food crops at locations beyond their current distribution.
The most significant contributions from this study are the integration of aweather simulator and a crop simulation model into a Geographical Informa-tion System (GIS) to predict potential production of bambara groundnut overthe globe. The integration came through a coincidence of interests. FAO neededto improve the knowledge and better use of underutilised crops that can con-tribute to the food security of the worlds poorest people. For the University ofNottingham it was an opportunity to provide a geographic basis for their exist-ing crop model that had been refined by the third author so that predictions ofbambara groundnut potential could be extended to new sites.
Integration of the weather generator and model into a GIS was based on theexperiences gained by the second author in using fish growth models to estimatepotential for fish farming in Africa (FAO, 1998, available at www.fao.org/docrep/W8522e/W8522E00.htm).
For more information, please contact:WAICENT ManagerLibrary and Documentation Systems Division,Food and Agriculture Organization of the United NationsViale delle Terme di Caracalla,00100 Rome, [email protected]
iii

Contents
Preface iiiAbbreviations ixSummary xi
INTRODUCTION 1
Overview 1
Background 1
Bambara groundnut 2
Simulation models 3
Experimental data 3
Chapter 1
MATERIALS AND METHODS 5
BAMnut A simulation model for bambara groundnut 6
Inputs to BAMnut model Weather data 13
Chapter 2
RESULTS AND DISCUSSION 17
Output from BAMnut model Crop biomass and pod yields 17
Evaluation 28
CONCLUSIONS 31
Interpretation of bambara groundnut potential production 31
Study refinements 32
Future applications 33
APPENDIX 35
Hardware and software 35
World weather database 35
World weather generator 37
Statistics of outputs from BAMnut 40
GRID outputs 42
Arc/Info UNIX database directory 44
REFERENCES 45
v

TABLES
1. Shoot biomass, pod yield and harvest index of bambaragroundnut across all experiments used in the developmentof the BAMnut model 11
2. Classification of suitability ranges for predicted biomassand pod yield of bambara groundnut 17
3. Comparison between predicted and reported pod yieldvalues (kg ha-1) 29
4. Statistics of mean monthly air temperature values forglobal land areas 38
5. Statistics of mean monthly precipitation and wet daysvalues for global land areas 38
6. Statistics of mean monthly vapour pressure and radiationvalues for global land areas 38
7. Statistics of mean monthly wind speed values forglobal land areas 39
8. Settings for weather generator 39
vi

FIGURES
1. Schematic diagram describing the procedures involved in estimatingand mapping the potential production of bambara groundnut 5
2. Relational diagram of the BAMnut model 6
3. The temperature factor for photosynthesis correction in BAMnut 7
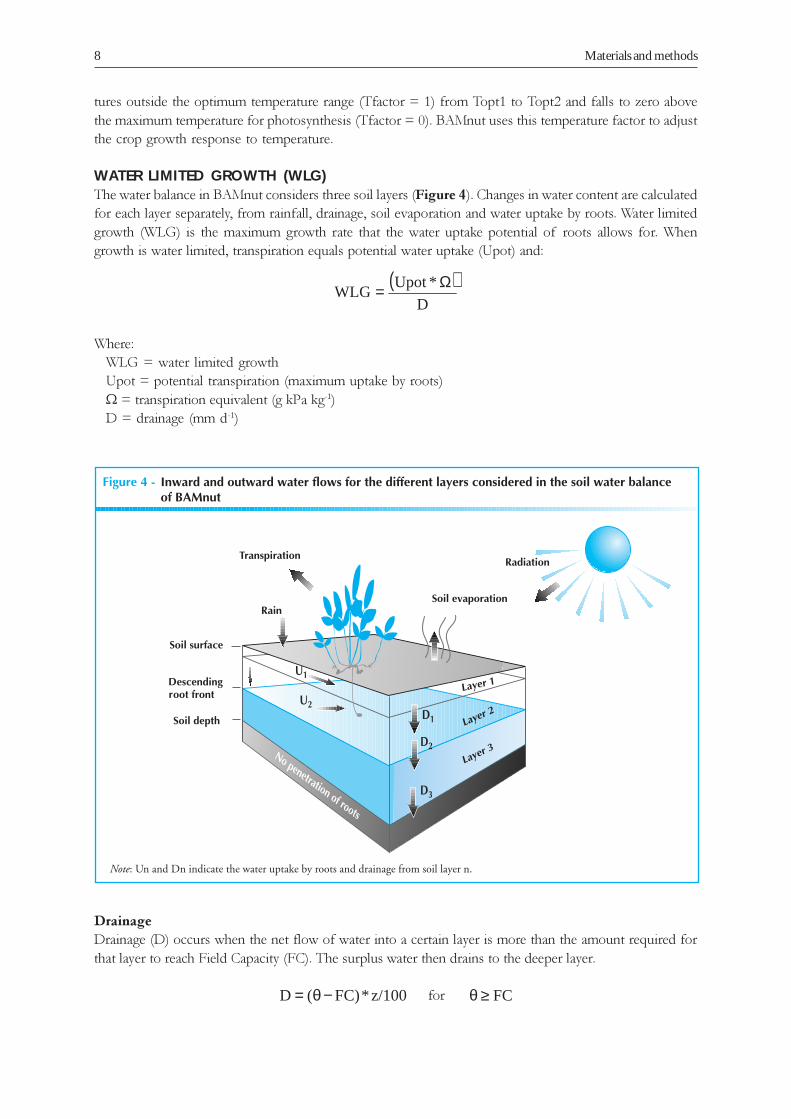
4. Inward and outward water flows for the different layersconsidered in the soil water balance of BAMnut 8
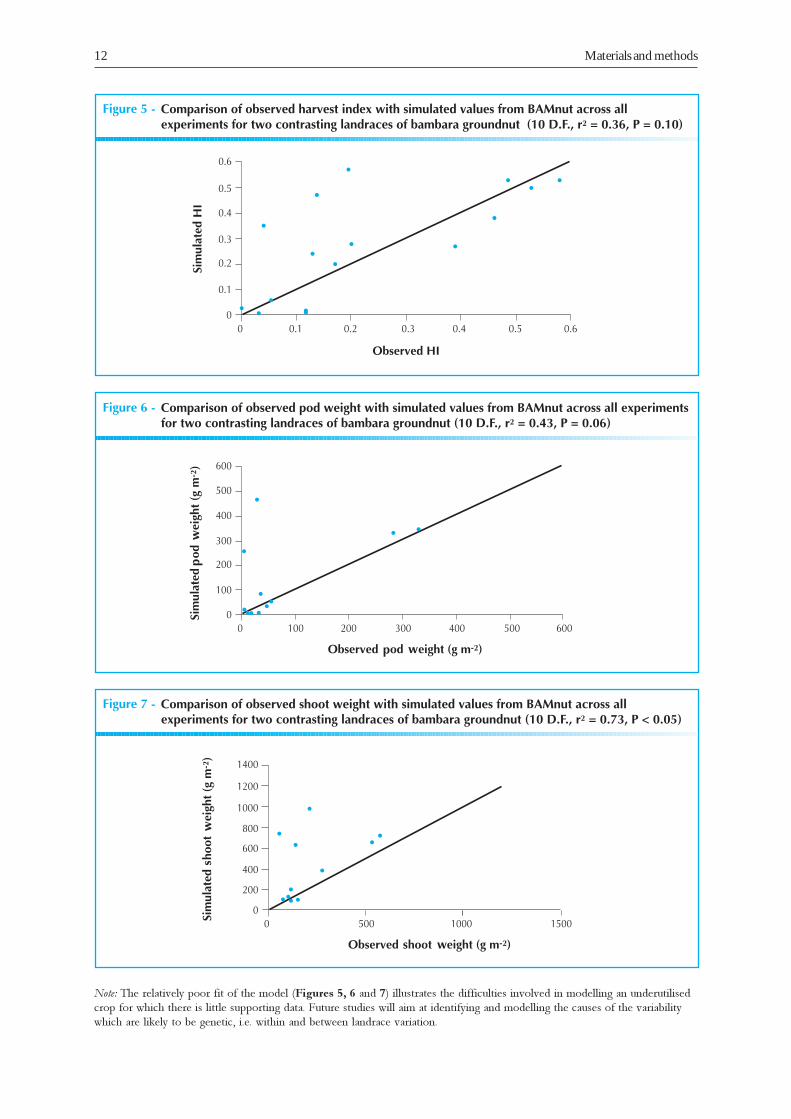
5. Comparison of observed harvest index with simulated valuesfrom BAMnut across all experiments for two contrastinglandraces of bambara groundnut (10 D.F., r2 = 0.36, P = 0.10) 12
6. Comparison of observed pod weight with simulated valuesfrom BAMnut across all experiments for two contrastinglandraces of bambara groundnut (10 D.F., r2 = 0.43, P = 0.06) 12
7. Comparison of observed shoot weight with simulated valuesfrom BAMnut model across all experiments for two contrastinglandraces of bambara groundnut (10 D.F., r2 = 0.73, P < 0.05) 12
8. The interface of the weather data generator developed forthe present bambara groundnut mapping study 14
9. Comparison of simulated and observed weather data forSutton Bonington, UK (52o 49 48 N, 1o 15 0 W) 16
10. Predicted biomass of bambara groundnut (kg ha-1)across the world 18
11. Predicted pod yields of bambara groundnut (kg ha-1)across the world 19
12.1-12.11 Relative surface area with potential biomass forbambara groundnut 20-24
13.1-13.11 Relative surface area with potential pod yield forbambara groundnut 25-28
vii

ix
Abbreviations
AW1 Available water above pwp in layer 1 (mm)AWmax Available water at field capacity (mm)D Atmospheric saturation deficit (kPa)DAE Days after 50% emergenceDAR Days after last rain or irrigation (d)DAS Days after sowingDeficit Water amount required to fill layer 1 to FC (mm)DR2 Drainage from layer 2 to layer 3 (mm d1)dRF/dt Root front velocity (mm d-1)Drrate Relative drainage rate (d-1)EEQ Equilibrium evaporation (mm d-1)ES Daily soil evaporation (mm d-1)ESO Daily potential soil evaporation (mm d-1)EVAPO Potential evaporation (mm d-1)F_Root Daily fractional partitioning to rootsFC Soil moisture at field capacity (volume %)Fi Fraction of radiation intercepted by leavesFrs Fraction of seed material converted to plant biomassGrainW Individual grain weight (g seed-1)Growth Daily biomass assimilation (g m-2 d-1)HI Harvest index; pod:shoot weight ratioHimax Cut off point for maximum harvest indexK Light extinction coefficientL Leaf area indexLeafW Leaf weight (g m-2 d-1)LLG Radiation limited growthLLP Daily light limited photosynthetic rate (g m-2 d-1)LSR Leaf : shoot weight ratioLSRi Initial value of LSRMOISTi Initial soil moisture (volume %)PodW Pod dry weight (g m-2)POP Population density (plants m-2)PWP Soil moisture at permanent wilting point (volume %)RD Root density (m m-3)Rlfactor Root length factor (g m-1)RootL Total root length (m m-2)RootW Root dry weight (g m-2)ShootW Shoot dry weight (g m-2)SLA Specific leaf area (m-2 g-1)Stindex Stress index, genotype constant for stress toleranceStress Drought stressTbase Base temperature for crop development (°C)Tfactor Photosynthesis correction factor for temperatureTmax Daily maximum temperature (°C)
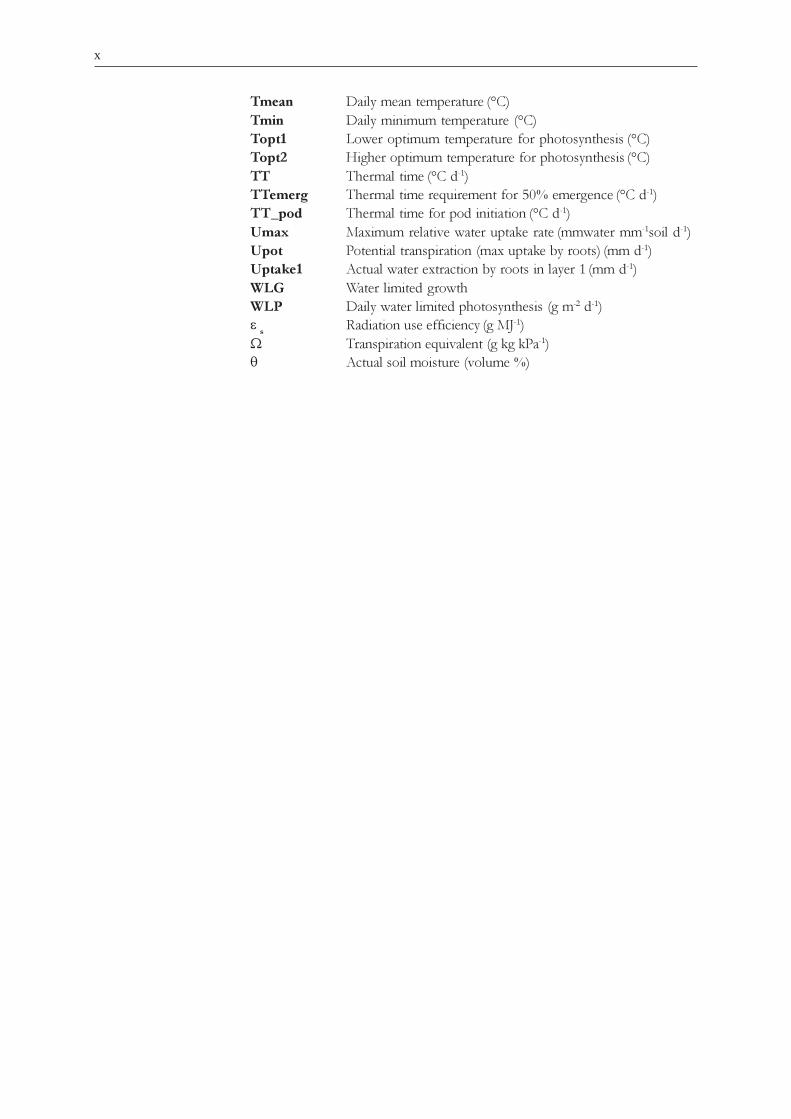
Tmean Daily mean temperature (°C)Tmin Daily minimum temperature (°C)Topt1 Lower optimum temperature for photosynthesis (°C)Topt2 Higher optimum temperature for photosynthesis (°C)TT Thermal time (°C d-1)TTemerg Thermal time requirement for 50% emergence (°C d-1)TT_pod Thermal time for pod initiation (°C d-1)Umax Maximum relative water uptake rate (mmwater mm-1soil d-1)Upot Potential transpiration (max uptake by roots) (mm d-1)Uptake1 Actual water extraction by roots in layer 1 (mm d-1)WLG Water limited growthWLP Daily water limited photosynthesis (g m-2 d-1)e s Radiation use efficiency (g MJ-1)W Transpiration equivalent (g kg kPa-1)q Actual soil moisture (volume %)
x

xi
Summary
This report describes an approach to assess locations and areal expanses thathave potential for the production of bambara groundnut (Vigna subterranea L.Verdc) across the world. The methodology was applied both to regions such asAfrica, where the crop is widely cultivated but where experimental evidence islimited, and to new regions that have not previously been associated with bambaragroundnut but where environmental factors are conducive for productive growth.A weather generator and a crop simulation model of bambara groundnut(BAMnut) were incorporated into a Geographical Information System (GIS) topredict, for the first time, bambara groundnut production for the world.
A gridded mean monthly climate dataset at a resolution of 50 km x 50 km forglobal land areas (excluding Antarctica), for the period 1961-1990, were used asinput to the weather data generator to generate daily weather data. Simulationresults from BAMnut in a suitable format were used as input to the GIS toprovide the required maps and statistics. Given the time frame of the presentstudy, neither the model nor the overall methodology attempted to account forthe specific effects of soil type, pests or diseases on the likely productivity ofbambara groundnut at any location. Similarly, the influence of daylength sensi-tivity for pod filling in many bambara groundnut landraces was not assessed inrelation to potential yield. However, by scrutinising the world for bambaragroundnut potential in relatively small sites, GIS technology provided a meansto ask, where is the best potential for growth, what is the likely yield thresholdand over how much surface area of land are yields achievable?
Each site that was evaluated was approximately a 50 km x 50 km (at theequator) grid cell, of which 62,482 cells corresponded to global land areas.Results show that bambara groundnut is likely to produce significant pod yieldsin many parts of the world beyond its current distribution with suitable areas ofpotential production in America, Australia, Europe and Asia as well as Africa. Infact, locations within the Mediterranean region show the highest predicted bio-mass, often exceeding 8.5 t ha-1. The mapped predictions indicate that the pro-ductivity of bambara groundnut is likely to be influenced by the pattern ofrainfall distribution as well as its annual amount and by the minimum and maxi-mum temperature during the growing season. When factors such as the seasonaldistribution of rainfall, daylength and range of temperatures during the growingseason are accounted for, the potential yields of bambara groundnut within itscurrent areas of cultivation can be significantly increased without high levels ofagronomic inputs.
The preliminary identification of potentially suitable areas for production, basedon the agro-ecological requirements of the crop, serve as a useful prelude todetailed field investigations on bambara groundnut to identify appropriate man-agement practices and may provide a basis for a similar assessment on manyother underutilised crops. The approach described here has implications forissues of food security since the methodology can be rapidly extended to assessthe potential productivity of many subsistence food crops that contribute to thediets of the worlds poorest people.

A global mapping system for bambara groundnut production 1
Introduction
OVERVIEW
For generations, agronomic experiments have been the conventional basis for cultivar selection and theevaluation of crop productivity in response to climate, soil and management options. However, agronomyis often limited by the availability of physical and human resources. All agronomic research is restricted to alimited number of sites, seasons and experimental combinations. Nevertheless, general recommendationsfor appropriate agronomic practices require an assessment of spatial and temporal variability, both withinand between locations. This requirement is difficult to satisfy through conventional short-term experimenta-tion on a limited number of sites. For the worlds major crops, agronomic recommendations have beenbased on a long history of experiments and experience across a range of sites, seasons and managementpractices. By definition, major crops have an international significance and therefore research effort can bedirected to long term and broad geographical objectives. In contrast, minor or underutilised crops oftenhave important but regional or local significance. Since many of these crops are grown for subsistence andcontribute to the food security of many of the worlds poorest people, attempts to improve them rarelyattract interest from international agencies or commercial sponsors. As a result, research on underutilisedcrops cannot afford the luxury of a long-term international effort and to make rapid progress alternativesto conventional agronomic experimentation must be sought. Recent developments in the use of computer-based analytical tools, such as weather data generators, crop simulation models, geographic informationsystems (GIS) and the Internet, provide exciting new opportunities to complement conventional agronomyand provide practical recommendations for appropriate agronomic practices outside the limited range ofexperimental conditions. One particular use of these new technologies is to assess the potential productivityof underutilised crops at locations beyond their current distribution.
OBJECTIVESThe objective of this study was to assess the potential productivity of bambara groundnut (Vigna subterraneaL. Verdc) an underutilised African legume across the world. This global approach had two aims:
To evaluate the productive potential of regions such as Africa, where the crop has been grown forcenturies, but where experimental evidence is scant, incomplete or inaccessible.
To define new regions not previously associated with the cultivation of bambara groundnut but wherethe combination of environmental factors indicate a potential for productive growth without recourseto costly inputs, such as irrigation.
BACKGROUND
Most human food requirements are provided by fewer than 20 crop species. There remains a vast reposi-tory of many hundreds of underutilised species that have been grown locally for centuries and whichcontribute to the food security of the worlds poorest people. Many of these crops are cultivated in hostile,tropical environments by small-scale farmers without access to irrigation or fertilisers and with little guidanceon improved practices and feasible alternatives. Any attempts to improve their germplasm or managementpractices depend on local experience and resources since most agricultural scientists and breeders haveignored or actively discouraged the cultivation of indigenous underutilised crops. The few efforts that havebeen made to evaluate these species by conventional methods have been slow and labour-intensive andresearch funds have rarely been directed to multidisciplinary research on such crops of unknown potential.
Introduction2
Furthermore, because many of these crops are grown for subsistence, little effort has been made to geneticallyor agronomically improve them or assess their nutritional, processing and economic potential. A majorlimitation of most research on underutilised crops is that, because of inadequate funding, it is confined to asingle aspect, e.g. breeding, of the particular species in question. The lack of a multidisciplinary effort orcomprehensive published literature on any particular underutilised species means that any research that isdone may duplicate that being done elsewhere with no increase in overall knowledge or understanding ofthe crop in question. The lack of an overarching strategy for the improvement of different underutilisedcrops discourages the development of general principles that can be applied across species. This piecemealapproach reduces both the effectiveness of research on each underutilised species and the collective influ-ence of those advocating greater efforts to increase agricultural biodiversity.
If there is to be an increase in agricultural biodiversity and a broader basis to food security policies, thereis an urgent need to co-ordinate research on underutilised crops within a general and robust methodology that:
1) Disseminates recommendations to growers and advisors on management practices and end uses.2) Defines physiological attributes and responses to environmental factors so that the agro-ecological
requirements of each crop can be determined.3) Identifies how knowledge and understanding gained on any particular species can rapidly be applied
to increase our understanding of other underutilised crops.This study, using our experience of bambara groundnut as an example, demonstrates how the integration
of physiological principles, field research and crop modelling together with a weather data generator andGIS can provide a general and cost-effective means of rapidly assessing the potential of many underutilisedfood crops.
BAMBARA GROUNDNUT
Bambara groundnut (Vigna subterranea L. Verdc) is an indigenous grain legume grown mainly by subsistencewomen farmers in drier parts of sub-saharan Africa. The crop has advantages over more favoured speciesin terms of nutritional value and tolerance to adverse environmental conditions. In much of Africa, bambaragroundnut is the third most important legume after groundnut (Arachis hypogaea) and cowpea (Vigna unguiculata)(Sellschop, 1962). The crop has a number of production advantages in that it can yield on poor soils withlittle rainfall as well as produce substantial yields under better conditions. It is nutritionally superior to otherlegumes and is the preferred food crop of many local people (Linnemann, 1990; Brough and Azam-Ali,1992). Bambara groundnut is a rich source of protein (16-25%) and its seeds are valued both for theirnutritional and economic importance. The seeds command a high market price, with demand far outweigh-ing supply in many areas (Coudert, 1982). However, despite these important attributes, the agro-ecologicaland genetic potential of bambara groundnut have not yet been fully realised nor its full economic signifi-cance determined. The crop is still cultivated from local landraces rather than varieties bred specifically forparticular agro-ecological conditions or production systems.
Recently, scientists in Africa and elsewhere have begun to accumulate agronomic and physiological knowl-edge about the crop and to link this with the indigenous knowledge and perceptions of farmers and theirfamilies. Between 1992 and 1996, the University of Nottingham, UK, co-ordinated a major EuropeanUnion (EU) project to assess the agro-ecological potential of bambara groundnut. This programme linkedfield experiments in the United Republic of Tanzania, Botswana and Sierra Leone with experiments andanalysis at Nottingham and Wageningen University in the Netherlands. The objectives of the EU BambaraGroundnut Project were to:
1) Define sites and seasons for bambara groundnut cultivation in the United Republic of Tanzania,Botswana and Sierra Leone.
2) Produce a validated, mechanistic model of bambara groundnut to predict total biomass and podyield in contrasting soil and atmospheric environments.
3) Identify attributes associated with the ability to produce yields under semi-arid conditions.

A global mapping system for bambara groundnut production 3
4) Recommend management practices to stabilise crop yields under rainfed conditions.5) Outline a methodology for applying a similar approach to rapidly assess the potential of other
underutilised species.A more complete description of the EU project appears in University of Nottingham (1997). A number
of associated publications describe the growth and development of the crop (Collinson et al., 1996) itscapture and use of solar radiation (Collinson et al., 1999) germination responses of seeds (Kocabas et al.,1999) and yield responses to sowing date (Collinson et al., 2000).
SIMULATION MODELS
Simulation models are robust tools to guide our understanding of how a system responds to a given set ofconditions. Crop simulation models are increasingly being used in agriculture to estimate production poten-tials, design plant ideotypes, transfer agrotechnologies, assist strategic and tactical decisions, forecast real timeyields and establish research priorities (Uehera and Tsuji, 1993; Penning de Vries and Teng, 1993; Bannayanand Crout, 1999). Although there are growth simulation models for a range of major crops, there have beenfew attempts to develop models for underutilised species for which the factors controlling growth anddevelopment are not well understood and the general literature is sparse. The BAMnut crop simulationmodel was designed as a part of the EU Bambara Groundnut Project to integrate our knowledge about theagro-ecological requirements of bambara groundnut across a range of locations in Africa. BAMnut is thefirst dynamic simulation model for bambara groundnut and therefore provides the first predictions of its podyields in response to the use of environmental resources or responses to environmental stress. A majorobjective for developing BAMnut was to provide a means of integrating our preliminary understanding ofthe dynamics of crop growth as influenced by soil moisture and environmental variables. This allows theagro-ecological potential and resource requirements of the crop to be established. In particular, becauseBAMnut is a process-based model, it allows predictions of crop growth and yield to be generated andmatched with current and potential production environments beyond those used in the development of theoriginal model.
EXPERIMENTAL DATA
To develop BAMnut, functional relations were derived from experimental data collected in growth roomor glasshouse experiments at the University of Nottingham (UK) in 1995 (Collinson et al., 1993, 1997and1999;Kocabas et al., 1999; Berchie, 1996; Babiker, 1989; Zulu, 1989) and field experiments conducted in Africa(Sesay and Yarmah, 1996; Karikari, et al., 1996;). A set of independent data from Nottingham and two years(1994, 1995) field data from two sites in the United Republic of Tanzania (Morogoro: 6° 49 S, 37° 4 E andHombolo 5° 54 S, 35° 57 E) were used to evaluate the model.
For the 1995 glasshouse experiments, three contrasting landraces of bambara groundnut were grown ascrop stands in controlled-environment glasshouses at the Tropical Crops Research Unit (TCRU), Universityof Nottingham. Each glasshouse has a cropping area of 35 m2 containing a sandy loam soil overlying agravely loam subsoil. This area is subdivided into two equal plots within which soil moisture can be indepen-dently controlled and monitored. The soil volume is lined to a depth of 1.25 m with butyl rubber to preventnatural water table fluctuations from affecting the rooting zone. The three bambara groundnut landraceswere obtained from collaborating institutions in Sierra Leone (LunT), the United Republic of Tanzania(DodR) and Botswana (DipC). In each glasshouse, one landrace was grown in each plot and received oneof two soil moisture treatments. In the first, the soil was irrigated to 90% field capacity each week. In thesecond, the soil was irrigated to 60% field capacity until establishment (27 days after sowing (DAS)) with nofurther irrigation (Collinson et al., 1999). The crops received natural daylight with no supplementary lighting.Fertiliser was applied prior to sowing to achieve approximate soil nutrient contents of; N 150 kg ha-1,

Introduction4
P 40 kg ha-1 and K 150 kg ha-1 based on soil analysis. Crop growth measurements were obtained from sevensequential growth analyses taken during the growing period. More details of this experiment can be foundin Collinson et al., (1999).
Two of the landraces used in the 1995 glasshouse experiment (DipC and DodR) were also grown in afield study in the United Republic of Tanzania. In the field experiments, the crop was planted at threedifferent dates; 4 January, 4 February and 4 March in 1994 and 1995 on a sandy loam soil. Experiments werearranged as a randomised complete block design with four replicates each containing six plots. Individualplot size was 5.6 x 5.6 m, each plot containing 16 rows 35 cm apart. Fertiliser was applied prior to sowingat a rate of 40 Kg N ha-1 using NPK compound fertiliser (25:5:5). Sequential growth analyses were carriedout on six plants per plot on eight occasions throughout the season.

A global mapping system for bambara groundnut production 5
Chapter 1
Materials and methods
Agronomy is the science of crop management. It proceeds from a physiological understanding of the cropthrough to the prediction and verification of better management techniques. One possible means of achiev-ing better agronomic management is the use of crop models. A crop model can be defined as a quantitativemeans of predicting the growth, development and yield of a crop, given a set of genetic coefficients andrelevant environmental variables (Monteith, 1996). A model has two important and related purposes: toimprove our understanding of the crop and to predict how a crop will perform in defined agriculturalenvironments, thereby aiding tactical and strategic decision-making.
This study examines how well sites across the globe satisfy potential biomass requirements for bambaragroundnut and their likely yield thresholds in terms of pod production. In overview, there are two majoranalytical procedures in this study:
1) Integration of a weather generator into a GIS for the creation of daily weather data; and2) Integration of BAMnut into a GIS;BAMnut needs information and data on the most important factors that affect crop yields - the model
inputs. After passing through BAMnut, the inputs are converted to a number of outputs, such as maps andstatistics of crop yields. A schematic diagram summarising the methodological framework developed in thisstudy is shown in Figure 1.
Materials and methods6
BAMnut – A SIMULATION MODELFOR BAMBARA GROUNDNUT
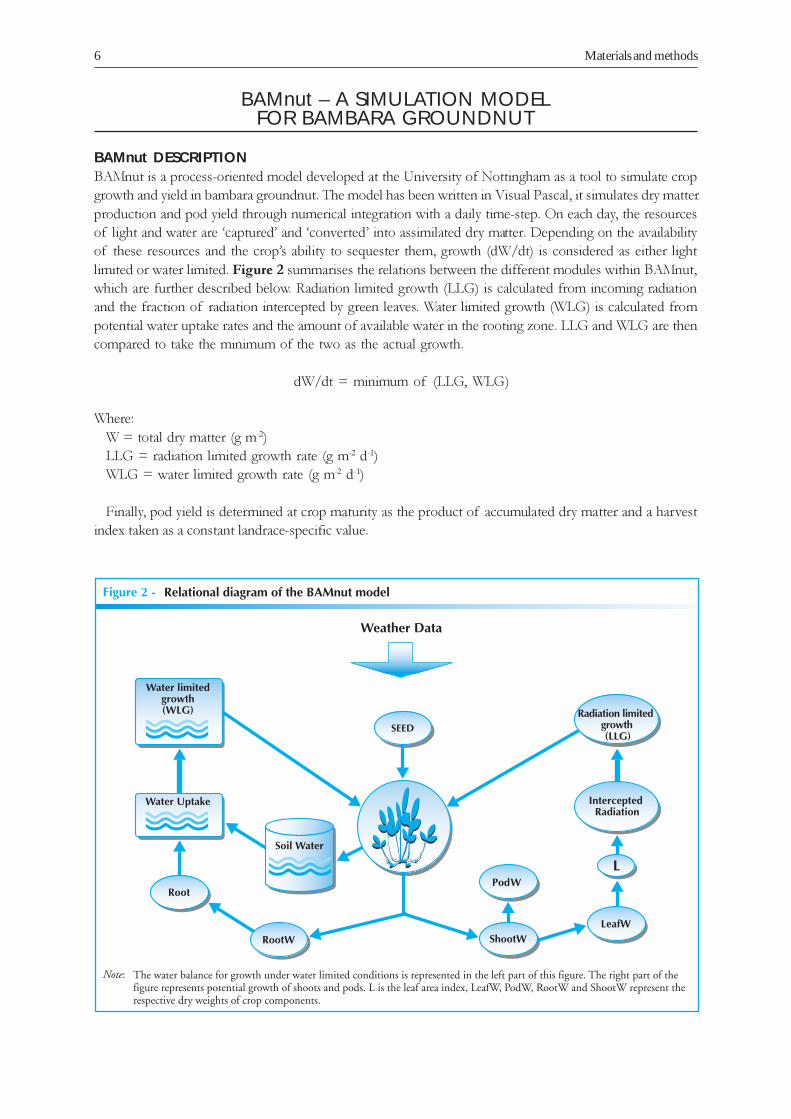
BAMnut DESCRIPTIONBAMnut is a process-oriented model developed at the University of Nottingham as a tool to simulate cropgrowth and yield in bambara groundnut. The model has been written in Visual Pascal, it simulates dry matterproduction and pod yield through numerical integration with a daily time-step. On each day, the resourcesof light and water are captured and converted into assimilated dry matter. Depending on the availabilityof these resources and the crops ability to sequester them, growth (dW/dt) is considered as either lightlimited or water limited. Figure 2 summarises the relations between the different modules within BAMnut,which are further described below. Radiation limited growth (LLG) is calculated from incoming radiationand the fraction of radiation intercepted by green leaves. Water limited growth (WLG) is calculated frompotential water uptake rates and the amount of available water in the rooting zone. LLG and WLG are thencompared to take the minimum of the two as the actual growth.
dW/dt = minimum of (LLG, WLG)
Where:W = total dry matter (g m-2)LLG = radiation limited growth rate (g m-2 d-1)WLG = water limited growth rate (g m-2 d-1)
Finally, pod yield is determined at crop maturity as the product of accumulated dry matter and a harvestindex taken as a constant landrace-specific value.

A global mapping system for bambara groundnut production 7
RADIATION LIMITED GROWTH (LLG)Under optimal conditions (potential growth) a high proportion of variation in biomass production can beexplained from intercepted radiation with a simple equation:
LLG = es * Radiation * Fi * Tfactor
Fi = 1- e (K*L)
Where:LLG = radiation limited growthes = radiation use efficiency (g MJ-1)Radiation = incoming solar radiation above canopy (MJ m-2 d-1)Fi = fraction of radiation intercepted by canopyTfactor = growth correction factor for temperatureK = light extinction coefficientL = leaf area index
The approach described above was first defined by Monteith (1977) and Gallagher and Biscoe (1978).BAMnut follows the same approach with growth as the product of intercepted radiation and a conversionfactor (radiation use efficiency, es). The fraction, Fi, of radiation intercepted is calculated from the leaf areaindex, L, and the canopy extinction coefficient, K, using the Beers Law approach (Squire, 1990), which statesthat fractional interception is related to the leaf area index of a canopy. Radiation limited growth (LLG) iscalculated from solar radiation intercepted by leaves. BAMnut assumes a constant radiation use efficiency,(es =1.2 g MJ-1). This provides a conversion factor for radiant energy to plant biomass i.e. the ratio of drymatter produced to solar radiation intercepted during a defined period of growth.
Growth response to temperature (Tfactor)The experimental data from the Nottingham glasshouse experiments showed that for bambara groundnut,es remained constant across all experiments. The literature suggests that photosynthetic rate depends on theambient temperature i.e. a temperature factor for the photosynthesis/light response (Goudriaan and vanLaar, 1994). This concept is incorporated in BAMnut and a temperature factor (Tfactor) is calculated ac-cording to the temperature relation shown in Figure 3. The value of es is reduced by Tfactor at tempera-
Materials and methods8
tures outside the optimum temperature range (Tfactor = 1) from Topt1 to Topt2 and falls to zero abovethe maximum temperature for photosynthesis (Tfactor = 0). BAMnut uses this temperature factor to adjustthe crop growth response to temperature.
WATER LIMITED GROWTH (WLG)The water balance in BAMnut considers three soil layers (Figure 4). Changes in water content are calculatedfor each layer separately, from rainfall, drainage, soil evaporation and water uptake by roots. Water limitedgrowth (WLG) is the maximum growth rate that the water uptake potential of roots allows for. Whengrowth is water limited, transpiration equals potential water uptake (Upot) and:
( )D
*UpotWLG
Ω=
Where:WLG = water limited growthUpot = potential transpiration (maximum uptake by roots)W = transpiration equivalent (g kPa kg-1)D = drainage (mm d-1)
DrainageDrainage (D) occurs when the net flow of water into a certain layer is more than the amount required forthat layer to reach Field Capacity (FC). The surplus water then drains to the deeper layer.
z/100*FC)(D −θ= for FC≥θ

A global mapping system for bambara groundnut production 9
Where:D = drainage (mm d-1)q = actual soil moisture (volume %)FC = soil moisture % at field capacity (volume %)z = thickness of the soil layer (mm)
Potential evapotranspiration (PET)PET is calculated using an equilibrium evaporation concept as modified by Priestley and Taylor (1972). Thisallows the calculation of approximate daytime net radiation and equilibrium evaporation, assuming that thestomata are closed at night and therefore that no PET occurs during this period. PET is calculated as 1.1times the equilibrium evaporation to account for the effects of unsaturated air. The multiplier is increasedabove 1.1 to allow for advection when the maximum temperature is greater than 35°C, and reduced fortemperatures below 5°C, to account for the influence of low temperatures.
Soil evaporationPotential soil evaporation is the potential evaporation minus transpiration. The actual soil evaporation is thelowest of two values; potential soil evaporation and soil evaporation calculated for a soil that dries withinthe time period. This consideration is consistent with the two-stage concept of Ritchie (1972).
Soil evaporation = ESO (potential soil evaporation) if Ecum<Upot
Otherwise:Soil evaporation = ( ) ( )1*1.1*1.1 −− DARDAR
Where:Ecum = accumulated soil evaporation (mm d-1)Upot = potential transpiration (maximum uptake by roots)DAR = days after the last rain (d)
TRANSPIRATION EQUIVALENTEvaporative demand is defined as the amount of water transpired in order to realise a certain light limitedgrowth rate. As both photosynthesis and transpiration are based on canopy gas exchange, BAMnut assumesa close relationship between transpiration and dry matter production. This is because changes in stomatalresistance will equally affect both carbon assimilation and transpiration.
Water limited growth is often calculated as the product of potential water uptake and a crop specific(constant) water use efficiency (WUE). BAMnut uses the transpiration equivalent, W (g kPa kg-1), accordingto Azam-Ali et al, (1994). Water use efficiency is not treated as a crop specific constant but a variable thatresponds negatively to changes in atmospheric saturation deficit. Azam-Ali et al, (1994) defined W as a cropspecific constant that relates to water use efficiency as follows:
DWUE
Ω=
WUE* Upot=WLG
Where:WUE = water use efficiency (g kg-1)W = transpiration equivalent (g kPa kg-1)D = atmospheric saturation deficit (kPa)WLG = water limited growthUpot = potential transpiration (maximum uptake by roots)
Materials and methods10
Root distribution and water absorptionRoots tend to adopt a distribution that exponentially reduces with depth. This is similar to the inverse squareroot function used by Monteith et al., (1989). BAMnut calculates a total root length from the root biomassusing a specific root length factor, RLfactor. Root density is calculated as an exponential function of depth.
Before dealing with the actual water uptake, the potential water uptake must be known to determinewhether growth is light limited or water limited. The water uptake by roots can then be calculated from theactual growth rate.
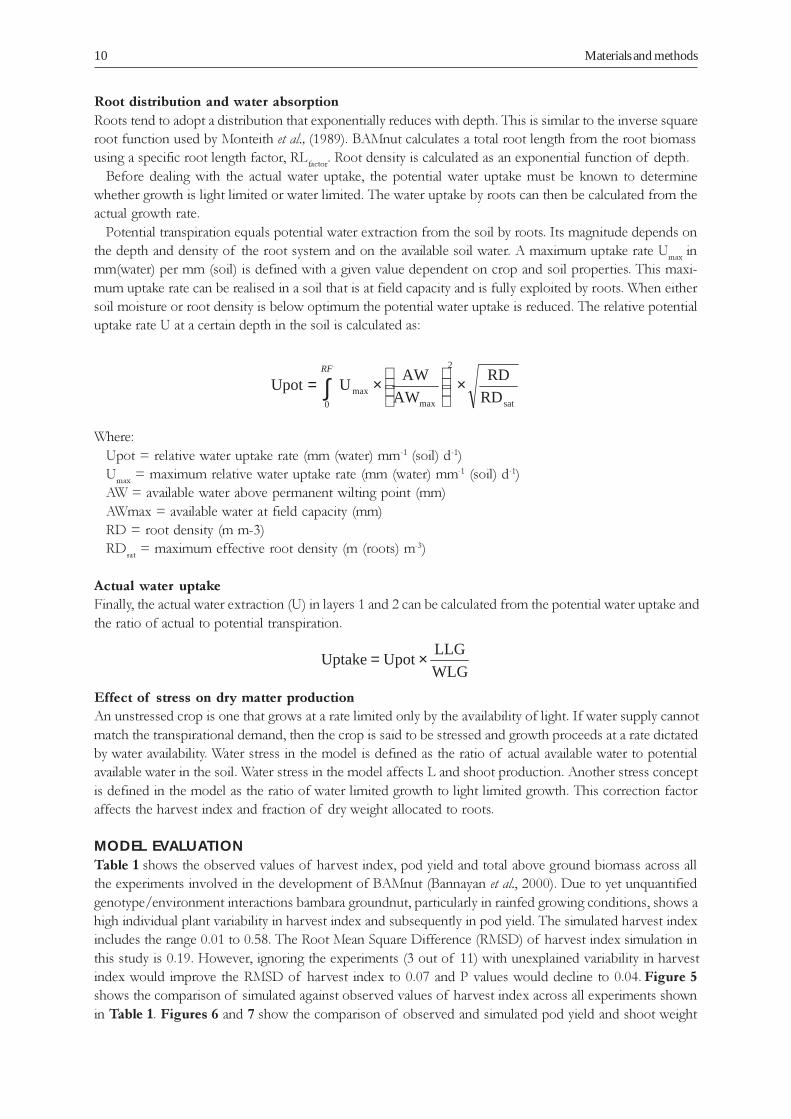
Potential transpiration equals potential water extraction from the soil by roots. Its magnitude depends onthe depth and density of the root system and on the available soil water. A maximum uptake rate Umax inmm(water) per mm (soil) is defined with a given value dependent on crop and soil properties. This maxi-mum uptake rate can be realised in a soil that is at field capacity and is fully exploited by roots. When eithersoil moisture or root density is below optimum the potential water uptake is reduced. The relative potentialuptake rate U at a certain depth in the soil is calculated as:
sat
2
maxmax
0 RD
RD
AW
AWUUpot ×
×= ∫
RF
Where:Upot = relative water uptake rate (mm (water) mm-1 (soil) d-1)Umax = maximum relative water uptake rate (mm (water) mm-1 (soil) d-1)AW = available water above permanent wilting point (mm)AWmax = available water at field capacity (mm)RD = root density (m m-3)RDsat = maximum effective root density (m (roots) m-3)
Actual water uptakeFinally, the actual water extraction (U) in layers 1 and 2 can be calculated from the potential water uptake andthe ratio of actual to potential transpiration.
WLG
LLGUpotUptake ×=
Effect of stress on dry matter productionAn unstressed crop is one that grows at a rate limited only by the availability of light. If water supply cannotmatch the transpirational demand, then the crop is said to be stressed and growth proceeds at a rate dictatedby water availability. Water stress in the model is defined as the ratio of actual available water to potentialavailable water in the soil. Water stress in the model affects L and shoot production. Another stress conceptis defined in the model as the ratio of water limited growth to light limited growth. This correction factoraffects the harvest index and fraction of dry weight allocated to roots.
MODEL EVALUATIONTable 1 shows the observed values of harvest index, pod yield and total above ground biomass across allthe experiments involved in the development of BAMnut (Bannayan et al., 2000). Due to yet unquantifiedgenotype/environment interactions bambara groundnut, particularly in rainfed growing conditions, shows ahigh individual plant variability in harvest index and subsequently in pod yield. The simulated harvest indexincludes the range 0.01 to 0.58. The Root Mean Square Difference (RMSD) of harvest index simulation inthis study is 0.19. However, ignoring the experiments (3 out of 11) with unexplained variability in harvestindex would improve the RMSD of harvest index to 0.07 and P values would decline to 0.04. Figure 5shows the comparison of simulated against observed values of harvest index across all experiments shownin Table 1. Figures 6 and 7 show the comparison of observed and simulated pod yield and shoot weight

A global mapping system for bambara groundnut production 11
TABLE 1
Shoot biomass, pod yield and harvest index of bambara groundnut across all experiments used in thedevelopment of the BAMnut model (Bannayan et al., 2000)
Site Landrace Irrigated / Rainfed Shoot biomass Pod yield Harvest
(g m-2) (g m-2) index
Tanzania DodR Rainfed 279 55.6 0.20
Tanzania DodR Rainfed 215 29.7 0.14
Tanzania DodR Rainfed 61 2.4 0.04
Tanzania DodR Rainfed 144.6 35.9 0.13
Tanzania DodR Rainfed 121.2 47.4 0.39
Tanzania DodR Rainfed 78.8 5.4 0.05
Tanzania DodR Rainfed 192.5 77.8 0.17
Tanzania DodR Irrigated 575.3 332.9 0.19
Nottingham DodR Irrigated 535.8 284.4 0.53
Nottingham DodR Irrigated 661.6 310.9 0.46
Nottingham DodR Rainfed 118 3.8 0.03
Nottingham DodR Rainfed 111.9 0.3 0.0
Nottingham DipC Irrigated 761.9 443.4 0.58
Nottingham DipC Irrigated 565.3 274.8 0.48
Nottingham DipC Rainfed 105.4 12.4 0.12
Nottingham DipC Rainfed 156.9 18.4 0.12
respectively. The model is able to simulate pod yield and shoot weight with reasonable accuracy, withRMSD of 23.9 and 180.7 g m-2 respectively. However, it is expected that with more experiments thatexamine crop partitioning during the reproductive stage and close monitoring of soil water, there is scopeto substantially improve model simulation in all aspect of growth.
INCORPORATING BAMnut INTO A GISAgronomic models are traditionally used for point or site-specific applications. This is often because oflimitations in data availability and computer technologies. Most process-based models have examined tem-poral variation using point data from specific sites and, again, provide outputs that are site specific. Becauseagriculture is a spatial activity, there is growing interest in placing site specific information into spatial andlong-term perspectives. GIS facilitates the storage, manipulation, analysis and visualisation of spatial data(Hartkamp et al., 1999). Therefore linking GIS with agronomic crop models is attractive because it permitsthe simultaneous examination of spatial and temporal phenomena. Spatial visualisation of the results frommodels significantly enhances our understanding and interpretation of simulation results (Engle et al., 1997)and provides an opportunity for complex spatial analyses of the model results (Campbell et al., 1989;Stoorvogel, 1995). By analysing the spatial patterns of simulated yield there is an opportunity to improveproduction estimates and highlight vulnerable areas, for example those that are prone to drought (Carboneet al., 1996). However, the major drawback with such work is the limited availability of input climate and soildata that precludes the use of the more sophisticated simulation models.
Model adaptations for GIS integrationTo integrate BAMnut into a Geographical Information System (GIS) it was first necessary to select andevaluate the data required as inputs to the model. Two important limitations were placed in this study to savecosts. First, only already digitised or computer ready data could be used for the analysis and, second, the datahad to be comparable world-wide.
Materials and methods12
Note: The relatively poor fit of the model (Figures 5, 6 and 7) illustrates the difficulties involved in modelling an underutilisedcrop for which there is little supporting data. Future studies will aim at identifying and modelling the causes of the variabilitywhich are likely to be genetic, i.e. within and between landrace variation.
A global mapping system for bambara groundnut production 13
To adapt the model for this study it is assumed that the crop does not begin to grow until the accumulatedrainfall from the first day of the year is more than 10mm. Another assumption is that frost killing of thecrop would occur at 10 °C, i.e. total absence of the crop in the areas where this temperature may occur.Unlike many major crops for which experimental evidence is available, the above assumptions on bambaragroundnut growth were based on subjective interpretation and similar experimental evidence for pearlmillet a crop which grows in agro-ecological zones that are typical for bambara groundnut. In thisstudy, the phenological characteristics of the Tanzanian bambara groundnut landrace Dodoma Red wereused for model development. Therefore, total crop duration is assumed to be equivalent to a thermal timeof 1900 °Cd.
Geographic Information Systems (GIS)According to the GIS dictionary, maintained by the Association for Geographic Information (AGI), and theWeb page of Edinburgh University Department of Geography (www.geo.ed.ac.uk/agidict/welcome.html),a GIS is a computer system for capturing, storing, checking, integrating, manipulating, analysing and display-ing data related to positions on the Earths surface. Typically, a GIS is used for handling maps of one kindor another. These might be represented as several different layers where each layer holds data about aparticular feature. Each feature is linked to a position on the graphical image of a map.
Layers of data are organised to be studied and to perform statistical analyses. Uses are primarily govern-ment related, e.g. town planning, local authority and public utility management, environmental, resourcemanagement, engineering, business, marketing and distribution.
GIS portrays the real world. A view of the world as depicted on a map surface reveals that the surfaceconsists of either points, lines or polygons. Thus roads would be lines, houses are usually points, and gardensor fields polygons. In a GIS there are two basic methods which the computer may use to store and displayspatial data - vectors or rasters. These methods differ in the manner by which spatial data are stored andrepresented. FAOs Environment and Natural Resources Service of the Sustainable Development Depart-ment (SDRN) (www.fao.org/sd/eidirect/gis/chap3.htm) provide useful comparisons of vector and rastersystems in summary form.
Analytical scope, reporting and visualisationOne of the powerful features of GIS packages is that statistical summaries of layers/coverages, modelstages or outcomes can easily be obtained. Statistical data can include area, perimeter and other quantitativeestimates, including reports of variance and comparisons among images. A further powerful analytical toolthat aids understanding of outcomes is visualisation of outcomes through graphical representation in theform of 2D and 3D maps. For example, entire landscapes and watersheds can be viewed in three dimen-sions, which is very valuable in terms of evaluating spatial impacts of alternative decisions. Also, techniqueshave been developed to integrate GIS with additional tools such as group support systems, that allowinteractive scenario development and evaluation and support communication among stakeholders via alocal area network (LAN) (e.g. Faber et al., 1997). Currently, there is also rapid development and deploymentof Internet-enabled GIS tools, that allows a wider community of decision-makers to have instant access tospatial data. All of these tools are constantly being added to GIS packages and can be of great value.
INPUTS TO BAMnut MODEL – WEATHER DATA
Weather has a major influence on a wide range of biological processes including agricultural production.The weather data often needed in relation to crop growth and yield include rainfall, maximum and mini-mum temperature, solar radiation, some measure of atmospheric humidity and wind. However, daily recordsthat include all these elements are rare or are of insufficient duration for desired applications. In particular, inmany regions of the world, distances between meteorological stations mean that it is difficult to assess thelikely weather conditions at intermediate locations. Therefore, weather generator programs that are able to

Materials and methods14
generate long series of weather records from limited existing data are useful. BAMnut requires daily weatherdata. However, these data are not available across the world. To solve this problem, a daily data weathergenerator (Matthews and Stephens, 1996) was used. Stochastic weather generators (Richardson, 1981; Genget al., 1986; Hutchinson, 1991; Racsko et al., 1991) can use historical weather data from a site to provide dailysequences of the main weather parameters that are statistically similar to the observed data from which theywere derived. This approach can then be used to provide weather inputs for crop growth models (Bannayanand Crout, 1999).
ADAPTATIONS TO WEATHER GENERATORIn this study, the Turbo Pascal version of the weather data generator developed by Matthews and Stephens(1996) was adapted in Visual Pascal to generate the required daily weather data (Figure 8).
The observed climate data from the University of East Anglia Climate Research Unit (CRU)(www.cru.uea.ac.uk/) available through the Intergovernmental Panel on Climate Change (IPCC) Data Dis-tribution (http://ipcc-ddc.cru.uea.ac.uk/cru_data/examine/have_index.html) was found to be the mostcomprehensive world climate data available and provided the main inputs to the weather generator. Datafrom the CRU included mean monthly climate data for global land areas, excluding Antarctica, for theperiod 1961-1990. The mean 1961-1990 climatology of seven variables were selected as inputs for themodel developed in this study: Rainfall (mm d-1), Radiation (W m-2), Wet Day Frequency (Days), MaximumTemperature (°C), Minimum Temperature (°C), Vapour Pressure (kPa) and Wind speed (m s-1). For fulldetails of these variables please refer to the Data Description Pages - Climate Baselines - CRU GlobalClimate Dataset (http://ipcc-ddc.cru.uea.ac.uk/cru_data/examine/cru_climate.html). The procedure toimport these files into Arc/Info (GIS software) is presented in the Appendix.
Based on the format of the Observed Climate Download files (http://ipcc-ddc.cru.uea.ac.uk/cru_data/datadownload/observed/climatology_download.html), the world is represented on a map in rectangular

A global mapping system for bambara groundnut production 15
form as a GIS raster comprising 720 columns and 360 rows. Each raster cell has a resolution of 0.5º latitudeby 0.5º longitude i.e. equivalent to 50 km x 50 km at the equator.
Based on the number of columns and rows, the total number of raster cells that comprise a single climatemap are 259,200 i.e. 720 x 360 cells. Of these, 62,482 cells correspond to the land areas and the rest (196,718cells) to missing values in the climate data (Antarctica, oceans and major inland water bodies).
Since most of the study was based on the CRU data, the cell size and geographic projection of one ofthese parameters was chosen as the base map to standardise map extensions. Thus, all map outputs derivedfrom the model, have the same CRU map extensions.
Data inputs and outputs for the weather generator are based on the CRU climate map extensions. CRUclimate data in ASCII form were downloaded, imported, converted to raster form and prepared usingUNIX Arc/Info GRID i.e. the raster module of Arc/Info. Once prepared, the data were reconverted toASCII form (see Appendix for details). The prepared ASCII data reside in a single directory in a PC. Theadapted weather generator is able to create data by user-defined coordinates by defining the latitude andlongitude values for the top left and bottom right corners of the desired area. For example, the settings foran area comprising the United Republic of Tanzania and adjacent land areas, would be top left latitude 0,longitude 28, and bottom right latitude -12, longitude 41. Computer memory problems were encountereddue to the number of files that the generator had to create (i.e. 62,482). However, because the modelcomprised user-defined coordinates, the desired results were obtained by splitting the world into 30 sec-tions.
The weather generator only processed those rasters that represented land areas. Missing values in theclimate data (Antarctica, oceans and major inland water bodies) that were assigned integer values of 9999were not processed and thus retained their original value. For each raster containing a single monthly climatevalue, the generator creates a file with 365 daily weather records. Each record is automatically labelled withan ID (e.g. 90001) that corresponds to its geographical location in the CRU map, and each contains dailydata on solar radiation (SRAD), maximum temperature (TMAX), minimum temperature (TMIN), rainfall(RAIN), evapotranspiration (EVAP), vapour pressure (MNVP), windspeed (WIND) and CO2 ( ACO2) (seeAppendix). As an example, Figure 9 shows the comparison of one year simulated weather data for SuttonBonington in the UK with observed weather data at that site, for radiation, minimum and maximumtemperature and rainfall. The general pattern of both generated and observed data is similar.

Materials and methods16
A global mapping system for bambara groundnut production 17
Chapter 2
Results and discussion
OUTPUTS FROM BAMnut MODEL – CROP BIOMASSAND POD YIELDS
The outputs of multiple simulations of the model for both biomass and pod yield have been classified intofour representative ranges of suitability as shown in Table 2. Although these categories are arbitrary, theyhelp to simplify the analyses and provide some basis for comparisons between regions. The levels, definedas very suitable (VS), suitable (S), moderately suitable (MS) and unsuitable (US), are based on reported podyields for bambara groundnut at different locations in Africa. For example, the VS category with pod yieldsgreater than 3000 kg ha-1 corresponds with reported pod yields of up to 3870 kg ha-1 in Zimbabwe(Johnson, 1968). Similarly, the MS category corresponds with the typical farmers yields of 650-850 kg ha-1
in Africa reported by Stanton et al. (1966). Regions producing pod yields below 300 kg ha-1 are defined asunsuitable (category US) for bambara groundnut cultivation. Crop failure has not been included as it obvi-ously has the definition of no yield.
Figures 10 and 11 respectively show the predicted biomass and pod yield of bambara groundnut acrossthe world. The different suitability ranges defined in Table 2 are shown in different colours to indicate thegeographical distributions of each classification.
Figures 10 and 11 show that there is potential for bambara groundnut production in many parts of theworld beyond its current distribution with suitable areas with potential in America, Australia, Europe andAsia as well as Africa. In fact, locations within the Mediterranean region show the highest predicted biomass,often exceeding 8.5 t ha-1.
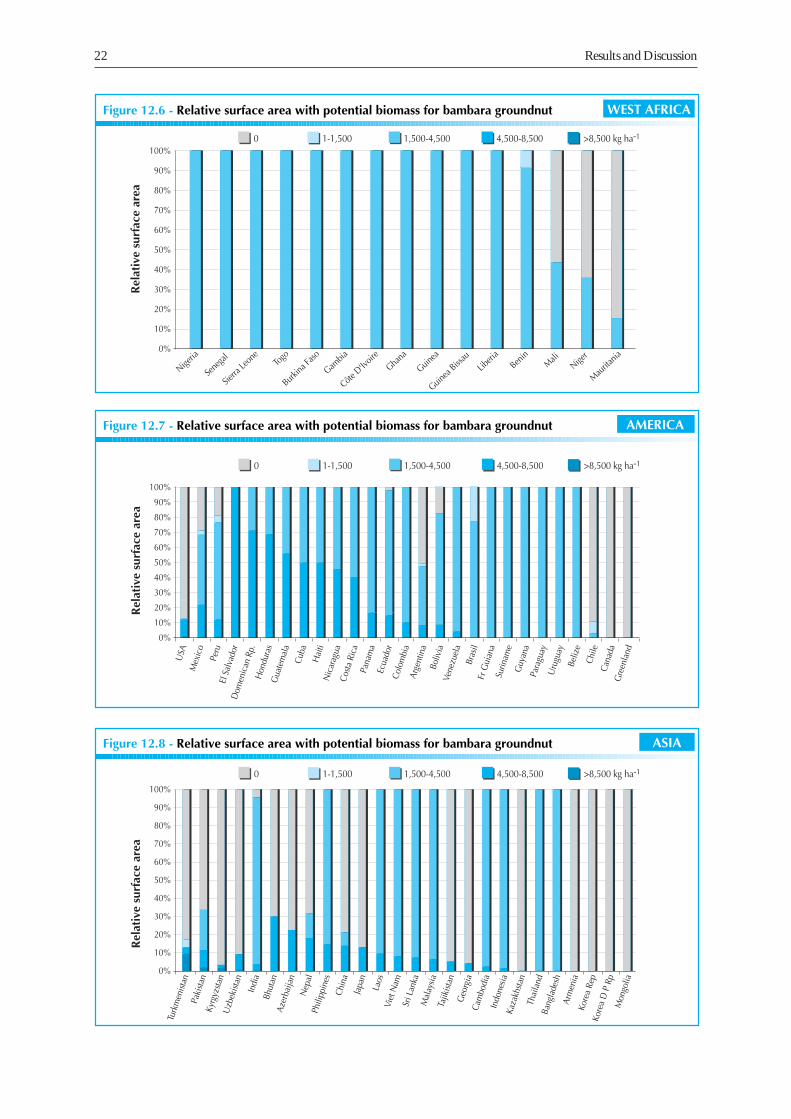
Figures 12.1-12.11 and 13.1-13.11 provide a more detailed analysis of bambara groundnut biomass andpod yield predictions based on continent and country scales. The combination of Figures 10 and 11 asbiomass and pod yield ranges with Figures 12.1-12.11 and 13.1-13.11 as the percentage of suitable arable landsfor major parts of the world provides an integrated assessment of the potential production of this crop.
Figure 12.1 describes the potential biomass production for each continent. Of these, it is interesting tonote that almost 75% of South America and 25% of Asia, two regions of the world not previouslyassociated with bambara groundnut, are classified in the VS, S or MS ranges, i.e. as at least moderatelysuitable for bambara groundnut cultivation. The comparable figure for Africa, where almost all bambaragroundnut is currently grown, is 65%. It is also noteworthy that Europe, which has less than 10% of landthat is classified as at least moderately suitable for cultivation, has the largest proportion (3%) within the VScategory.
TABLE 2Classification of suitability ranges for predicted biomass and pod yield of bambara groundnut
Very suitable Suitable Moderately suitable Unsuitable
(VS) (S) (MS) (US)
Biomass (kg ha-1) >8,500 4,500-8500 1,500-4,500 1-1,500
Pod yield (kg ha-1) >3,000 1,000-3,000 300-1,000 1-300
Note: kg ha-1 refers to pod or biomass per crop and may not be restricted to one crop per year.

Results and Discussion18

A global mapping system for bambara groundnut production 19

Results and Discussion20

A global mapping system for bambara groundnut production 21
Figures 12.2-12.11 provide more detail on the biomass predictions for specific countries within eachregion. Figure 12.2 shows that there is relatively little productive potential for bambara groundnut in Alge-ria, the Libyan Arab Jamahiriya and Egypt. In contrast 43% of Tunisia and 36% of Morocco are within theVS category for potential biomass.
Most areas in Central Africa (Figure 12.3) can be classified as moderately suitable. Although 45% ofareas of Chad and 40% of the Sudan show crop failure, the whole of the Central African Republic can beclassified within at least category MS for cultivation. Predictions indicate that bambara groundnut maybe unproductive in some areas of southern Africa (Figure 12.4). For example all of Lesotho is classifiedas unsuitable. In contrast, more than 90% of Botswana, more than 57% of South Africa and nearly 70%of Namibia are classified within at least category MS. All of Swaziland falls within the S and MS categoriesof suitability.
Figure 12.5 shows that, with the exception of Djibouti, all of East Africa is classified within categories Sand MS for biomass production of bambara groundnut. Virtually the whole of West Africa (Figure 12.6)is classified within category MS. Surprisingly, there are no countries in this region that are within the VS or Scategories. Nevertheless, complete crop failure is unlikely.
Results and Discussion22

A global mapping system for bambara groundnut production 23
Despite its historical absence from this part of the world, a general assessment of the American continent(Figure 12.7) shows that there are many areas in this region that have high potential biomass productivityfor bambara groundnut. In all countries in South America, with the exception of Argentina, more than 75%of the land area is within the S and MS categories of suitability. In contrast, 87% of the USA is classified asunsuitable for cultivation.
Within Asia (Figure 12.8), all of India, the Lao Peoples Democratic Republic, Philippines, Viet Nam, SriLanka, Malaysia, Cambodia, Indonesia, Thailand, and Bangladesh fall within categories S and MS.
Much of the Near East (Figure 12.9) is classified as unsuitable for cultivation of bambara groundnut,mainly because of low rainfall. However, for those countries with a more Mediterranean climate, there arepotentially highly productive areas. For example 100%, 80% and 75% of Cyprus, Israel and Lebanonrespectively fall within category VS of suitability.
The low potential productivity for much of Europe (Figure 12.10) is similar to that of the Near East but,for Europe, it is mainly low temperatures rather than soil moisture deficits that limit growth and develop-ment to only part of the year. However, in the Mediterranean countries of southern Europe there is consid-erable potential for cultivation. For example, 71% of Portugal, 60% of Greece, 57% of Spain and 49% ofItaly are within categories VS and S. Where these appropriate environments are coupled with improvedcultivation techniques there is considerable scope to achieve high yields of bambara groundnut (an indig-enous African legume) within countries of the European Union.
Similarly, in Australia and Oceania (Figure 12.11) there are significant areas that are classified as moder-ately suitable for bambara groundnut cultivation. For example 62% of Australia is within categories Sand MS.
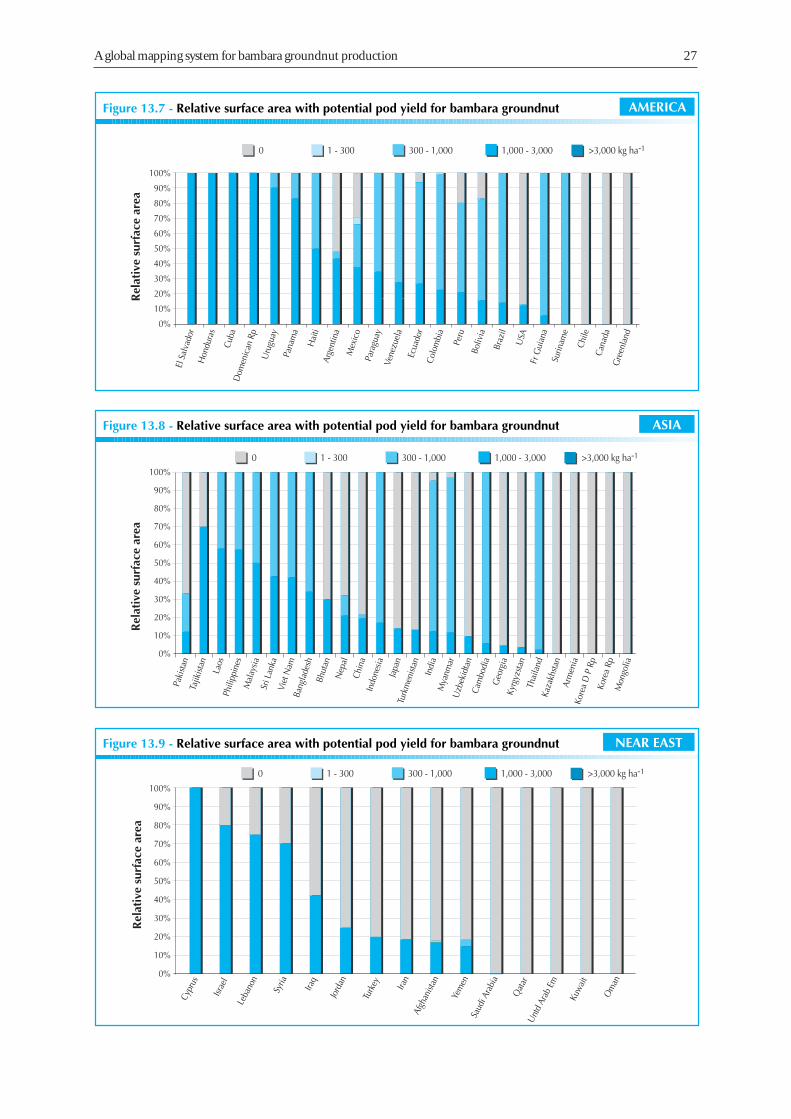
Figures 13.1-13.11 provide the pod yields that correspond to the total biomass predictions in Figure 11.With the exception of Europe (6.5%), at least 10% of the land area of each continental region (Figure 13.1)can provide bambara groundnut pod yields within category S (1000-3000 kg ha-1). As much as 30% ofAfrica falls within this category.
Within Africa (Figures 13.2-13.6) the largest potential yields occur in South, East and Central Africa. Forexample, 100% of Swaziland, 98% of Uganda, 95% of Zambia, 89% of Burundi, 84% of Zimbabwe and79% of the Central African Republic have yield predictions within category S.
For America, (Figure 13.7) all of El Salvador, Honduras, Cuba and the Dominican Republic fall withincategory S for pod yield. Countries such as Uruguay, Panama, Haiti, Paraguay, Venezuela and Ecuador haveland areas that are entirely within categories S or MS.
Within Asia (Figure 13.8), all of the Lao Peoples Democratic Republic, Malaysia, the Philippines,Sri Lanka, Viet Nam, Bangladesh, Indonesia, Cambodia and Thailand fall within categories S and MS.However, the country with the largest proportion of its area in category S is Tajikistan with more than 70%in category S.
In the Near East (Figure 13.9), all of Cyprus, 80% of Israel, 75% of Lebanon and 70% of the SyrianArab Republic are within category S.
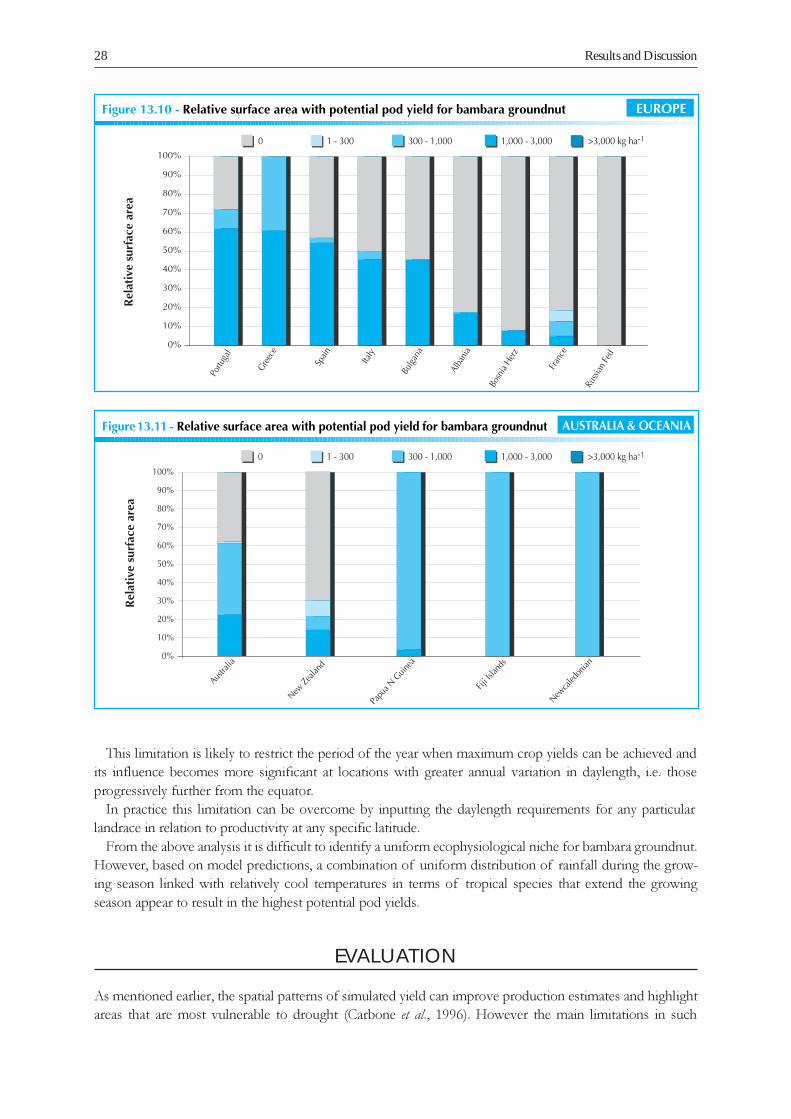
For Europe (Figure 13.10), Portugal, Greece, Spain and Italy have the greatest productive potential forbambara groundnut, with as much as 62% of Portugal in category S and more than 50% of the land area ineach country within categories S and MS. There is even a small potential for bambara groundnut in Francewith over 12% of land area in categories S and MS.
Australia (Figure 13.11) has 60% of its land area within categories S and MS.At this stage it is important to note the following limitations to the above analysis of potential pod
yields in bambara groundnut. First, the methodology takes no account of specific soil types. Althoughthe model requires inputs that depend on the physical characteristics of soil e.g. available water, there isno attempt to assess productivity in terms of soil classification for contrasting locations. Second, there isno allowance for the effects of pests and diseases on the capture and conversion of environmental re-sources and allocation to pod yield. Third, many bambara groundnut landraces have a specific daylengthrequirement for pod filling, i.e. allocation to yield will only begin at a particular daylength. In assessingpotential productivity at each location, this daylength requirement has not been included.

Results and Discussion24

A global mapping system for bambara groundnut production 25

Results and Discussion26
A global mapping system for bambara groundnut production 27
Results and Discussion28
This limitation is likely to restrict the period of the year when maximum crop yields can be achieved andits influence becomes more significant at locations with greater annual variation in daylength, i.e. thoseprogressively further from the equator.
In practice this limitation can be overcome by inputting the daylength requirements for any particularlandrace in relation to productivity at any specific latitude.
From the above analysis it is difficult to identify a uniform ecophysiological niche for bambara groundnut.However, based on model predictions, a combination of uniform distribution of rainfall during the grow-ing season linked with relatively cool temperatures in terms of tropical species that extend the growingseason appear to result in the highest potential pod yields.
EVALUATION
As mentioned earlier, the spatial patterns of simulated yield can improve production estimates and highlightareas that are most vulnerable to drought (Carbone et al., 1996). However the main limitations in such

A global mapping system for bambara groundnut production 29
analyses are not only the limited availability of climate and soils data, which preclude the use of the moresophisticated simulation models, but also the lack of observed or reported crop yields. This problem iscommon to all underutilised crops where a common system of yield reporting and evaluation is lacking. Itis therefore extremely difficult to verify predicted yields of underutilised crops against reliable figures foractual on-farm yields achieved at similar locations. Moreover, predictions in this study are simply based onagro-ecological potential and ignore the effects of management. In some cases the actual yields are based onfarmers fields (unreliable and unreplicated) and in others on experiments with management inputs. Thus, atthis stage, it was not possible to construct a comprehensive comparison between predicted and reportedfigures.
Based on the above and on the scarcity of data available, Table 3 shows a simple comparison betweenpredicted and reported pod yield values.
TABLE 3
Comparison between predicted and reported pod yield values (kg ha-1)
Area Predicted Reported
min max mean SD range author
Africa 134 2765 1277 544 500 Heller et al (1997)
300-800 Begemann (1988)
650-850 Stanton et al (1966)
Tanzania 612 1557 1082 216 650-850 Rachie (1979)
Zimbabwe 843 1567 1199 175 3870 max. Johnson (1968)

A global mapping system for bambara groundnut production 31
Conclusions
INTERPRETATION OF BAMBARA GROUNDNUTPOTENTIAL PRODUCTION
This study only used data that are comparable across the world. This approach limited the number ofimportant factors that could have been used in the evaluation (e.g. soil data), but it enabled comparisons tobe made between countries based on consistent climate data. More importantly, this methodology enablescrop experimentation and improvement to be planned and executed by evaluating the similarities and needswithin and between countries and regions. To this end, the primary objectives of this study have beenachieved. The methodology provides both an assessment of the productive potential of regions such asAfrica, where the crop is widely grown but where quantitative evidence is scant, incomplete or inaccessible,and defines new regions not previously associated with bambara groundnut but where environmental fac-tors indicate a potential for productive growth.
Much of the Mediterranean basin appears to provide the ideal agro-ecological environment for bambaragroundnut with predicted biomass exceeding that in regions of sub-Saharan Africa that have been associ-ated with the crop for centuries. Nevertheless, there remains considerable scope within its current distribu-tion to increase bambara groundnut productivity by a clearer understanding of how factors such as theseasonal distribution of rainfall, daylength and range of temperatures influence the allocation of assimilatesto pod yield. Ultimately, it is the expansion of production and consumption patterns for crops such asbambara groundnut both within and beyond their current areas of cultivation that will determine whetherthey become significant crops for the world or disappear.
In relation to underutilised crops, one of the major concerns of sponsors is the possibility that effort iswasted on species of unknown potential in locations of unknown suitability. At this stage, our preliminaryassessment allows planners to select promising locations, countries or regions that justify more detailedstudies that bring local factors into the analysis and taking advantage of data of higher resolutions.
Primarily because of the world-scale used and the resolution and the assumptions employed, the estimatesof bambara groundnut potential generated in this study are essentially indicative of bambara groundnutpotential. Clearly, as with any crop, not all of the areas that has been identified as having potential can beallocated to bambara groundnut cultivation as some of these are already occupied by protected areas, inlandwater bodies, buildings and roads.
Our analysis of the spatial productivity of bambara groundnut demonstrates how a weather data genera-tor and a dynamic crop simulation model can be usefully linked in a GIS on a global scale. This integrationallows an examination of spatially complex, non-linear, interacting environmental variables and their com-bined influences on crop yield. Consideration of the spatial variability of model inputs has at least twopotential benefits. First, where site-specific information on particular crops is lacking as with mostunderutilised species this approach allows us to produce a reasonable assessment of likely productivitywith minimal field data. Second, for all crops this approach allows us to assess the potential consequences offuture climatic variability and change on agricultural production.
The major drawback with such activities is the paucity of input data. Generally, the availability of digitalsoil data is more limited than meteorological data. To build digital soils data is an expensive and time-consuming process (Reed and Whistler, 1990). At this stage, we have not applied soils data mainly becauseof their inaccessibility and processing requirements. The inclusion of soil information to explain local varia-tions in crop yields is an important future objective. Another major limitation is that the model takes noaccount of the effects of pests and diseases on the likely yields of bambara groundnut at any particularlocations. This is a major limitation that needs to be considered in any future developments.

Conclusions32
Our crop model is still some way short of a being a generic and comparative model for underutilisedcrops. This is mainly because there are insufficient datasets available for any other underutilised species.However, the basic modelling strategy developed for bambara groundnut can be rapidly adapted to anyother underutilised (or major) crop if suitable collaborators can be identified. Ideally, co-operation betweengrowers, experimenters and modellers interested in a representative range of species would provide suffi-cient critical mass to test and refine the approach that we have taken for a single species. The output fromsuch collaboration could result in a user-friendly package to benefit all interested partners with minimumcost and maximum speed. In particular, such activities that generate reliable and widespread information onunderutilised species could be of greatest benefit to developing countries, where most of these speciesoriginate and grow.
STUDY REFINEMENTS
The analytical system applied in this study consists of three main components; a weather data generator, acrop model, and GIS. The first two components can be continuously enhanced whenever more data areavailable. The updating of weather and crop data would enable us to review and refine the simulationapproaches built into them. In particular, the limited datasets available in the development of the BAMnutmodel, especially for application across the world, are of most concern.
The strong effects of soil conditions, in particular water releases characteristics, on crop growth anddevelopment mean that better information on soil conditions as well as climate data and specific croprequirements is a priority for the future. It is also appropriate to identify those areas where soils are eitherhighly productive or impoverished to establish likely yield limitations and potential yield ceilings within anyspecific agro-ecological environment. FAOs agro-ecological zoning (AEZ) methodology developed byFAO and the International Institute for Applied System Analysis (IIASA) already does this (www.fao.org/ag/agl/agll/aez.htm) and this methodology could usefully be applied in the future.
Many of the results presented in this study will help develop an interactive online information and map-ping system for bambara groundnut that WAICENT has already begun to construct. The first phase of theWeb site is finished and involved preparing and verifying the bambara groundnut collection by Begemann(www.dainet.de/genres/bambara/index.htm). For the second component a map for Africa was preparedshowing 705 collection sites as points from which the user can click and retrieve data from Begemannsdatabase. Then, five different thematic maps i.e. annual rainfall, climate, dominant soils, and topography forAfrica were prepared that the user can select and view along with the collection sites. The next phaseinvolves the map modelling exercise, so that the resulting maps from this study can be incorporated into theWeb site. Furthermore, to make the GIS version of BAMnut constructed in this study accessible, it isintended to include this model in the Web site so that users will be able to create, online, different mapoutputs according to their chosen BAMnut model variables and, ultimately, for other underutilised crops.
The GIS version of BAMnut could be integrated into a Web-based Common Modelling Environment(CME) developed by Texas A & M University. The goal of the CME is to package a suite of models suchas ASM, FLIPSIM, PHYGROW, EPIC, SWAT, APEX and NUTBALL into a unified environment thatcontains a matrix of mission-critical data files. These files would support policy-makers exploration ofalternatives and emerging technology options. A detailed description of the CME is available at http://cnrit.tamu.edu/CME/. Collaborative work with the CNRIT team that is developing the CME has beenestablished and preparations for adapting and testing the GIS version of BAMnut are currently underway.
As information and expertise on bambara groundnut expands, the user will be able to input landrace-specific information that will provide estimates of likely productivity and best management practices for thecultivation of local bambara groundnut genotypes at particular locations. The development of a widergeneric methodology will provide comparative estimates of productivity for contrasting underutilised(and major) species at any location.
A global mapping system for bambara groundnut production 33
FUTURE APPLICATIONS
Evaluation of the BAMnut model across the world and its subsequent development into a generic frame-work for other underutilised crops is an activity that requires an international effort. However, for allunderutilised crops, any realistic effort to expand their cultivation and establish improved genotypes forspecific environments must be based on identifying those regions that are most likely to match their physi-ological requirements. To maximise the use of research effort the mapping exercise described in this reportshould be an essential pre-requisite to field-based research or breeding efforts on crops such as bambaragroundnut. Subsequent field studies can serve the dual purpose of accelerating progress on each particularcrop with less risk of crop failure and an improvement in the accuracy of the global mapping technique.
The widespread access of the methodology and outputs presented here to end-users and policy-makerswill allow future developments to be demand-led by those most interested in the use of this information. Inparticular, comparison of the simulated yields of underutilised crops with existing yield maps for majorcrops will enable decision-makers to prioritise crop and cropping systems in terms of farmers needs andnational benefits.
Finally, the approach described in this report is a first attempt to map the potential areas of cultivation ofone underutilised food legume across the globe. However, the approach has wider implications in terms offood security and poverty elimination. Rather than consuming specific crops, people eat a range of agricul-tural products that provide nutritional compounds including proteins, carbohydrates and lipids. Thus, adevelopment of the mapping strategy described here is that it enables the production of nutritional mapswhereby the relative food values of different species could be assessed for individual countries or regions. Inthis way, policy-makers can utilise evidence of the likely yield and nutritional value of different species todesign food security strategies based on the most appropriate crops to grow within each region.
A global mapping system for bambara groundnut production 35
Appendix
This appendix provides full and detailed description of the database and the methodology used in thisstudy.
HARDWARE AND SOFTWARE
HardwareAlmost the entire GIS analyses were carried out using a Sun Spark Station 10.
The weather generator and BAMnut programs were run on a Pentium III DELL OptiPlex GX1 PC, 1.2GB, 130,488 KB RAM 17 inch Video Super VGA.
Data transfers between the Sun Spark Station and the Pentium PC were carried out under MicrosoftWindows NT.
SoftwareA Geographic Information System (ARC, Version 7.03, ESRI, Redlands, CA, USA) which has both rasterand vector capabilities was used. This system is able to efficiently store geographical referenced databasewhich includes both digital maps and their attribute files.
The weather generator and BAMnut were written in Visual Pascal. BAMnut should be run on at least a486PC with 8MB of RAM with Windows 95 as the operating system.
WORLD WEATHER DATABASE
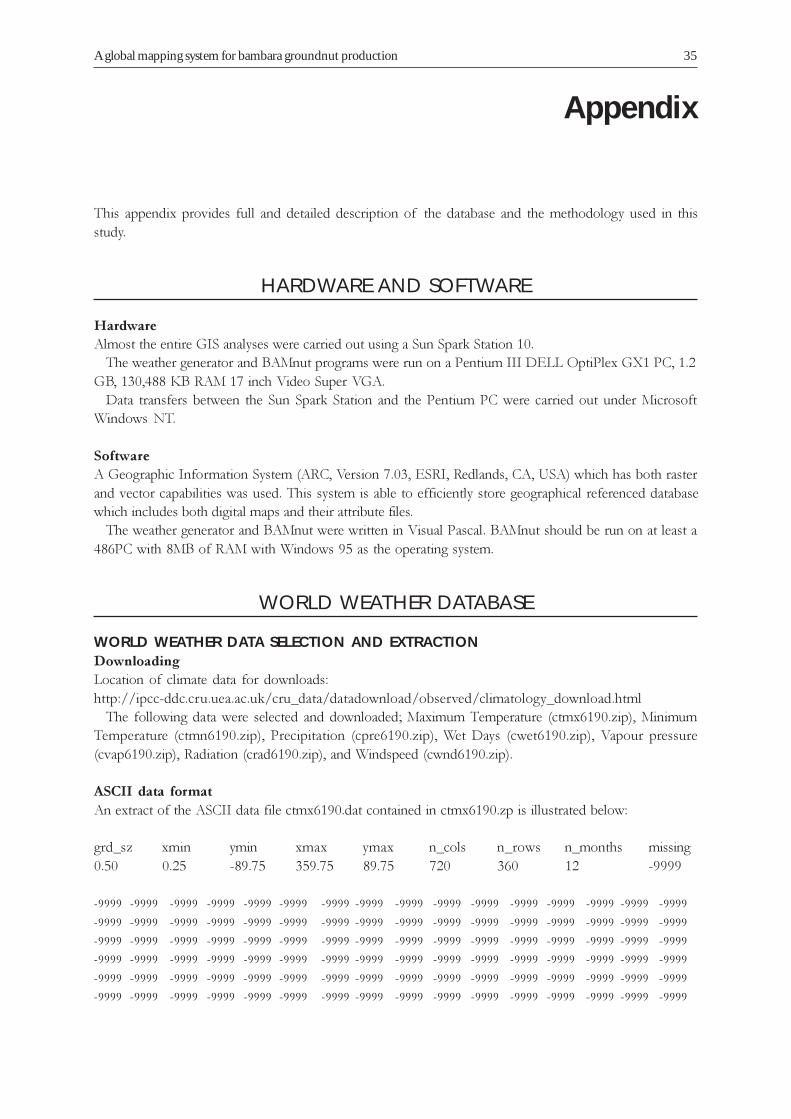
WORLD WEATHER DATA SELECTION AND EXTRACTIONDownloadingLocation of climate data for downloads:http://ipcc-ddc.cru.uea.ac.uk/cru_data/datadownload/observed/climatology_download.html
The following data were selected and downloaded; Maximum Temperature (ctmx6190.zip), MinimumTemperature (ctmn6190.zip), Precipitation (cpre6190.zip), Wet Days (cwet6190.zip), Vapour pressure(cvap6190.zip), Radiation (crad6190.zip), and Windspeed (cwnd6190.zip).
ASCII data formatAn extract of the ASCII data file ctmx6190.dat contained in ctmx6190.zp is illustrated below:
grd_sz xmin ymin xmax ymax n_cols n_rows n_months missing0.50 0.25 -89.75 359.75 89.75 720 360 12 -9999
-9999 -9999 -9999 -9999 -9999 -9999 -9999 -9999 -9999 -9999 -9999 -9999 -9999 -9999 -9999 -9999
-9999 -9999 -9999 -9999 -9999 -9999 -9999 -9999 -9999 -9999 -9999 -9999 -9999 -9999 -9999 -9999
-9999 -9999 -9999 -9999 -9999 -9999 -9999 -9999 -9999 -9999 -9999 -9999 -9999 -9999 -9999 -9999
-9999 -9999 -9999 -9999 -9999 -9999 -9999 -9999 -9999 -9999 -9999 -9999 -9999 -9999 -9999 -9999
-9999 -9999 -9999 -9999 -9999 -9999 -9999 -9999 -9999 -9999 -9999 -9999 -9999 -9999 -9999 -9999
-9999 -9999 -9999 -9999 -9999 -9999 -9999 -9999 -9999 -9999 -9999 -9999 -9999 -9999 -9999 -9999

Appendix36
Separating data by monthEach zipped file (e.g. ctmn6190.zip) contains 12 monthly ASCII files, so it was necessary to separate thesefiles by month. Due to the very large size of each file (i.e. 259,200 records) the separation of these files wasdone using software. Once files were separated they were saved into individual files.
The header for each monthly ascii filencols 720nrows 360xllcorner -180.0yllcorner -90.0cellsize 0.5NODATA_value -9999.0
Correcting shiftThe data downloaded presented a shift at zero latitude, so a shift adjustment had to be made to all the filesand this was done automatically using Java software.
STANDARDISING THE DATABASEAdjusting to Potential Evapotranspiration (PET) data from the International Institute forApplied Systems Analysis (IIASA)The observed climate data from the University of East Anglia Climate Research Unit (CRU) data wasfound to be the most comprehensive and complete climate data available, however, while displaying thisdata using Java it was realised that a large number of islands not displayed in the CRU data visualisation pagewere present (i.e. http://ipcc-ddc.cru.uea.ac.uk/cru_data/visualisation/visual_index.html). To solve thisproblem, adjustments were made according to PET data from IIASA for the following two reasons; (a)PET data could be used as an input to the model of the present study because it was based on CRU data,and (b) the islands displayed in the PET data were identical to the CRU data visualisation page. The adjust-ments made are described below:
Converting text files from DOS to UNIXThe following example illustrates how one of the text files was converted from DOS to UNIX using Arc/Info software:
Grid: asciigrid ctmx6190_0.dat ctmx6190_0.txt
Where:asciigrid = Arc/Info commandctmx6190_0.dat = ASCII file for maximum temperature for the month of January in DOS formatctmx6190_0.txt = ASCII file for maximum temperature for the month of January in UNIX format.
Converting data from ASCII to a GRIDThe following example illustrates how one of the files was copied and converted into a grid using Arc/Infosoftware:
Grid: asciigrid ctmx6190_0.txt ctmx6190_0
Where:asciigrid = Arc/Info ASCII to grid conversion commandctmx6190_0.txt = ASCII file for maximum temperature for the month of Januaryctmx6190_0 resulting grid.

A global mapping system for bambara groundnut production 37
Base gridA grid was used as a template to standardise grid extensions. The cell size and geographical project of PETfor the month of January was chosen as the base grid. A description of the base grid is illustrated below:
The base gridDescription of GRID /sun1 disk4/faogis4/jippe/dem/petjan
Cell Size = 0.500 Data Type: IntegerNumber of Rows = 360 Number of Values = 289Number of Columns = 720 Attribute Data (bytes) = 8
Boundary StatisticsXmin = -180.000 Minimum Value = 0.000Xmax = 180.000 Maximum Value = 288.000Ymin = -90.000 Mean = 63.706Ymax = 90.000 Standard Deviation = 70.197
Coordinate System DescriptionProjection GEOGRAPHIC
Units DD Spheriod CLARKE1866
Based on the number of rows and columns defined above, the base grid had a total of grid cells (i.e. 360 x720 = 259,200). The number of pixels for the global land areas alone was 62,482. Data originally stored inASCII format or having a different resolution or projection were converted to the base grid. Example:
Grid: setwindow petjanGrid: setmask petjanGrid: setcell petjanGrid: tmx6190_0 = ctmx6190_0
Where:setwindow, setmask and setcell are Arc/Info commandspetjan = PET grid for the month of Januaryctmx6190_0 = maximum temperature for the month of Januarytmx6190_0 = output grid.
SUMMARY STATISTICS OF CLIMATE DATA USED AS INPUTS TO BAMNUTTables 4, 5, 6 and 7 show statistics of the mean monthly climate datasets for global land areas used in thisstudy as inputs to the model BAMnut developed.
A comparison of climate values between the original CRU data and the adjusted CRU data (i.e. CRU dataset to the exact PET format from IIASA) showed no significant differences amongst data, the largestdifference was of 0.4 when comparing the mean value of minimum temperature for the month of January.
WORLD WEATHER GENERATOR
SETTINGS CREATED AS ENTRIES FOR THE DAILY DATA WEATHER GENERATORTable 8 shows the settings that were made for the weather generator. Each folder corresponds to one areaof the world, the number of files created from each area and their size in Mb is also shown. Computermemory problems were encountered due to the vast amount of files that the generator had to create, so theinformation in Table 8 is based on trial-and-error meaning that it is information that should be used to

Appendix38
TABLE 4Statistics of mean monthly air temperature values for global land areas
Month Maximum temperature Minimum temperature
(oC) (oC)
MIN MAX MEAN SD MIN MAX MEAN SDJanuary -48.6 40.3 3.58 22.81 -56.0 26.5 -7.66 22.00February -44.3 39.2 5.00 22.33 -54.2 26.0 -6.65 21.79March -39.9 40.5 8.83 20.11 -56.3 25.9 -3.33 20.10April -32.9 41.9 13.80 16.79 -45.2 26.8 1.66 16.50May -18.6 43.3 18.40 13.39 -34.7 28.5 6.57 12.35June -7.8 44.7 21.97 10.70 -24.6 29.2 10.19 9.68July -5.1 45.6 23.68 9.39 -21.6 31.0 12.05 8.67August -7.0 44.8 22.76 9.93 -28.5 30.2 11.19 9.21September -15.4 42.3 19.53 12.14 -41.4 28.5 8.18 11.23October -26.7 39.3 14.42 15.93 -44.4 26.9 3.77 14.37November -38.5 40.1 8.57 19.85 -53.0 26.0 -2.29 18.76December -45.7 40.9 4.74 21.96 -53.6 26.4 -6.01 20.78
TABLE 5Statistics of mean monthly precipitation and wet days values for global land areas
Month Rainfall Wet days
(mm d-1) (Days)
MIN MAX MEAN SD MIN MAX MEAN SD
January 0 21.9 1.71 2.42 0 30.5 10.51 7.15February 0 19.5 1.74 2.48 0 27.8 9.36 6.14March 0 19.1 1.75 2.39 0 30.6 9.72 6.19April 0 19.8 1.75 2.22 0 29.8 8.99 5.39May 0 21.4 1.80 2.22 0 29.8 9.38 5.44June 0 37 2.12 2.57 0 29 9.70 5.64July 0 40.1 2.35 2.69 0 30.9 10.34 5.82August 0 39.2 2.31 2.57 0 30.9 10.42 5.83September 0 38.7 2.05 2.28 0 28.8 9.97 5.68October 0 32.7 1.80 2.08 0 27.8 10.25 6.13November 0 26 1.76 2.15 0 28.9 10.37 6.58December 0 20.8 1.71 2.31 0 29.8 10.62 7.03
TABLE 6Statistics of mean monthly vapour pressure and radiation values for global land areas
Month Vapour pressure Radiation
(hPa) (W m-2)
MIN MAX MEAN SD MIN MAX MEAN SD
January 0.1 31.1 7.77 8.96 0 294 89.49 77.79February 0.1 32 8.01 9.06 0 268 104.78 72.34March 0.1 31.5 8.61 8.90 16 262 129.33 58.09April 0.1 32 9.53 8.60 59 286 159.31 41.47May 0.1 34.6 10.86 8.05 33 307 181.00 42.11June 0.1 35.8 12.62 7.40 22 335 190.09 48.61July 0.1 35.6 14.14 7.16 25 332 186.70 46.79August 0.1 34.2 13.83 7.39 42 308 166.79 47.95September 0.1 35.4 12.08 7.83 18 268 140.56 60.07October 0.1 32.3 10.16 8.2 0 282 114.61 72.79November 0.1 31.8 8.72 8.55 0 290 95.04 79.18December 0.1 31.5 7.96 8.77 0 301 85.78 79.78

A global mapping system for bambara groundnut production 39
TABLE 7
Statistics of mean monthly wind speed values for global land areas
Month Wind speed
(m s-1)
MIN MAX MEAN SD
January 0.1 14.3 3.16 1.52February 0.2 14.3 3.19 1.46March -2.8 14.2 3.28 1.36April -6.1 14.1 3.38 1.34May -7.4 14.2 3.31 1.26June -7.2 24.4 3.21 1.29July -8.6 28.9 3.15 1.35August -7.4 29 3.13 1.39September -7.1 24.4 3.18 1.41October -4.7 19.8 3.26 1.47November -2.2 14.2 3.23 1.52December -1 14.3 3.15 1.49
TABLE 8Settings for weather generator
Top left Bottom right Technical notes
Folder no. Lat. Long. Lat. Long. No. Files Size Mb
1 90 0 75 180 505 9.272 75 0 65 180 4410 84.23 65 0 60 180 3581 68.34 60 0 50 180 5706 9.265 50 0 40 180 5283 1006 40 0 30 180 4453 857 30 0 20 180 4560 87.18 20 0 10 180 2968 56.59 10 0 0 180 2250 42.710 0 0 -10 180 1881 35.611 -10 0 -30 180 4210 80.312 -30 0 -60 180 1225 2313 -60 0 -90 180 0 014 90 -180 85 0 0 015 85 -180 83 0 28 0.5516 83 -180 75 -90 305 5.4317 83 -90 75 0 0 018 75 -180 65 -90 1945 36.919 75 -90 65 0 0 020 65 -180 60 0 2100 39.821 60 -180 50 0 3054 58.222 50 -180 40 0 2599 49.423 40 -180 30 0 2125 40.324 30 -180 20 0 1302 24.525 20 -180 10 0 1173 2226 10 -180 0 0 1292 24.327 0 -180 -10 0 1738 32.928 -10 -180 -30 0 2534 48.229 -30 -180 -60 0 1255 23.630 -60 -180 -90 0 0 0
62,482
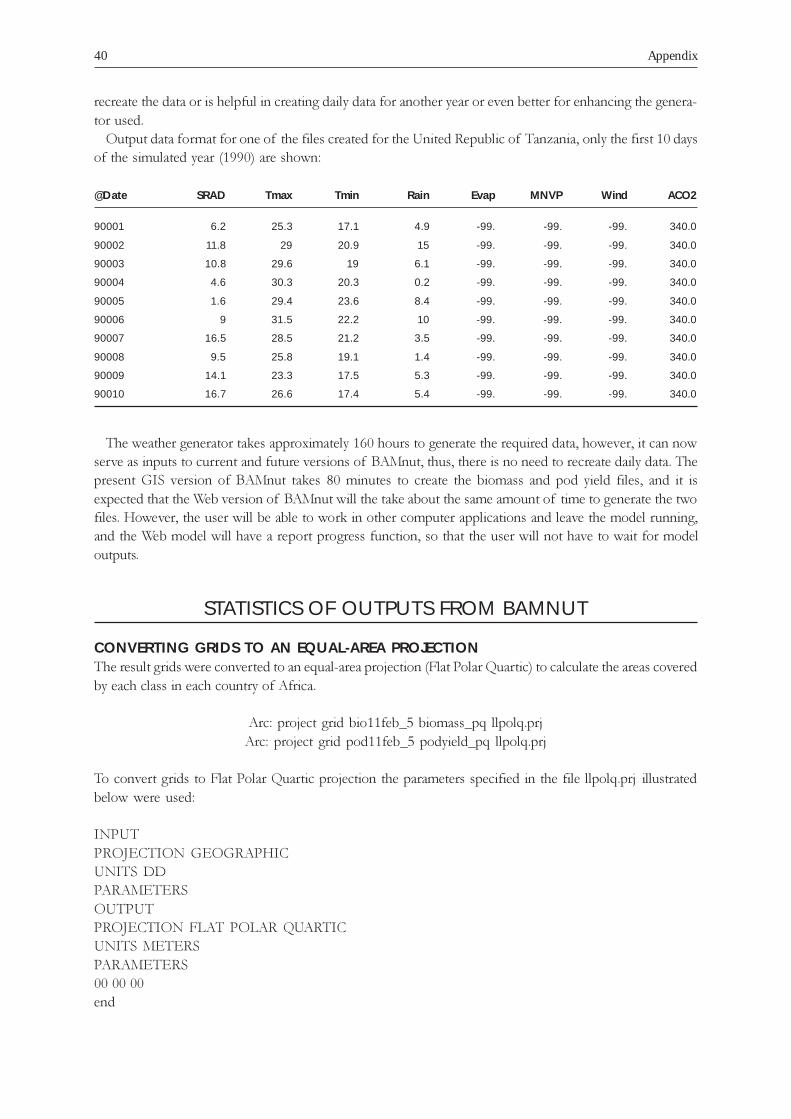
Appendix40
recreate the data or is helpful in creating daily data for another year or even better for enhancing the genera-tor used.
Output data format for one of the files created for the United Republic of Tanzania, only the first 10 daysof the simulated year (1990) are shown:
@Date SRAD Tmax Tmin Rain Evap MNVP Wind ACO2
90001 6.2 25.3 17.1 4.9 -99. -99. -99. 340.0
90002 11.8 29 20.9 15 -99. -99. -99. 340.0
90003 10.8 29.6 19 6.1 -99. -99. -99. 340.0
90004 4.6 30.3 20.3 0.2 -99. -99. -99. 340.0
90005 1.6 29.4 23.6 8.4 -99. -99. -99. 340.0
90006 9 31.5 22.2 10 -99. -99. -99. 340.0
90007 16.5 28.5 21.2 3.5 -99. -99. -99. 340.0
90008 9.5 25.8 19.1 1.4 -99. -99. -99. 340.0
90009 14.1 23.3 17.5 5.3 -99. -99. -99. 340.0
90010 16.7 26.6 17.4 5.4 -99. -99. -99. 340.0
The weather generator takes approximately 160 hours to generate the required data, however, it can nowserve as inputs to current and future versions of BAMnut, thus, there is no need to recreate daily data. Thepresent GIS version of BAMnut takes 80 minutes to create the biomass and pod yield files, and it isexpected that the Web version of BAMnut will the take about the same amount of time to generate the twofiles. However, the user will be able to work in other computer applications and leave the model running,and the Web model will have a report progress function, so that the user will not have to wait for modeloutputs.
STATISTICS OF OUTPUTS FROM BAMNUT
CONVERTING GRIDS TO AN EQUAL-AREA PROJECTIONThe result grids were converted to an equal-area projection (Flat Polar Quartic) to calculate the areas coveredby each class in each country of Africa.
Arc: project grid bio11feb_5 biomass_pq llpolq.prjArc: project grid pod11feb_5 podyield_pq llpolq.prj
To convert grids to Flat Polar Quartic projection the parameters specified in the file llpolq.prj illustratedbelow were used:
INPUTPROJECTION GEOGRAPHICUNITS DDPARAMETERSOUTPUTPROJECTION FLAT POLAR QUARTICUNITS METERSPARAMETERS00 00 00end

A global mapping system for bambara groundnut production 41
ADJUSTING AND STANDARDISING THE PROJECTIONAfter the biomass and pod yield maps had been converted to a polar quartic projection, they presented adistortion in the projection when displayed. To solve this problem a polar quartic projection mask (namedtemplpolq) was used:
Arc: describe templpolq
Description of Grid templpolqCell Size = 9250.000 Data Type: IntegerNumber of Rows = 1827 Number of Values = 1Number of Columns = 4057 Attribute Data (bytes) = 8
Boundary StatisticsXmin = -18761636.000 Minimum Value = 1.000Xmax = 18765614.000 Maximum Value = 1.000Ymin = -8445739.000 Mean = 1.000Ymax = 8454011.000 Standard Deviation = 0.000
Coordinate System DescriptionProjection FLAT_POLAR_QUARTICUnits METERS Spheroid SPHEREParameters:Longitude of projection centre 0 0 0.000
Procedures for projection adjustment using a mask:
Grid: setmask templpolqGrid: biomass_pq2 = biomass_pq
Grid: setmask templpolqGrid: podyield_pq2 = podyield_pq
Converting a world coverage to a gridThe coverage WFSCOV, which contains the country boundaries (i.e. areas) was converted to a GRID:
Arc: polygrid wfscov wfscov_grd cntcode
Where:polygrid = GRID commandwfscov = coveragewfscov_grd = output gridcntcode, coverage item containing to country boundary names.
The cell size was set to an equal area projection cell size of 59311.282.
Combining gridsThe GRID wfscov_grd was overlaid on the biomass and pod yield maps in order to produce the statisticsby country.
Grid: biomass_stat = combine(wfscov_grd, biomass_pq2)Grid: podyield_stat = combine(wfscov_grd, podyield_pq2)

Appendix42
Where:biomass_stat and podyield_stat = output gridscombine = GRID commandwfscov_grd = world grid in flat polar quartic projectionbiomass_pq2 and podyield_pq2 = biomass and pod yield grids in flat polar quartic projection.
Creating the text files using Arc/Info INFOBiomass
ENTER COMMAND >SEL BIOMASS_STAT.VATENTER COMMAND >OUTPUT ../BIOMASS_STAT.TXTENTER COMMAND >DISPLAY COUNT,,,WFSCOV_GRD,,,BIOMASS_PQ2 PRINTENTER COMMAND > Q STOP
Pod YieldENTER COMMAND >SEL PODYIELD_STAT.VATENTER COMMAND >OUTPUT ../PODYIELD_STAT.TXTENTER COMMAND >DISPLAY COUNT,,,WFSCOV_GRD,,,PODYIELD_PQ2 PRINTENTER COMMAND > Q STOP
Converting text files from UNIX to DOSThe following example illustrates how one of the text files was converted from UNIX to DOS using Arc/Info software:
Grid: gridascii biomass_stat.txt biomass_stat.dat
Where:gridascii = Arc/Info commandbiomass_stat.txt = biomass file in UNIXbiomass_stat.dat = resulting biomass file in DOS format.
Manipulating text files in EXCELa. The text files were imported into EXCELb. To calculate the areas of each class occurring in the countries, the number of cells (COUNT) was multi-
plied by the square of the cell size in kilometres (59.30642 x 59.30642).c. Percentage areas were calculated from each suitability class for each country.
For example: 59.30642 x 59.30642 = 3517.251
Suitability Count Cell Count Sum Percentageclass size x cell size2 155 3517.251 545174 622553.5 87.572 22 3517.251 77379.53 622553.5 12.42
d. Results were plotted using histograms.
GRID OUTPUTS
The procedures used to create the map compositions for the maps presented in this study are illustratedbelow using the biomass grid as an example:

A global mapping system for bambara groundnut production 43
Standardising the grid to a common colour rangeFor purposes of analysis and/or illustration, the biomass grid had to be reclassified to a common colourrange.
biomass_5 = reclass (biomass, bio11feb_5.rem)
Where:biomass_5 = reclassified grid filereclass = GRID function to reclassify (or change) integer values of the input cells using a remap table on
a cell-by-cell basis within the analysis windowbiomass = original water requirement gridbiomass_5.rem = remap table.
The remap table biomass_5.rem is shown below:0 0 : 11-1,500: 21,500-4,500: 34,500-8,500: 4>8,500 : 5
AML to plot the gridThe AML, biomass.aml illustrated below was used in ARCPLOT to generate a map composition for thebiomass grid:
killmap biomass_mcmape biomasspagesize 11.7 8.3map biomass_mclinesymbol 5box 0.1 0.1 11.6 8.2mapposition cen censhadeset BAMnut.shdgridnodatasymbol whitegrids biomasslinecolor blackarcs/sun1disk1/faogistemp/ctry25mtextset fonttextsymbol 1textsize 0.18keyarea 0.6 1 10.7 1.23keybox 0.15 0.1keyseparation .13 .14keyshade biomass.leg
POSTSCRIPT FILESThe maps which are presented in this study were converted to eps (i.e. postscript format). The followingexample illustrates how the biomass grid (map) was converted into and eps file:
gissw2-faogis>> setenv CANVASCOLOR WHITEArcplot: &r biomass.aml

Appendix44
Arcplot: display 1040Arcplot: biomass.graArcplot: plot biomass_mc box 0.1 0.1 11.6 8.2Arc: postscript biomass.gra biomass.eps
where:setenv CANVASCOLOR WHITE = sets the background colour to white&r biomas.aml = automates the map composition of the griddisplay 1040 = command used to save the map compositionbiomass.gra = graphics fileplot biomass_mc box 0.1 0.1 11.6 8.2 = map composition which was reduced to suit the size required
for publicationpostscript = ARC command used to create the postscript file.

A global mapping system for bambara groundnut production 45
References
Azam-Ali, S.N., Crout, N.M.J. & Bradley, R.G. 1994. Some perspectives in modelling resource capture by crops. Proceedings
of 52nd Easter School in Agricultural Science, Sutton Bonington, UK.Babiker, A.M. 1989. Growth, dry matter and yield of bambara groundnut (Vigna subterranea L. Verdc) under irrigated and
drought conditions. University of Nottingham, UK. (M.Sc. thesis)
Bannayan, M. & Crout, N.M.J. 1999. A stochastic modelling approach for real time forecasting of winter wheat yield. FieldCrops Research, 62: 85-95.
Bannayan, M., Collinson, S.T. & Azam-Ali, S.N. 2000. BAMnut model user guide. University of Nottingham. School of
Biological Sciences. Division of Agriculture and Horticulture. 43 pp.Begemann, F. 1988. Ecogeographic differentiation of bambara groundnut (Vigna subterranea) in the collection of the
International Institute of Tropical Agriculture (IITA). Giessen, Wissenschaftlicher Fachverlag.
Berchie, J.N. 1996. Light use and dry matter production of bambara groundnut landraces in relation to soil moisture. Universityof Nottingham. UK. (M.Sc. thesis)
Brough, S.H. & Azam-Ali, S.N. 1992. The effect of soil moisture on the proximate composition of bambara groundnut
(Vigna subterranea L. Verdc). Journal of the Science of Food and Agriculture, 60: 197-203.Campbell, W.G., Church, M.R., Bishop, G.D., Mortenson, D.C. & Pierson, S.M. 1989. The role for a geographic
information system in a large environment project. International Journal of Geographical Information Systems,3(4):349-362.
Carbone, G.J., Narumalani, S. & King, M. 1996. Application of remote sensing and GIS technologies with physiologicalcrop models. Photogramm. Eng. Remote Sens., 62:171-179.
Collinson, S.T., Summerfield, R.J., Ellis, R.H. & Roberts, E.H. 1993. Durations of the photoperiod-sensitive andphotoperiod-insensitive phases of development to flowering in four cultivars of soybean (Glycine max (L.) Merril). Annalsof Botany, 71: 389-394.
Collinson, S.T., Azam-Ali, S.N., Chavula, K.M., & Hodson, D. 1996. Growth, development, and yield of bambaragroundnut (Vigna subterranea L. Verdc) in response to soil moisture. Journal of Agricultural Science (Cambridge),126: 307-318.
Collinson, S.T., Clawson, E.J., Azam-Ali, S.N. & Black, C.R. 1997. Effects of soil moisture on the water relations of bambaragroundnut. Journal of Experimental Botany, 48: 877-884.
Collinson, S.T., Berchie, J. & Azam-Ali, S.N. 1999. The effect of soil moisture on light interception and the conversion
coefficient for three landraces of bambara groundnut (Vigna subterranea). Journal of Agricultural Science (Cambridge),133: 151-157.
Collinson, S.T., Sibuga, K.P., Tarimo, A.J.P. & Azam-Ali, S.N. 2000. Influence of sowing date on the growth and yield of
bambara groundnut landraces in Tanzania. Experimental Agriculture, 36, 1-13.Coudert, M.J. 1982. Market openings in West Africa for cowpeas and bambara groundnuts. International Trade Technology,
X, 147-241.
Engle, T., Hoogenboom, G., Jones, J.W. & Wilkens, P.W. 1997. AEGIS/WIN: A computer program for the application ofcrop simulation models across geographical areas. Agronomy Journal, 89:919-928.
Faber, B.G., Wallace, W.W., Croteau, K., Thomas, V.L. & Small, L.R. 1997. Active response GIS: an architecture for
interactive resource modelling. Proceedings of the GIS ’97 Annual Symposium on Geographical Information Systems,Vancouver, B.C.
FAO. 1998. A strategic assessment of fish farming potential in Africa. CIFA Technical Paper No. 32. Rome, FAO. 170 pp.
www.fao.org/docrep/W8522e/W8522E00.htmGallagher, J.N. & P.V. Biscoe. 1978. Radiation absorption, growth and yield of cereals. Journal of Agricultural Science
(Cambridge), 91: 47-60.

References46
Geng, Shu , Penning de Vries, F.W.T. & Supit, I. 1986. A simple method for generating daily rainfall data. Agricultural andForest Meteorology, 36, 363-376.
Goudriaan, J. & van Laar, H.H. 1994. Modelling crop growth processes. Textbook with exercises. Kulwer Academic Publishers,Dodrecht, the Netherlands. 274 pp.
Hartkamp, A.D., White, J.W, & Hoogenboom, G. 1999. Interfacing geographic information systems with agronomicmodelling: a review. Agronomy Journal, 91: 761-772.
Heller, J., Begemann,F., & Mushonga, J. (Eds). 1997. Bambara groundnut. Vigna subterranea (L.) Verdc. Promoting the
conservation and use of underutilised and neglected crops. 9. Proceedings of the Workshop on Conservation andImprovement of Bambara Groundnut (Vigna subterranea (L.) Verdc.), 14-16 November 1995, Harare, Zimbabwe.Institute of Plant Genetics and Crop Plant Research, Gatersleben/Department of Research & Specialist Services, Harare/
International Plant Genetic Resources Institute, Rome, Italy. 166 pp.Hutchinson, M.F. 1991. Climatic analysis in data sparse regions. In Muchow, R.C. and Bellamy, J.A., eds. Climatic risk in
crop production: models and measurement for the semiarid tropics and arid subtropics, p. 55-73. Wallingford, CAB International.
Johnson, D.T. 1968. The bambara groundnut, a review. Rhodesia Agricultural Journal, 65, 1-4.Karikari, S.K., Sebolai, B. & Munthali, D.C. 1996. Field studies of bambara groundnut in Botswana. Proceedings of
International Bambara Groundnut Symposium, p. 71-84. University of Nottingham, UK.
Kocabas, Z., Craigon, J. & Azam-Ali, S.N. 1999. The germination response of bambara groundnut (Vigna subterranea L.Verdc) to temperature. Seed Science and Technology, 27: 303-313.
Linnemann, A.R. 1990. Cultivation of bambara groundnut (Vigna subterranea L. Verdc) in Western province, Zambia. Report
of a field study. Tropical Crops Communication No. 16. Department of Tropical Crop Science. Wageningen AgriculturalUniversity.
Matthews, R.B. & Stephen, W. 1996. CUPPA TEA, tea crop growth model. User manual. 64 pp.
Monteith, J.L. 1996. The quest for balance in crop modelling. Agronomy Journal, 88: 695-697.Monteith, J.L. 1977. Climate and the efficiency of crop production in Britain. Philosophical Transactions of the Royal Society,
London, B281, p. 277-294.
Monteith, J.L., Huda, A.K.S. & Midya, D. 1989. RESCAP, A resource capture model for sorghum and pearl millet,In modelling the growth and development of sorghum and pearl millet, p. 30-34. Virmani, S.M., Tandon, H.L.S. andAlagarswamy, G. eds. ICRISAT Research Bulletin, 12, Patancheru, India.
Penning de Vries, F.W.T. & Teng, P.S., eds. 1993. Systems approach to agricultural development. Kluwer Academic Publishers,the Netherlands.
Priestley, C.H.B. & Taylor, R.J. 1972. On the assessment of surface heat flux and evaporation using large scale parameters.
Monthly Weather Review, 100: 81-92.Rachie, K.O. 1979. Tropical legumes: resources for the future. National Academy of Sciences, Washington D.C. 331 pp.Racsko, P., Szeidel, L. & Semenov, M.A. 1991. A serial approach to local stochastic weather models. Ecological Modelling, 57,
27-41.Reed, B.C. & Whistler, J.L. 1990. Incorporating the STATSGO soil database into a GIS. GIS World, 3(6):36-40.Richardson, C.W. 1981. Stochastic simulation of daily precipitation, temperature and solar radiation. Water Resources Research,
17, 182-190.Ritchie, J.T. 1972. Model for predicting evaporation from a row crop with incomplete cover. Water Resources Research, 8:
1204-1213.
Sesay, A. & Yarmah, A. 1996. Field studies of bambara groundnut in Sierra Leone. Proceedings of International BambaraGroundnut Symposium, p. 45-60. University of Nottingham, UK.
Sellschope, J.P.F. 1962. Cowpeas, Vigna unguiculata (L.) walp. Field Crop Abstracts, 15: 259-266.
Squire, G.R. 1990. The physiology of tropical crop production. CAB International, Wallingford, UK.Stanton, W.R., Doughty, J., Orraca-Tetteh, R. & Steele, W. (1966). Voandzeia subterranea. In Grain legumes in Africa,
p. 128-133. FAO, Rome.
Stoorvogel, J.J. 1995. Geographic information systems as a tool to explore land characteristics and land use, with reference toCosta Rica. Wageningen Agric. Univ., Wageningen, the Netherlands. (Ph.D thesis)
Uehera, G., & Tsuji, G.Y. 1993. The IBSNAT project. In Systems approach to agricultural development, p. 505-514.
F.W.T. Penning de Vries and P.S. Teng, eds. Kluwer Academic Publishers, the Netherlands.

A global mapping system for bambara groundnut production 47
University of Nottingham. 1997. Proceedings of the International Symposium on Bambara Groundnut, University of
Nottingham, 23-25 July 1996.Zulu, D. 1989. Germination and establishment of bambara groundnut (Vigna subterranea L. Verdc) and groundnut (Arachis
hypogaea) in response to temperature, moisture, sowing depth and seed size. University of Nottingham, UK. (M.Sc. thesis)