ground-water monitoring plan and baseline data for the
TRANSCRIPT

Ground-Water Monitoring Planand Baseline Data
for the Devils Lake Outlet Channel
ByW. M. Schuh
North Dakota State Water Commission Bismarck, North Dakota
SWC Project No. 416-1January 2007

Ground-Water Monitoring Planand Baseline Data
for the Devils Lake Outlet Channel
ByW. M. Schuh
North Dakota State Water Commission Bismarck, North Dakota
SWC Project No. 416-1January 2007
Table of Contents
Page
Introduction ...................................................................................................................1
Implementation .............................................................................................................2
Initial Piezometric Data: Ground-Water Flow ..........................................................4
Baseline Water Chemistry ............................................................................................8
Ground Water .....................................................................................................8
Outlet Channel Water (Static Water) ................................................................8
Devils Lake (West Bay) Water Chemistry ........................................................9
Indicators of Potential Channel Leakage .......................................................10
Additional Monitoring Points ...........................................................................13
Monitoring Plan and Recommendations ..................................................................14
Citations .......................................................................................................................14
Appendix.......................................................................................................................15
Draft
1
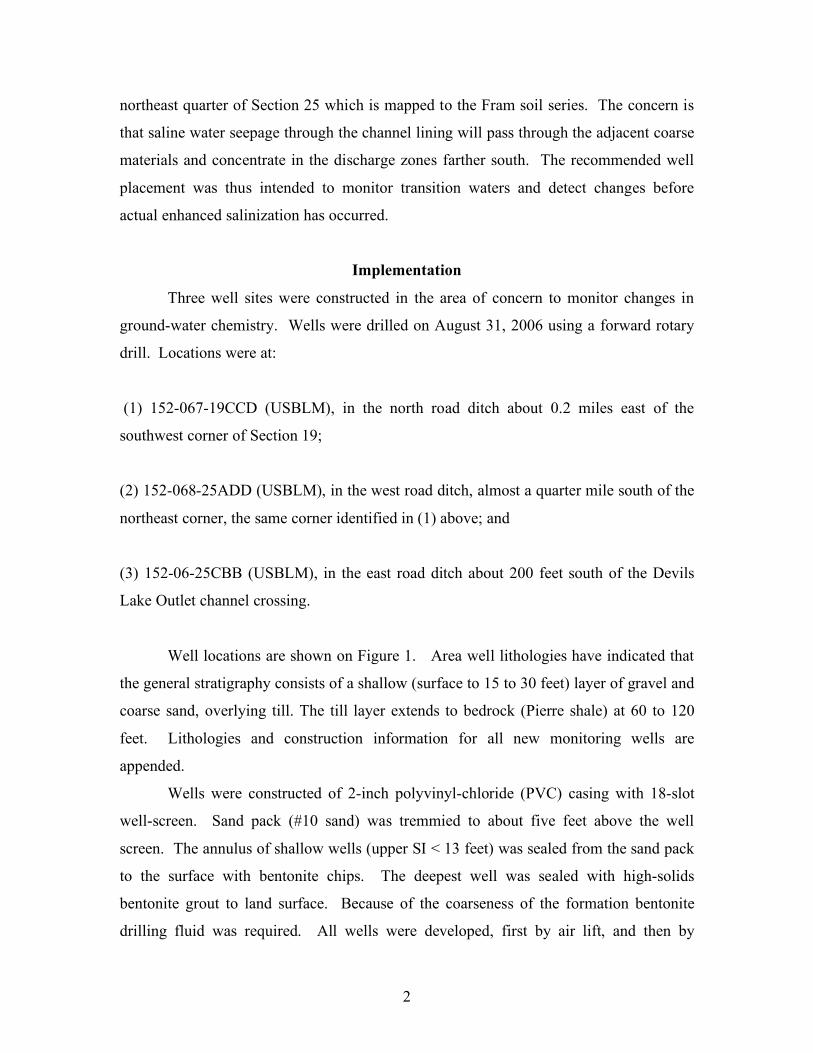
Introduction
In October of 2005 VERIStm transects were measured along the border of the
Devils Lake Outlet channel to measure base-line Soil Electrical Conductivity as an
indicator of soil salinity, and to provide a basis for future comparison of potential
changes in soil salinity during operation of the Devils Lake Outlet. VERIS is a trade
name for a process in which a Wenner Array is employed using disc harrow blades as
electrodes to measure soil electrical conductivity (EC). The measurement implement is
towed behind a pickup truck, with a "real-time" satellite geographical reference
corresponding to EC readings. VERIS measurements were conducted by TOTALCROP
Inc. under the supervision of Western Plains Consulting Inc. (WPC). A report titled "Soil
Classification and Salinity Inventorying Report" was provided by WPC in April of 2006.
One area of concern identified in the report included lands south and southeast of the
open channel immediately downstream of the Outlet transition structure from the pipeline
in 152-067-19 [US Bureau of Land Management nomenclature (USBLM)], shown on
Figure 1. In this area the channel follows the base of the moraine and is elevated over the
land south of the channel. In addition, the surficial materials consist of coarse glacial
outwash (coarse sand to gravel) which formed from glacial meltwaters at the base of the
moraine. These coarse deposits are as deep as 30 feet near the Outlet channel, and
gradually thin southward over a distance of about a mile.
The WPC (2000) report (p. 28) identified, in the hypothetical case of canal liner
failure, potential salinization of "somewhat poorly to poorly drained soils on the fringe
of the somewhat excessively drained to moderately well drained outwash areas." WPC
(2006) recommended that "observation wells...placed in the somewhat excessively
drained to moderately well drained soils near the Outlet...be used to monitor water quality
and water levels" (p. 28). It should be noted that the main concern is not for soil
salinization near the Outlet channel, where water levels in the coarse material are below
10 feet (measured at 16 feet in September 2006). Water tables in these areas are
sufficiently deep to prevent evaporative upflux and concentration of salts. Rather the
concern is for soils having a shallower water table. These are generally located about a
half-mile or more south of the Outlet channel, with the exception of the wetland in the
Draft
2
northeast quarter of Section 25 which is mapped to the Fram soil series. The concern is
that saline water seepage through the channel lining will pass through the adjacent coarse
materials and concentrate in the discharge zones farther south. The recommended well
placement was thus intended to monitor transition waters and detect changes before
actual enhanced salinization has occurred.
Implementation
Three well sites were constructed in the area of concern to monitor changes in
ground-water chemistry. Wells were drilled on August 31, 2006 using a forward rotary
drill. Locations were at:
(1) 152-067-19CCD (USBLM), in the north road ditch about 0.2 miles east of the
southwest corner of Section 19;
(2) 152-068-25ADD (USBLM), in the west road ditch, almost a quarter mile south of the
northeast corner, the same corner identified in (1) above; and
(3) 152-06-25CBB (USBLM), in the east road ditch about 200 feet south of the Devils
Lake Outlet channel crossing.
Well locations are shown on Figure 1. Area well lithologies have indicated that
the general stratigraphy consists of a shallow (surface to 15 to 30 feet) layer of gravel and
coarse sand, overlying till. The till layer extends to bedrock (Pierre shale) at 60 to 120
feet. Lithologies and construction information for all new monitoring wells are
appended.
Wells were constructed of 2-inch polyvinyl-chloride (PVC) casing with 18-slot
well-screen. Sand pack (#10 sand) was tremmied to about five feet above the well
screen. The annulus of shallow wells (upper SI < 13 feet) was sealed from the sand pack
to the surface with bentonite chips. The deepest well was sealed with high-solids
bentonite grout to land surface. Because of the coarseness of the formation bentonite
drilling fluid was required. All wells were developed, first by air lift, and then by

Draft
3
pumping with a screw pump to remove drilling fluid from the formation. Wells were
secured with six-inch PVC protective casing (PC) and locking caps.
Initial water-level measurements were made on September 6 and 7 of 2006.
Water samples for general chemistry and trace elements were collected on September 6,
2006. An additional sample for general chemistry was collected on October 23. Wells
were surveyed on September 12, 2006 according to 1929 Datum, with a cross-reference
measurement for calculating approximate 1988 Datum, using U.S. Survey Feet
Equipment-Trimble 4400 receivers with TSC1 points 37567 to 37578.
Figure 1. Locations of observation wells for the south channel of the
Devils Lake Outlet.
On Site 1 the sand and gravel layer extended to till at 25 feet. The well-screen
was placed at 11 to 21 feet. On Site 2 sand and gravel extended to 30 feet. The initial
water table was at about 16 feet below land surface. A nest of two wells was placed with
screened intervals at 25 to 30 feet (152-068-25ADD for the gravel till boundary) and at
Draft
4
14 to 19 feet (152-068-25ADD2 for the ground-water surface). On Site 3 the sand and
gravel extended to only 14 feet, and the well screen was placed at 8 to 13 feet. Well
construction details and lithologies are appended.
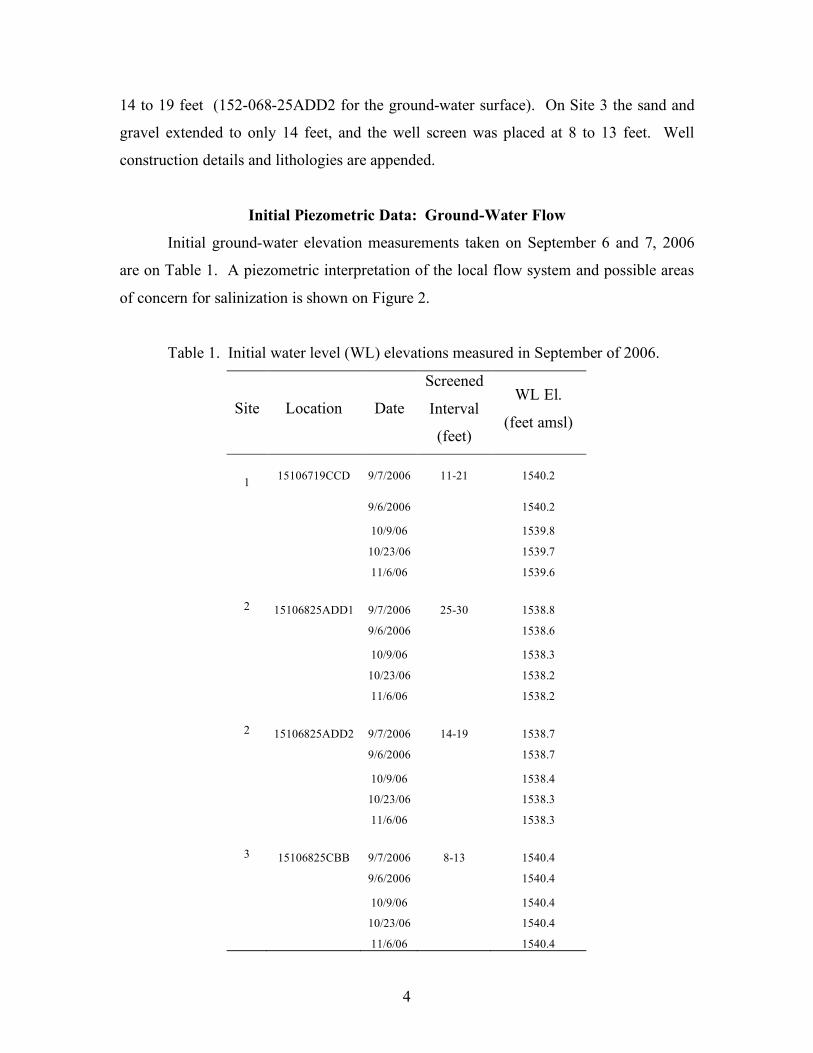
Initial Piezometric Data: Ground-Water Flow
Initial ground-water elevation measurements taken on September 6 and 7, 2006
are on Table 1. A piezometric interpretation of the local flow system and possible areas
of concern for salinization is shown on Figure 2.
Table 1. Initial water level (WL) elevations measured in September of 2006.
Site Location Date
Screened
Interval
(feet)
WL El.
(feet amsl)
1 15106719CCD 9/7/2006 11-21 1540.2
9/6/2006 1540.2 10/9/06 1539.8 10/23/06 1539.7 11/6/06 1539.6
2 15106825ADD1 9/7/2006 25-30 1538.8 9/6/2006 1538.6 10/9/06 1538.3 10/23/06 1538.2 11/6/06 1538.2
2 15106825ADD2 9/7/2006 14-19 1538.7 9/6/2006 1538.7 10/9/06 1538.4 10/23/06 1538.3 11/6/06 1538.3
3 15106825CBB 9/7/2006 8-13 1540.4 9/6/2006 1540.4 10/9/06 1540.4 10/23/06 1540.4 11/6/06 1540.4
Draft
5
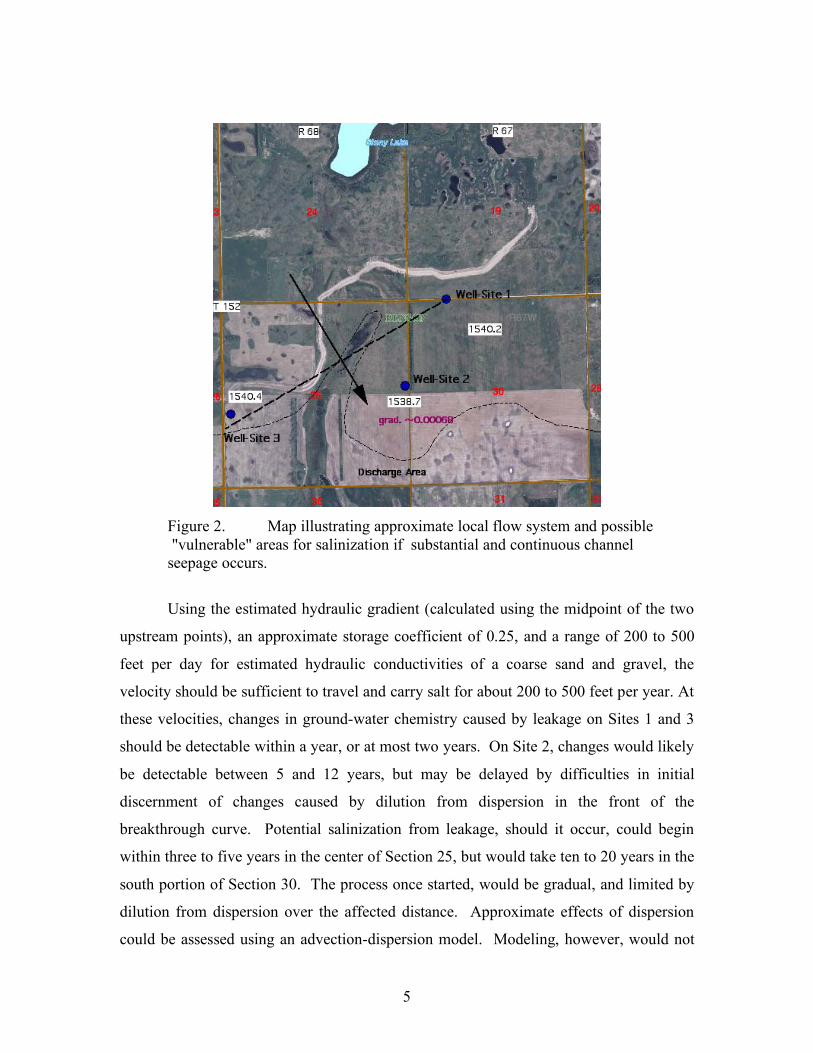
Figure 2. Map illustrating approximate local flow system and possible "vulnerable" areas for salinization if substantial and continuous channel seepage occurs.
Using the estimated hydraulic gradient (calculated using the midpoint of the two
upstream points), an approximate storage coefficient of 0.25, and a range of 200 to 500
feet per day for estimated hydraulic conductivities of a coarse sand and gravel, the
velocity should be sufficient to travel and carry salt for about 200 to 500 feet per year. At
these velocities, changes in ground-water chemistry caused by leakage on Sites 1 and 3
should be detectable within a year, or at most two years. On Site 2, changes would likely
be detectable between 5 and 12 years, but may be delayed by difficulties in initial
discernment of changes caused by dilution from dispersion in the front of the
breakthrough curve. Potential salinization from leakage, should it occur, could begin
within three to five years in the center of Section 25, but would take ten to 20 years in the
south portion of Section 30. The process once started, would be gradual, and limited by
dilution from dispersion over the affected distance. Approximate effects of dispersion
could be assessed using an advection-dispersion model. Modeling, however, would not
Draft
6
be justified unless effects in wells near the Outlet are actually found in measurements.
Soil salinization effects would also be strongly influenced by the nature of leakage if it
occurs. For example, a general and consistent leak along the Outlet channel would have
a much larger effect than local isolated point-source leak.
It should be understood that this initial analysis is based on a single piezometric
measurement, and that flow directions and gradients may change somewhat over time
with changing recharge and discharge due to climatic conditions. They may also be
altered by the operation of the Outlet, depending on the local integrity of the channel
lining. These will be assessed periodically.
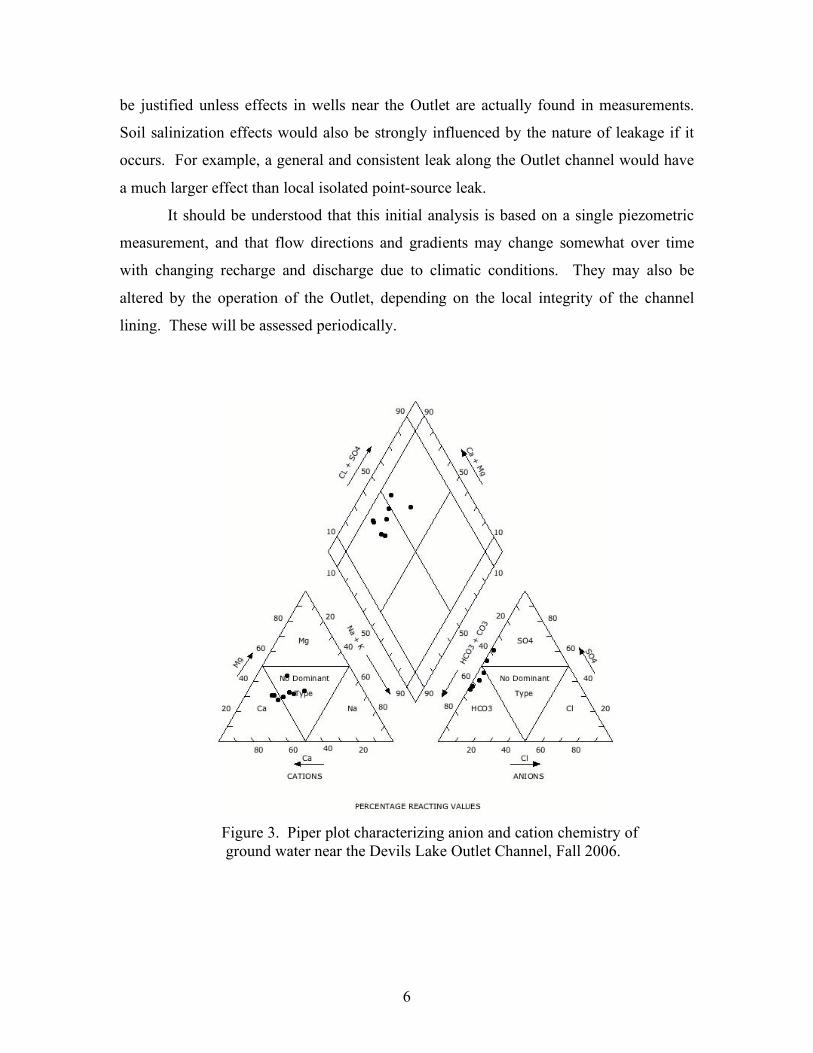
Figure 3. Piper plot characterizing anion and cation chemistry of ground water near the Devils Lake Outlet Channel, Fall 2006.

Tabl
e 1.
Bas
elin
e ge
nera
l che
mis
try fo
r mon
itorin
g w
ells
nea
r the
Dev
ils L
ake
Out
let C
hann
el in
Fal
l, 20
06.
Wel
l Si
te
Loca
tion
Dat
e SI
C
a M
g N
a K
H
CO
3 C
O3
SO4
Cl
F N
O3
TDS
CaC
O3
NC
H
PerN
a SA
R
Con
d pH
m/d
/y
feet
m
g/L
mg/
L m
g/L
mg/
L m
g/L
mg/
L m
g/L
mg/
L m
g/L
mg/
L m
g/L
mg/
L
1
152-
067-
19C
CD
9/7/
06
11-1
9 74
.4
36.7
47
.7
6.03
33
3 <1
14
9 4.
11
0.27
6 19
.3
523
337
63
23.5
1.
13
804
7.96
1
152-
067-
19C
CD
10/2
3/06
11
-19
68.2
34
.8
52.9
5.
45
333
<1
161
4.07
0.
29
22.8
52
8 31
4 40
26
.7
1.3
820
2 15
2-06
8-25
AD
D1
9/
7/06
25
-30
106
41.4
54
.2
6.69
38
7 <1
22
6 13
.6
0.25
6 2.
83
639
435
117
21.2
1.
13
960
9.14
2
152-
068-
25A
DD
1
10/2
3/06
25
-30
115
38.9
49
.8
5.59
36
7 <1
27
2 16
.8
0.23
6 0.
35
657
448
146
19.4
1.
02
1003
2
152-
068-
25A
DD
2
9/7/
06
14-1
9 83
.9
31.4
29
.8
5.99
31
8 <1
14
3 5.
18
0.19
3 0.
71
477
339
77
16
0.7
734
8.5
2 15
2-06
8-25
AD
D2
10
/23/
06
14-1
9 83
.3
30
26.5
5.
06
325
<1
147
5.61
0.
203
0.53
47
0 33
2 64
14
.7
0.63
72
5
3
152-
068-
25C
BB
9/7/
06
13-
Aug
12
2 88
.1
59.3
16
.3
447
<1
433
11
0.15
7 6.
33
887
668
301
16.1
1
1334
7.
8
3 15
2-06
8-25
CB
B
10
/23/
06
13-
Aug
11
8 76
.1
127
14.2
43
5 <1
58
3 12
.2
0.25
1 2.
74
1020
60
8 25
1 31
.1
2.24
15
46
Tabl
e 2.
Bas
elin
e va
lues
for s
elec
ted
trace
ele
men
ts in
mon
itorin
g w
ells
nea
r the
Dev
ils L
ake
Out
let C
hann
el in
Fal
l, 20
06.
Wel
l Si
te
Loca
tion
Dat
e SI
W
L B
Fe
Mn
Se
Pb
As
Cd
Al
Be
Cr
Ni
Cu
Zn
Ag
Sb
Ba
Tl
m/d
/y
feet
fe
et B
LS
mg/
L m
g/L
mg/
L m
g/L
mg/
L m
g/L
mg/
L m
g/L
mg/
L m
g/L
mg/
L m
g/L
mg/
L m
g/L
mg/
L m
g/L
mg/
L 1
1520
6719
CC
D
9/7/
06
11-2
1 16
.6
58
0.04
0.
026
3.42
3.
42
1.3
<1
<50
<1
<1
5.99
1.
37
2.95
<1
<1
75
.1
<1
1 15
2-06
7-19
CC
D
10
/23/
06
11-1
9
0.
03
0.02
8
2
1520
6825
AD
D1
9/7/
06
25-3
0 10
.42
66
0.04
5 0.
263
1.81
1.
81
2.91
<1
<5
0 <1
<1
8.
01
2.50
1.
28
<1
<1
34.1
<1
2
1520
6825
AD
D1
9/7/
06
0.
058
0.42
3
2 15
2068
25A
DD
2 9/
7/06
14
-19
10.4
5 51
0.
031
0.27
1.
19
1.19
<1
<1
<5
0 <1
<1
6.
67
1.33
2.
94
<1
<1
137
<1
2 15
2068
25A
DD
2 9/
7/06
14
-19
0.02
4 0.
343
3 15
2-06
8-25
CB
B
9/
7/06
8-
13
6.33
89
0.
067
0.33
9 3.
89
3.89
2.
46
<1
<50
<1
<1
11.0
2.
73
4.9
<1
<1
155
<1
3 15
2-06
8-25
CB
B
9/
7/06
8-
13
0.04
2 0.
465
7
Draft
8
Baseline Water Chemistry
Ground Water
The baseline water chemistry for monitoring wells installed in September and
October of 2006 is shown on Table 2 for general chemistry and on Table 3 for selected
trace elements. Generally, the well water is of good quality. Specific conductance is
generally low, with the exception of Well Site 3, which is somewhat elevated, likely due
to proximity to the wetland complex in the west half of Section 25 and near proximity to
areas of higher water table that may function as evaporative discharge areas. The Sodium
Adsorption Ratio (SAR) is low, indicating that soil dispersion is unlikely. Nitrate is
highest under Well Site 1, but is less than the EPA-MCL drinking water standard of 44
mg/L by half, and is lower than commonly measured in shallow wells under alfalfa fields.
The water is predominantly of the calcium and magnesium bicarbonate type (see
Piper diagram on Figure 3) with substantial sulfate presence, and grades slightly toward a
marginal sulfate anion predominance on Well Site 3, which is nearest areas of shallow
water tables. All trace elements (Table 3) are below levels of toxicological concern.
Outlet Channel Water (Static Water)
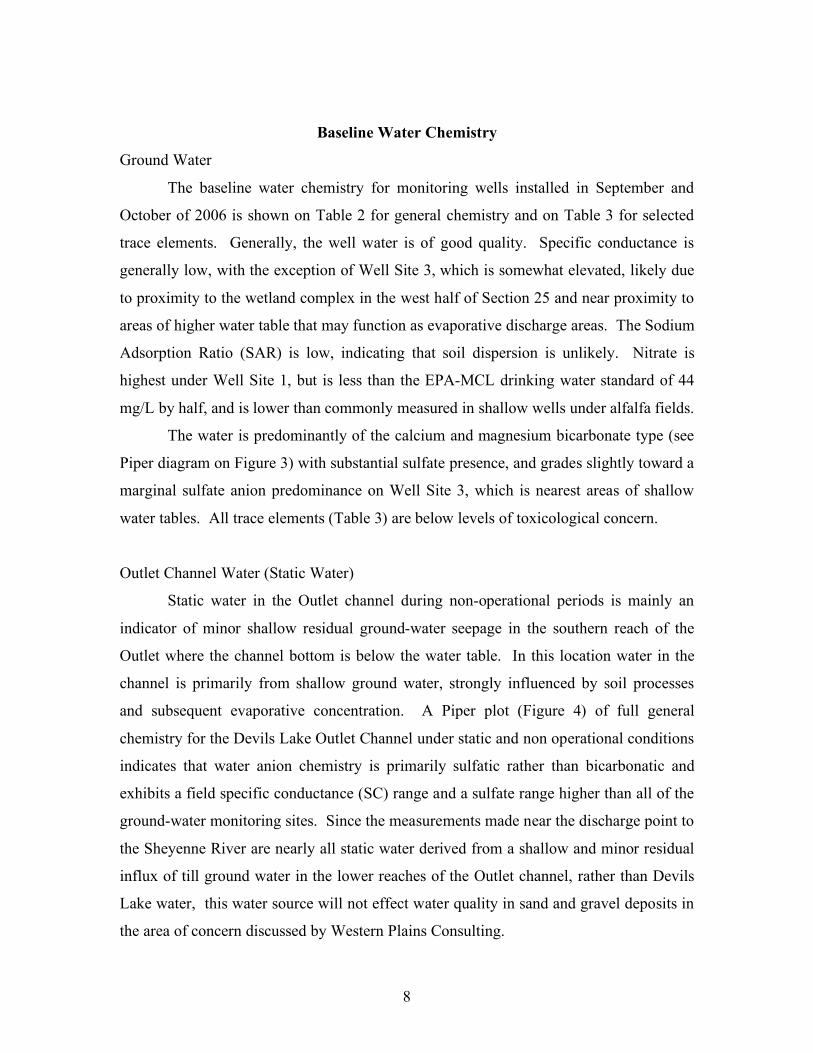
Static water in the Outlet channel during non-operational periods is mainly an
indicator of minor shallow residual ground-water seepage in the southern reach of the
Outlet where the channel bottom is below the water table. In this location water in the
channel is primarily from shallow ground water, strongly influenced by soil processes
and subsequent evaporative concentration. A Piper plot (Figure 4) of full general
chemistry for the Devils Lake Outlet Channel under static and non operational conditions
indicates that water anion chemistry is primarily sulfatic rather than bicarbonatic and
exhibits a field specific conductance (SC) range and a sulfate range higher than all of the
ground-water monitoring sites. Since the measurements made near the discharge point to
the Sheyenne River are nearly all static water derived from a shallow and minor residual
influx of till ground water in the lower reaches of the Outlet channel, rather than Devils
Lake water, this water source will not effect water quality in sand and gravel deposits in
the area of concern discussed by Western Plains Consulting.
Draft
9
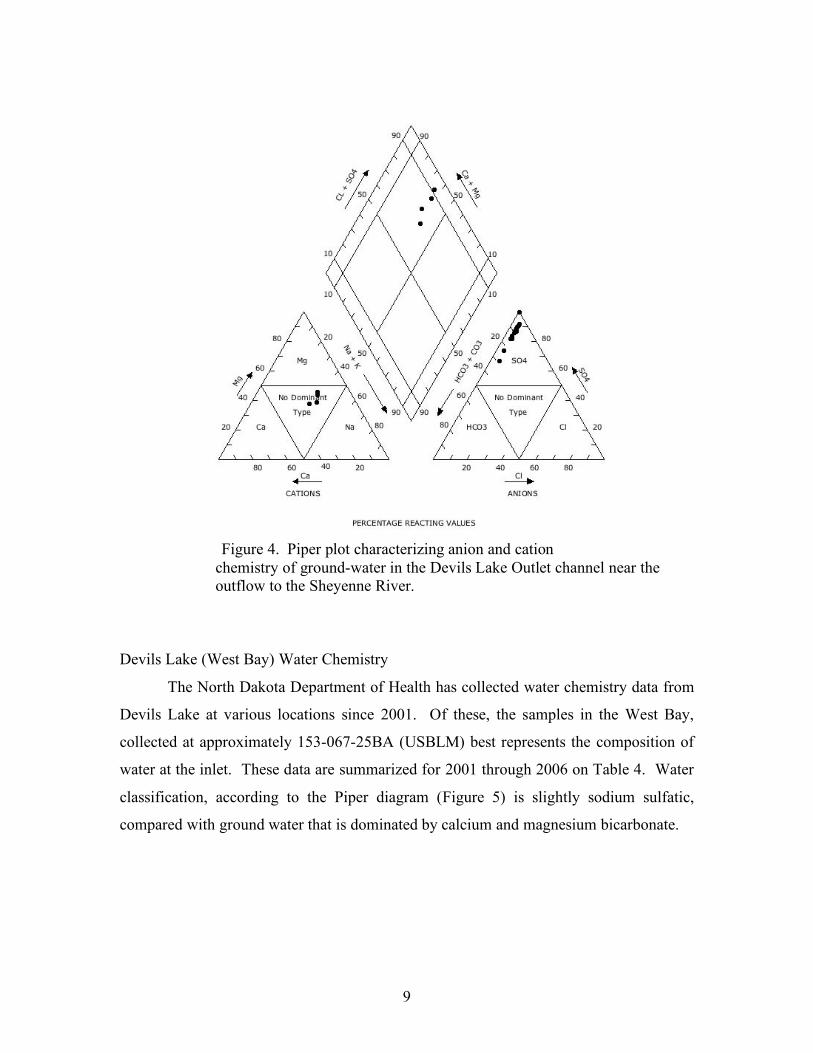
Figure 4. Piper plot characterizing anion and cation
chemistry of ground-water in the Devils Lake Outlet channel near the outflow to the Sheyenne River.
Devils Lake (West Bay) Water Chemistry
The North Dakota Department of Health has collected water chemistry data from
Devils Lake at various locations since 2001. Of these, the samples in the West Bay,
collected at approximately 153-067-25BA (USBLM) best represents the composition of
water at the inlet. These data are summarized for 2001 through 2006 on Table 4. Water
classification, according to the Piper diagram (Figure 5) is slightly sodium sulfatic,
compared with ground water that is dominated by calcium and magnesium bicarbonate.

Draft
10
Figure 5. Piper plot of ion species in West Bay of Devils Lake from 2001 through 2006.
Indicators of Potential Channel Leakage
There are several significant differences between Outlet water during active
operation (as represented by the West Bay data) and natural ground water at the
monitoring well sites identified above. These differences can be used as indicators of
channel leakage if identified in the monitoring well chemistry. They include:
(1) A higher proportion of sodium, as indicated by the sodium-adsorption ratio
(SAR, Table 1 and Table 3). The Devils Lake water has an SAR of about 5 compared
with only 1 for the local ground water. A substantial upward drift of SAR would serve as
one indicator of possible channel leakage.

Draft
11
Table 4. Water chemistry for the West Bay of Devils Lake from 2001 through 2006. (North Dakota Department of Health data, provided by Mike Sauer). Approximate sample collection location is 153-067-25BA (USBLM).
Date Ca mg/L
Mg mg/L
Na mg/L
K mg/L
HCO3 mg/L
CO3 mg/L
SO4 mg/L
Cl mg/L
TDS mg/L
CaCO3 mg/L
SAR
3/19/01 89.7 88.7 294 45.2 479 4 632 121 1510 589 5.27
5/14/01 76 73.3 238 36.5 384 14 577 108 1310 492 4.67
10/10/01 79.4 77.4 256 39.1 331 35 591 112 1350 517 4.9
2/12/02 87.1 86 284 39.9 401 37 682 124 1540 572 5.16
5/13/02 77.8 77.1 248 37 367 24 492 93.3 1230 512 4.77
5/13/02 79.2 78.7 252 37.9 381 16 560 105 1320 522 4.8
8/13/02 86.1 85.7 281 85.7 366 36 632 115 1460 568 5.13
10/7/02 86.4 85.3 286 43 361 38 611 125 1450 567 5.22
2/11/03 89.3 89.8 299 45 429 37 745 139 1660 593 5.34
5/7/03 79.4 79.8 264 39.9 381 27 572 113 1360 527 5 5/7/03 78.9 79.3 262 39.6 373 27 569 113 1350 524 4.98
8/12/03 74.8 79.1 266 40.1 357 41 608 118 1400 512 5.11 8/12/03 77.5 81.4 272 41.3 353 45 605 118 1420 529 5.14
10/7/03 74.8 84.1 282 41.5 391 33 636 120 1470 533 5.31 10/7/03 76.8 86.3 291 42.5 396 31 640 120 1480 547 5.41
3/17/04 87.3 98.4 341 49.5 477 19 783 158 1770 623 5.94
5/18/04 73.2 79.6 268 40.4 366 30 599 117 1390 511 5.16 5/18/04 72.6 79.1 40.1 40.1 364 30 584 115 1370 507 5.16
8/10/04 71.4 78.2 262 38.8 346 48 628 120 1420 500 5.09 8/10/04 73.2 79.5 271 39.4 347 47 573 109 1360 510 5.22
10/6/04 76.2 82.6 274 40.5 344 41 625 118 1430 530 5.17 10/6/04 74.1 80.2 268 39.3 353 40 634 120 1430 515 5.13
3/8/05 85.7 91.6 307 44.7 451 22 688 132 1590 591 5.49 3/8/05 87 92.7 312 45.3 461 22 688 132 1610 599 5.54
5/24/05 76.3 80.7 267 39.8 500 14 611 125 1460 523 5.08 5/24/05 75.7 80.3 267 39.5 396 32 612 118 1420 520 5.09
8/16/05 78.4 80.6 263 37.3 344 44 626 119 1420 528 4.98 8/16/05 78.1 80.7 262 37 347 43 623 117 1410 527 4.96
10/11/05 81.5 83.4 257 42.9 374 35 625 119 1430 547 4.78 10/11/05 80.3 81.6 254 42.6 372 36 627 119 1420 537 4.77
2/14/06 92.6 97.6 304 46.2 416 38 703 133 1620 633 5.25 2/14/06 98.8 104 323 49.4 413 37 709 134 1660 675 5.41
5/9/06 78.1 82.1 243 36.8 363 34 605 102 1360 533 4.58
8/15/06 78.1 87.6 269 35 336 53 604 114 1410 556 4.96 8/15/06 77 87.1 270 35 338 43 602 113 1390 551 5
10/9/06 71 77.7 234 30.1 338 51 612 112 1360 497 4.56 10/9/06 70.4 76.7 230 29.6 345 53 611 114 1360 492 4.51

Draft
12
Table 5. Means and ranges for sulfate-to-bicarbonate ratios and chloride-to-bicarbonate ratios for monitoring wells and the West Bay of Devils Lake.
Sample
Location
X
___
SO4/HCO3
Range SO4/HCO3
X
___
Cl/HCO3
Range Cl/HCO3
Devils Lake West Bay
1.65 1.22-1.82 0.31 0.25-0.34
Outlet Wells 0.61 0.45-0.97 0.022 0.012-0.035
(2) A higher proportion of sulfate in the anionic fraction of the lake water. This
would likely be best indicated as a ratio of bicarbonate. Ground-water and lake samples
have very similar bicarbonate concentrations [the median and range for four ground-
water samples are 360 mg/L and 318 to 447 mg/L; compared with 367 mg/L and 331 to
500 for 37 Devils Lake samples]. Sulfate-to-bicarbonate ratios (SO4/HCO3) are shown on
Table 5. The difference between sulfate-to-chloride ratios are similar to those of SAR,
with the mean and range for Devils Lake being about 5 times that of ground water.
(3) A higher proportion of chloride in the anionic fraction of the lake water. Chloride
is usually leached from the weathered (oxidized zone), and in most glacial aquifers in
North Dakota natural (non-fertilizer) chloride concentrations are governed by
concentrations in the underlying Cretaceous shale bedrock formations, and the diffusion
distance from the shale to the shallow ground-water deposit. As a terminal body of water
and an evaporative sink, Devils Lake is a long-term receiver of chloride from these
highly leached units, so that chloride is higher (about 100-120 mg/L) than ground water
(commonly from 0 to 50 mg/L) and less than 10 mg/L in the Outlet monitoring wells.
Chloride to bicarbonate ratios (Table 4) in the lake water are about 10 times those in the
monitoring wells.
These three normalized indices should provide the best indicators of leakage to
ground water, should leakage occur.
Draft
13
550
600
650
700
750
800
West Bay Sulfate Round Lake Sulfate
2006 Samples
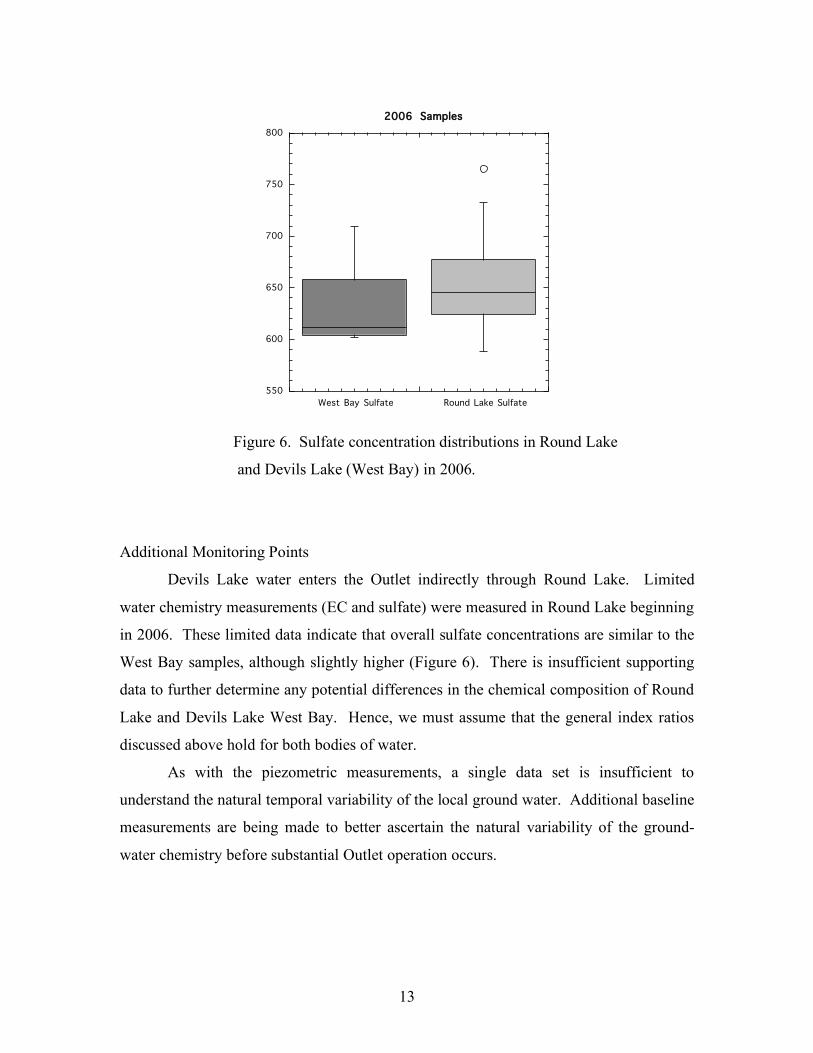
Figure 6. Sulfate concentration distributions in Round Lake
and Devils Lake (West Bay) in 2006.
Additional Monitoring Points
Devils Lake water enters the Outlet indirectly through Round Lake. Limited
water chemistry measurements (EC and sulfate) were measured in Round Lake beginning
in 2006. These limited data indicate that overall sulfate concentrations are similar to the
West Bay samples, although slightly higher (Figure 6). There is insufficient supporting
data to further determine any potential differences in the chemical composition of Round
Lake and Devils Lake West Bay. Hence, we must assume that the general index ratios
discussed above hold for both bodies of water.
As with the piezometric measurements, a single data set is insufficient to
understand the natural temporal variability of the local ground water. Additional baseline
measurements are being made to better ascertain the natural variability of the ground-
water chemistry before substantial Outlet operation occurs.
Draft
14
Monitoring Plan and Recommendations
If the Outlet is not operating, initial chemistry of ground water down-gradient of
the Outlet channel, and south and southwest of the transition structure should be initially
measured at least quarterly (spring, summer and fall). After natural patterns of ground
water are understood sample frequencies may be modified or decreased.
If the Outlet is operated, three quarterly water samples (spring, summer and fall)
should be collected initially from the monitoring wells. If changes in water chemistry are
indicated, more frequent measurements may be necessary. Changing hydrologic
conditions affecting the distribution of solute in the event that channel leakage occurs,
should be monitored approximately monthly during the operational season.
Based on preliminary flow analysis and the disposition of potentially vulnerable
soils shown on Figure 2, one additional well site should be placed in the road ditch near
the center of the north border of Section 25, at approximately 152-068-25ABB
(USBLM). This well would serve as an early indicator of potential salt movement
toward the soil and wetland complex in northwest Section 25.
Citations
Western Plains Consulting. April 7, 2006. Soil Classification and Salinity Inventorying
Report: Devils Lake Peterson Coulee Emergency Outlet, Benson County, North Dakota.
Prepared by WPC, Inc. PO Box 1401, Bismarck, ND.

Draft
15
APPENDIX

Draft
16
152-067-19CCD
NDSWC 15398
Date Completed: 08/30/2006 Purpose: Observation Well
L.S. Elevation (ft): 1555 Well Type: 2 in. - PVC
Depth Drilled (ft): 34 Aquifer: Gravel Sediments
Screen Int. (ft.): 11-21 Data Source:
Completion Info: 3 bags #10 sand, 5.3 bags bentonite chips.
Surveyed by SWC 9/11/06
Remarks: North road ditch, @ 0.2 miles east of intersection, a lot of bentonite used drilling.
Lithologic Log
Depth (ft) Unit Description
0-9 SAND Medium to coarse with fine gravel - includes detrital shale, carbonates and silicates
9-16 GRAVEL Fine, abundant detrital shale
16-19 GRAVEL Medium to coarse, abundant shattered detrital shale, well rounded carbonates
19-20 TILL
20-25 GRAVEL Medium to coarse
25-34 TILL Stone at 31 ft.

Draft
17
152-068-25ADD1
NDSWC 15396
Date Completed: 09/08/2006 Purpose: Observation Well
L.S. Elevation (ft): 1547 Well Type: 2 in. - PVC
Depth Drilled (ft): 100 Aquifer: Gravel Sediments
Screen Int. (ft.): 25-30 Data Source:
Completion Info: 5 bags #10 sand. 3 bags bentonite chips. #18 sell-screen
Surveyed by SWC 9/11/06
Remarks: South well, west of trail
Lithologic Log
Depth (ft) Unit Description
0-1 TOPSOIL Sandy, black
1-15 GRAVEL Medium to coarse, abundant large detrital lignite fragments
15-30 GRAVEL Fine to coarse, grayer than above but mainly oxidized, 2 to 5 mm shale fragments,
Abundant carbonates and pink quartz fragments
30-94 TILL Gray, est. 25 -30% clay, gritty
94-100 SHALE Dark gray, varies in brittleness - slightly brittle to plastic, likely Pierre

Draft
18
152-068-25ADD2
NDSWC 15397
Date Completed: 09/08/2006 Purpose: Observation Well
L.S. Elevation (ft): 1547 Well Type: 2 in. - PVC
Depth Drilled (ft): 28 Aquifer: Gravel Sediments
Screen Int. (ft.): 14-19 Data Source:
Completion Info: 3 bags hole plug, 3 bags # 10 sand
Surveyed by SWC 9/11/06
Remarks: NORTH WELL
Lithologic Log
Depth (ft) Unit Description
0-28 SAND & GRAVEL same as 15203825ADD1 (Well 15396)
Draft
19
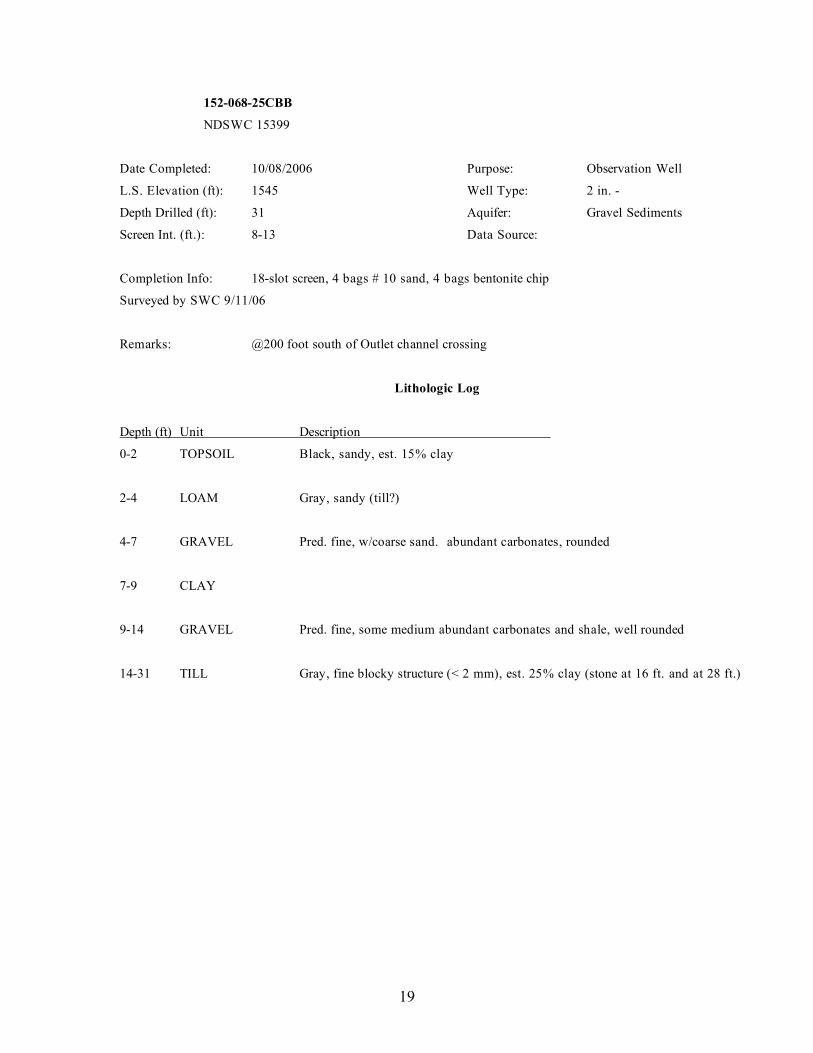
152-068-25CBB
NDSWC 15399
Date Completed: 10/08/2006 Purpose: Observation Well
L.S. Elevation (ft): 1545 Well Type: 2 in. -
Depth Drilled (ft): 31 Aquifer: Gravel Sediments
Screen Int. (ft.): 8-13 Data Source:
Completion Info: 18-slot screen, 4 bags # 10 sand, 4 bags bentonite chip
Surveyed by SWC 9/11/06
Remarks: @200 foot south of Outlet channel crossing
Lithologic Log
Depth (ft) Unit Description
0-2 TOPSOIL Black, sandy, est. 15% clay
2-4 LOAM Gray, sandy (till?)
4-7 GRAVEL Pred. fine, w/coarse sand. abundant carbonates, rounded
7-9 CLAY
9-14 GRAVEL Pred. fine, some medium abundant carbonates and shale, well rounded
14-31 TILL Gray, fine blocky structure (< 2 mm), est. 25% clay (stone at 16 ft. and at 28 ft.)
Draft
20
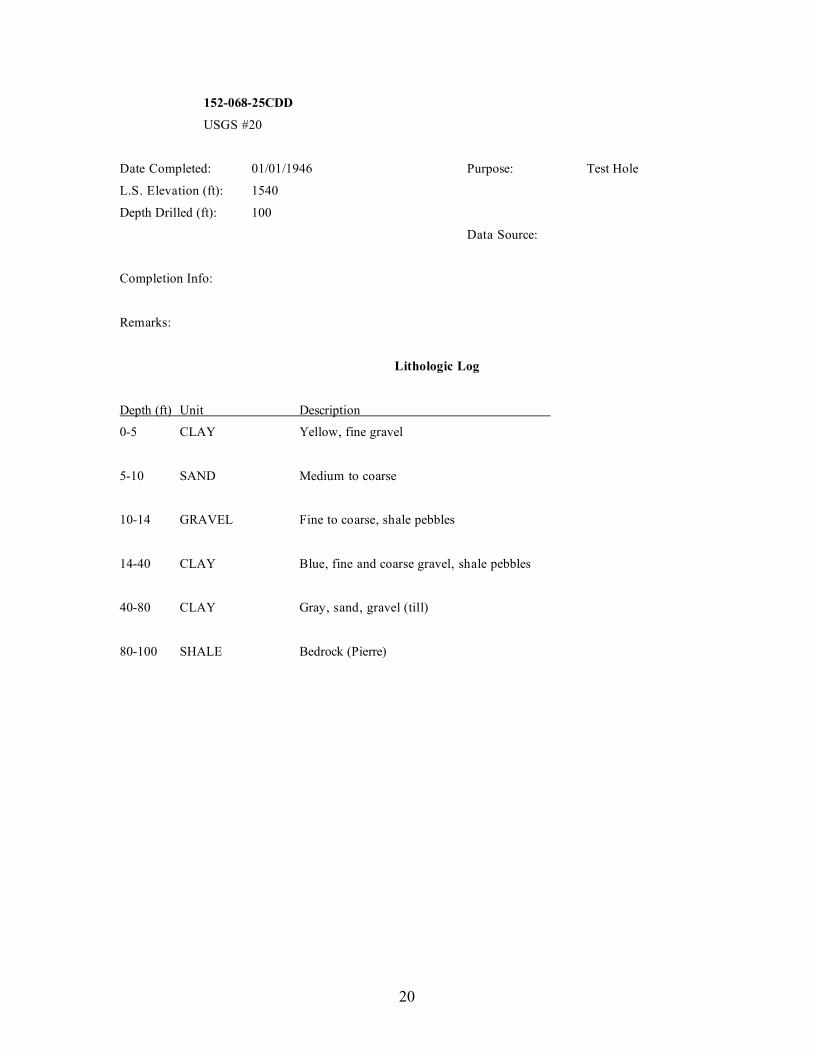
152-068-25CDD
USGS #20
Date Completed: 01/01/1946 Purpose: Test Hole
L.S. Elevation (ft): 1540
Depth Drilled (ft): 100
Data Source:
Completion Info:
Remarks:
Lithologic Log
Depth (ft) Unit Description
0-5 CLAY Yellow, fine gravel
5-10 SAND Medium to coarse
10-14 GRAVEL Fine to coarse, shale pebbles
14-40 CLAY Blue, fine and coarse gravel, shale pebbles
40-80 CLAY Gray, sand, gravel (till)
80-100 SHALE Bedrock (Pierre)