gri agm ’99 wellbore stability progress - maurer mei wellbore stability model ... j. kijowski,...
TRANSCRIPT

GRI AGM ’99
TT00-03 1
Wellbore Stability Progress
GRI Exploration and Production
Advisory Group Meeting
William C. Maurer
Maurer Engineering Inc.
October 13-14, 1999, Houston, TX

GRI AGM ’99
TT00-03 2
Overview
• General
• Mechanical Aspects
• Physico-Chemical Aspects
- GRI Funded Groups
- Other Groups (Worldwide)
• MEI Wellbore Stability Model
• Summary of Mechanisms
• Recommendations for Future R&D

GRI AGM ’99
TT00-03 3
General

GRI AGM ’99
TT00-03 4
Cost of Wellbore Instability Problems
$500 million/year, before 1992G.M. Bol, SPE 24975
1992 SPE European Petroleum Conference
$92 million, BP 1997
$38 million, BP 1998 first quarterJ. Kijowski, BP-Amoco Downhole Talk, Issue 80
GRI AGM ’99
TT00-03 5
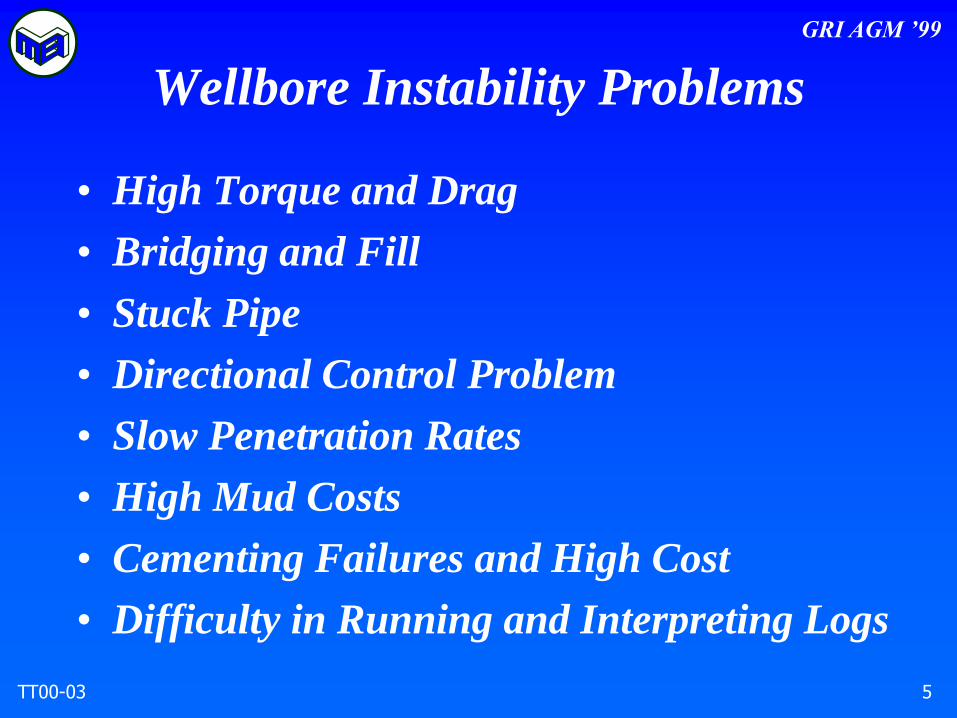
Wellbore Instability Problems
• High Torque and Drag
• Bridging and Fill
• Stuck Pipe
• Directional Control Problem
• Slow Penetration Rates
• High Mud Costs
• Cementing Failures and High Cost
• Difficulty in Running and Interpreting Logs

GRI AGM ’99
TT00-03 6
Wellbore Stability FundamentalStress vs Strength
Near Wellbore
Stresses
Formation
Strength
Near-Wellbore
Pore Pressure Mud ChemistryWell
Trajectory
In-SituStresses
FormationPressure
LithologyFabric
Cementation
Controllable Factors
Uncontrollable Factors
GRI AGM ’99
TT00-03 7
Mechanical Aspects
GRI AGM ’99
TT00-03 8
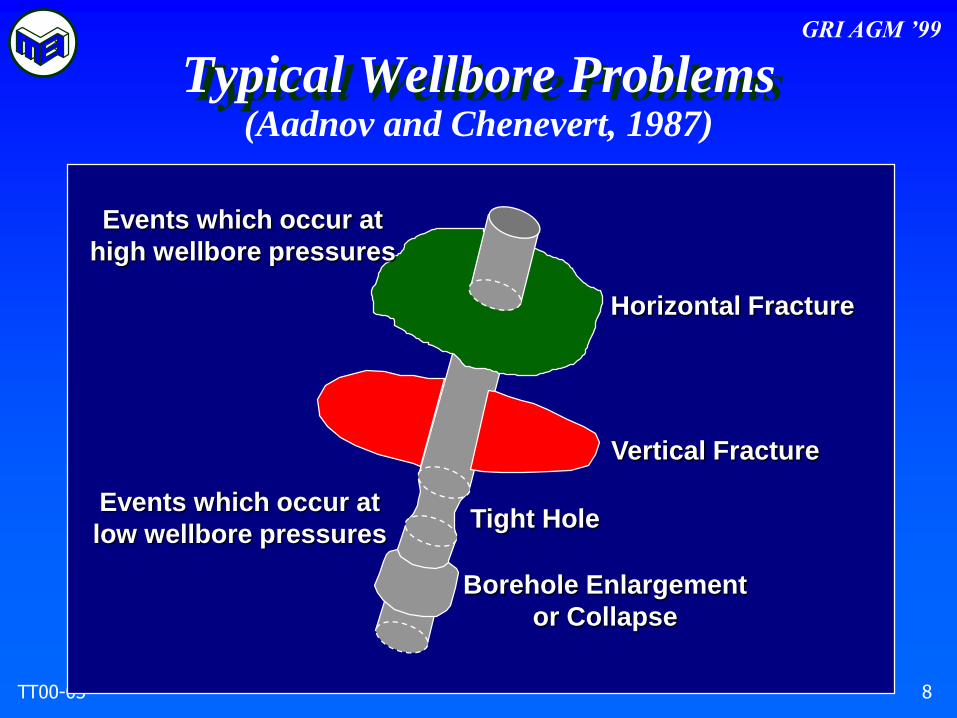
Typical Wellbore Problems(Aadnov and Chenevert, 1987)
Tight Hole
Borehole Enlargement
or Collapse
Vertical Fracture
Horizontal Fracture
Events which occur at
low wellbore pressures
Events which occur at
high wellbore pressures

GRI AGM ’99
TT00-03 9
Bore Hole Enlargement in Shale(Simpson et al., 1988)

GRI AGM ’99
TT00-03 10
Lost Circulation
• Naturally fractured
• Unconsolidated
• Highly permeable
• Cavernous or vugular
• Mechanically
induced fractures

GRI AGM ’99
TT00-03 11
Lost Circulation Material
• Granular - nut hulls,
asphalt, seeds, grains,
limestone, salt crystals, etc.
• Fibrous - wood fibers,
straw, mineral fibers, etc.
• Lamellar - mica,
cellophane, shredded
plastic, etc.
• Liquid - polymers, etc.
GRI AGM ’99
TT00-03 12
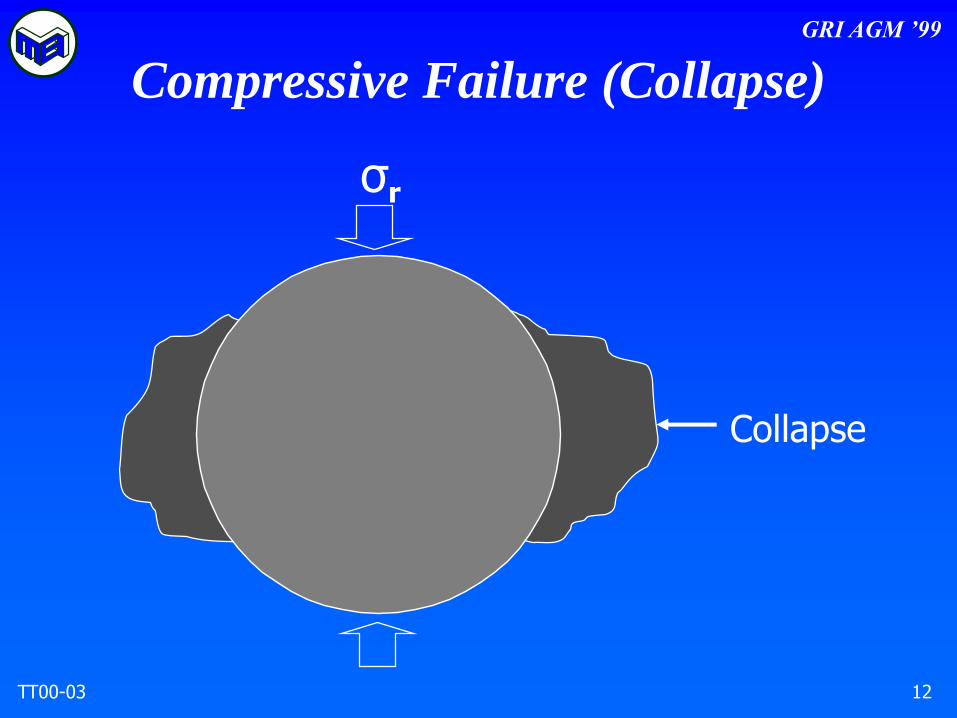
Compressive Failure (Collapse)
Collapse
σr

GRI AGM ’99
TT00-03 13
Effect of Borehole Pressures
GRI AGM ’99
TT00-03 14
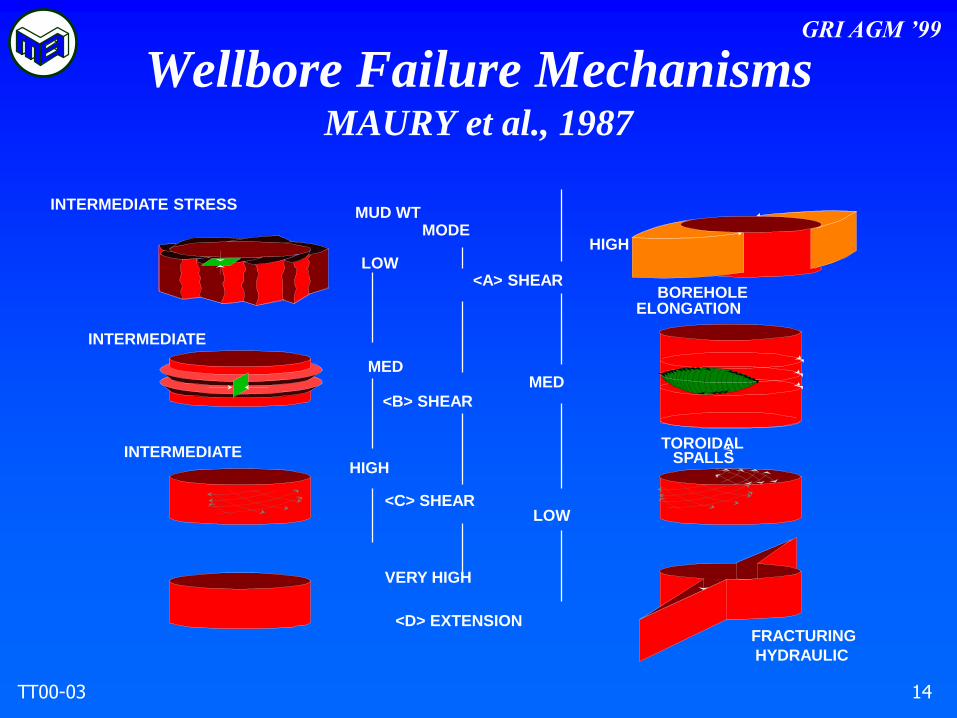
Wellbore Failure MechanismsMAURY et al., 1987
INTERMEDIATE
INTERMEDIATE
HIGH
MED
BOREHOLEELONGATION
TOROIDALSPALLS
HYDRAULIC
FRACTURING
LOW
LOW
VERY HIGH
INTERMEDIATE STRESS
MED
HIGH
<D> EXTENSION
<B> SHEAR
MODE
<C> SHEAR
<A> SHEAR
MUD WT

GRI AGM ’99
TT00-03 15
Rock Failure
GRI AGM ’99
TT00-03 16
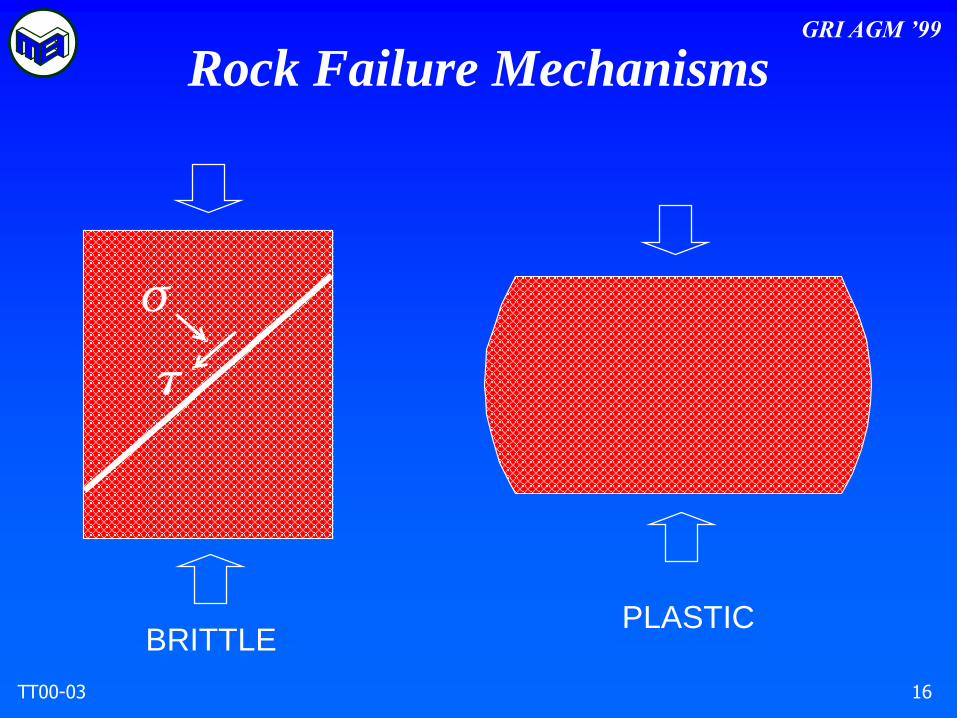
Rock Failure Mechanisms
PLASTICBRITTLE
GRI AGM ’99
TT00-03 17
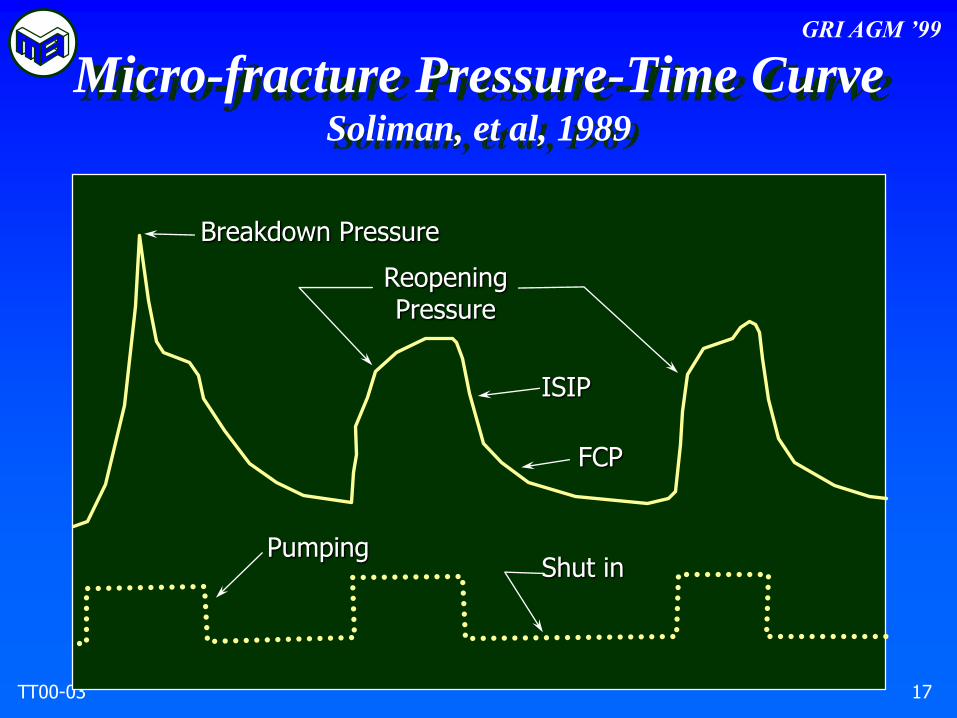
Micro-fracture Pressure-Time CurveSoliman, et al, 1989
Breakdown Pressure
ReopeningPressure
ISIP
FCP
PumpingShut in

GRI AGM ’99
TT00-03 18
Rock Triaxial Stress TestMcLean & Addis, 1990
50
20
10Confining Pressure (MPA)
0
Axial Strain (%)
0 1.0 2.0 3.0 4.00
100
200
300
Devia
tor
Str
ess
σ1 -σ
3 (
MPa)
GRI AGM ’99
TT00-03 19
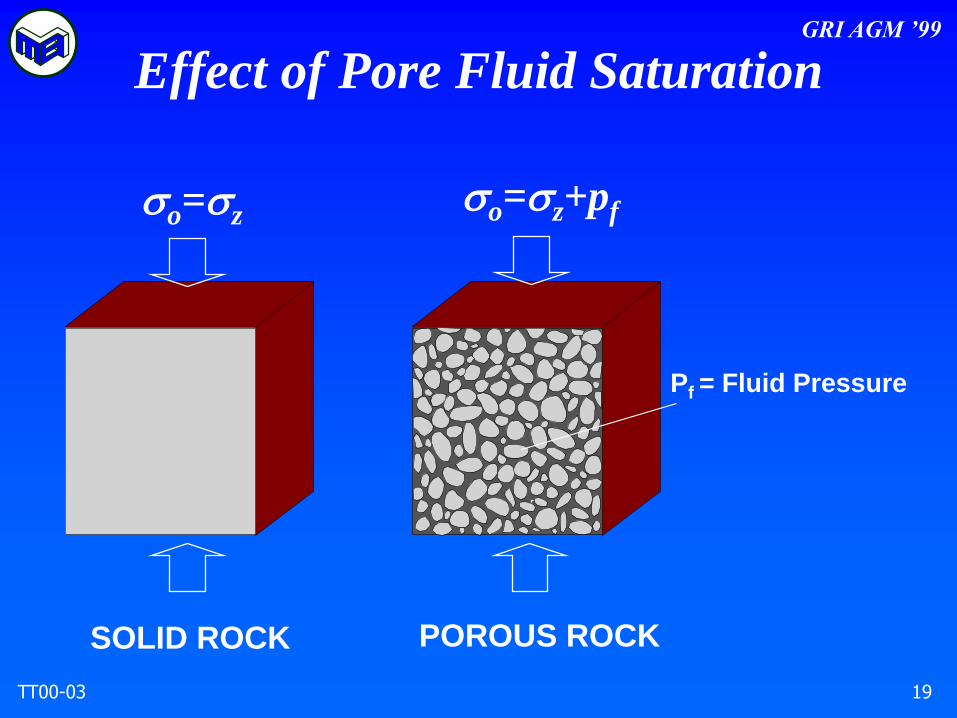
Effect of Pore Fluid Saturation
POROUS ROCKSOLID ROCK
Pf = Fluid Pressure
o=zo=z+pf
GRI AGM ’99
TT00-03 20
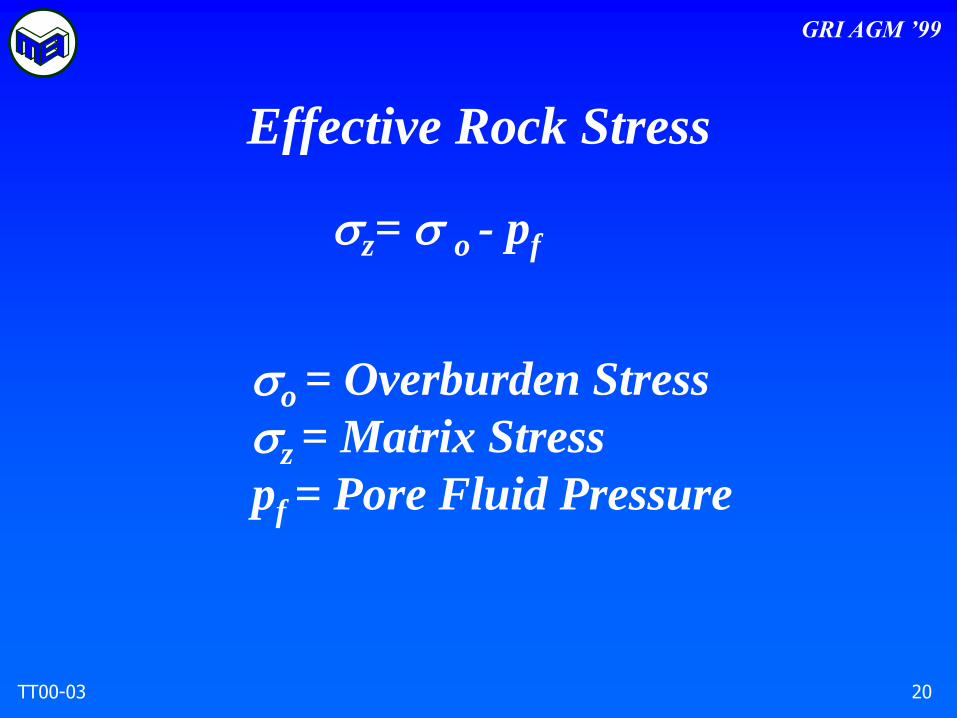
Effective Rock Stress
z= o - pf
o = Overburden Stress
z = Matrix Stress
pf = Pore Fluid Pressure

GRI AGM ’99
TT00-03 21
Change In Near-Wellbore Stresses
Caused by Drilling
V (overburden)
Hmin
Hmax Hmin
Hmax
Pw (hydrostatic)
Before DrillingIn-situ stress state
After DrillingLower stress within wellbore
GRI AGM ’99
TT00-03 22
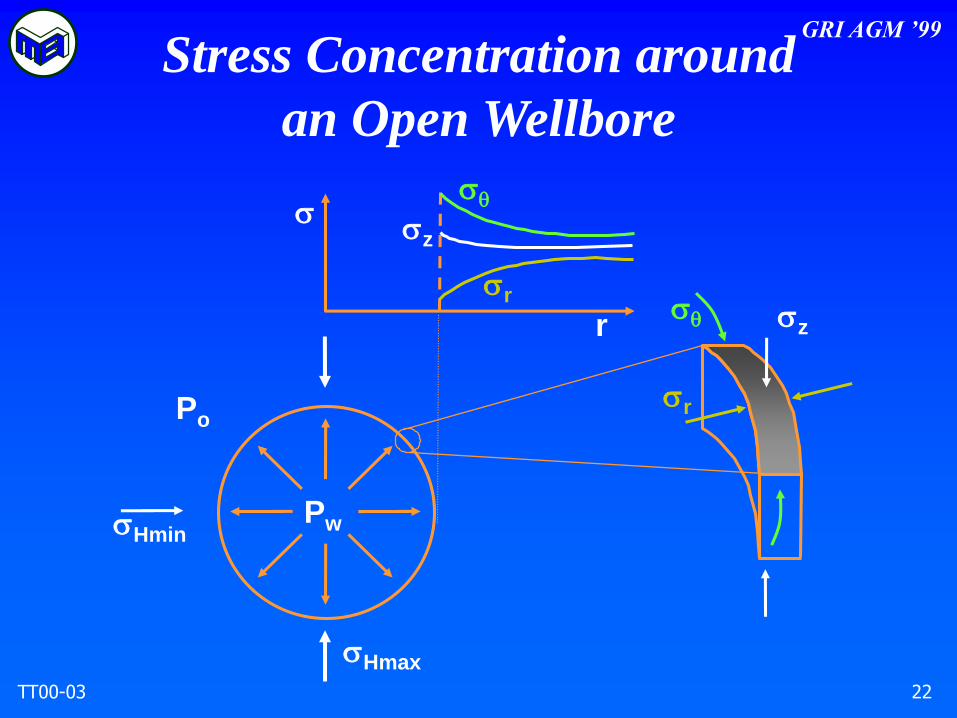
Stress Concentration around
an Open Wellbore
Pw
Po
Hmin
Hmax
zq
q
r
z
r
r

GRI AGM ’99
TT00-03 23
Strength vs Stress
Identifying the Onset of Rock Yielding
Shear
Str
ess
r´
Effective Compressive Stress
Stable Stress State
q´
r´
Shear
Str
ess
r´
Effective Compressive Stress
Unstable Stress State
q´
r´
q´
MinStress
MaxStress
q´

GRI AGM ’99
TT00-03 24
Types of Yielding Occurring
around Wellbore
MINIMUM
STRESS
High shearstress zone
Limits ofdamagedregion
Extensional strain zone(usually single fracture)
BREAKOUTS
MAXIMUM STRESS
borehole

GRI AGM ’99
TT00-03 25
Rock Yielding around Wellbores
Laboratory TestsRawlings et al, 1993
Isotropic Stresses Anisotropic Stresses

GRI AGM ’99
TT00-03 26
Wellbore Radial Decrease
m = Poisson’s Ratio
R = Wellbore Radius
h = Original horizontal earth stress
Pw = Wellbore pressure
E = Young’s Modulus
r = (h-pw )(1+m )R / E

GRI AGM ’99
TT00-03 27
Borehole DeformationDunbar et al., 1985

GRI AGM ’99
TT00-03 28
Effect of PermeabilityHsiao, 1987

GRI AGM ’99
TT00-03 29
Wellbore Stable Condition
Collapse Failure
Fracture Failure
Stable
Mud Weight (ppg)

GRI AGM ’99
TT00-03 30
Physico-Chemical Aspects

GRI AGM ’99
TT00-03 31
Typical Occurrences of Wellbore
Instability in Shales
soft, swelling shale
brittle-plastic shale
brittle shale
naturally fractured shale
strong rock unit

GRI AGM ’99
TT00-03 32
Oil-Base Muds
BENEFITS
• Shale inhibition
• Formation fluid
compatible
• Lubricity
• Reduced hole
erosion
• Temperature,
corrosion , MWs...
LIMITATIONS
• Environmental/safety
• Base cost
• Emulsifiers’ reactivity
• Cement
incompatibility
• Water flows, losses...
• Operational
considerations
Basic Mud Types
GRI AGM ’99
TT00-03 33
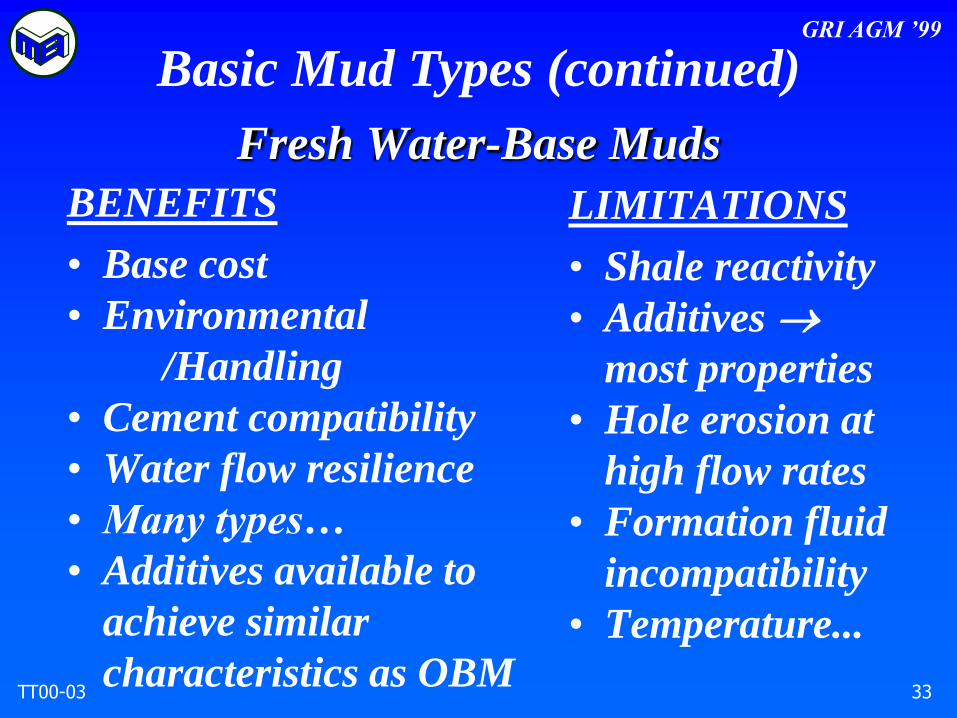
Fresh Water-Base Muds
BENEFITS
• Base cost
• Environmental
/Handling
• Cement compatibility
• Water flow resilience
• Many types…
• Additives available to
achieve similar
characteristics as OBM
LIMITATIONS
• Shale reactivity
• Additives most properties
• Hole erosion at
high flow rates
• Formation fluid
incompatibility
• Temperature...
Basic Mud Types (continued)
GRI AGM ’99
TT00-03 34
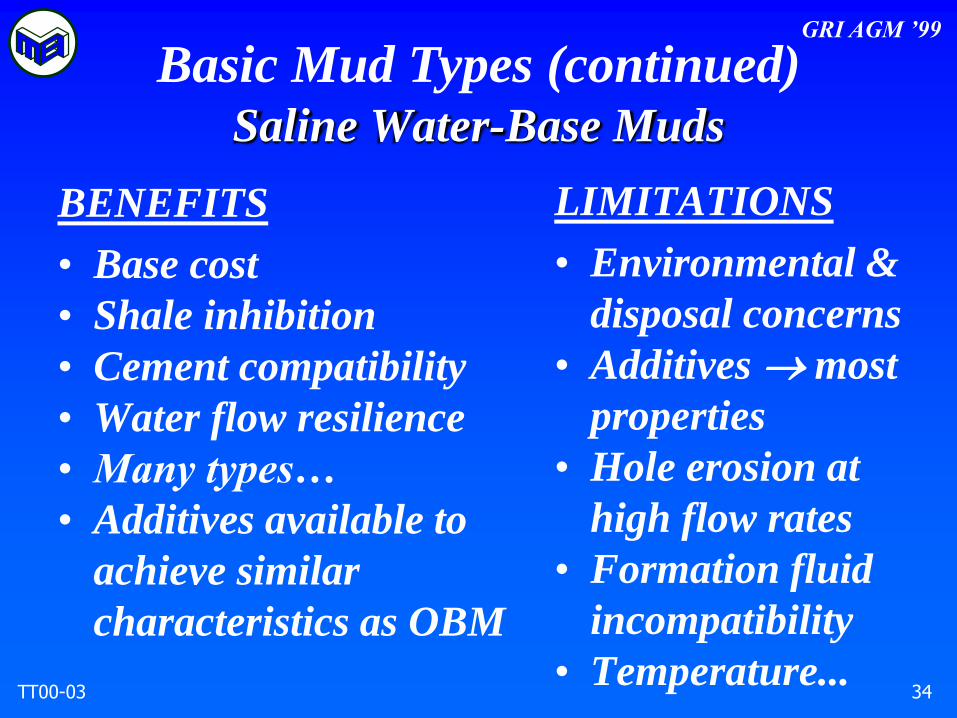
Saline Water-Base Muds
BENEFITS
• Base cost
• Shale inhibition
• Cement compatibility
• Water flow resilience
• Many types…
• Additives available to
achieve similar
characteristics as OBM
LIMITATIONS
• Environmental &
disposal concerns
• Additives most
properties
• Hole erosion at
high flow rates
• Formation fluid
incompatibility
• Temperature...
Basic Mud Types (continued)

GRI AGM ’99
TT00-03 35
Low Density Fluids (Foam, Gas, Etc.)
BENEFITS
• Low density
• Reduced formation
damage
• Shale inhibition
• Many types...
LIMITATIONS
• Water flows
• Rheological properties
• Hole erosion at high flow rates
• Drillstring and casing
corrosion
• Pressure & temperature
• Operational considerations
• Surface equipment
requirements & costs
Basic Mud Types (continued)

GRI AGM ’99
TT00-03 36
Effect of Mud Type
Native
Fresh Water OBM
Fresh Water WBM
20% CaCl2 OBM
20% CaCl2 WBM
35% CaCl2 OBM
35% CaCl2 WBM
21000 0 62000 8 104
(1 - 3) psi Water Content, %

GRI AGM ’99
TT00-03 37
Check Water Fraction in Shales
GRI AGM ’99
TT00-03 38
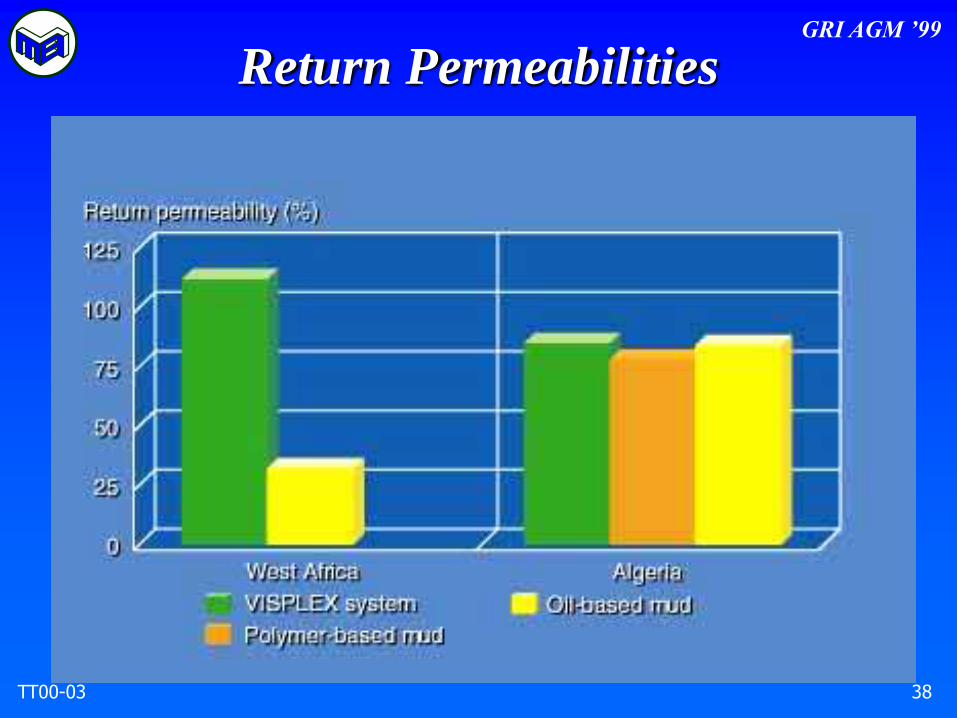
Return Permeabilities

GRI AGM ’99
TT00-03 39
Return Permeabilities
GRI AGM ’99
TT00-03 40
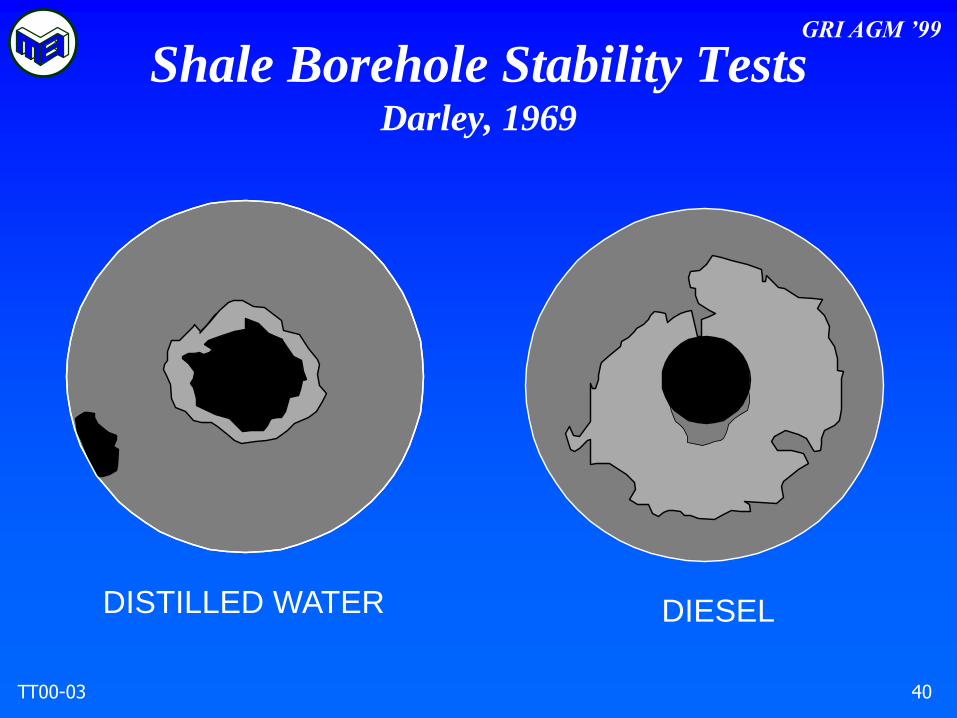
Shale Borehole Stability TestsDarley, 1969
DIESELDISTILLED WATER

GRI AGM ’99
TT00-03 41
Montmorillonite Swelling PressurePowers, 1967
80,000
60,000
40,000
20,000
04th 3rd 2nd 1st
5000
4000
3000
2000
1000
0
SW
ELLIN
G P
RESSU
RE, psi
kg/c
m2
LAYERS OF CRYSTALLINE WATER

GRI AGM ’99
TT00-03 42
Shale Compaction TestsDarley, 1989
0.6
0.5
0.4
0.3
0.2
0.1
0
0 2500 5000 7500 10,000
WATER R
ETAIN
ED
g/g
OF D
RY C
LAY
EFFECTIVE LOAD, psi
CALCIUM BENTONITE
SODIUM BENTONITE
SHALE VENTURA CALIF.
GRI AGM ’99
TT00-03 43
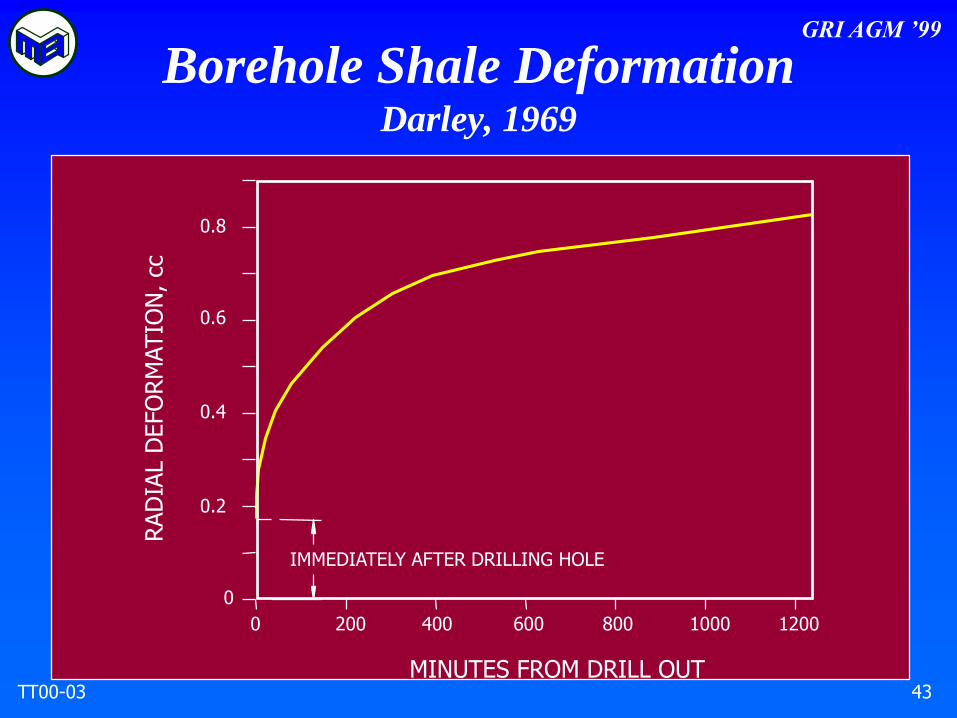
Borehole Shale DeformationDarley, 1969
0
0.2
0.4
0.6
0.8
0 200 400 600 800 1000 1200
IMMEDIATELY AFTER DRILLING HOLE
RAD
IAL D
EFO
RM
ATIO
N, cc
MINUTES FROM DRILL OUT

GRI AGM ’99
TT00-03 44
Shale Water AdsorptionChenevert, 1970
0.10 0.20 0.30 0.40 0.50 0.60 0.70 0.80 0.90 1.00
5
4
3
2
1
0
WEIG
HT %
WATER
WATER ACTIVITY - aW
DESORPTION
ADSORPTION
GRI AGM ’99
TT00-03 45
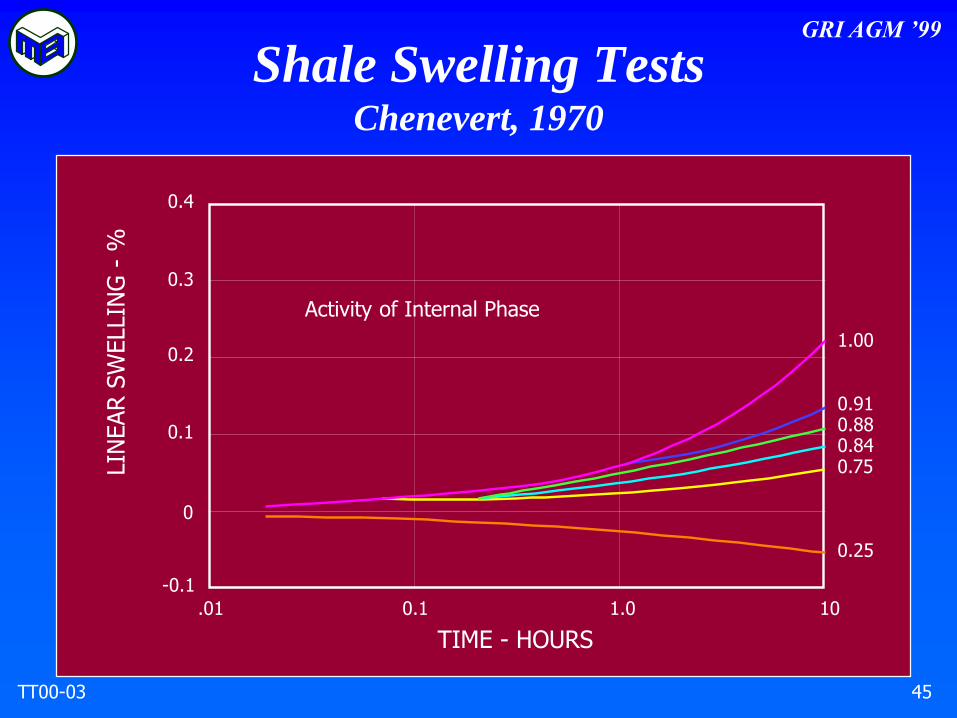
Shale Swelling TestsChenevert, 1970
TIME - HOURS
LIN
EAR S
WELLIN
G -
%
.01 0.1 1.0 10
0.4
0.3
0.2
0.1
0
-0.1
1.00
0.910.880.840.75
0.25
Activity of Internal Phase

GRI AGM ’99
TT00-03 46
Effect of K+Ions on Shale SwellingBaroid, 1975
Ca ++
K+
K+
K+
Na+
Cs+
Na+
Ca++
Li+
K+
Rb+
Cs+
Na+
Mg++
Na+
10A°
Na+
--
--
-
--
-
-
-
-- -
-
-
GRI AGM ’99
TT00-03 47
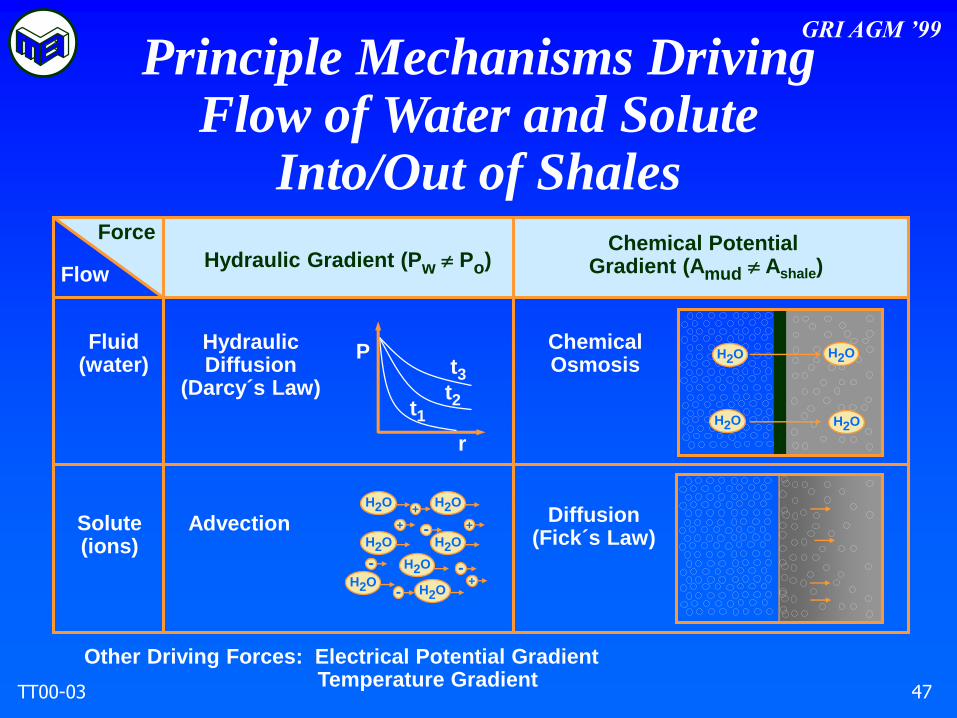
Principle Mechanisms DrivingFlow of Water and Solute
Into/Out of ShalesForce
Flow
Fluid(water)
Solute(ions)
Hydraulic Gradient (Pw Po)Chemical Potential
Gradient (Amud Ashale)
HydraulicDiffusion
(Darcy´s Law)
Advection Diffusion(Fick´s Law)
ChemicalOsmosis
H2O
H2O H2O
H2Ot1
t2
t3
P
r
Other Driving Forces: Electrical Potential GradientTemperature Gradient
H2O H2O
H2O H2O
H2OH2O
H2O
+ -
-
-
+
+
+
-
GRI AGM ’99
TT00-03 48
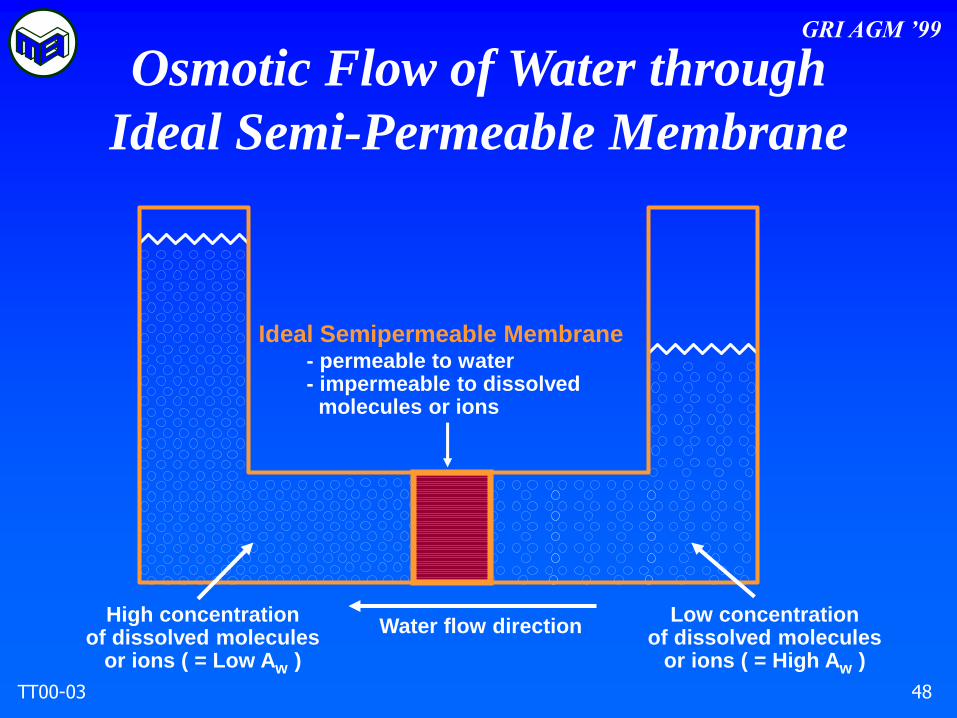
Osmotic Flow of Water through
Ideal Semi-Permeable Membrane
Ideal Semipermeable Membrane- permeable to water- impermeable to dissolved
molecules or ions
Water flow directionHigh concentration
of dissolved moleculesor ions ( = Low Aw )
Low concentrationof dissolved molecules
or ions ( = High Aw )

GRI AGM ’99
TT00-03 49
Effect of Water Activitieson Transport of Water and Ions
under Downhole Conditions
Ideal Semi-Permeable Membrane(e.g. OBM-shale)
Mud Aw < Formation AwWater flows from formation to mud
Mud Aw > Formation AwWater flows from mud to formation
Mud Aw = Formation AwNo osmotic flow of water

GRI AGM ’99
TT00-03 50
Effect of Water Activitieson Transport of Water and Ions
under Downhole Conditions
Non-Ideal Semi-Permeable Membrane(e.g. WBM-shale)
Mud Aw < Formation AwWater flows from formation to mud
Ions diffuse from mud to formation
Mud Aw > Formation AwWater flows from mud to formation
Ions diffuse from formation to mud
Mud Aw = Formation AwNo osmotic flow of water
No ion movement (?)
GRI AGM ’99
TT00-03 51
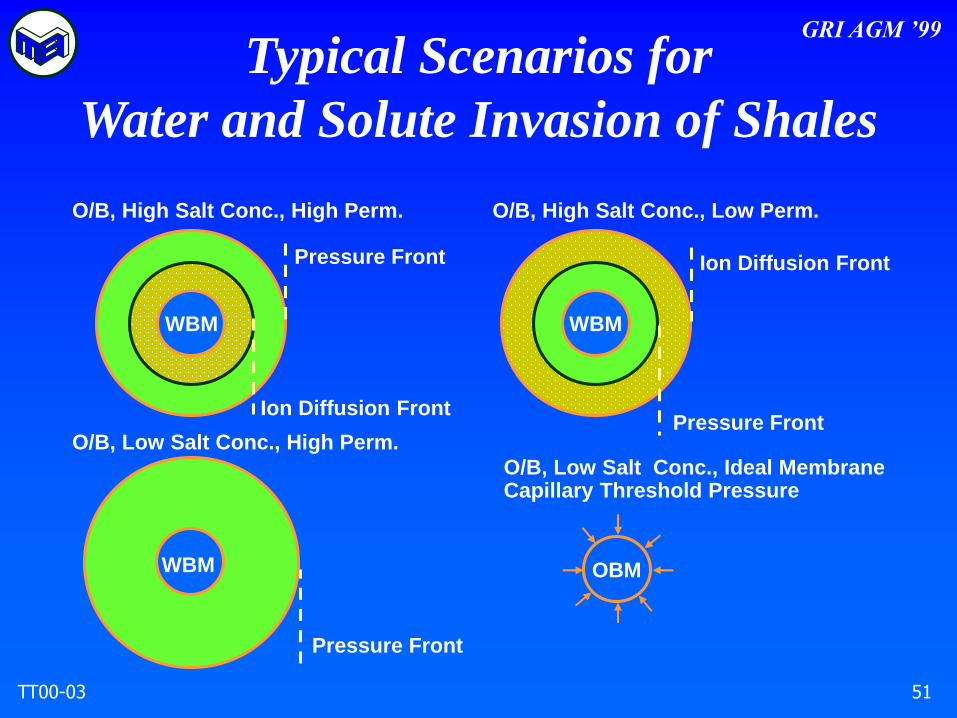
Typical Scenarios for
Water and Solute Invasion of Shales
O/B, High Salt Conc., Low Perm.
O/B, Low Salt Conc., Ideal MembraneCapillary Threshold Pressure
WBM
OBMWBM
Ion Diffusion Front
Pressure Front
WBM
Pressure Front
Ion Diffusion Front
O/B, High Salt Conc., High Perm.
Pressure Front
O/B, Low Salt Conc., High Perm.
GRI AGM ’99
TT00-03 52
• Mud chemistry can affect near-wellbore
pore pressures
• Mud-shale interaction can affect shale
strength
• Mud-shale interaction can result in
swelling strains and/or hydrational
stresses
• Interfacial tension between immiscible
fluids can prevent mud penetration into
shale
Key Concepts

GRI AGM ’99
TT00-03 53
Effect of Osmotic Flow onNear-Wellbore Pore Pressure for a
Balanced Bottomhole Pressure Condition
Osmotic flow
from mud to
shale
Pore Pressure Increase
Osmotic
flow from
shale to
mud
r
amud< ashaleamud> ashale
P P
r
PW Pfm PW Pfm
Pore Pressure Decrease

GRI AGM ’99
TT00-03 54
Effective Stresses Partioningof Total Stress between
Mineral Grains and Pore Fluids
Po
´ = - a Po´ - effective stress
- total stressPo - pore pressure
a - Biot Coefficient
( 1 for weak, porous rocks)

GRI AGM ’99
TT00-03 55
Effect of Near-WellborePore Pressure Changeon Effective Stresses
Sh
ear
Str
ess
No Yield
Yield
Effective Compressive Stress
r´ q´r´ q´
Po increase
GRI AGM ’99
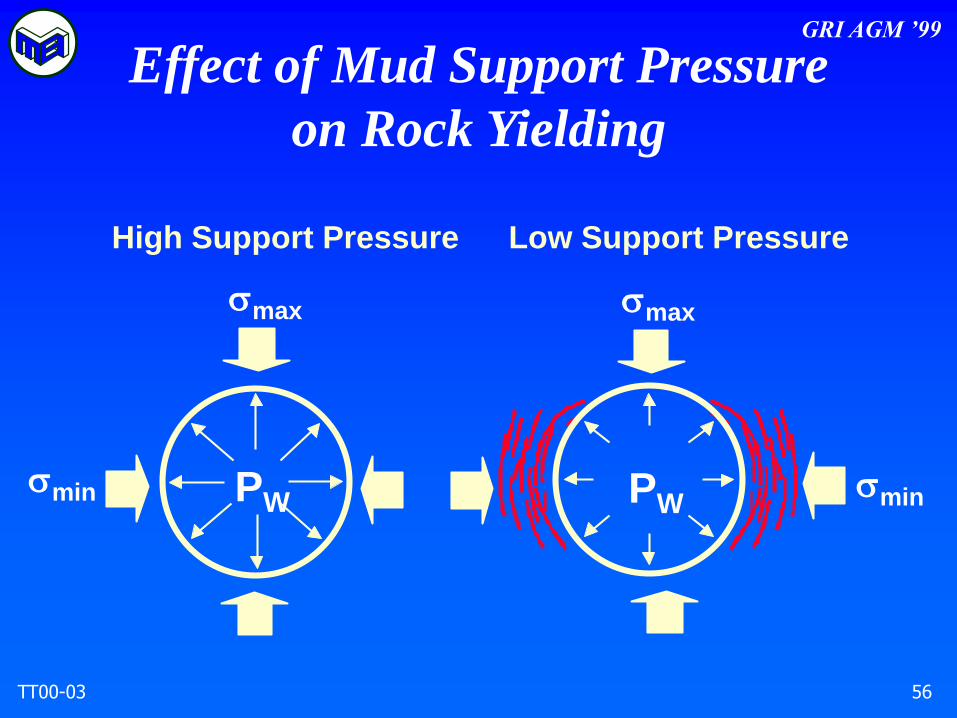
TT00-03 56
PW PW
max max
min min
High Support Pressure Low Support Pressure
Effect of Mud Support Pressure
on Rock Yielding
GRI AGM ’99
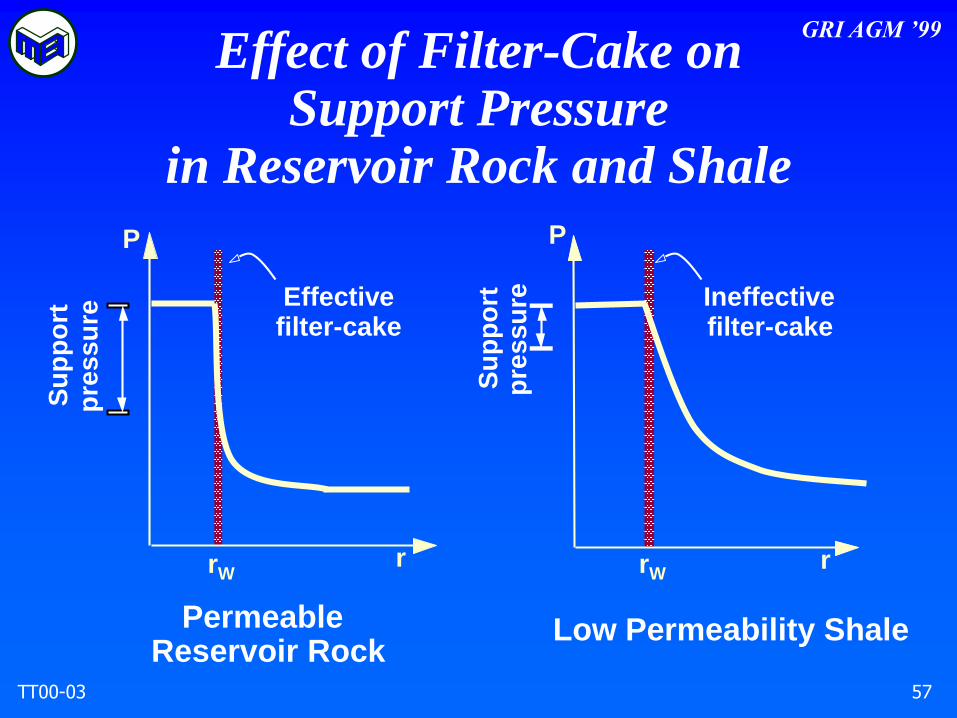
TT00-03 57
Effect of Filter-Cake onSupport Pressure
in Reservoir Rock and Shale
P
Effectivefilter-cake
r
Su
pp
ort
pre
ss
ure
Permeable Reservoir Rock
P
Ineffectivefilter-cake
r
Su
pp
ort
pre
ss
ure
Low Permeability Shale
rWrW

GRI AGM ’99
TT00-03 58
Mud Pressure Penetration and Damage
due to Yielding in Shales
Pw
Pw
minimalfilter-cake
Pfm
Shale
zone of no fluidpressure support
higher k (induced fractures due to yielding)
early time, before damage
steady-state, with damagedzone of higher ksteady-state,
no damage
P
r
GRI AGM ’99
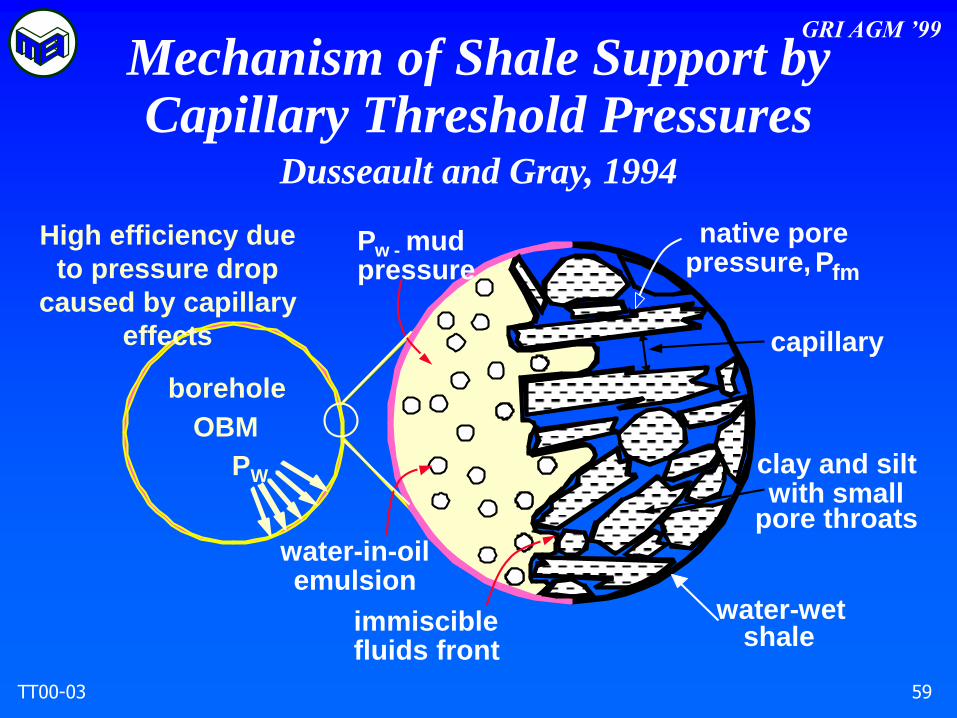
TT00-03 59
Mechanism of Shale Support byCapillary Threshold Pressures
Dusseault and Gray, 1994
High efficiency due
to pressure drop
caused by capillary
effects
OBM
water-in-oilemulsion
native porepressure, Pfm
PW
borehole
capillary
immisciblefluids front
Pw - mudpressure
clay and siltwith small
pore throats
water-wetshale

GRI AGM ’99
TT00-03 60
Effect of Mud Pressure Penetration
on Wellbore StabilityS
he
ar
Str
es
s
No Yield
Yield
r´(2)
q ´(2)r´ (1)
q ´(1)
Effective Compressive Stress
No mud
pressure
penetration
Total mud
pressure
penetration

GRI AGM ’99
TT00-03 61
Bottomhole Pressure Regimes while
Overbalanced Drilling
Static OverbalanceBreakingCirculation
CirculationSolidsLoading
ReamingSpudding
SolidsLoading
SurgeSwab
Pistoning up Pistoning down
Formation Pressure Shock
pressure
INF
LU
X
MU
D L
OS
SE
S
FormationPore
PressurePw
Static
MinimumDynamic Pressure
MaximumDynamicPressure
BreakdownPressure
CollapsePressure
CO
LL
AP
SE

GRI AGM ’99
TT00-03 62
Effect of Strength Decrease on
Wellbore StabilityS
hear
Str
ess
No Yield
Yield
r´ q´
Effective Compressive Stress

GRI AGM ’99
TT00-03 63
Hydrational Stresses andSwelling Strains due to
Water Absorption into Shale
Before Drilling After Drillingz
r
z
r
hydrational stresses
H2O
Sand or silt grain
Clay particlecluster
Zo
Z1
ro
r1
eZ = Z1- Zo
Zo
er = r1-ro
ro

GRI AGM ’99
TT00-03 64
Factors Controlling
Swelling Behavior of Shales
• Clay percentage
• Type of clay minerals
• Pore water composition
• Porosity
• Initial water content
• Initial saturations
• Presence of gas phase
• Rock microfabric or structure
• Rock stress history
• Temperature

GRI AGM ’99
TT00-03 65
Effect of Hydrational Stresses on
Wellbore StabilityS
hear
Str
ess
No YieldYield
sq´sr´ sq´
hydrationalstress
Effective Compressive Stress
Most Likely Scenario for Stiff Shales
in High Stress Settings

GRI AGM ’99
TT00-03 66
Effect of Swelling Strains on
Wellbore Stability
Soft, Swelling ShaleHole Closure due to Swelling Strains
Most Likely Scenario for Soft
Reactive Shales in Low Stress Settings

GRI AGM ’99
TT00-03 67
Effect of Capillary Threshold Pressure
on Wellbore StabilityS
he
ar
Str
es
s
No Yield
Yield
r´ q´r´ q´
No mud pressurepenetration
Effective Compressive Stress

GRI AGM ’99
TT00-03 68
Membrane Efficiency
of Non-Ideal Semi-Permeable Membrane
PressureOsmoticlTheoretica
PressureOsmoticObservedEfficiencyMembrane
“Leaky” Membrane
Observed
Theoretical
Low Activity
Drilling Fluid
High Activity
Shale Formation
Osmotic Pressure

GRI AGM ’99
TT00-03 69
Research Progress

GRI AGM ’99
TT00-03 70
• OGS
• UT Austin (Chenevert)
• UT Austin (Morris)
GRI Funded Groups

GRI AGM ’99
TT00-03 71
OGS
GRI AGM ’99
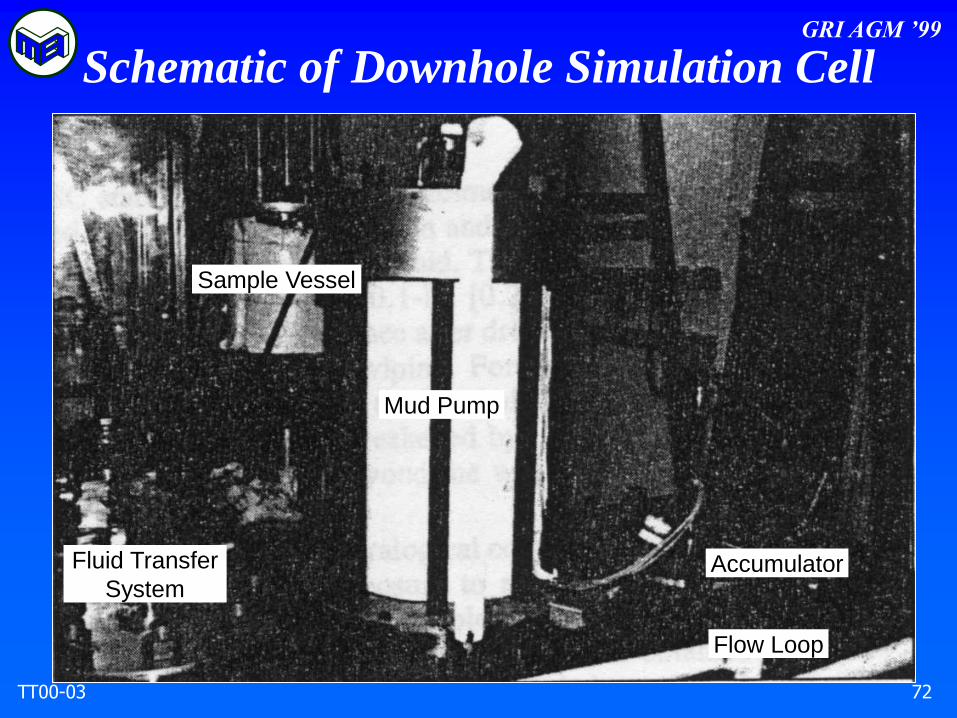
TT00-03 72
Schematic of Downhole Simulation Cell
Mud Pump
Accumulator
Sample Vessel
Fluid Transfer
System
Flow Loop
GRI AGM ’99
TT00-03 73
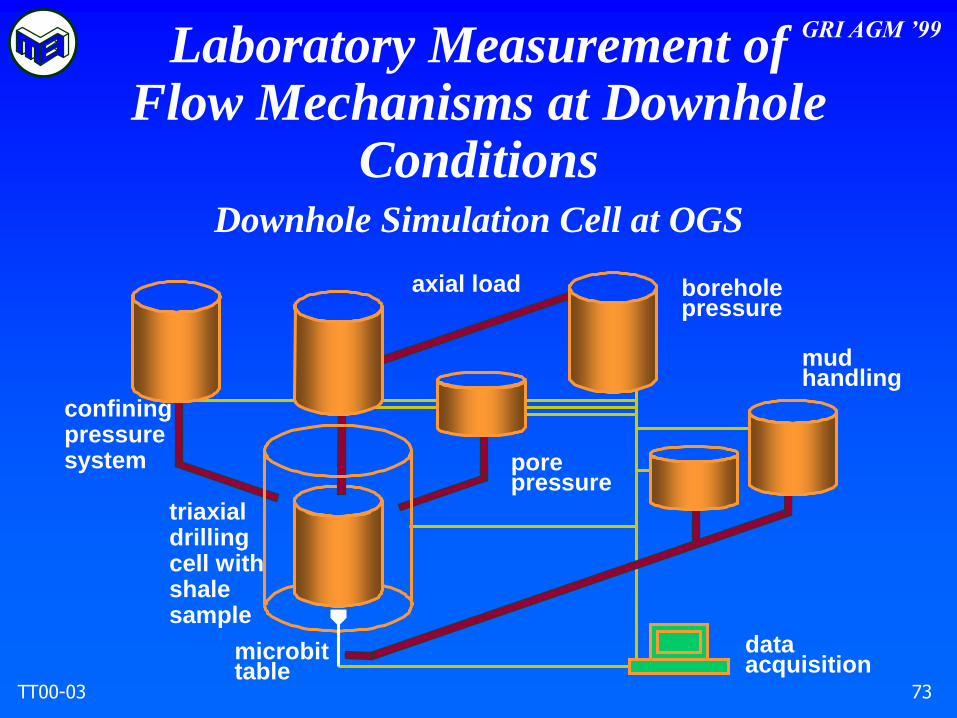
Laboratory Measurement ofFlow Mechanisms at Downhole
Conditions
dataacquisition
boreholepressure
axial load
pore pressure
confiningpressuresystem
microbittable
triaxialdrillingcell withshalesample
mudhandling
Downhole Simulation Cell at OGS
GRI AGM ’99
TT00-03 74
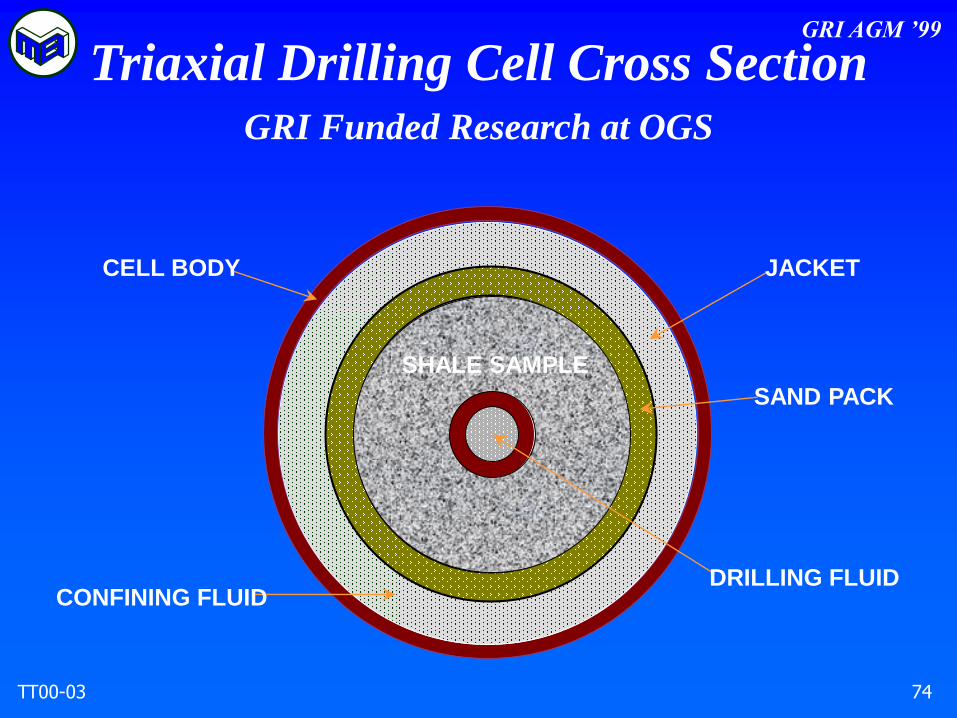
Triaxial Drilling Cell Cross SectionGRI Funded Research at OGS
SHALE SAMPLE
JACKET
SAND PACK
DRILLING FLUID
CELL BODY
CONFINING FLUID
GRI AGM ’99
TT00-03 75
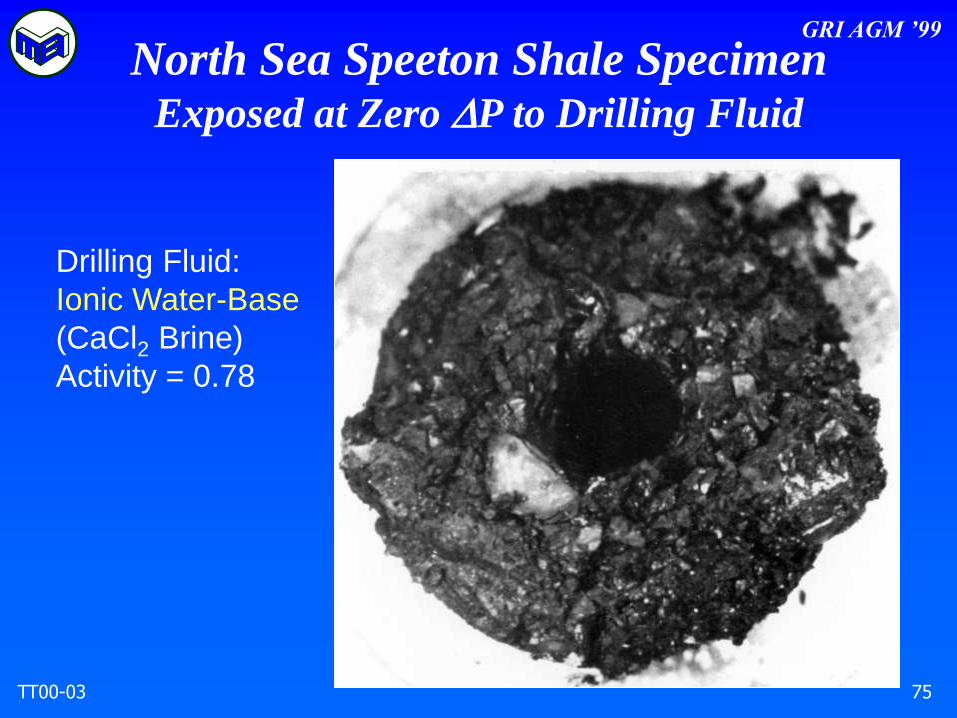
North Sea Speeton Shale SpecimenExposed at Zero P to Drilling Fluid
Drilling Fluid:
Ionic Water-Base
(CaCl2 Brine)
Activity = 0.78
GRI AGM ’99
TT00-03 76
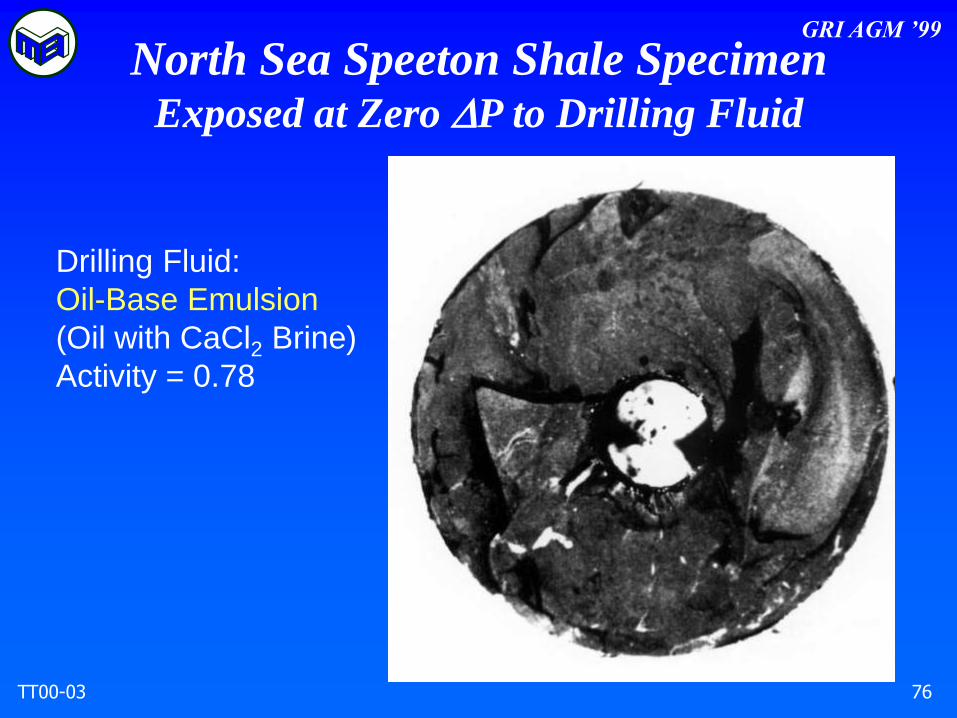
North Sea Speeton Shale SpecimenExposed at Zero P to Drilling Fluid
Drilling Fluid:
Oil-Base Emulsion
(Oil with CaCl2 Brine)
Activity = 0.78

GRI AGM ’99
TT00-03 77
North Sea Speeton
Shale SpecimenExposed at Zero P to
Drilling Fluid
Drilling Fluid:
Non-Ionic Water-Base
(Methyl Glucoside in
Fresh Water)
Activity = 0.78
GRI AGM ’99
TT00-03 78
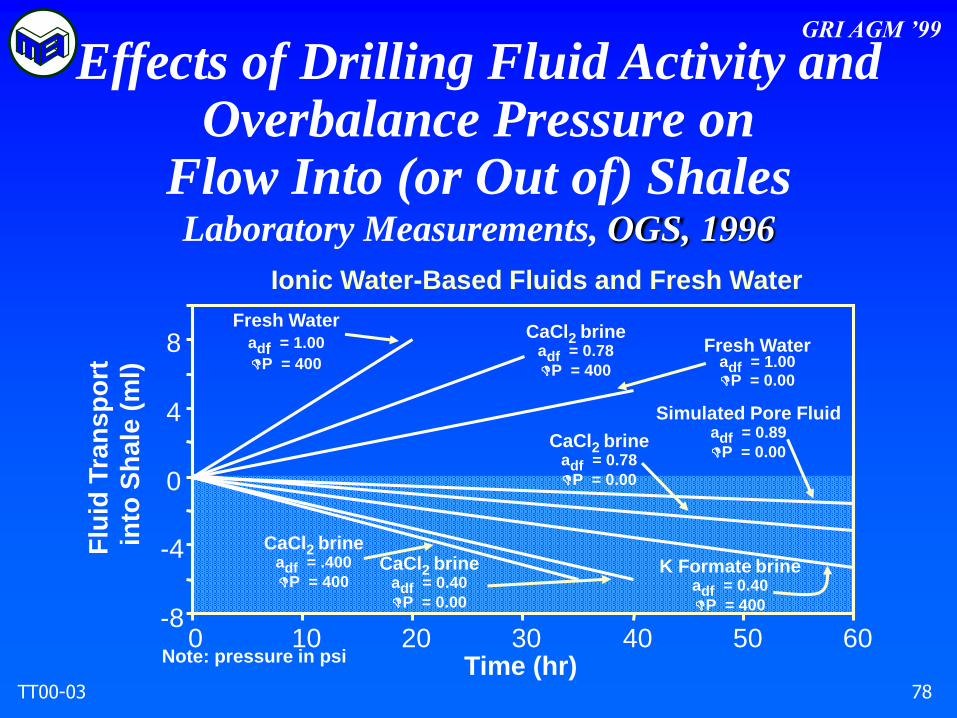
Effects of Drilling Fluid Activity andOverbalance Pressure on
Flow Into (or Out of) ShalesLaboratory Measurements, OGS, 1996
-8
-4
0
4
8
0 10 20 30 40 50 60
Flu
id T
ran
sp
ort
into
Sh
ale
(m
l)
Time (hr)
Fresh Wateradf = 1.00
DP = 400
CaCl2 brineadf = 0.78
DP = 400
Fresh Wateradf = 1.00DP = 0.00
Simulated Pore Fluidadf = 0.89
DP = 0.00CaCl2 brine
adf = 0.78
DP = 0.00
K Formate brineadf = 0.40
DP = 400
CaCl2 brineadf = .400
DP = 400CaCl2 brine
adf = 0.40
DP = 0.00
Note: pressure in psi
Ionic Water-Based Fluids and Fresh Water
GRI AGM ’99
TT00-03 79
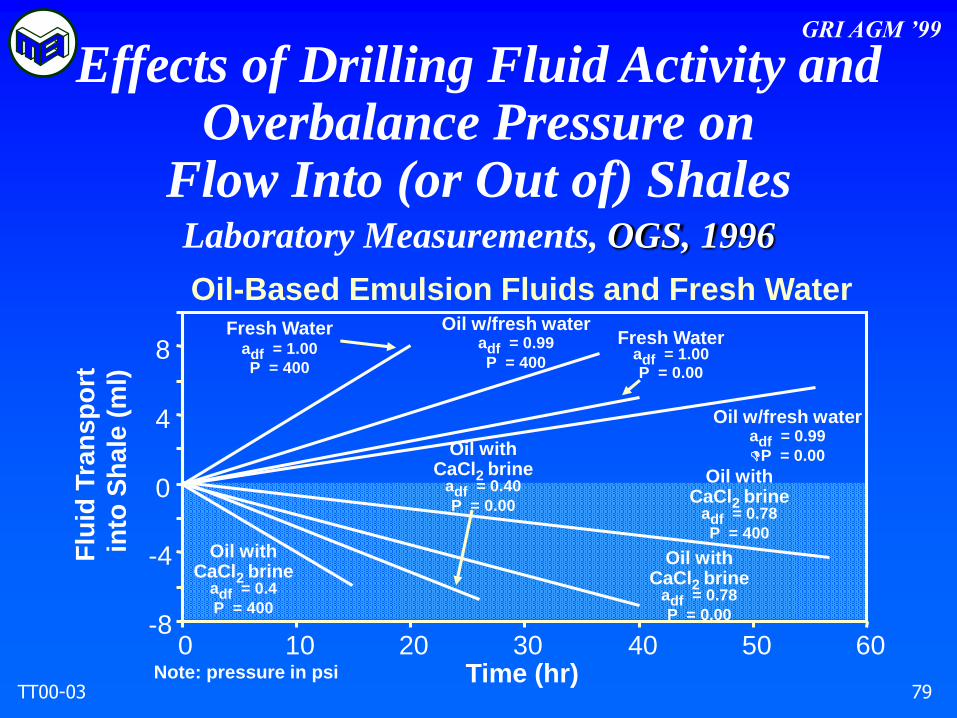
Effects of Drilling Fluid Activity andOverbalance Pressure on
Flow Into (or Out of) ShalesLaboratory Measurements, OGS, 1996
-8
-4
0
4
8
0 10 20 30 40 50 60
Flu
id T
ran
sp
ort
into
Sh
ale
(m
l)
Time (hr)
Fresh Wateradf = 1.00
P = 400
Oil w/fresh wateradf = 0.99
P = 400
Fresh Wateradf = 1.00P = 0.00
Oil w/fresh wateradf = 0.99
DP = 0.00
Oil withCaCl2 brine
adf = 0.78
P = 400
Oil withCaCl2 brine
adf = 0.4
P = 400
Oil withCaCl2 brine
adf = 0.40
P = 0.00
Oil withCaCl2 brine
adf = 0.78
P = 0.00
Note: pressure in psi
Oil-Based Emulsion Fluids and Fresh Water

GRI AGM ’99
TT00-03 80
Effects of Drilling Fluid Activity andOverbalance Pressure on
Flow into (or out of) Shales
-8
-4
0
4
8
0 10 20 30 40 50 60
Flu
id T
ran
sp
ort
in
to S
ha
le (
ml)
Time (hr)
Fresh Wateradf = 1.00P = 400
Fresh Wateradf = 1.00P = 0.00
NaClbrine/MEG (30%)adf = 0.78P = 400
Note: pressure in psi
Fresh Water/Glyceroladf = 0.78P = 400 Fresh Water/ MEG (68%)
adf = 0.78P = 400
Fresh Water/ MEG (68%)adf = 0.78P = 0.00
Non-ionic Water-based Fluids
Laboratory Measurements, OGS, 1996

GRI AGM ’99
TT00-03 81
UT Austin (Chenevert)
GRI AGM ’99
TT00-03 82
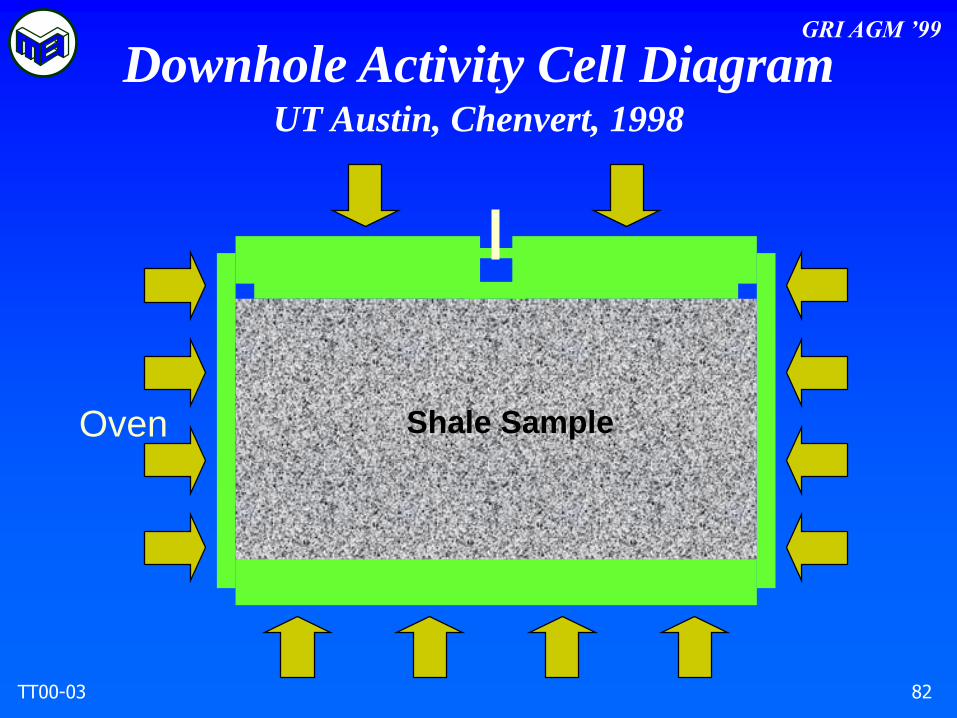
Oven Shale Sample
Downhole Activity Cell DiagramUT Austin, Chenvert, 1998
GRI AGM ’99
TT00-03 83
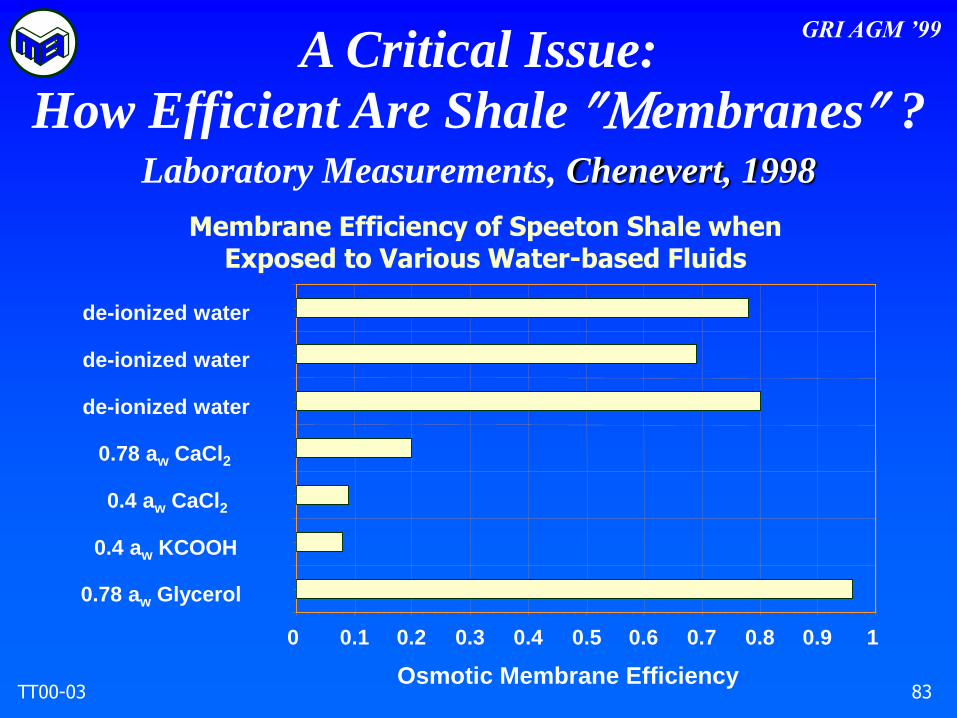
A Critical Issue:
How Efficient Are Shale embranes ?Laboratory Measurements, Chenevert, 1998
Membrane Efficiency of Speeton Shale whenExposed to Various Water-based Fluids
0 0.1 0.2 0.3 0.4 0.5 0.6 0.7 0.8 0.9 1
de-ionized water
de-ionized water
de-ionized water
0.78 aw CaCl2
0.4 aw CaCl2
0.4 aw KCOOH
0.78 aw Glycerol
Osmotic Membrane Efficiency

GRI AGM ’99
TT00-03 84
Effect of Fluid/Shale Interaction
on Rock StrengthLaboratory Measurements, Chenevert, 1998
0 1000 2000 3000 4000 5000 6000 7000 8000
de-ionized water
de-ionized water
de-ionized water
0.78 aw CaCl2
0.4 aw CaCl2
0.4 aw KCOOH
0.78 aw Glycerol
0.78 aw MEG
0.78 aw NaCl/MEG
de-ionized water
simulated pore fluid
Deviatoric Stress at Failure (psi)
Strength of Speeton Shale after Exposure to Fluids

GRI AGM ’99
TT00-03 85
2500
2000
1500
1000
500
0
0 1000 2000 3000 4000 5000
a = 0.96mud
0.93
0.915
0.90
0.87
0.84
0.81
0.78
0.75
J (psi)1
J
2
½ (p
si)
Membrane Efficiency = 1
No Chemical Effect(a = a )mud shale
Effect of Mud Activity
on Stress State at Wellbore WallFonseca et al., 1996
GRI AGM ’99
TT00-03 86
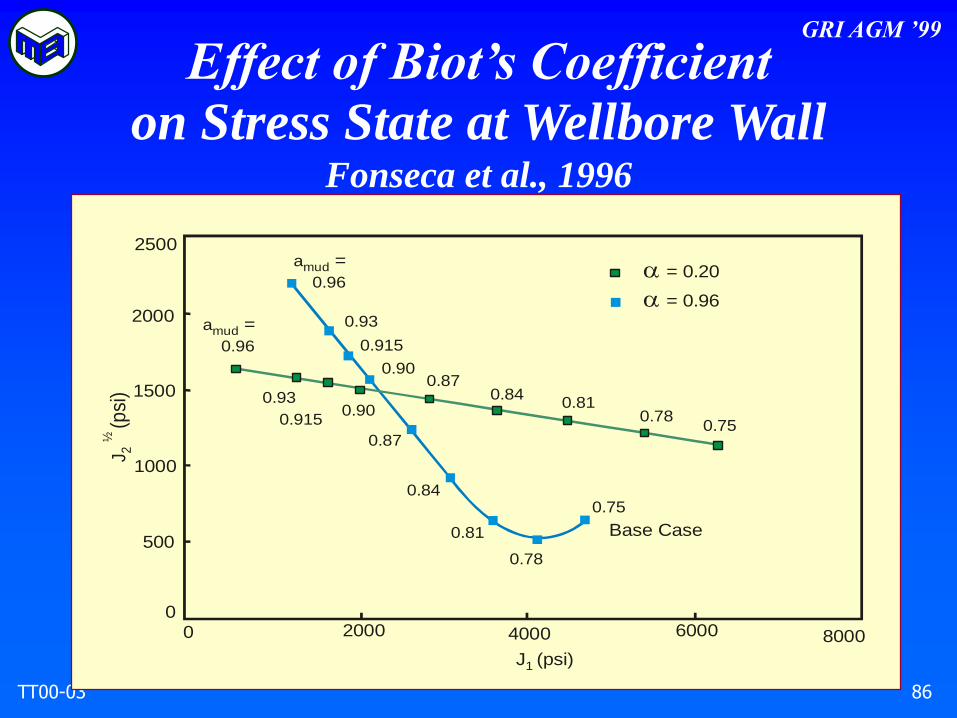
Base Case
J1 (psi)
J
2
½ (p
si)
a
0.96mud =
0.915
0.870.84
0.810.78
0.750.90
0.93
2500
2000
1500
1000
500
00 2000 4000 6000 8000
a
a
= 0.20
= 0.96
a
0.96mud =
0.93
0.915
0.90
0.87
0.84
0.81
0.78
0.75
Effect of Biot’s Coefficient
on Stress State at Wellbore WallFonseca et al., 1996

GRI AGM ’99
TT00-03 87
12
10
8
6
4
2
0
0 1 2 3 4 5
Con
finin
g P
ress
ure
(ps
i)1
000
Time (hr)
Swelling Pressure History for Speeton Shale
Exposed to a 0.4 AW KCOOH SolutionChenevert, 1998

GRI AGM ’99
TT00-03 88
7.5
6.5
5.5
4.5
3.5
0 5 10 15 20
Time (hr)
Con
finin
g P
ress
ure
(psi
)
1000
Swelling Pressure History for Speeton Shale
Exposed to a 0.78 AW Glycerol SolutionChenevert, 1998
GRI AGM ’99
TT00-03 89
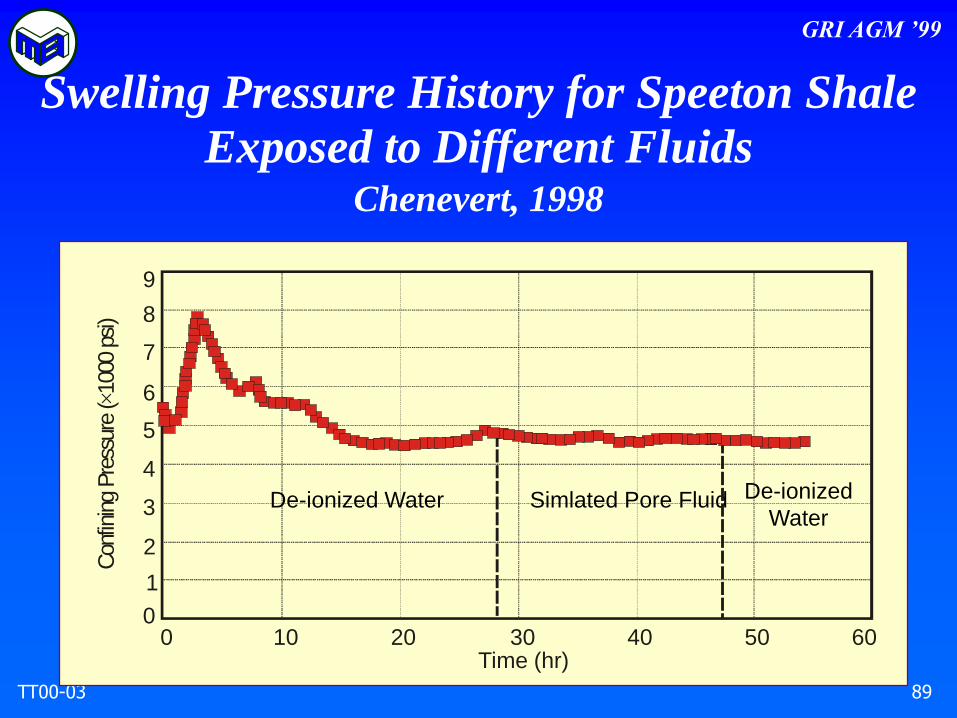
9
8
7
6
5
4
3
2
1
00 10 20 30 40 50 60
De-ionized Water Simlated Pore Fluid De-ionized
Water
Time (hr)
Con
fi nin
gPre
s su r
e(
100
0)
ps
iSwelling Pressure History for Speeton Shale
Exposed to Different FluidsChenevert, 1998

GRI AGM ’99
TT00-03 90
UT Austin (Morriss)

GRI AGM ’99
TT00-03 91
Velocity as a Function of Water Content for the Electro-Osmosis Test Samples
Davidson & Morriss, 1994

GRI AGM ’99
TT00-03 92
Magnitude of the Complex Reflection Coefficient as a Function of the Water Content
Davidson & Morriss, 1994

GRI AGM ’99
TT00-03 93
Velocity vs Water Content for theElectro-Osmosis Test Samples
Davidson & Morriss, 1994

GRI AGM ’99
TT00-03 94
Acoustic Reflection Coefficient for a Hydrating Sample of Wellington Shale
Davidson & Morriss, 1994

GRI AGM ’99
TT00-03 95
H3H2 H4 H5 H6 H8 H8 H9 H104
Sample slices
Wat
erc o
nten
t (%
wei
ght)
orBHN
BHN
Sample slices
Wat
erc o
nte n
t (%
wei
ght )
orBHN 8
9
7
6
5
Water %
Water Content and BHN of Pierre IAdisoemarta & Morriss, 1994

GRI AGM ’99
TT00-03 96
1211 13 14 15 16 17 18
9
8
7
6
5
4
Sample slices
Wat
erco
nten
t (%
wei
ght)
orBHN
Water %
BHN
3
Water Content and BHN of Pierre IIAdisoemarta & Morriss, 1994
GRI AGM ’99
TT00-03 97
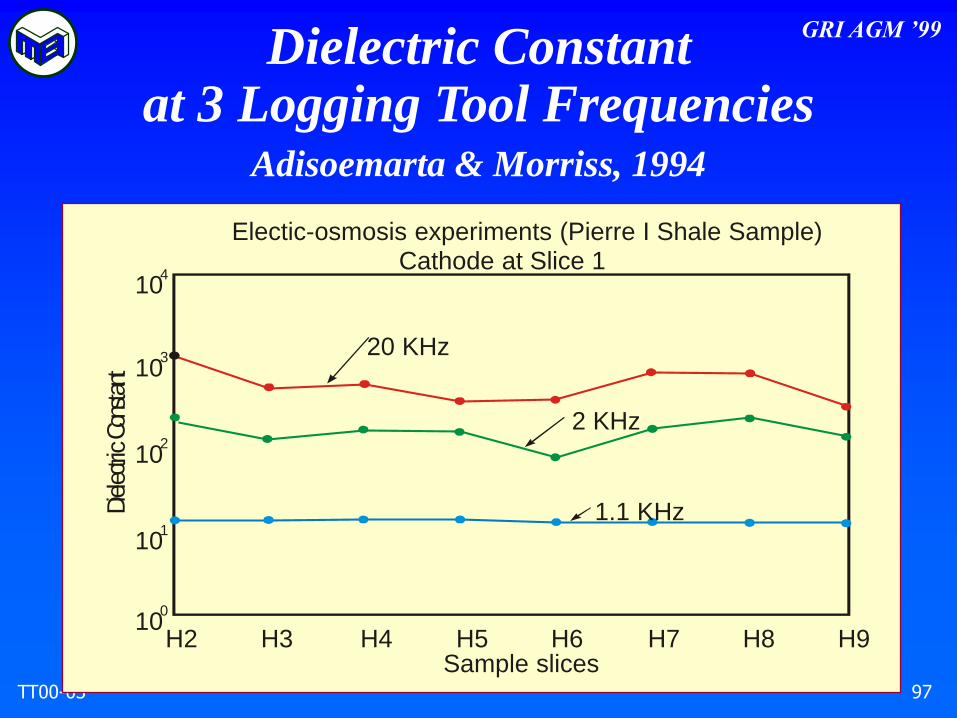
H3H2 H4 H5 H6 H7 H8 H9
104
103
102
101
Sample slices
Dielec tric
Co n
s ta n
t
20 KHz
1.1 KHz
2 KHz
Electic-osmosis experiments (Pierre I Shale Sample)Cathode at Slice 1
100
Dielectric Constantat 3 Logging Tool Frequencies
Adisoemarta & Morriss, 1994

GRI AGM ’99
TT00-03 98
H3H2 H4 H5 H6 H7 H8 H9
100
10-1
10-2
Sample slices
Ele
ctr ic
alPro
pert i
es
Dissipation Factor
Conductivity
Susceptivity
Electic-osmosis experiments (Pierre I Shale Sample)
Cathode at Slice 1
10-3
Electrical Properties at 2 MHzAdisoemarta & Morriss, 1994

GRI AGM ’99
TT00-03 99
H3H2 H4 H5 H6 H7 H8 H9
0.9
0.8
0.3
Sample slices
El e
c tric
a lPro
per t i
es
Dissipation Factor
Conductivity
Susceptivity
Electic-osmosis experiments (Pierre I Shale Sample)
Cathode at Slice 1
H1
0.7
0.6
0.5
0.4
0.2
0.1
0.0
Electrical Properties at 1.1 GHzAdisoemarta & Morriss, 1994
GRI AGM ’99
TT00-03 100
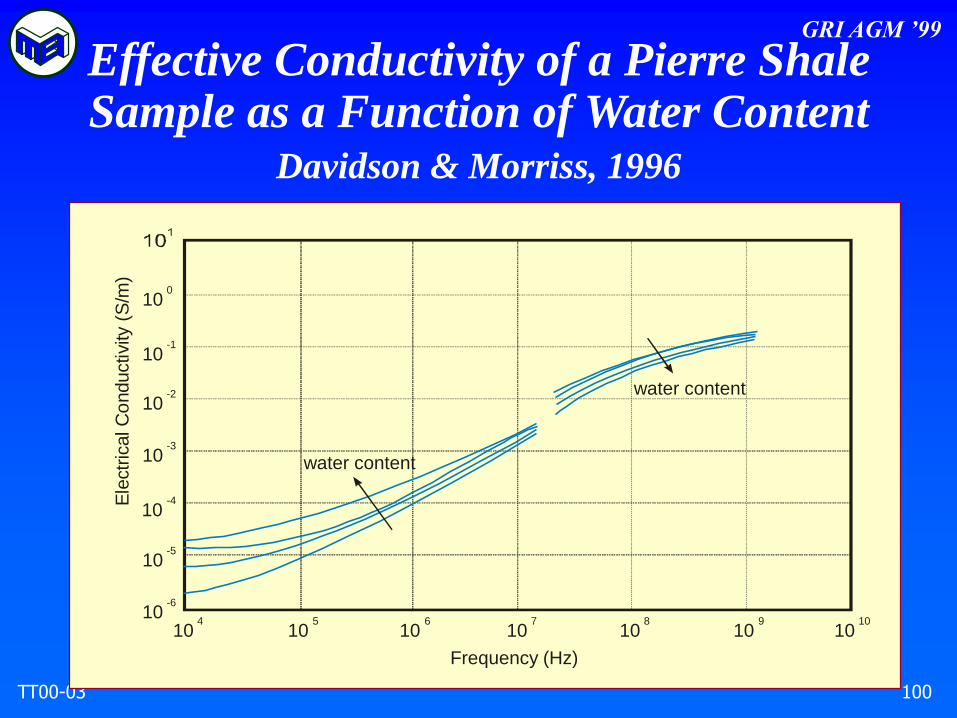
105
106
107
108
109
1010
100
10-1
10-5
Frequency (Hz)
water content
water content
Ele
ctr
icalC
onductivity
(S/m
)
104
10-2
10-3
10-4
10-6
Effective Conductivity of a Pierre Shale Sample as a Function of Water Content
Davidson & Morriss, 1996

GRI AGM ’99
TT00-03 101
Change in the Calculated Velocityas the Shale Surface Rehydrates
Davidson & Morriss, 1996

GRI AGM ’99
TT00-03 102
Induced DC Potential (Wellington Shale)Davidson & Morriss, 1994

GRI AGM ’99
TT00-03 103
Induced DC for Various Materials
Davidson & Morriss, 1994

GRI AGM ’99
TT00-03 104
Induced DCfor a Thin Wellington Shale Sample
Davidson & Morriss, 1994

GRI AGM ’99
TT00-03 105
Induced DCfor a Thick Wellington Shale Sample
Davidson & Morriss, 1994
GRI AGM ’99
TT00-03 106
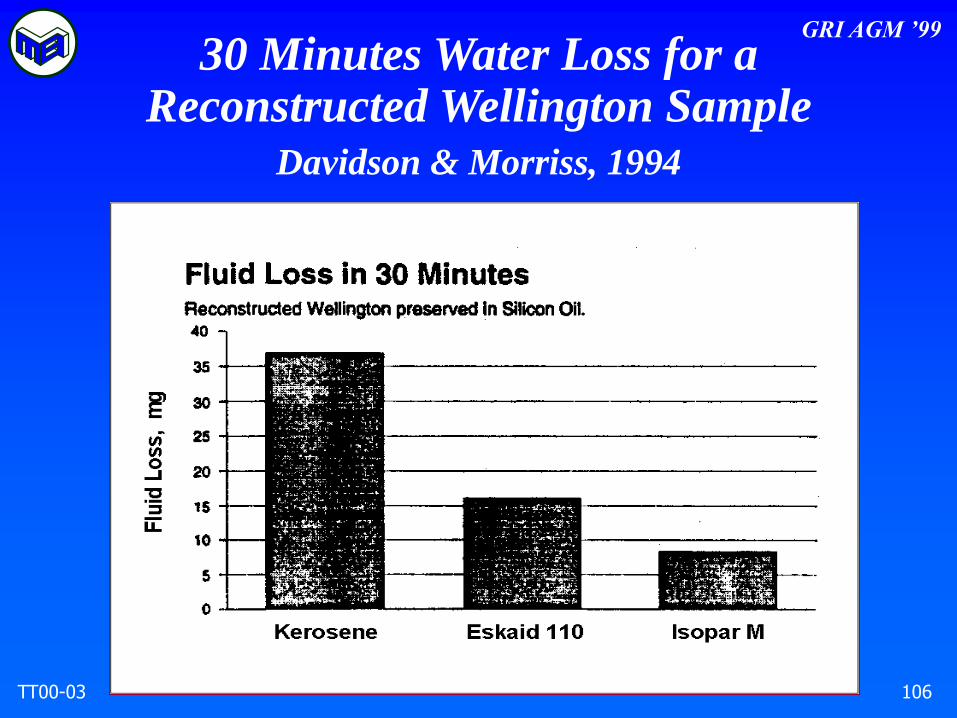
30 Minutes Water Loss for aReconstructed Wellington Sample
Davidson & Morriss, 1994
GRI AGM ’99
TT00-03 107
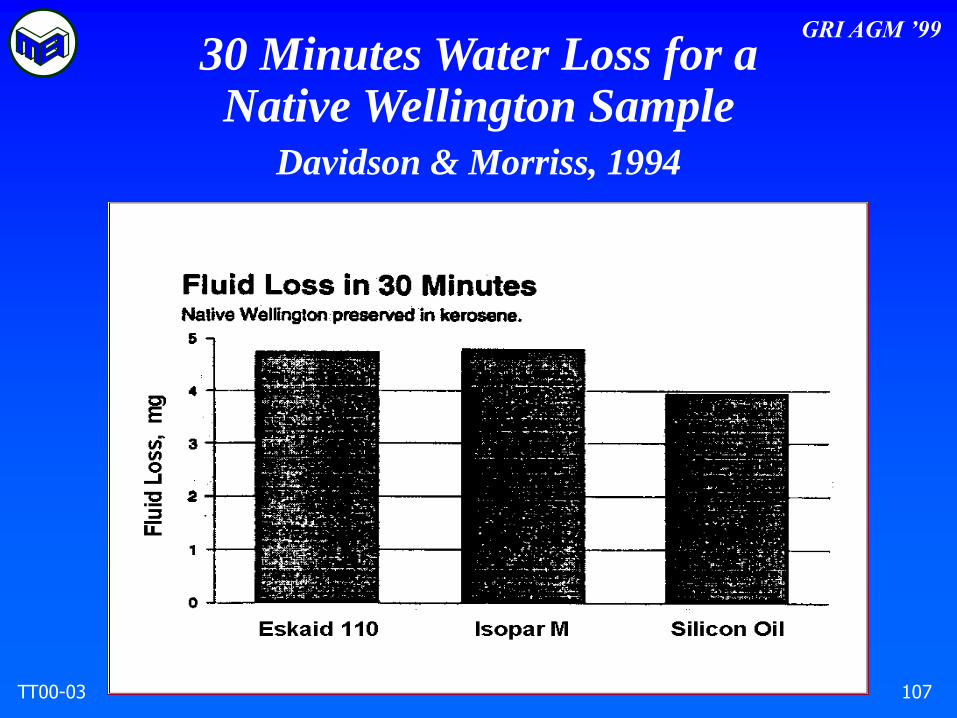
30 Minutes Water Loss for aNative Wellington Sample
Davidson & Morriss, 1994
GRI AGM ’99
TT00-03 108
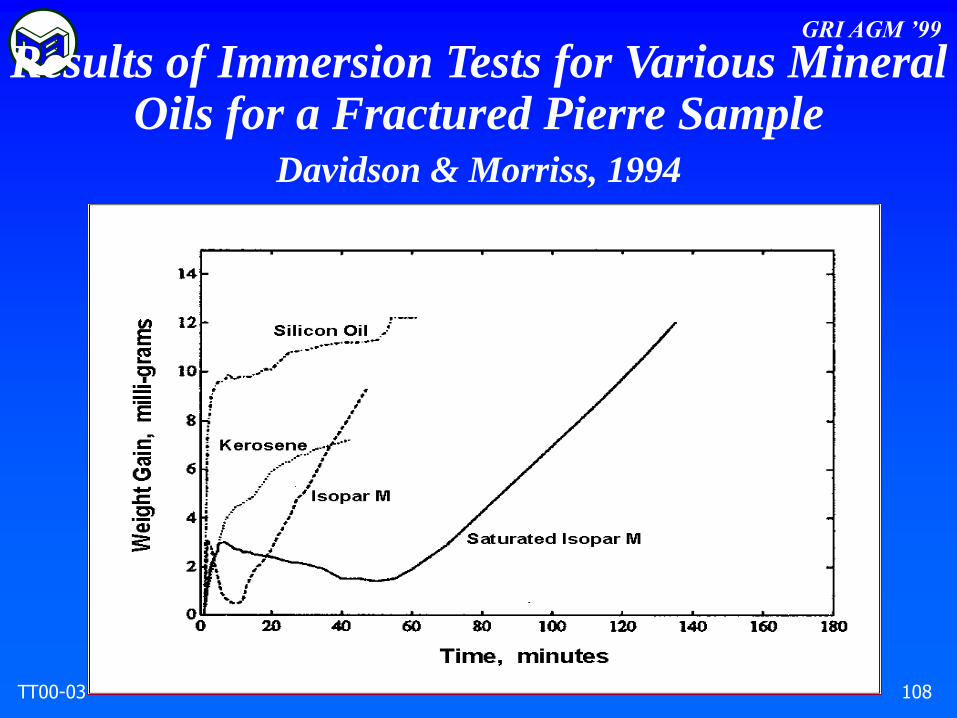
Results of Immersion Tests for Various Mineral Oils for a Fractured Pierre Sample
Davidson & Morriss, 1994

GRI AGM ’99
TT00-03 109
Results of Immersion Tests for for an Undamaged Pierre Sample
Davidson & Morriss, 1994
GRI AGM ’99
TT00-03 110
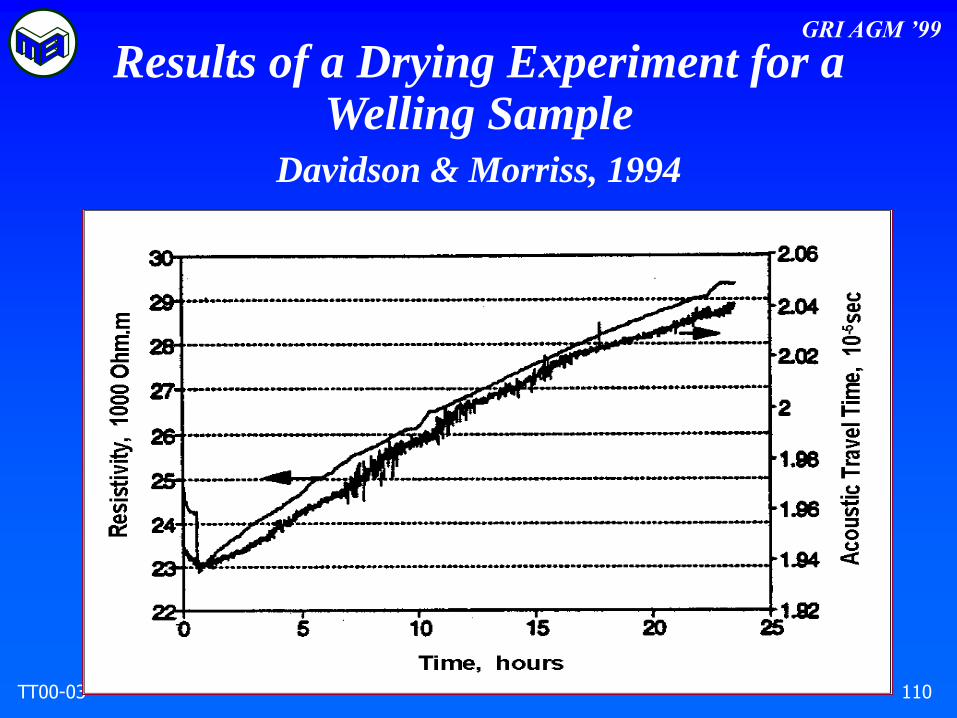
Results of a Drying Experiment for aWelling Sample
Davidson & Morriss, 1994

GRI AGM ’99
TT00-03 111
P- and S-Wave Transmitter
P- and S-Wave Receiver
Load
Load
Sleeve
Oil Pressure
Core
Pore Pressure
Vented to the
Atmosphere
Configuration for the Triaxial Loading TestDavidson & Morriss, 1998

GRI AGM ’99
TT00-03 112
Compressional Wave Amplitudeas a Function of Strain
(North Sea Shale under Triaxial Loading)Davidson & Morriss, 1994

GRI AGM ’99
TT00-03 113
• CSIRO (Australia)
• Shell (Netherlands)
• Baroid
•AGIP (Italy)
•ELF Aquitaine (France)
•Exxon
•IKU (Norway)
•Schlumberger (UK)
•Institut Francais du Petrole (France)
•University of Calgary (Canada)
•University of Oklahoma
•University of Waterloo (Canada)
Other Groups (Worldwide)
GRI AGM ’99
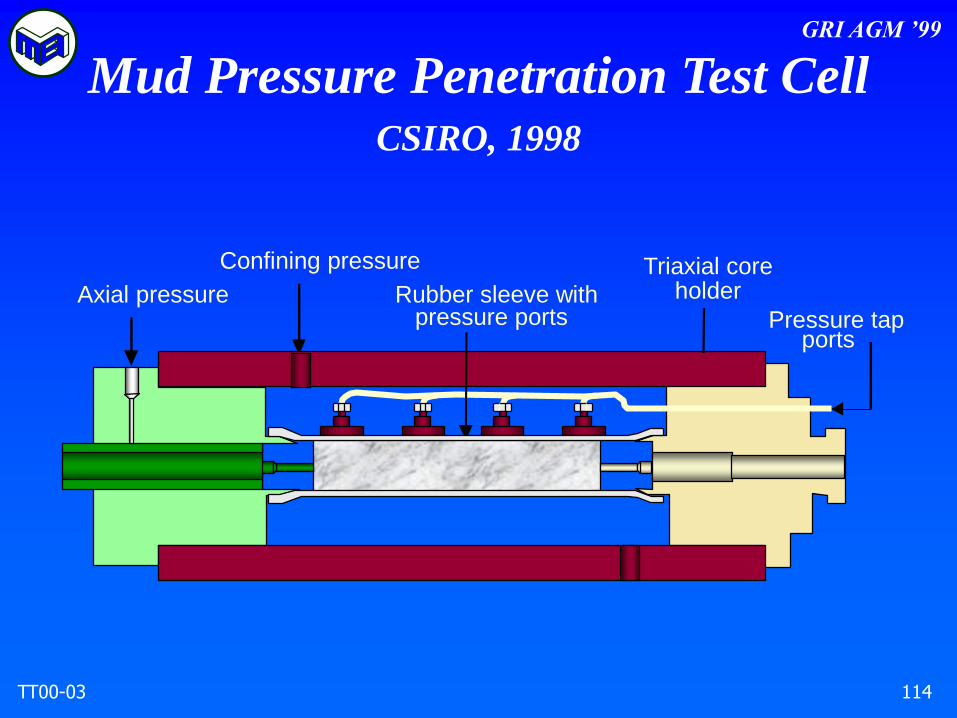
TT00-03 114
Axial pressure
Confining pressure
Rubber sleeve withpressure ports
Triaxial core holder
Rock sample
Pressure tap ports
Mud Pressure Penetration Test CellCSIRO, 1998

GRI AGM ’99
TT00-03 115
Porous disk
Simulatedpore fluid
Axial pressure
Rubber jacket Confining pressure
Shale sample
Drilling fluidfiltrate
Chemical Potential Test Equipment
CSIRO, 1998

GRI AGM ’99
TT00-03 116
Jacket
LVDT(displacement
transducer)
Load cell
Sample
Radial strainguage
Swelling and
Hydrational
Stress Test Cell
CSIRO, 1998

GRI AGM ’99
TT00-03 117
Insulated electric lead
O-ring seals
Inner rubbermembrane
Outer rubber membrane
Pore fluid inletBorehole fluid inlet
Mud filtrate inlet
Rock Sample
Borehole gauge
Mud filtratecirculation path
Borehole Collapse Test DiagramCSIRO, 1998

GRI AGM ’99
TT00-03 118
ModeledMeasured 1.1 hrsMeasured 3.0 hrsMeasured 5.1 hrsMeasured 10.0 hrsMeasured 15.0 hrsMeasured 19.8 hrs
0 0.5 0.1 0.15 0.24.5
5.5
6.5
7.5
8.5
Distance From Elevated Pressure End (m)
Pre
ssu r
e(M
P a)
1.1 hrs
3.0 hrs
5.1 hrs10.0 hrs
15.0 hrs
19.8 hrs
Measured and Modeled Pore Pressurewithin a Shale Sample
(Mud Pressure Penetration Test)CSIRO, Tan, 1998
GRI AGM ’99
TT00-03 119
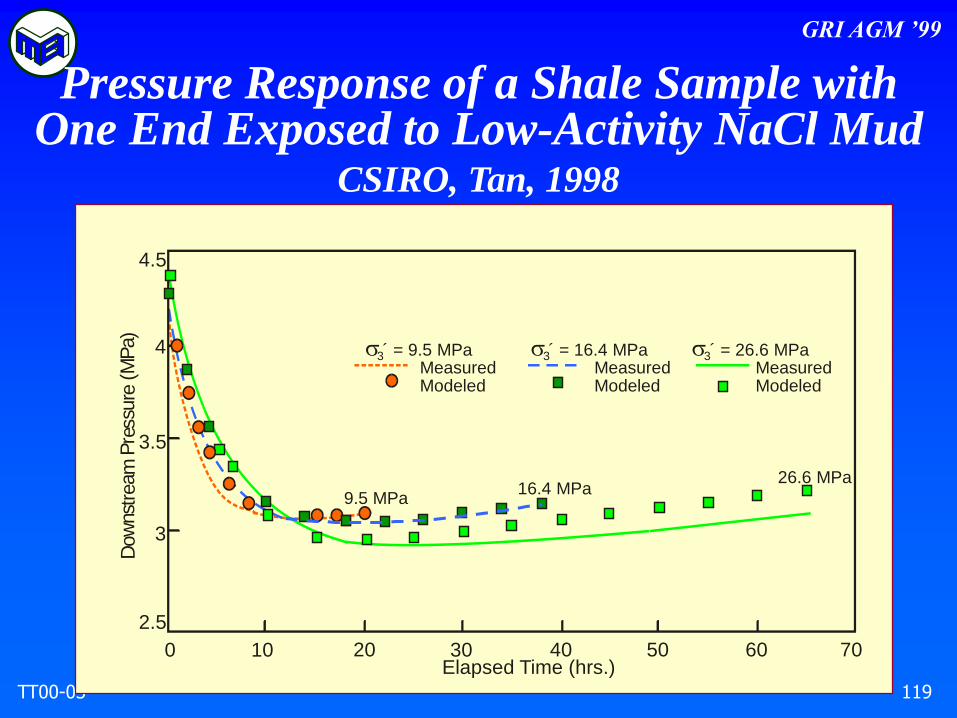
0 10 20 30 40 50 60 70
4.5
3.5
2.5
4
3
Dow
ns t
r eam
Pr e
ssur e
(MP
a)
Elapsed Time (hrs.)
MeasuredModeled
MeasuredModeled
MeasuredModeled
3́ = 9.5 MPa 3́ = 16.4 MPa 3´ = 26.6 MPa
9.5 MPa16.4 MPa
26.6 MPa
Pressure Response of a Shale Sample withOne End Exposed to Low-Activity NaCl Mud
CSIRO, Tan, 1998
GRI AGM ’99
TT00-03 120
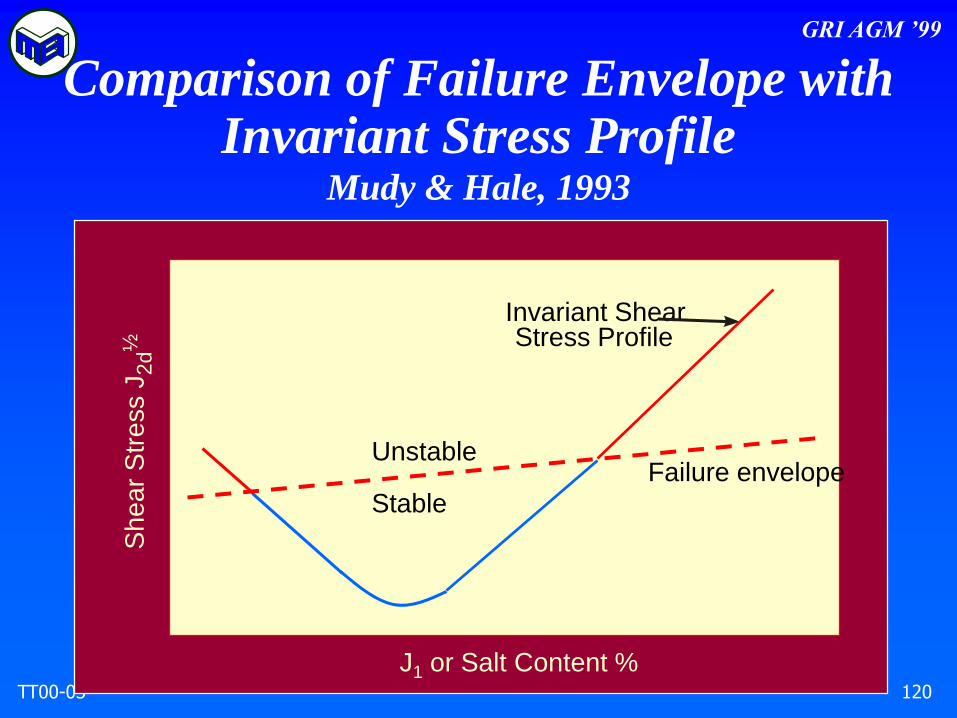
J1 or Salt Content %
Invariant ShearStress Profile
Unstable
StableFailure envelope
Sh
ea
r S
tre
ss
J2
d½
Comparison of Failure Envelope withInvariant Stress Profile
Mudy & Hale, 1993
GRI AGM ’99
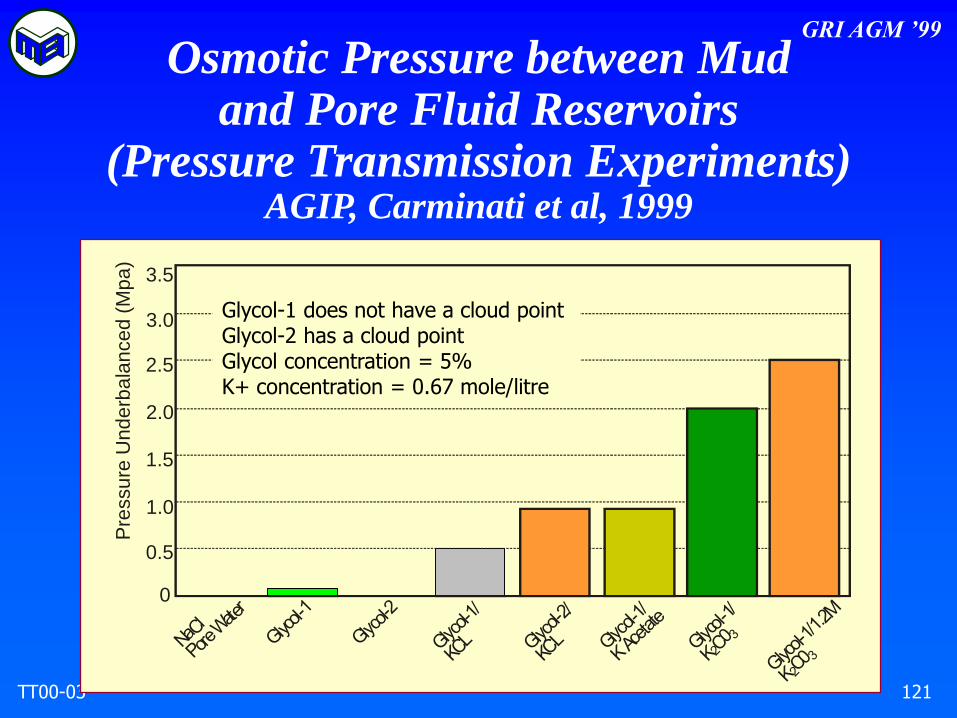
TT00-03 121
Osmotic Pressure between Mudand Pore Fluid Reservoirs
(Pressure Transmission Experiments)AGIP, Carminati et al, 1999
3.5
3.0
2.5
2.0
1.5
1.0
0.5
0
Pre
ssu
re U
nd
erb
ala
nce
d (
Mp
a)
Glycol-1 does not have a cloud pointGlycol-2 has a cloud pointGlycol concentration = 5%K+ concentration = 0.67 mole/litre
GRI AGM ’99
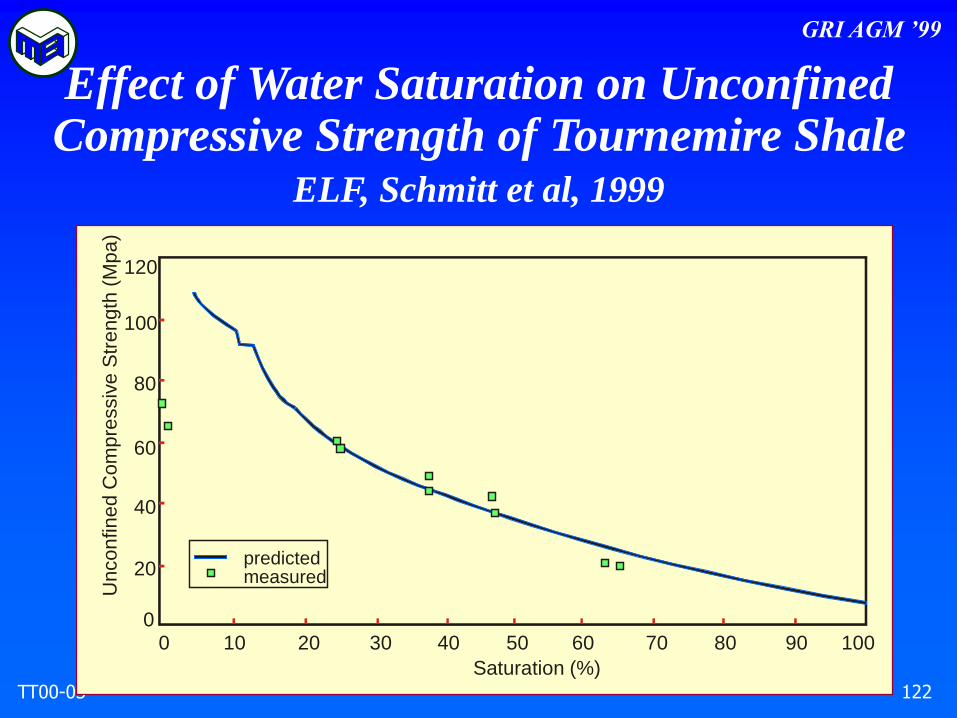
TT00-03 122
predictedmeasured
120
100
80
60
40
20
00 10 20 30 40 50 60 70 80 90 100
Saturation (%)
Un
co
nfin
ed
Com
pre
ssiv
e S
tre
ng
th (
Mp
a)
Effect of Water Saturation on Unconfined Compressive Strength of Tournemire Shale
ELF, Schmitt et al, 1999
GRI AGM ’99
TT00-03 123
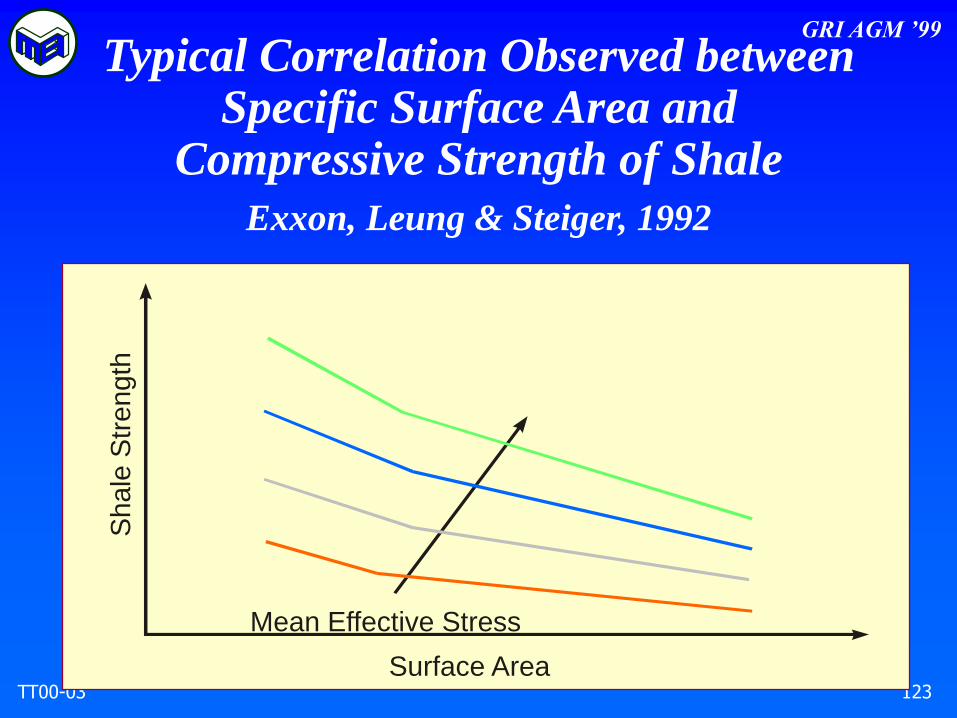
Mean Effective Stress
Surface Area
Shale
Str
ength
Typical Correlation Observed betweenSpecific Surface Area and
Compressive Strength of Shale
Exxon, Leung & Steiger, 1992
GRI AGM ’99
TT00-03 124
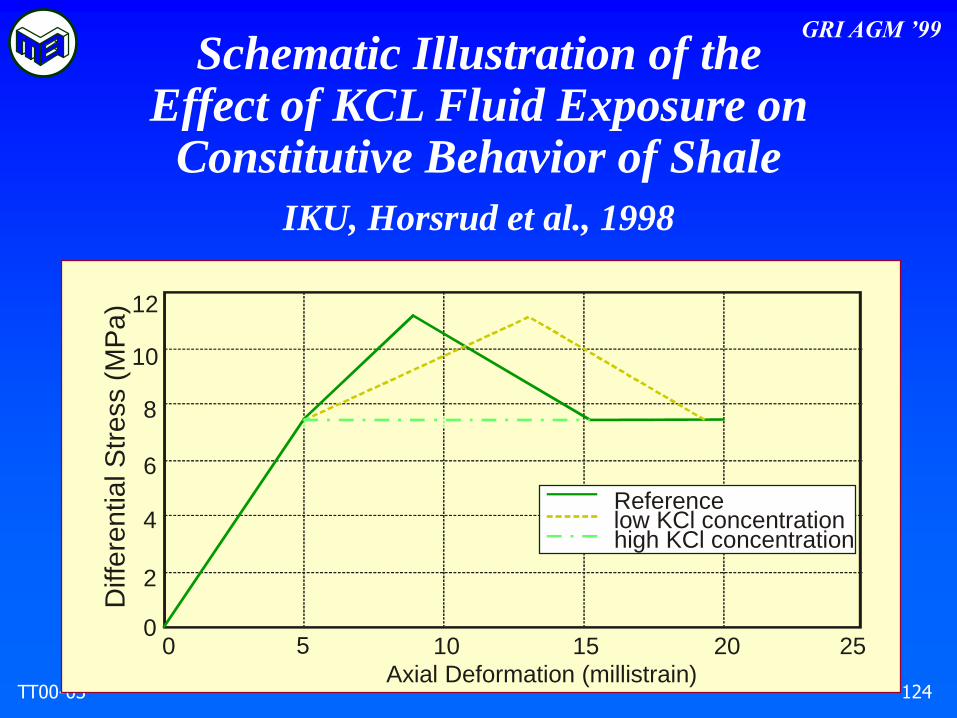
0 5 10 15 20 250
2
4
6
8
10
12
Axial Deformation (millistrain)
Referencelow KCl concentrationhigh KCl concentration
Diffe
rential S
tress (
MP
a)
Schematic Illustration of theEffect of KCL Fluid Exposure on
Constitutive Behavior of Shale
IKU, Horsrud et al., 1998

GRI AGM ’99
TT00-03 125
2.8 hrs14 hrs28 hrs
139 hrs
0.18
0.16
0.14
0.12
0.10
0.08
0.06
0.04
0.02
01 1.05 1.1 1.15 1.2
Radial Distance r/rw
Co
ncen
tra
tion
C
Calculated KCl Concentrationin the Shale Rock Mass around a Wellbore
IKU, Bostrom et al., 1998
GRI AGM ’99
TT00-03 126
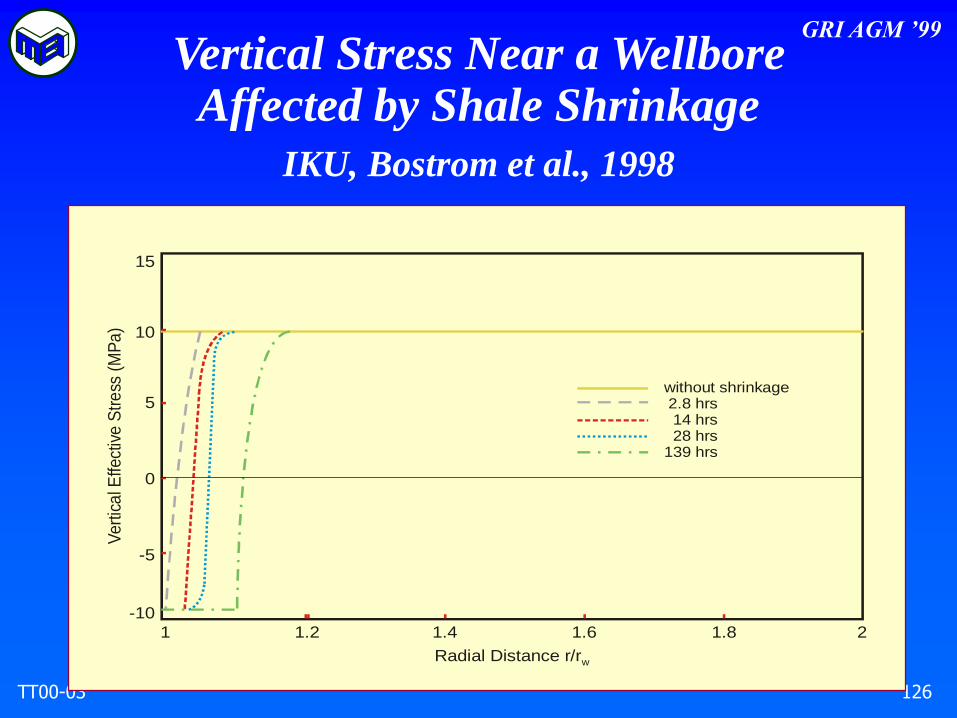
without shrinkage 2.8 hrs 14 hrs 28 hrs139 hrs
15
10
5
0
-5
-10
1 1.2 1.4 1.6 1.8 2
Radial Distance r/rw
Vert
ica
l Effect
ive
Str
ess
(M
Pa
)
Vertical Stress Near a WellboreAffected by Shale Shrinkage
IKU, Bostrom et al., 1998
GRI AGM ’99
TT00-03 127
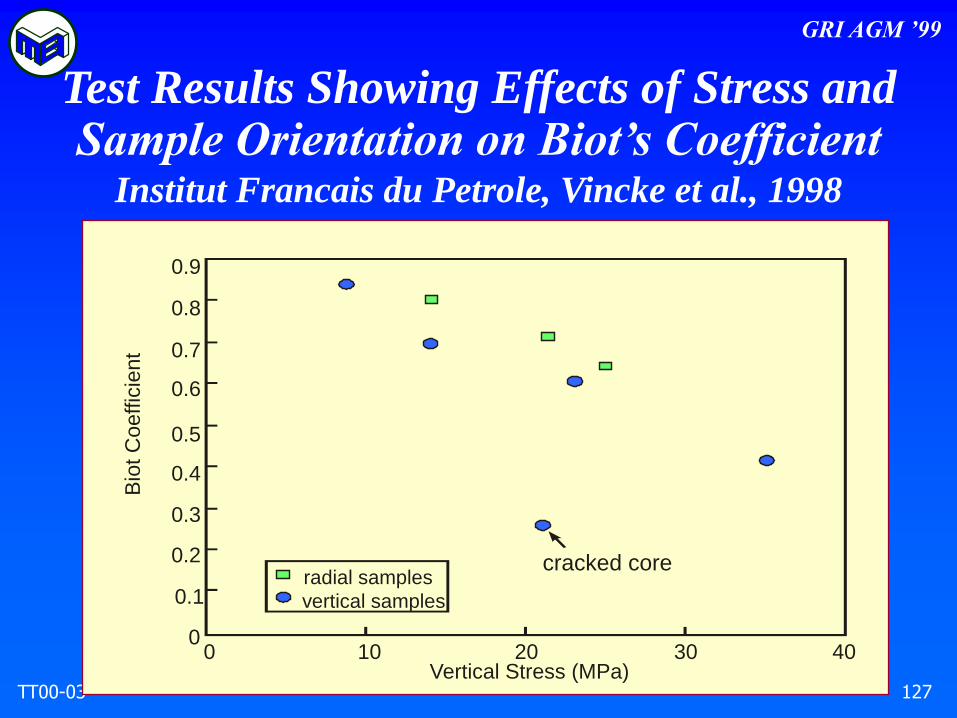
cracked coreradial samples
vertical samples
0 10 20 30 400
0.1
0.2
0.3
0.4
0.5
0.6
0.7
0.8
0.9
Vertical Stress (MPa)
Bio
t C
oeffic
ient
Test Results Showing Effects of Stress and Sample Orientation on Biot’s Coefficient
Institut Francais du Petrole, Vincke et al., 1998

GRI AGM ’99
TT00-03 128
0
5
10
15
(R/r
) X10
0p
wl
0 0.2 0.4 0.6 0.8 1Time (hour)
WBM P - P = 5 MPaw fm
a = 0.95 a = 0.9shmud
WBM P - P = 5 MPawfm
a = ashmud
OBM P - P = 6 MPaw fm
Model Prediction of Plastic ZoneThickness (Rpl ) as a Function of
Mud Type, Mud Activity and Overbalance PressureIKU, Onaisi et al., 1994

GRI AGM ’99
TT00-03 129
Cross-Section of Failure around a Thick-Walled Cylinder Specimen (Bedding planes parallel to the drilled hole)
Schlumberger,
Okland & Cook, 1998

GRI AGM ’99
TT00-03 130
a b
qp
Pw
1 Yielded zone
2
Angular Extent of Yielded Zone (qp ) Predicted
by Analytical Elastioplastic ModelSchlumberger, Bradford et al., 1998

GRI AGM ’99
TT00-03 131
porous disk
radial
Upstream Reservoir
inlet outlet
capillary buret
pressurized sleeve
porous disk
radial
steel piston Downstream Reservoir
valve
pressure transducer
shalesample
axial axial
Experimental Apparatus Used for Pressure
Transmission and Osmosis TestsExxon, van Oort et al., 1996
GRI AGM ’99
TT00-03 132
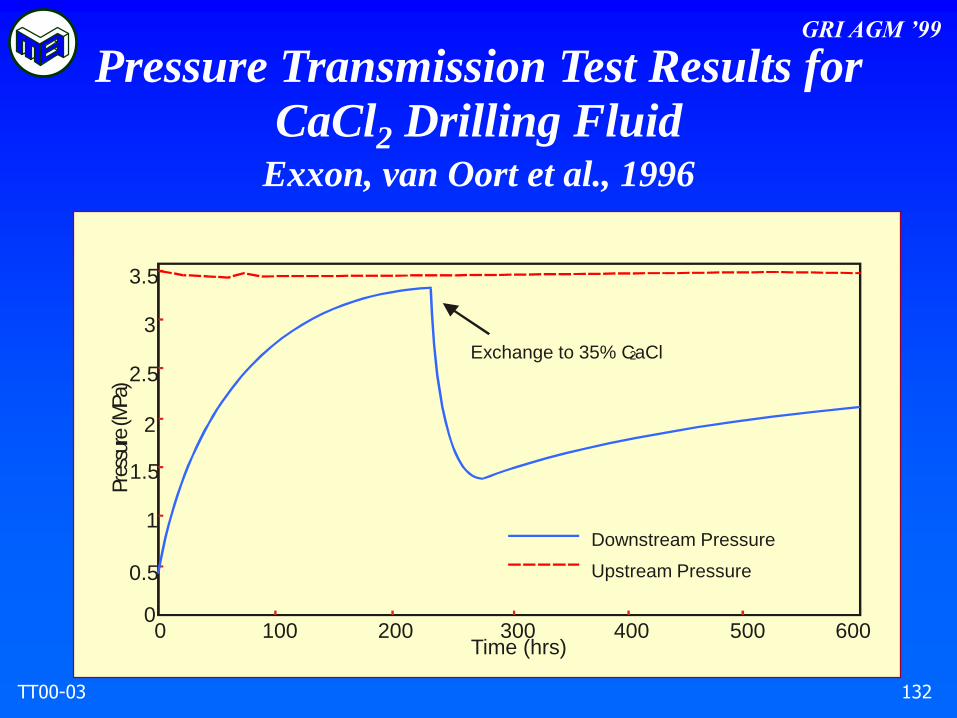
Exchange to 35% CaCl2
Downstream Pressure
Upstream Pressure
600500400300200100Time (hrs)
00
0.5
1
1.5
2
2.5
3
3.5
Pre
s sur
e( M
Pa )
Pressure Transmission Test Results for
CaCl2 Drilling FluidExxon, van Oort et al., 1996
GRI AGM ’99
TT00-03 133
1
0.8
0.6
0.4
0.2
00 0.2 0.4 0.6 0.8 1
Dimensionless sample length
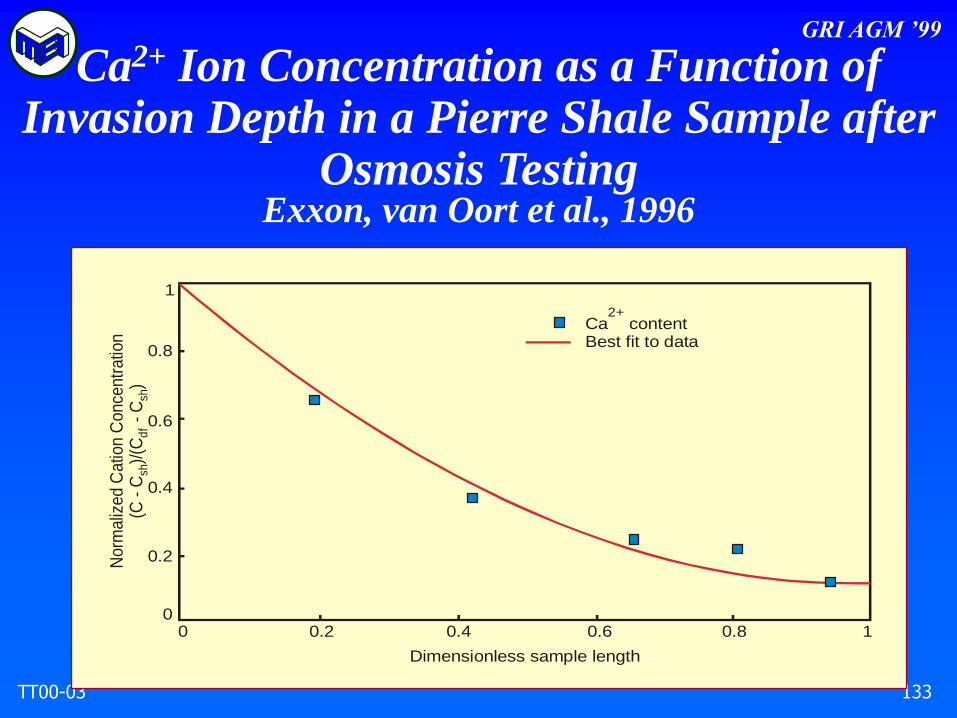
Ca contentBest fit to data
2+
Norm
aliz
ed C
atio
n C
once
ntr
atio
n(C
- C
)/(C
- C
)sh
df
sh
Ca2+ Ion Concentration as a Function of Invasion Depth in a Pierre Shale Sample after
Osmosis TestingExxon, van Oort et al., 1996
GRI AGM ’99
TT00-03 134
40030020010000.3
0.4
0.5
0.6
0.7
Time (min)
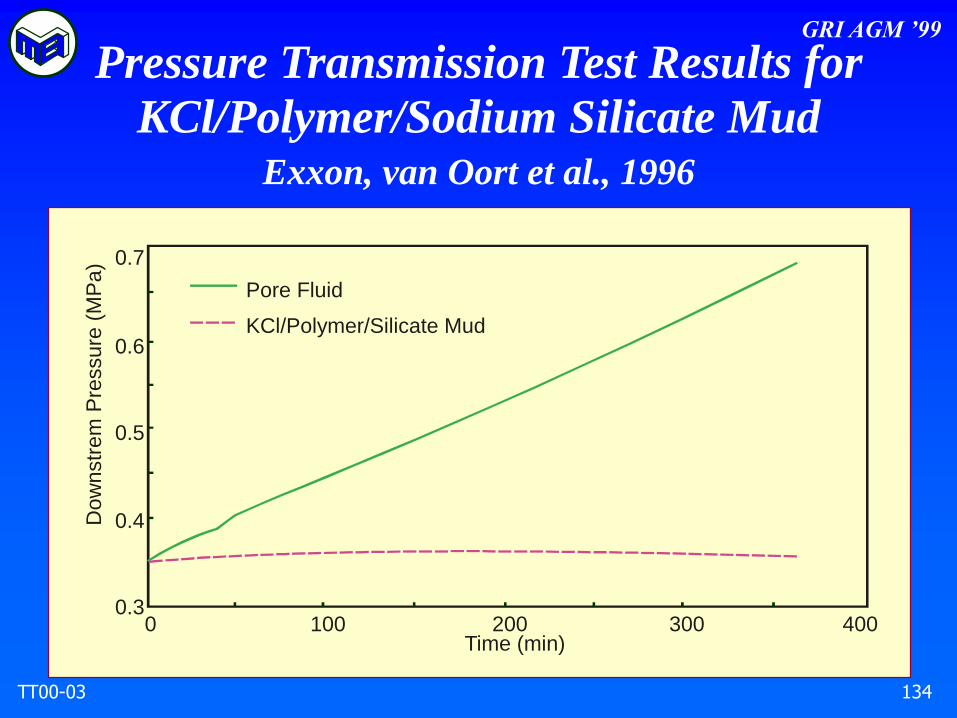
Pore Fluid
KCl/Polymer/Silicate Mud
Dow
nstr
em
Pre
ssure
(M
Pa)
Pressure Transmission Test Results for
KCl/Polymer/Sodium Silicate MudExxon, van Oort et al., 1996

GRI AGM ’99
TT00-03 135
normal
particle swelling stress swelling
low ionic concentration
high ionic concentration
Particle normal stress, normal
doublelayer
clay particle
--------------------------------------------+++++++++++++++++++++++++--------------------------------------------
Pa
rtic
le s
we
llin
g s
tra
in
Effect of Particle Confining Stress
and Pore Fluid Ionic Concentration
on Particle SwellingUniversity of Calgary, Wong & Wang, 1997
GRI AGM ’99
TT00-03 136
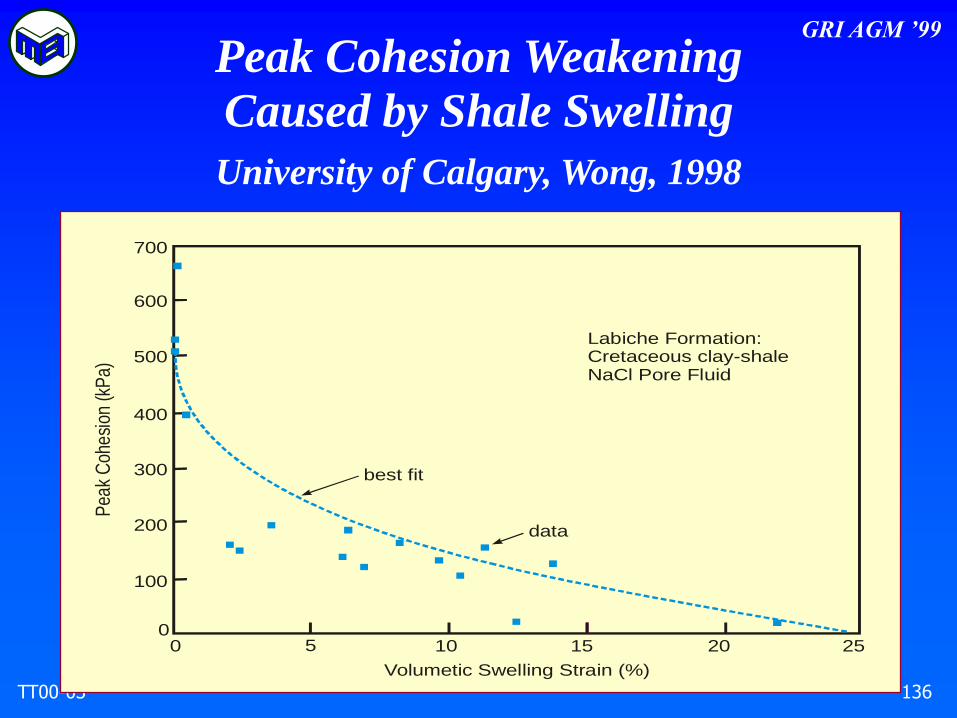
50 10 15 20 250
100
200
300
400
500
600
Pea
k C
ohes
ion
(kP
a)
Volumetic Swelling Strain (%)
best fit
data
Labiche Formation:Cretaceous clay-shaleNaCl Pore Fluid
700
Peak Cohesion Weakening
Caused by Shale Swelling
University of Calgary, Wong, 1998

GRI AGM ’99
TT00-03 137
+
+
+
waterOBMGel ChemTAMEPHPA
Angle
of S
hear
ing R
esist
ance
(deg
)
Time (days)
Variation of Shearing Resistance with Time
for Shale Fracture Surfaces Exposed to
Different Drilling FluidsUniversity of Calgary, Wang et al., 1997
GRI AGM ’99
TT00-03 138
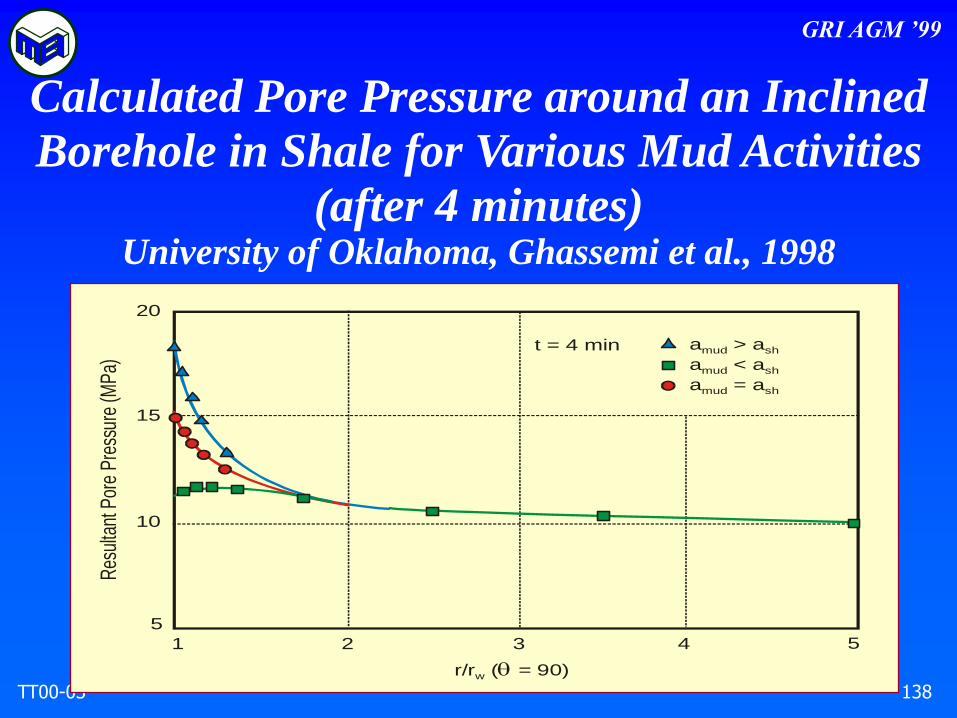
a > a
a < a
a = a
mud sh
mud sh
mud sh
t = 4 min
1 2 3 4 5
r/r ( = 90)w q
Res
ulta
nt P
ore
Pre
ssur
e (M
Pa)
5
10
15
20
Calculated Pore Pressure around an Inclined
Borehole in Shale for Various Mud Activities
(after 4 minutes)University of Oklahoma, Ghassemi et al., 1998
GRI AGM ’99
TT00-03 139
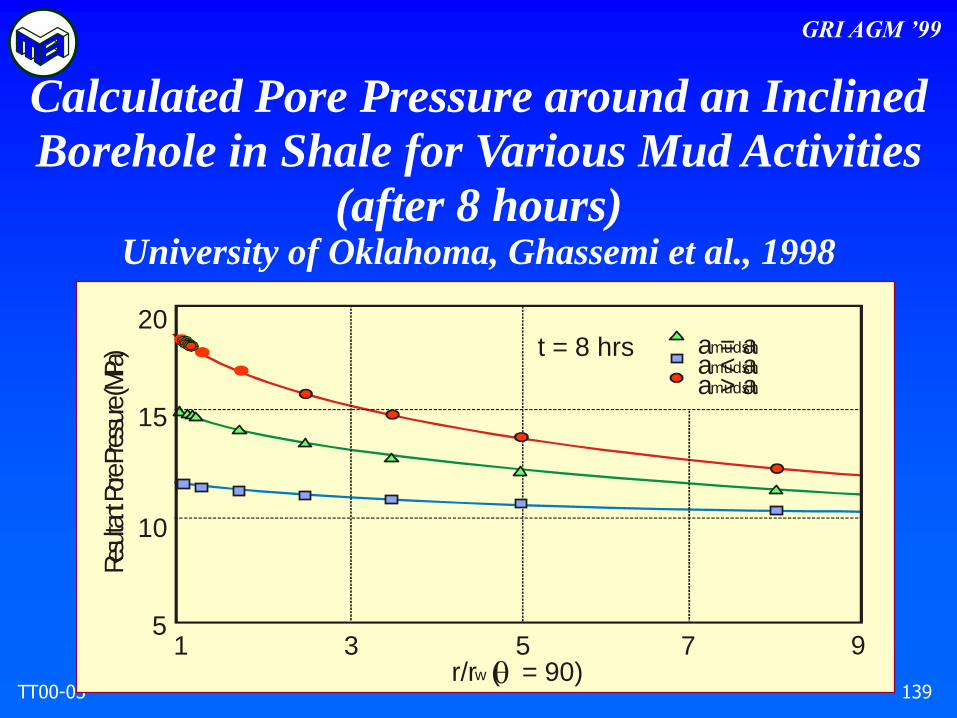
t = 8 hrs
1 3 5 7 9r/r ( = 90)w q
R esu
l tant
P ore
P re s
sure
(MPa
)
5
10
15
20a = aa < aa > a
mudsh
mudsh
mudsh
Calculated Pore Pressure around an Inclined
Borehole in Shale for Various Mud Activities
(after 8 hours)University of Oklahoma, Ghassemi et al., 1998

GRI AGM ’99
TT00-03 140
Average activityOsmotic PressurePore Fluid Activity, c = 0.1 mole/litre
1.00
0.99
0.98
0.97
0.96
0.951E-9 1E-8 1E-7
-100
0
100
200
300
400
500
600
Wate
r A
ctiv
ity
Interparticle Distance (m)
Osm
otic
Pre
ssu
re (
kPa)
Predicted Effect of Clay Mineral Inter-Particle
Spacing on Shale Water Activity and Osmotic
Pressure (contacting a 1 mole/litre mud)University of Waterloo, Fam & Dusseault, 1998
GRI AGM ’99
TT00-03 141
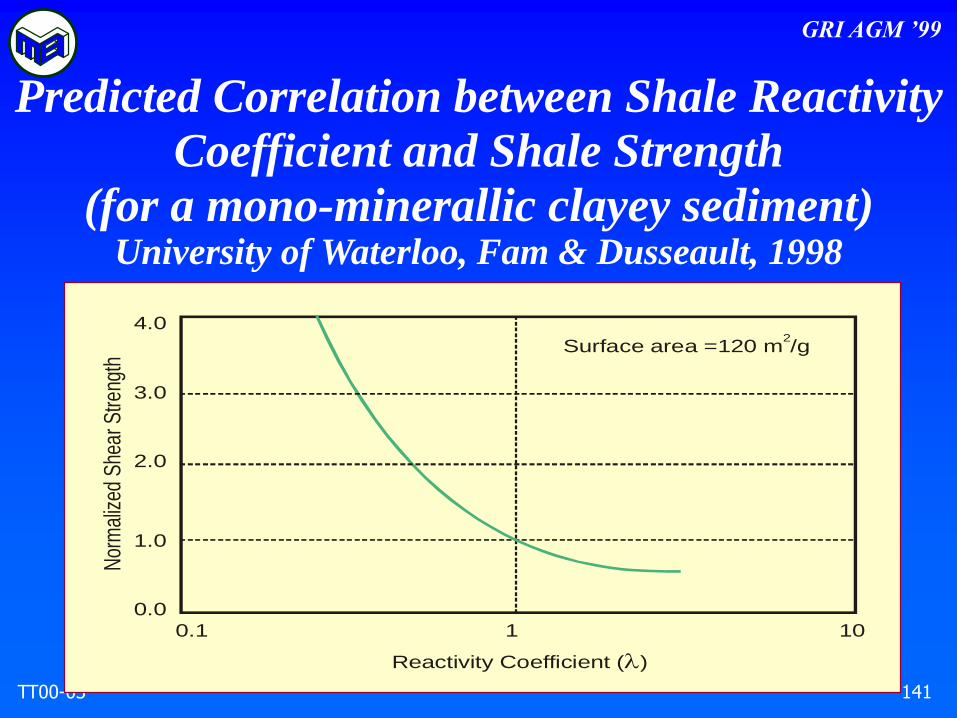
Surface area =120 m /g2
Nor
mal
ized
She
ar S
treng
th
0.1 1 10
Reactivity Coefficient ( )
0.0
1.0
2.0
3.0
4.0
Predicted Correlation between Shale Reactivity
Coefficient and Shale Strength
(for a mono-minerallic clayey sediment)University of Waterloo, Fam & Dusseault, 1998

GRI AGM ’99
TT00-03 142
MEI Wellbore Stability Model
GRI AGM ’99
TT00-03 143
featuring
Shale/Mud Interaction
Mechanical/Chemical Stability Design
Multi-Depth Analysis
Microsoft Word/Excel Report
GRI AGM ’99
TT00-03 144
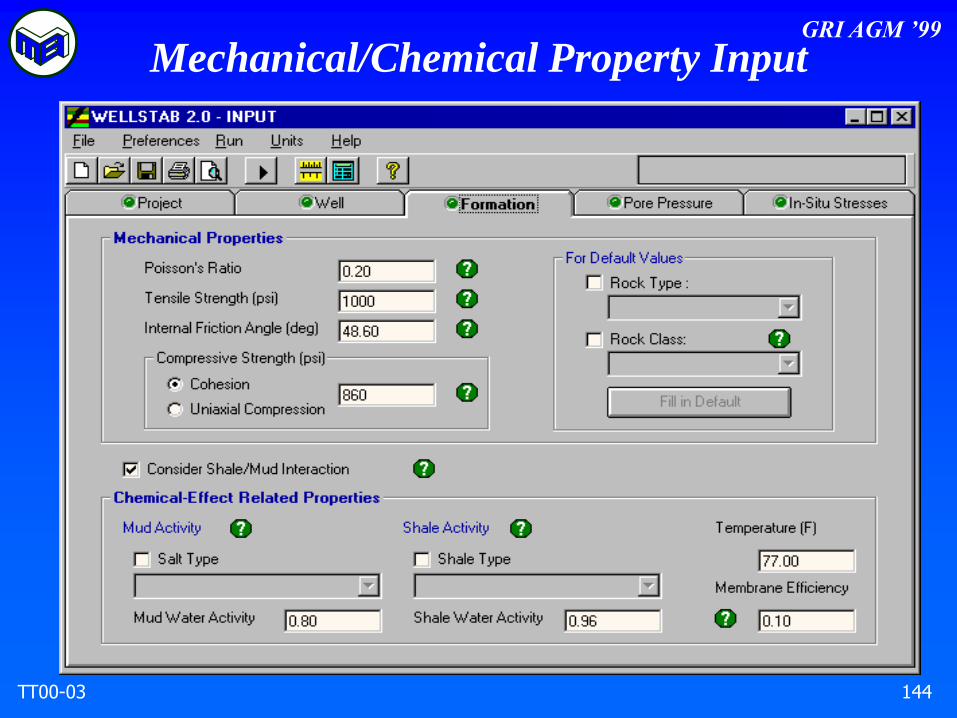
Mechanical/Chemical Property Input
GRI AGM ’99
TT00-03 145
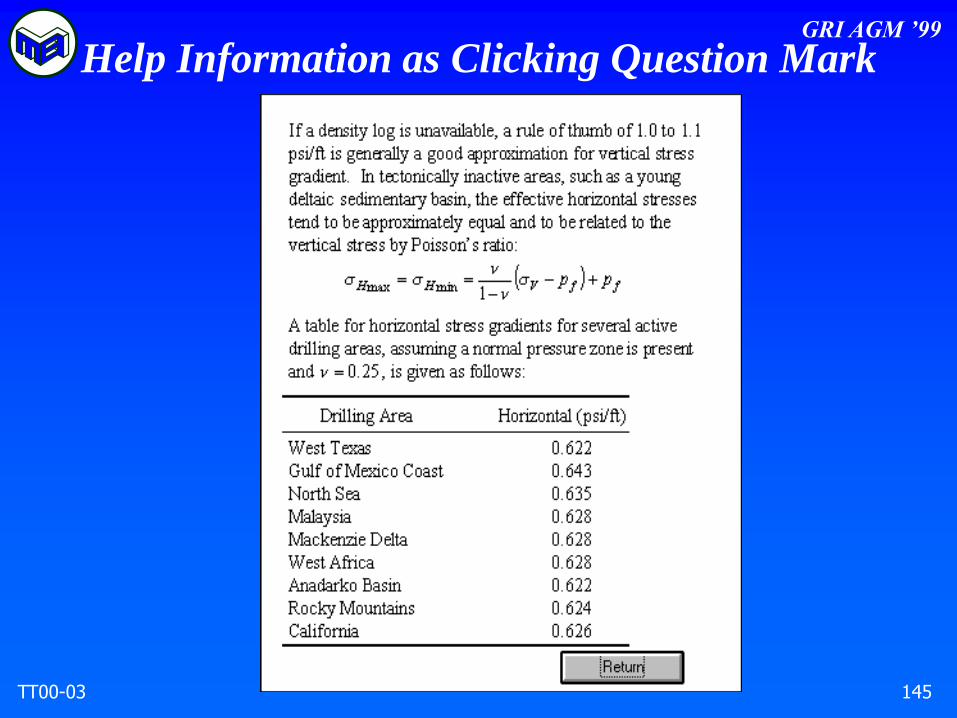
Help Information as Clicking Question Mark
GRI AGM ’99
TT00-03 146
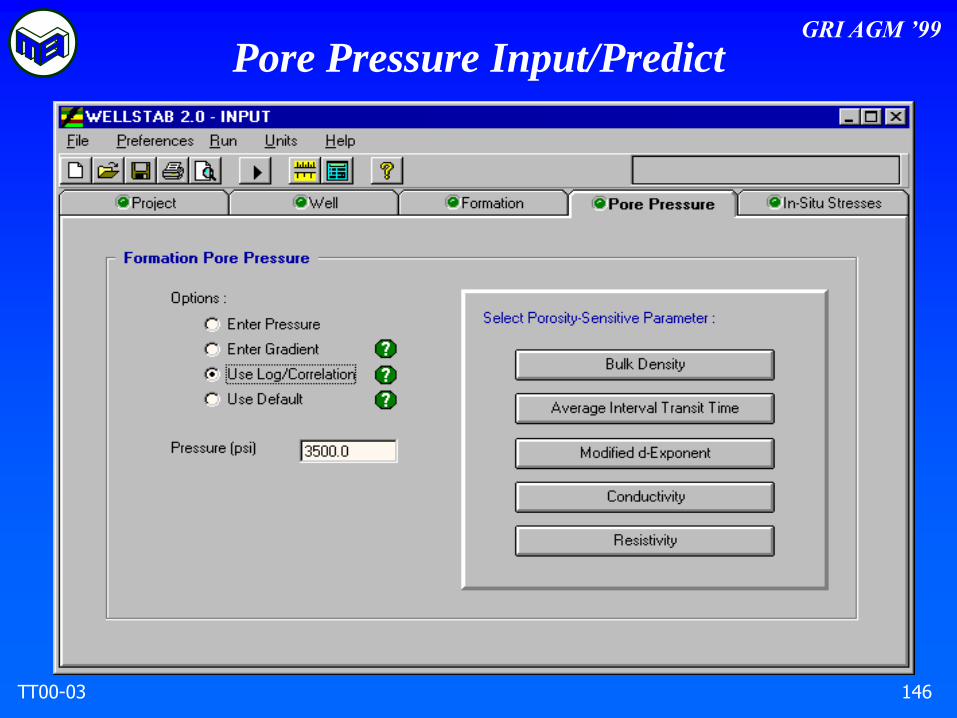
Pore Pressure Input/Predict

GRI AGM ’99
TT00-03 147
Pore Pressure Prediction via Log Data

GRI AGM ’99
TT00-03 148
In-Situ Stresses Input/Predict
GRI AGM ’99
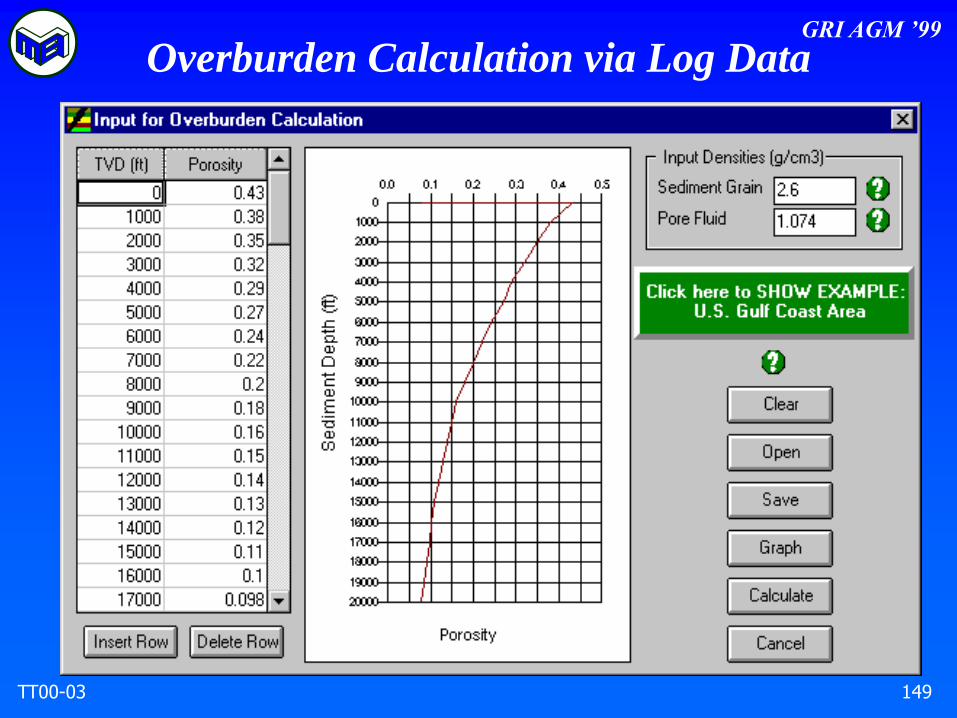
TT00-03 149
Overburden Calculation via Log Data
GRI AGM ’99
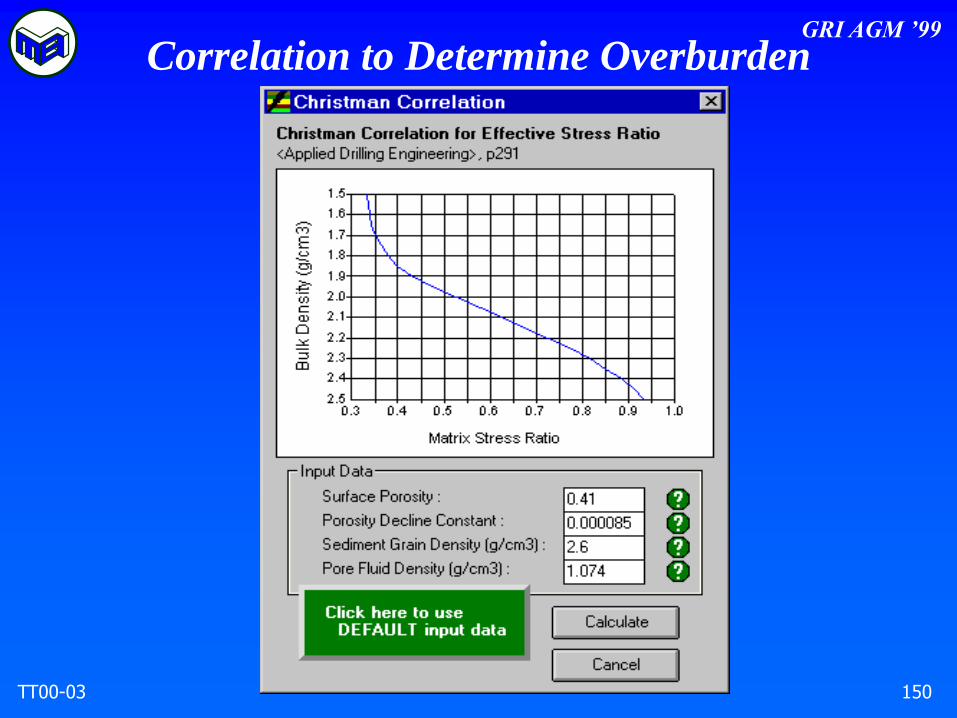
TT00-03 150
Correlation to Determine Overburden
GRI AGM ’99
TT00-03 151
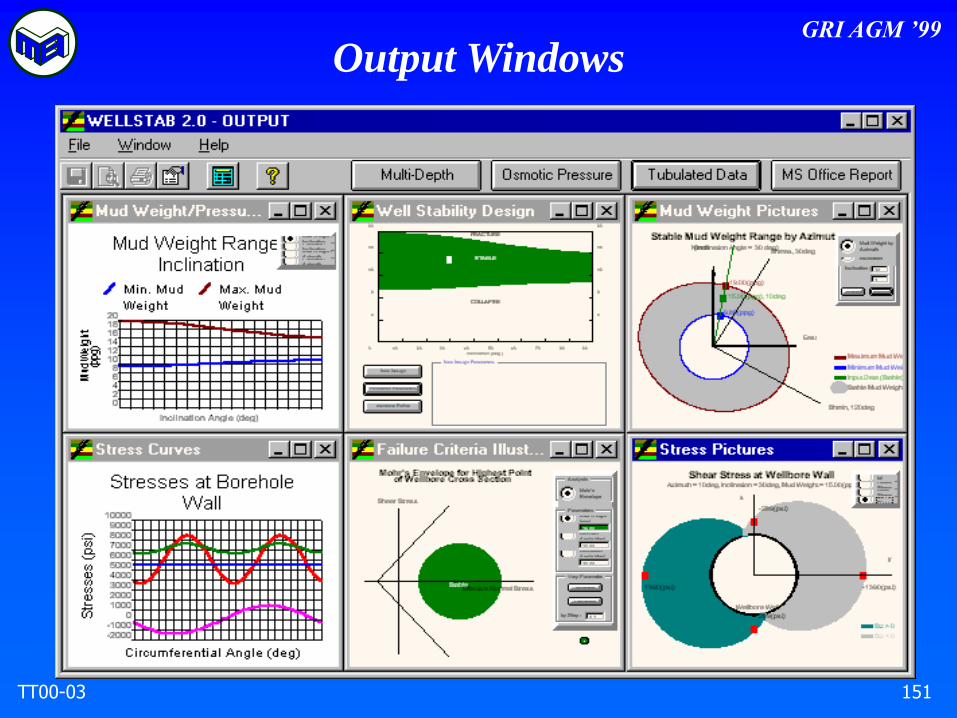
Output Windows
GRI AGM ’99
TT00-03 152
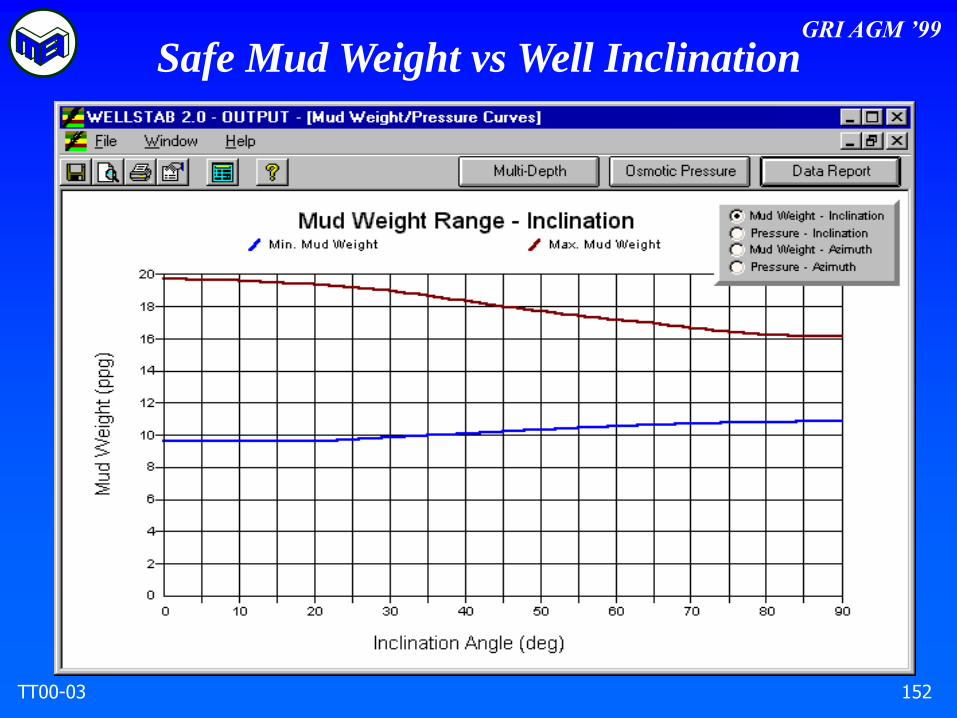
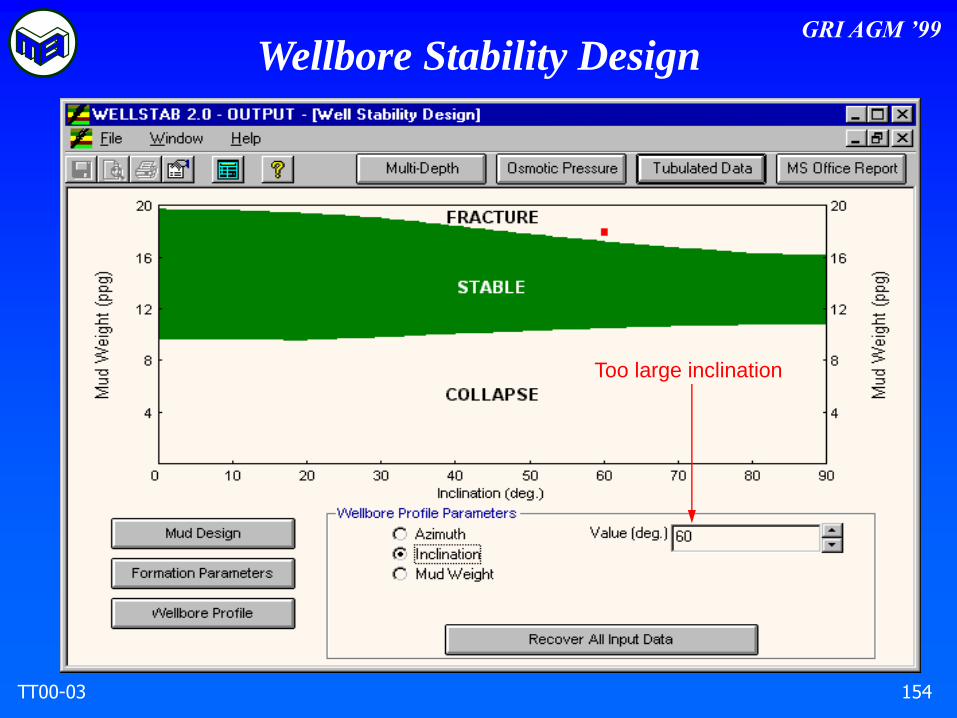
Safe Mud Weight vs Well Inclination

GRI AGM ’99
TT00-03 153
Near-Wellbore Stresses Distribution
GRI AGM ’99
TT00-03 154
Wellbore Stability Design
Too large inclination

GRI AGM ’99
TT00-03 155
Wellbore Stability Design (continued)
Decrease inclination

GRI AGM ’99
TT00-03 156
Wellbore Stability Design (continued)
Too high mud weight

GRI AGM ’99
TT00-03 157
Wellbore Stability Design (continued)
Increase mud weight

GRI AGM ’99
TT00-03 158
Not enough salinity
Wellbore Stability Design (continued)

GRI AGM ’99
TT00-03 159
Increase salinity
Wellbore Stability Design (continued)
GRI AGM ’99
TT00-03 160
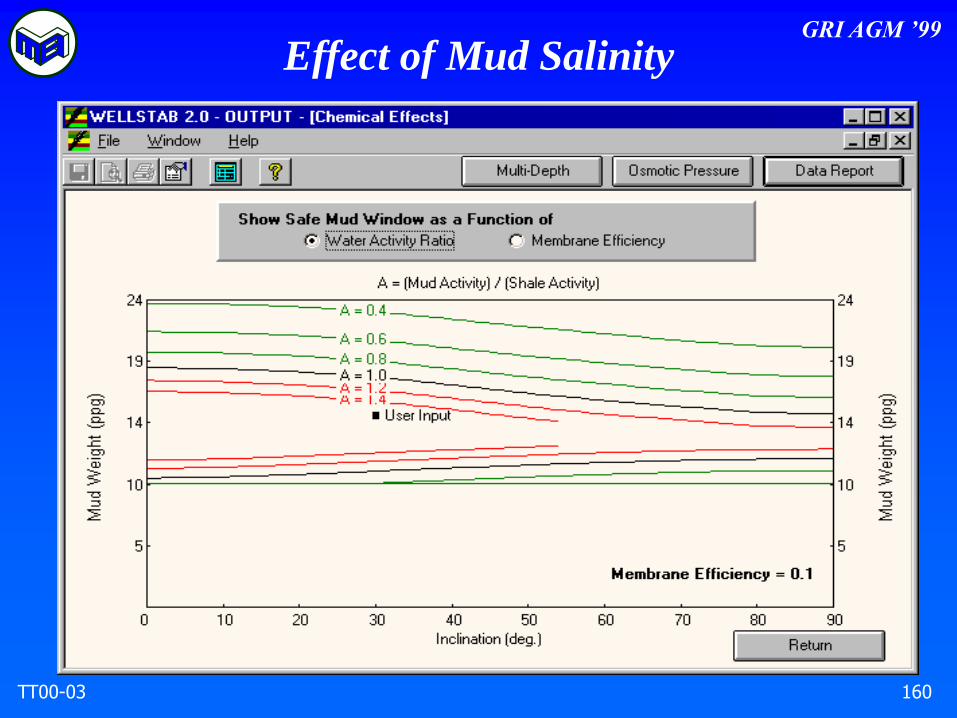
Effect of Mud Salinity

GRI AGM ’99
TT00-03 161
Effect of Membrane Efficiency

GRI AGM ’99
TT00-03 162
Propagation of Swelling Pressure

GRI AGM ’99
TT00-03 163
Multi-Depth Data/Calculation Display

GRI AGM ’99
TT00-03 164
Microsoft Word Report

GRI AGM ’99
TT00-03 165
Summary of Important Wellbore
Stability Mechanisms in Shales
GRI AGM ’99
TT00-03 166
Osmosis
• Osmosis plays a significant role in
wellbore stability
• Drilling mud with low water activity can
draw water out of the shale
• The effectiveness of this mechanism
depends on the ability of the shale-mud
interface to form a semi-permeable
membrane (“membrane efficiency”)
• Osmotic pressure diminishes with time

GRI AGM ’99
TT00-03 167
Rock Strength
• Invasion of solute ions from mud into
shales affects rock strength
• Most results indicate that strength and
stiffness decrease with the invasion of
solute
• Methyl glucoside solutions has high
membrane efficiencies and are not
detrimental to North Sea Speeton shale

GRI AGM ’99
TT00-03 168
Hydration and Swelling
• The most controversial mechanism
• UT Austin and OGS observed shale
swelling in carefully preserved samples
• Need to standardize shale sampling and
handling techniques
GRI AGM ’99
TT00-03 169
Computer Models
• Many existing models are based on
poroelastic theory and include the effects
of osmosis, temperature and rock
anisotropy
• More sophisticated models require
numerical solution techniques
• Elastoplastic models have been developed
but are more difficult to use in practice

GRI AGM ’99
TT00-03 170
Recommendations for Future R&D

GRI AGM ’99
TT00-03 171
Essential Reasons
of Experimental Investigations of the
Mud-Shale Interaction Mechanisms
• For industry to develop more reliable
tools to predict and control wellbore
stability in shales
• A broader database of physico-chemical
properties is required to facilitate
wellbore stability design for analogue
shale formations

GRI AGM ’99
TT00-03 172
Recommendations
• The promising results obtained with non-
ionic water-based mud such as methyl
glucoside should be pursued
• Need to transfer the technical knowledge
to drilling and completions personnel in
operating and service companies
• Improvements in computer-based
modeling is strongly recommended

GRI AGM ’99
TT00-03 173
End of Presentation