wellbore stress analysis
TRANSCRIPT

Wellbore Stress Analysis Watching Rocks change
By Kumar Abhishek Singh,12BPE110
School of Petroleum Technology,
PANDIT DEENDAYAL PETROLEUM UNIVERSITY (PDPU)
Overview Basics of different types of stresses. Stresses surrounding wellbore – vertical Well Exploration Phase – Pore Pressure, Measurement of
Stresses, Rock Strength. Development Phase – Risk Assessment, Optimal Well
Trajectories, mud weights, Wellbore problems – breakout and tensile fracture, Stress Around Wellbore Changes, Fluid Flow Models.
Production Phase – Sand Production, Reservoir Pressure Depletion, Hydraulic Fracturing, PDP (Pressure Dependent Permeability, Fluid Flow Models
Conclusion References
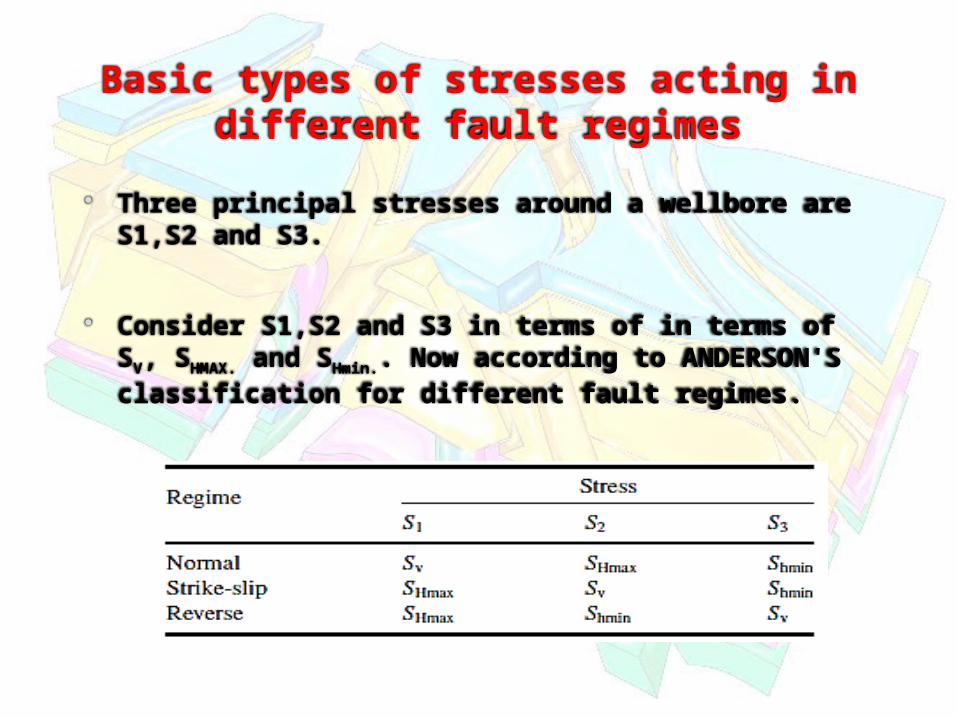
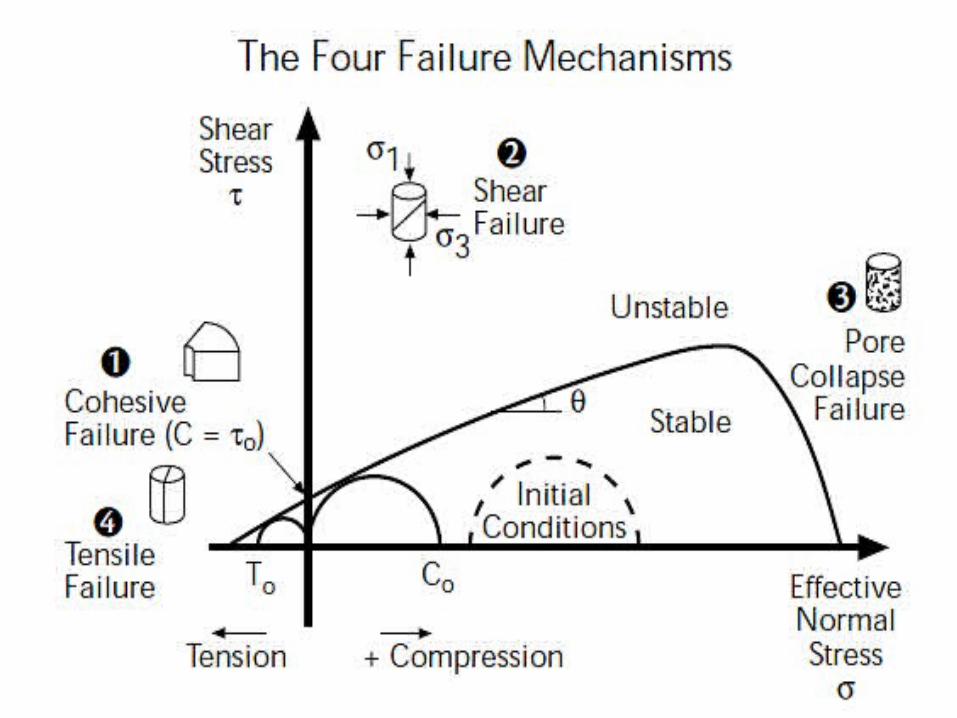
Basic types of stresses acting in different fault regimes
Three principal stresses around a wellbore are S1,S2 and S3.
Consider S1,S2 and S3 in terms of in terms of SV, SHMAX. and SHmin.. Now according to ANDERSON'S classification for different fault regimes.
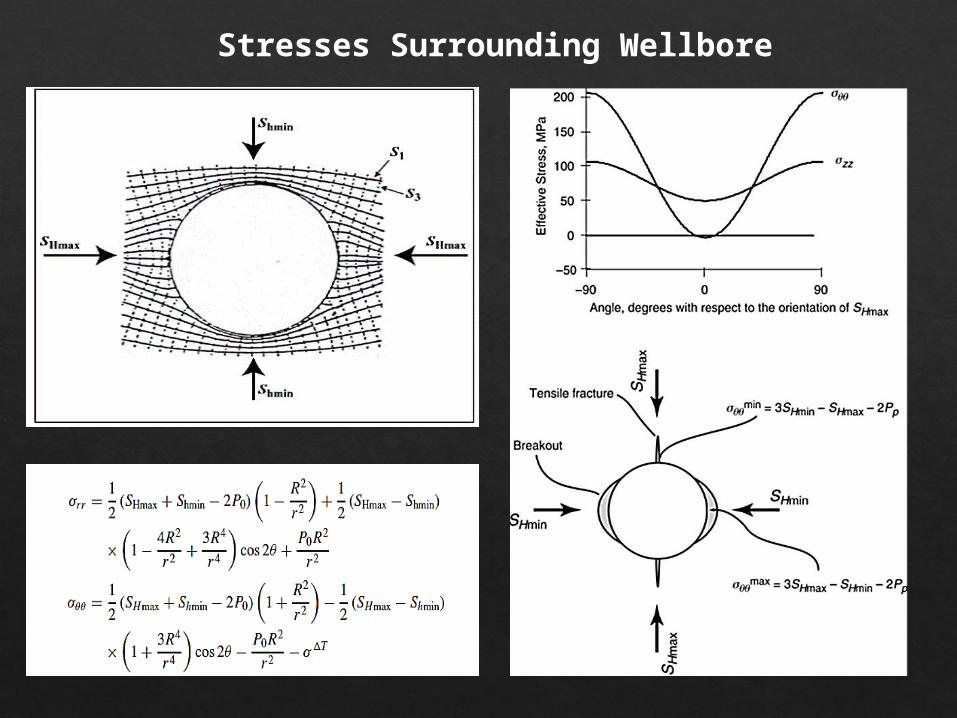
Stresses Surrounding Wellbore
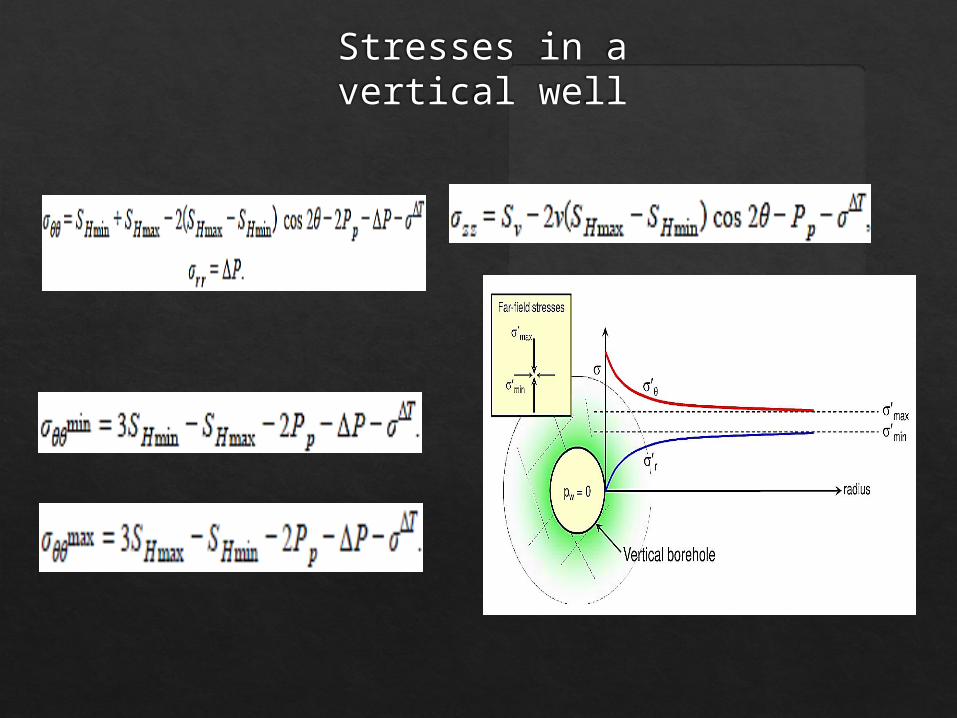
Stresses in a vertical well
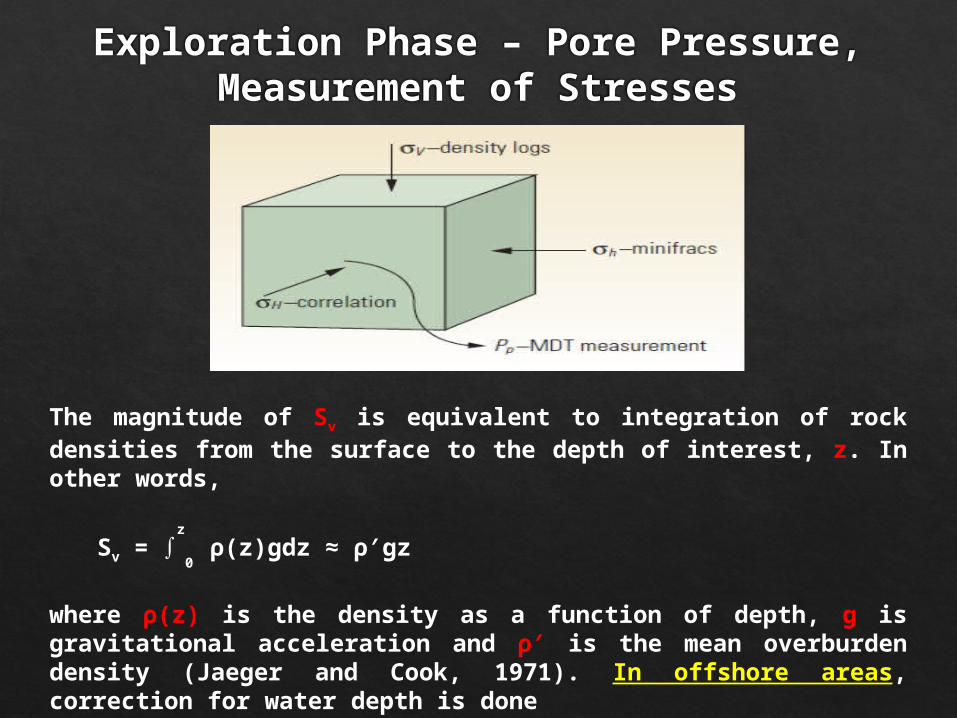
Exploration Phase – Pore Pressure, Measurement of Stresses
The magnitude of Sv is equivalent to integration of rock densities from the surface to the depth of interest, z. In other words,
Sv = ∫z
0 ρ(z)gdz ≈ ρ′gz
where ρ(z) is the density as a function of depth, g is gravitational acceleration and ρ′ is the mean overburden density (Jaeger and Cook, 1971). In offshore areas, correction for water depth is done
Sv = ρwgzw + ∫z
zw ρ(z)gdz ≈ ρwgzw + ρ′g(z − zw)
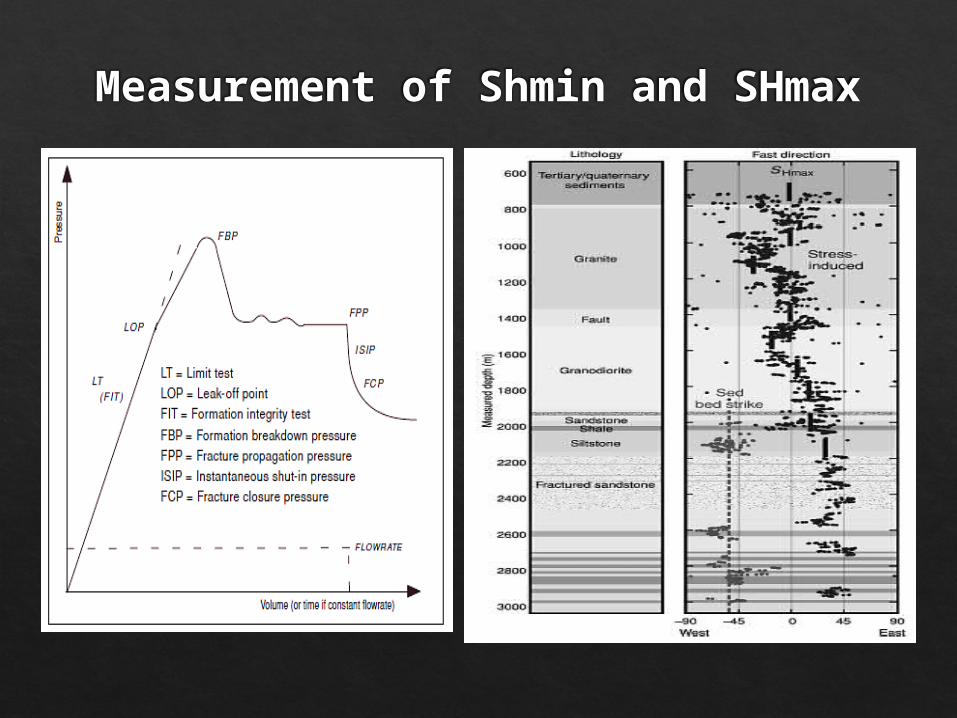
Measurement of Shmin and SHmax
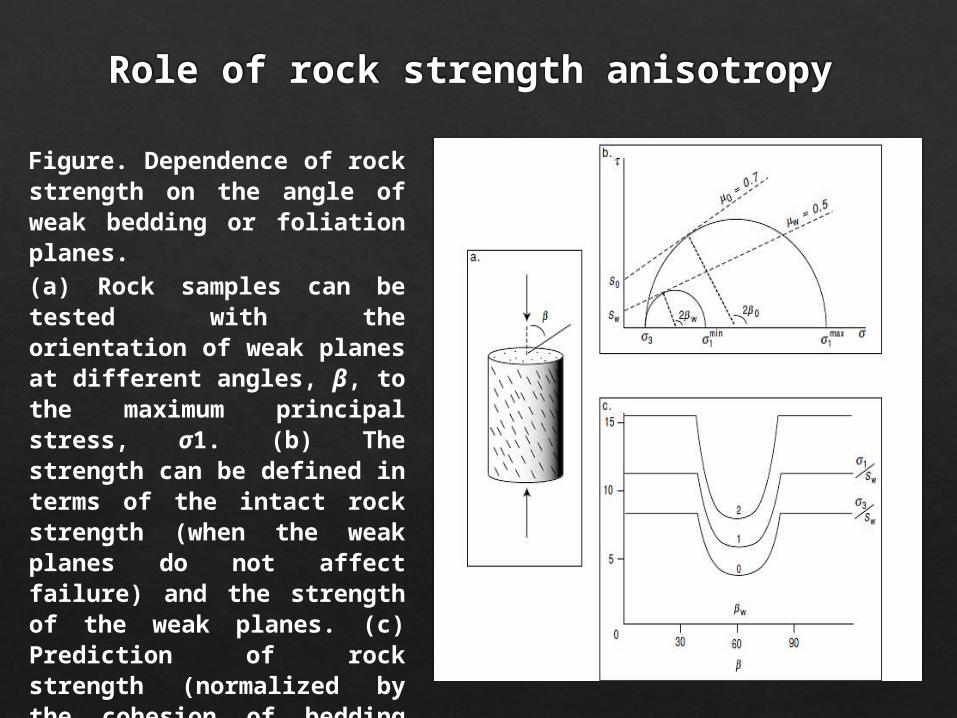
Role of rock strength anisotropy
Figure. Dependence of rock strength on the angle of weak bedding or foliation planes.(a) Rock samples can be tested with the orientation of weak planes at different angles, β, to the maximum principal stress, σ1. (b) The strength can be defined in terms of the intact rock strength (when the weak planes do not affect failure) and the strength of the weak planes. (c) Prediction of rock strength (normalized by the cohesion of bedding planes) as function of β.Modified from Donath (1966) and Jaeger and Cook (1979).
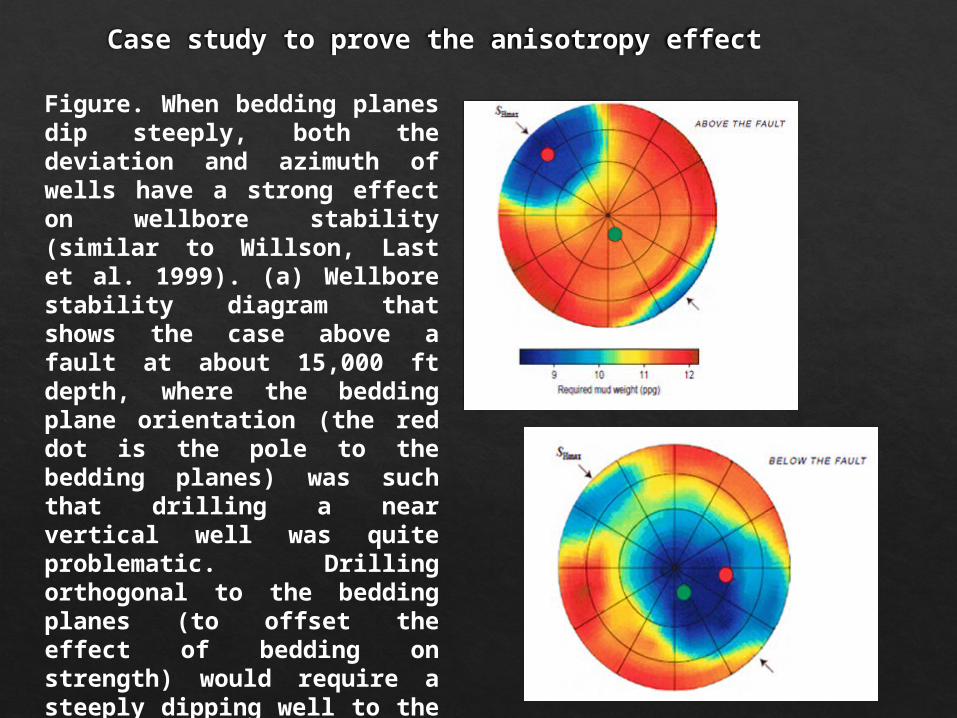
Case study to prove the anisotropy effect
Figure. When bedding planes dip steeply, both the deviation and azimuth of wells have a strong effect on wellbore stability (similar to Willson, Last et al. 1999). (a) Wellbore stability diagram that shows the case above a fault at about 15,000 ft depth, where the bedding plane orientation (the red dot is the pole to the bedding planes) was such that drilling a near vertical well was quite problematic. Drilling orthogonal to the bedding planes (to offset the effect of bedding on strength) would require a steeply dipping well to the northwest. (b) Below the fault, the bedding orientation changes such that a near-vertical well is stable.
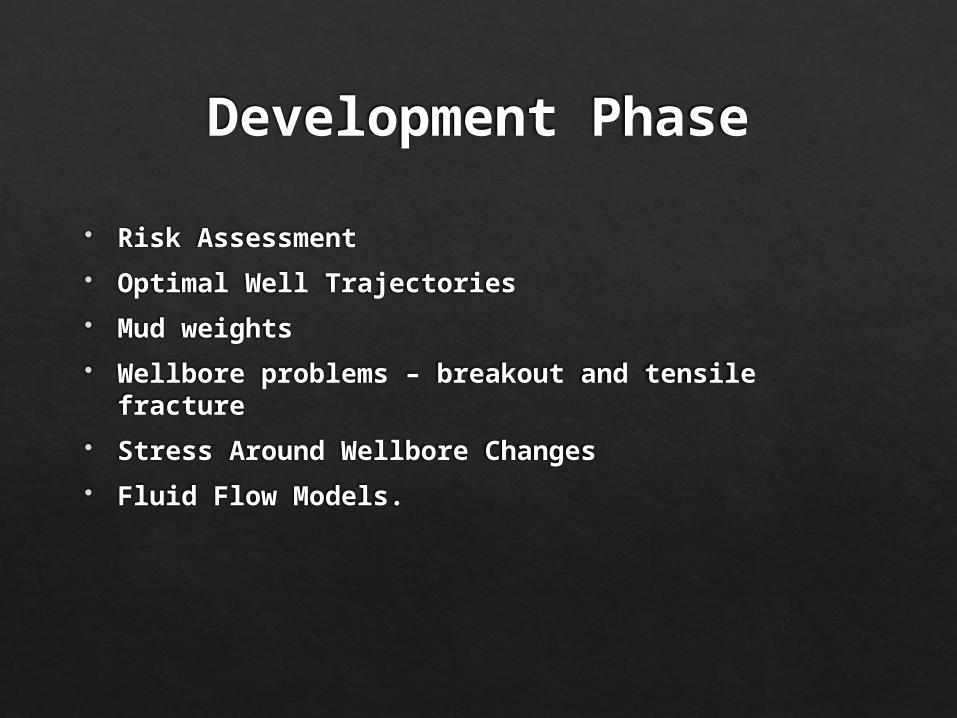
Development Phase
Risk Assessment Optimal Well Trajectories Mud weights Wellbore problems – breakout and tensile fracture Stress Around Wellbore Changes Fluid Flow Models.
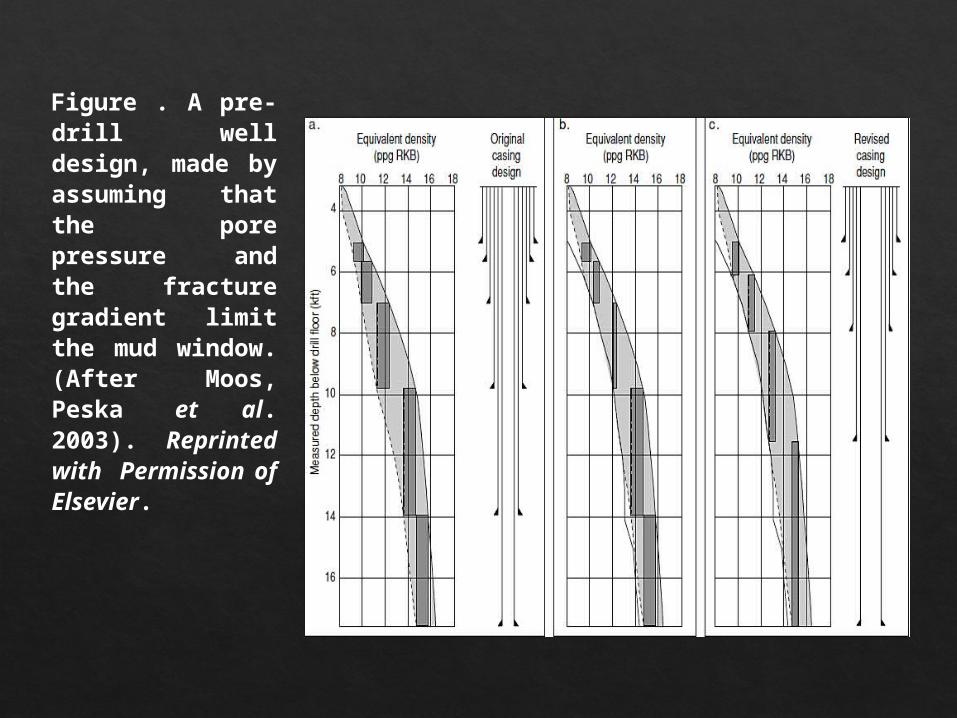
Figure . A pre-drill well design, made by assuming that the pore pressure and the fracture gradient limit the mud window. (After Moos, Peska et al. 2003). Reprinted with Permission of Elsevier.
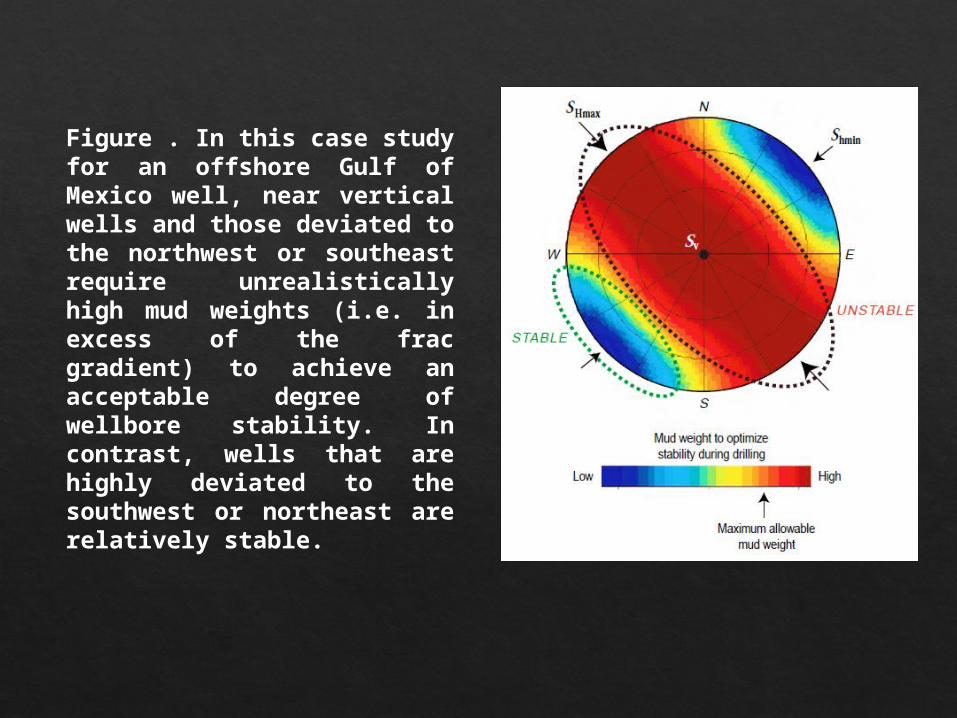
Figure . In this case study for an offshore Gulf of Mexico well, near vertical wells and those deviated to the northwest or southeast require unrealistically high mud weights (i.e. in excess of the frac gradient) to achieve an acceptable degree of wellbore stability. In contrast, wells that are highly deviated to the southwest or northeast are relatively stable.
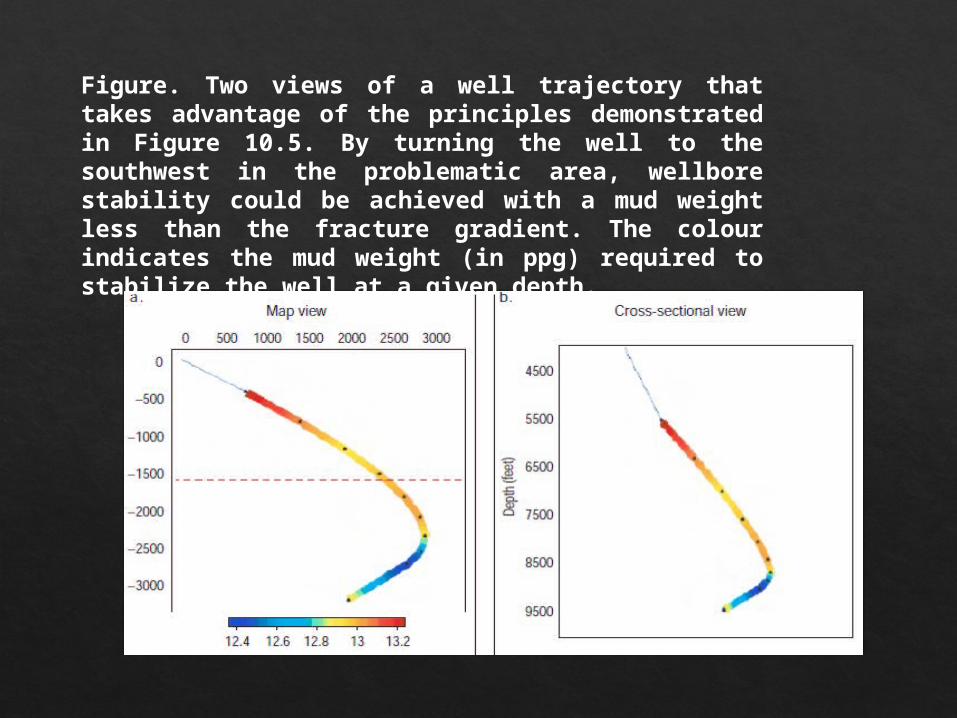
Figure. Two views of a well trajectory that takes advantage of the principles demonstrated in Figure 10.5. By turning the well to the southwest in the problematic area, wellbore stability could be achieved with a mud weight less than the fracture gradient. The colour indicates the mud weight (in ppg) required to stabilize the well at a given depth.
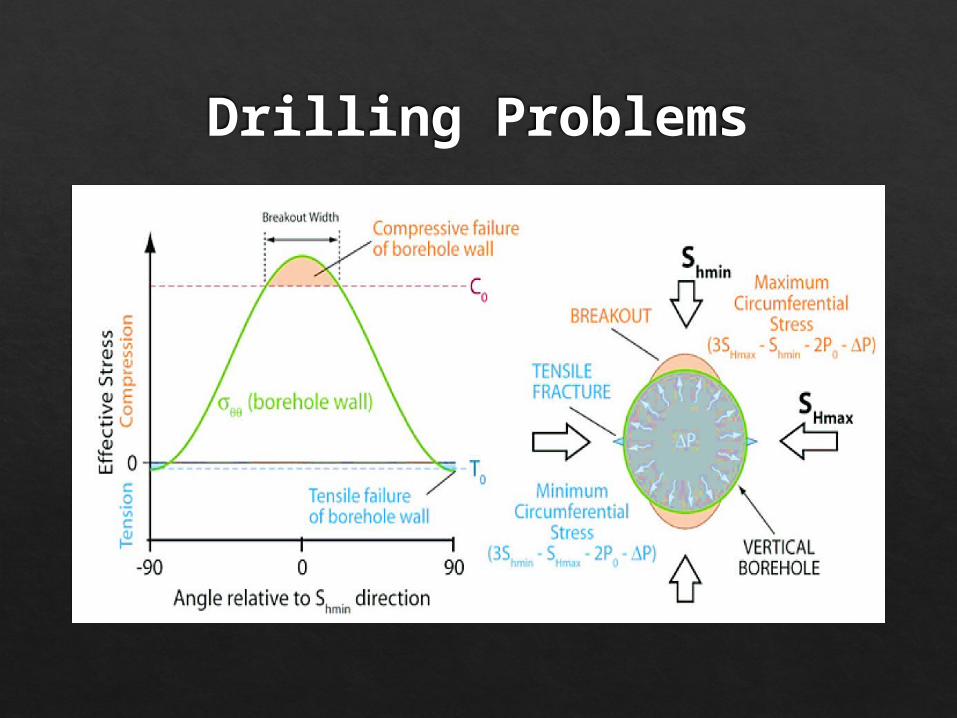
Drilling Problems
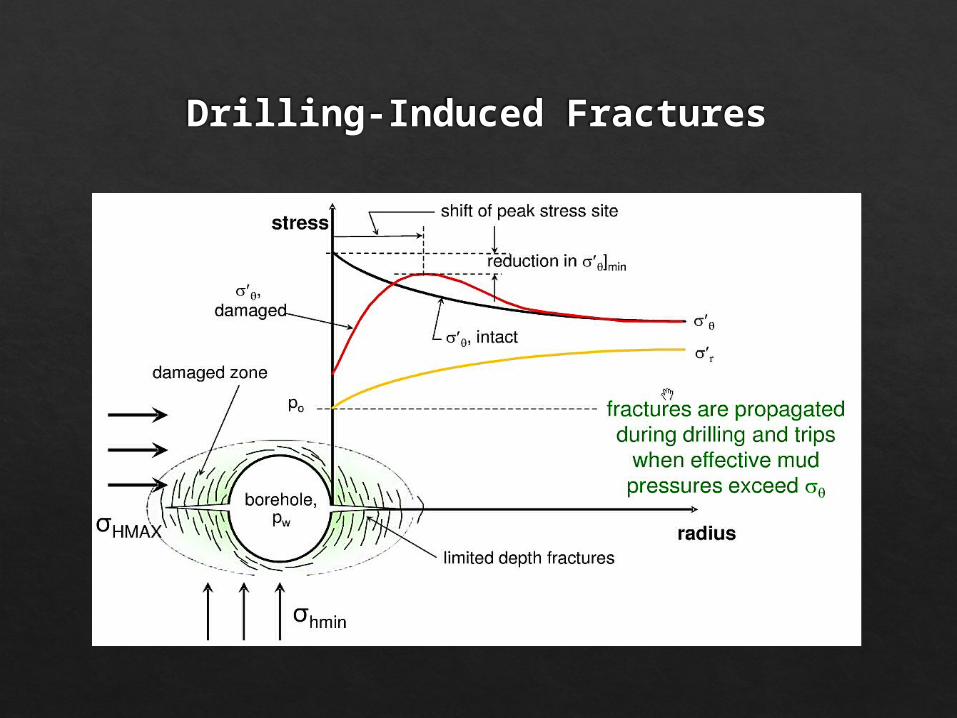
Drilling-Induced Fractures
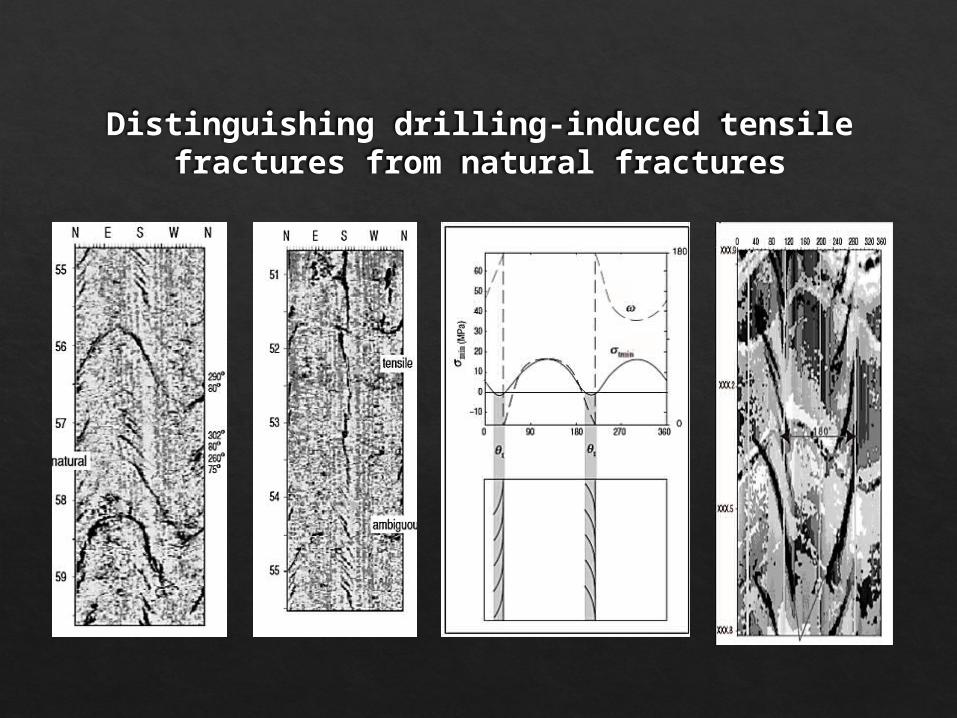
Distinguishing drilling-induced tensile fractures from natural fractures
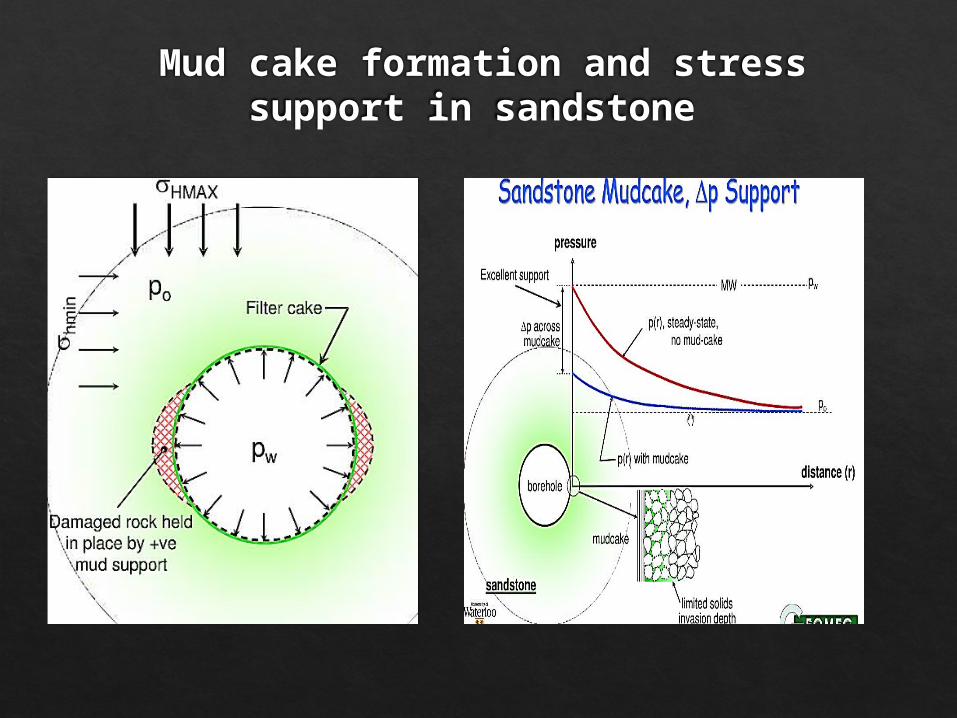
Mud cake formation and stress support in sandstone
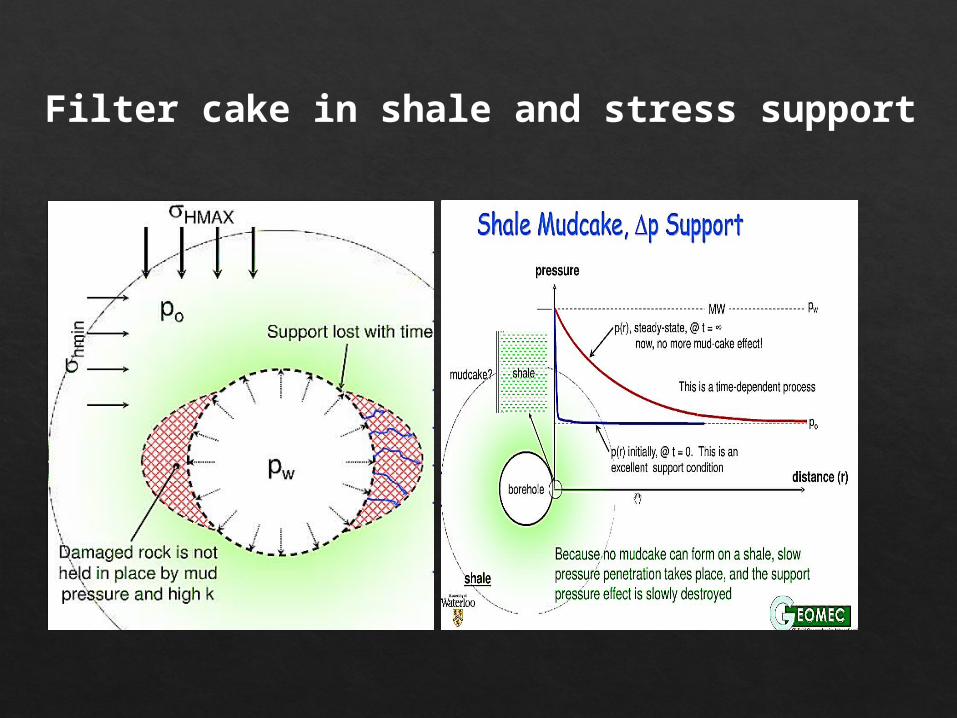
Filter cake in shale and stress support
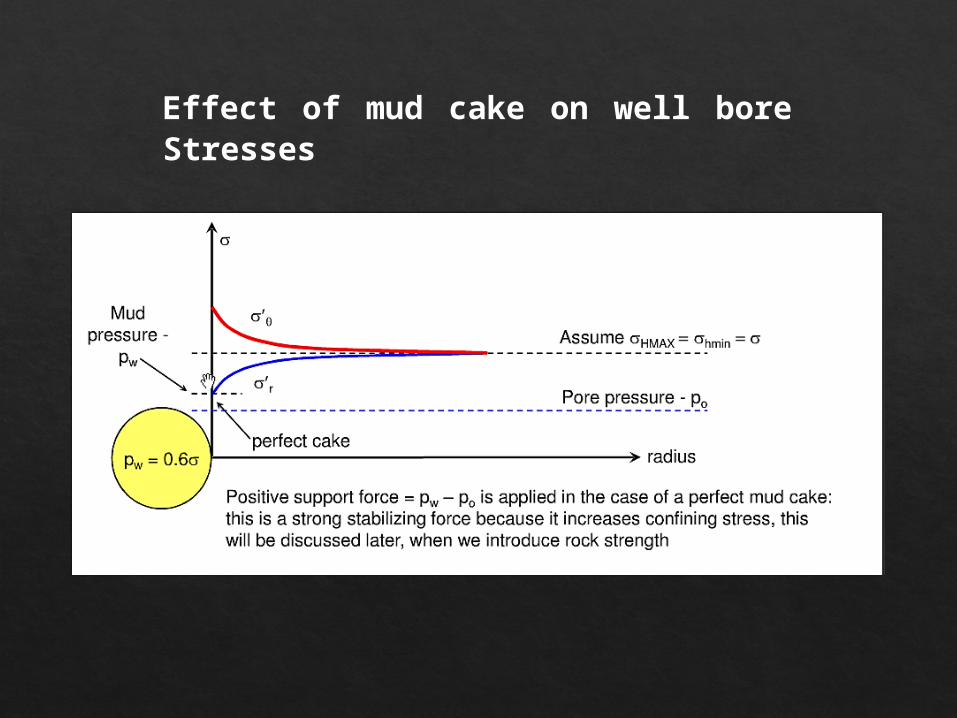
Effect of mud cake on well bore Stresses
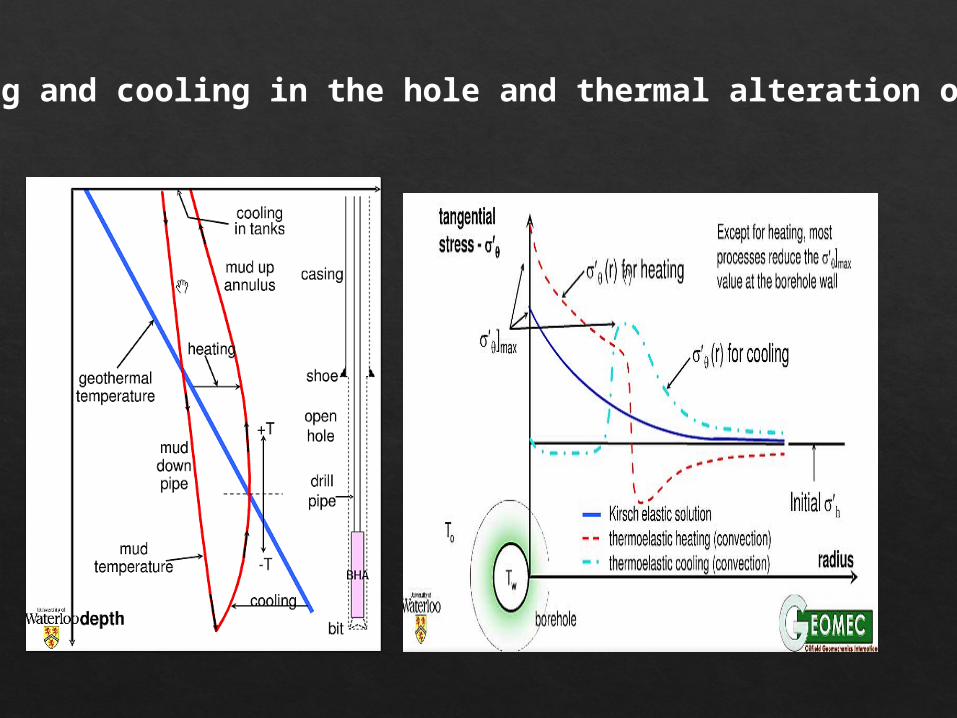
Heating and cooling in the hole and thermal alteration of σ’θ
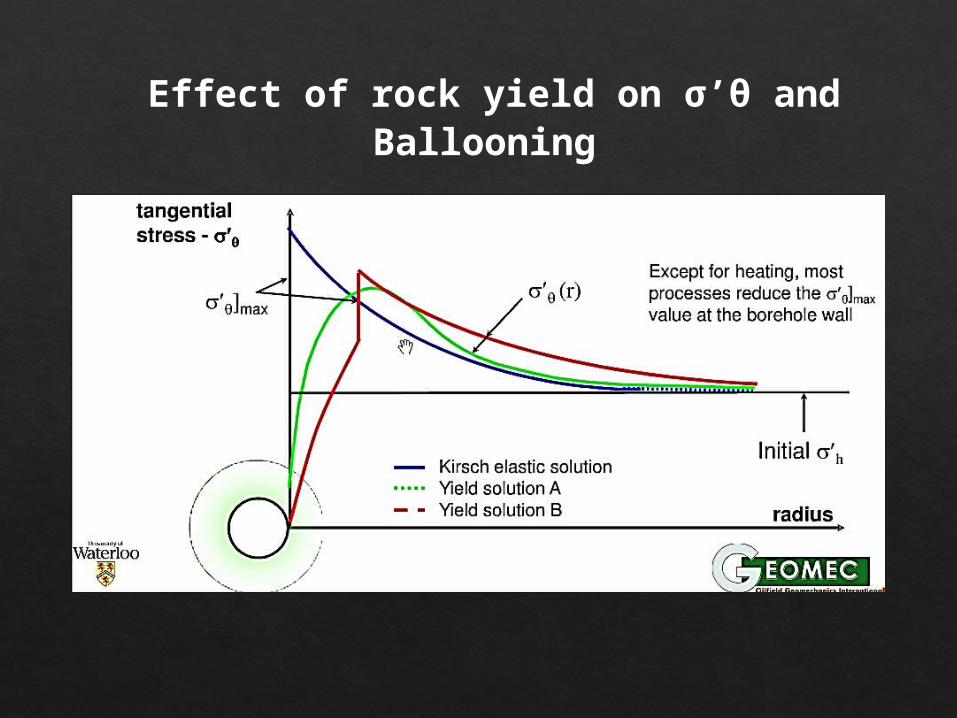
Effect of rock yield on σ’θ and Ballooning
Production Phase
Sand Production Reservoir Pressure Depletion Hydraulic Fracturing PDP (Pressure Dependent Permeability) in Shale
Reservoir Fluid Flow Models
Effects of reservoir depletion
Figure. Schematic diagram illustrating the effects of reservoir depletion on deformation surrounding the reservoir and contours of the stress changes resulting from depletion in a reservoir at unit depth and radius (from Segall 1989). Note that in compressional tectonic settings, reversefaulting is promoted above and below the reservoir whereas in extensional tectonic settings, normalfaulting is promoted around the edges of the reservoir.
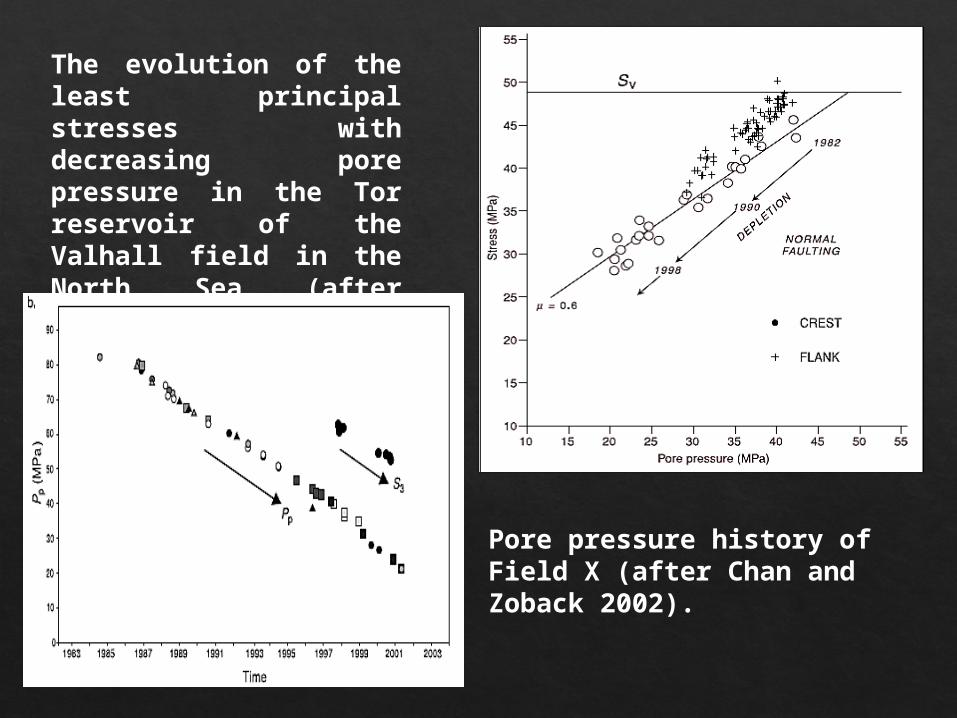
The evolution of the least principal stresses with decreasing pore pressure in the Tor reservoir of the Valhall field in the North Sea (after Zoback and Zinke 2002).
Pore pressure history of Field X (after Chan and Zoback 2002).
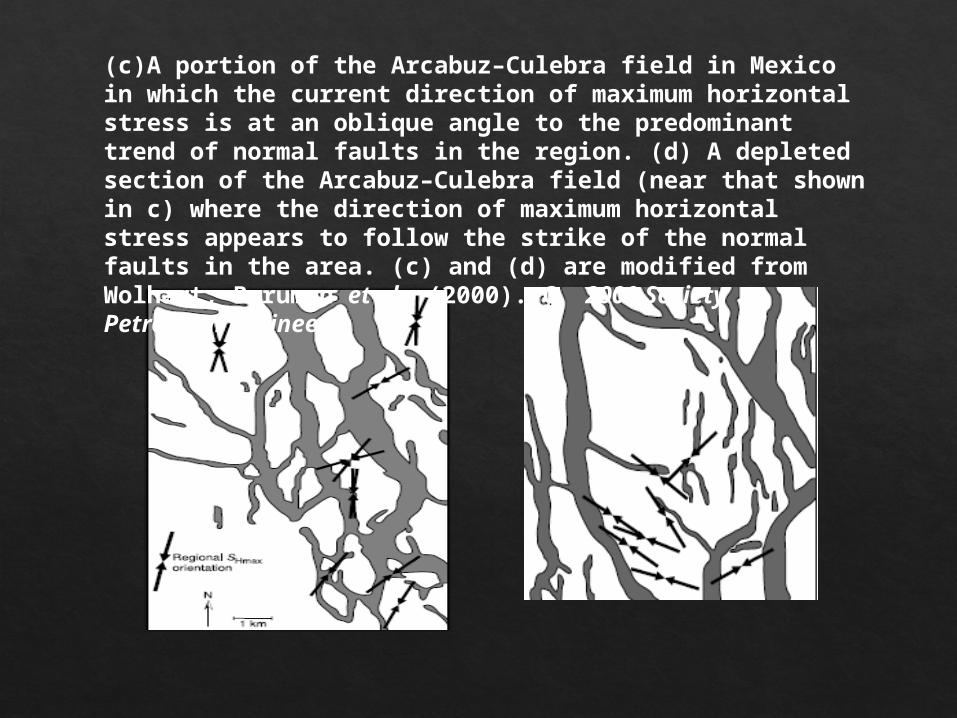
(c)A portion of the Arcabuz–Culebra field in Mexico in which the current direction of maximum horizontal stress is at an oblique angle to the predominant trend of normal faults in the region. (d) A depleted section of the Arcabuz–Culebra field (near that shown in c) where the direction of maximum horizontal stress appears to follow the strike of the normal faults in the area. (c) and (d) are modified from Wolhart, Berumen et al. (2000). C 2000 SocietyPetroleum Engineers
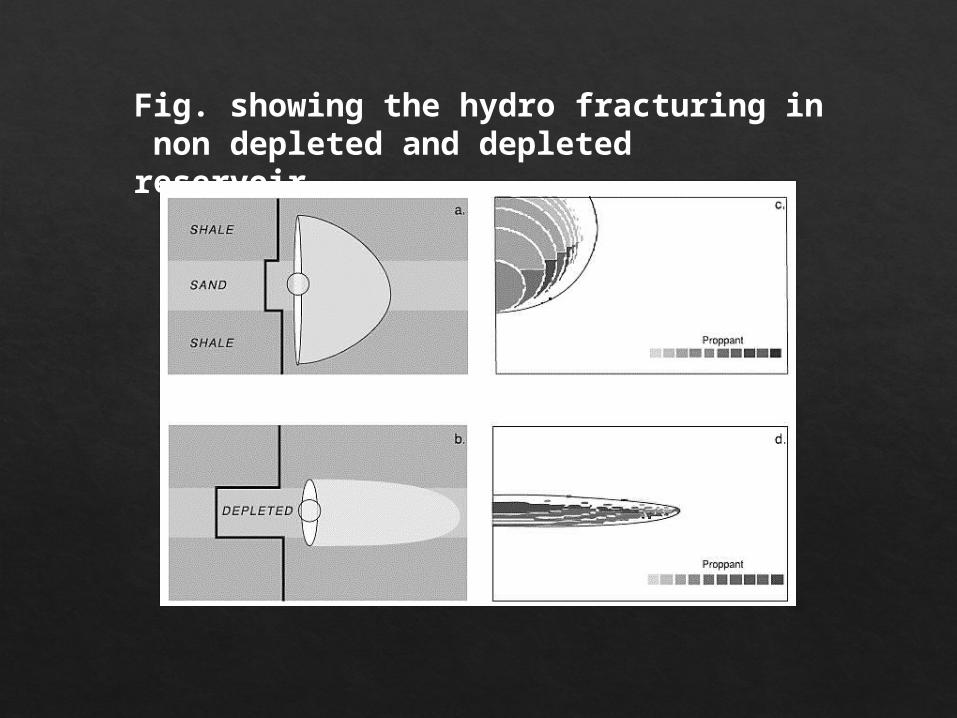
Fig. showing the hydro fracturing in non depleted and depleted reservoir.
Conclusion Successful drilling of lateral wells in minimum horizontal
stress direction for optimal fracture placement. Drilling horizontal wells in the direction of σmin and
completing and stimulating them with MSF have provided great success, and optimal production rates have been achieved. This strategy is currently being used in Saudi Aramco in its moderate and tight gas reservoirs.
Real time usage of MEMs has proved to be successful in predicting accurate MW information; wells have been drilled with minimum borehole-related problems.
Re- fracturing of depleted reservoir make it possible to access un-drained part of reservoir and increases the efficiency hydraulic fracturing.
References Reservoir Geo-mechanics [Mark D Zoback]
Petroleum Rock Mechanics [Bernt S. Aadnoy & Reza Looyeh]
http://petrowiki.org/
http://dc-app3-14.gfz
potsdam.de/pub/guidelines/WSM_analysis_guideline_breakout_image.pdf.
http://www.skb.se/
http://www.docstoc.com/docs/77293216/Geoscience-and-Rock-Mechanics
http://www.docstoc.com/docs/33098804/Geoscience-and-Rock-Mechanics-
Module-C-2-Stresses-Around
http://petrowiki.org/PEH%3AGeomechanics_Applied_to_Drilling_Engineering
http://www.ogj.com