greening of fort wayne, in partners for pollution prevention june 6, 2007
TRANSCRIPT

Greening of Fort Greening of Fort Wayne, INWayne, IN
Partners for Pollution Prevention
June 6, 2007

N2O
Issues Surrounding Energy Source, Global Warming and Air Pollution are Linked
Burning fossil fuels release both: •Heat trapping greenhouse gases• Air Pollutants responsible for:
•Smog, •Health problems•Reduce visibility•Diminished quality of life

THIS ENERGY CRISIS IS NOT A TEMPORARY BLIP
THE MARKET FUNDAMENTALS HAVE CHANGED:
•Oil - growth in world demand
•Natural Gas - no supply relief in sight
•Coal - plentiful supply, BUT
•No magic bullet

Indiana Concerns
• Indiana uses a huge amount of energy– 2001 - $17 billion per year– Now estimated at $25 billion
• Indiana is extremely dependent on imported fuels (states and countries)– 100% of natural gas– 99% of petroleum products– 51% of coal

Senator Lugar
Called energy the “Albatross of U.S. national security”
The U.S. is 5% of the global population and uses 25% of the oil
If oil at $60/ barrel through 2006 -$320 Billion will be spent on imports
Our dependence on oil threatens our security and prosperity


Reality Check
• Demand up• Supplies Diminishing• Vulnerable • Our use is national
security concern• Cost is up 50% - 2001• ++ Air pollution and
climate change
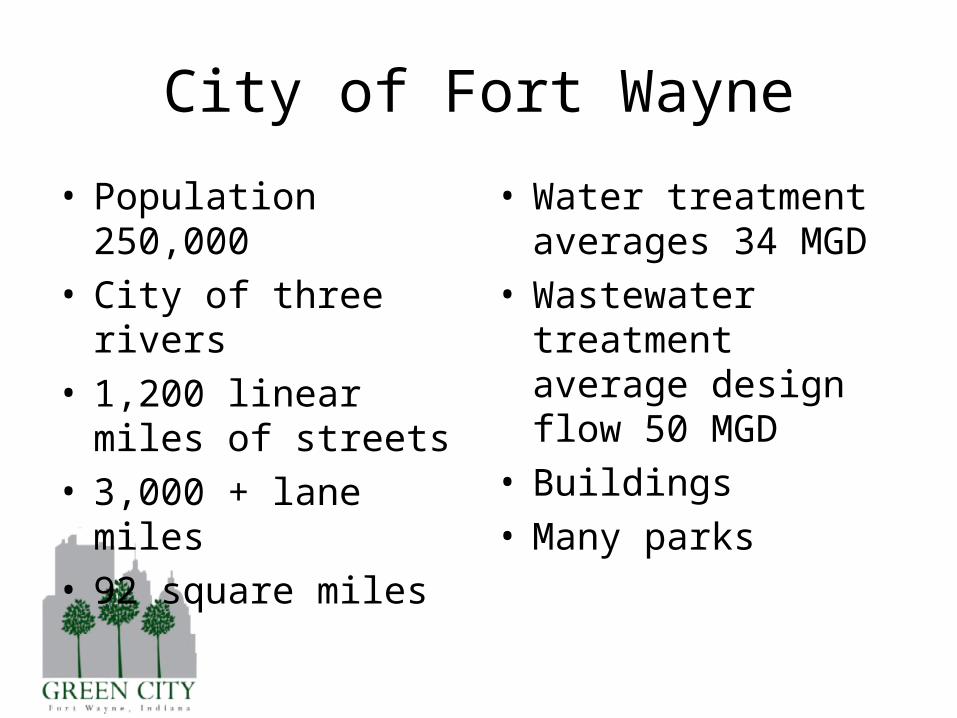
City of Fort Wayne
• Population 250,000• City of three rivers• 1,200 linear miles of
streets• 3,000 + lane miles• 92 square miles
• Water treatment averages 34 MGD
• Wastewater treatment average design flow 50 MGD
• Buildings• Many parks

History
• Participating in– DOE Clean Cities– US Mayors Climate Protection Resolution– ICLEI’s Cities for Climate Protection campaign
• Formed Green Ribbon Commission 2006– Focused on energy use and air quality– High level policy focus
•There are 12 Policy RecommendationsThere are 12 Policy Recommendations
•Transportation
•Buildings
•City Operations
•Policy and Regulations
Green Ribbon Commission ReportGreen Ribbon Commission Report
“Findings and Recommendations”

Transportation
Reduce dependence on traditional automobiles and trucks
Reduce amount of gasoline used by City Fleet 5% by Dec 2007
• alternative fuel vehicles
• trip reduction

Idle Reduction Program
• Software installed on 277 trucks– Estimated savings
$72,000 per year (1 hour per day saved, 1 gal per hour of idling
– First month gas mileage increase 0.1mpg
• City Energy Policy for all others

Hybrids
• 22 hybrids – up 9 in 2007
• 1 dump truck on order –fuel savings 30-45%
• 7 year life cycle – estimated five year pay back now decreased to 4 years
• Driver training is critical to achieve maximum fuel savings
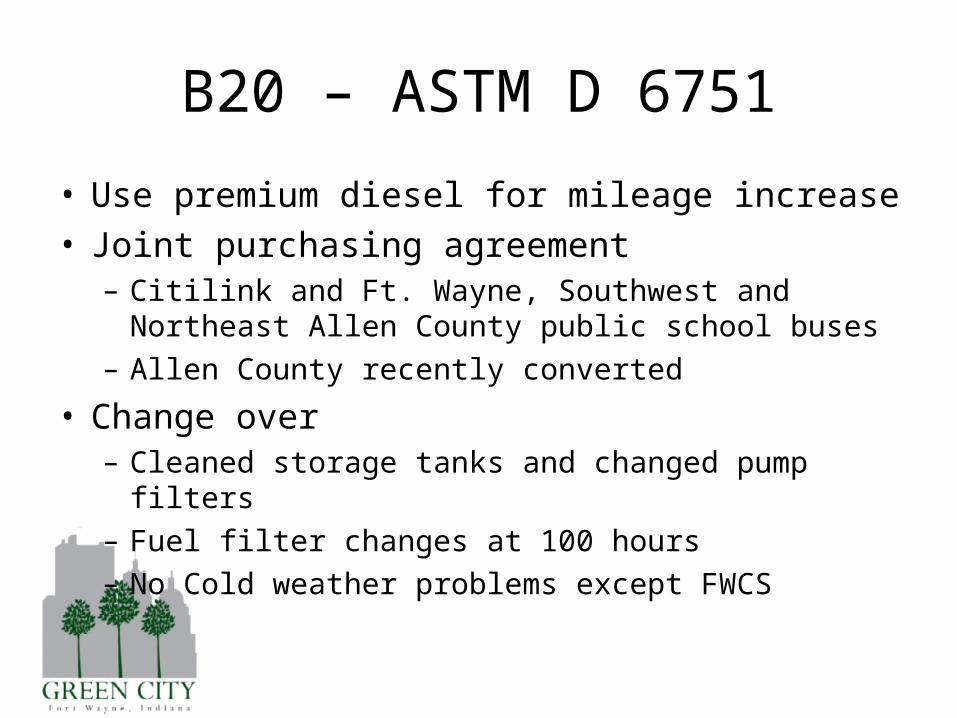
B20 – ASTM D 6751
• Use premium diesel for mileage increase• Joint purchasing agreement
– Citilink and Ft. Wayne, Southwest and Northeast Allen County public school buses
– Allen County recently converted
• Change over– Cleaned storage tanks and changed pump filters– Fuel filter changes at 100 hours– No Cold weather problems except FWCS

B20
• Savings – Fuel costs none– Expecting some when local plants come online
• Emissions – NOx + 1 – 2%– PM – 22%– CO -- 20%– HC -- 30%– Sulphates – 20%– Mutagenicty – 20%
• New low sulfur diesel fuel will reduce CO and PPM further

Increase availability of transportation choices
Transportation
Increase funding for public transportation 20%
Increase bike lanes 25 miles by Dec 2009

Buildings
Improve energy efficiency of existing buildings
Reduce energy use in City buildings 10% by 2010
•Operations
•Lighting
•Building monitoring
MEET 2030 CHALLENGE

Energy Efficiency Buildings
• Baseline completed
• Evaluating buildings for GESC
• Identified one building eligible for Energy Star label

Streets
• All Traffic lights to LED– 5,800– $145,000 savings– Payback 2.4 years
• Christmas LED $1400• Testing LED Street
Light

Buildings
Support developers, homeowners and landlords in reducing energy use
Reduce community and commercial energy use 10% by 2010
•Existing home demonstration
•Program that encourages landlords to upgrade energy efficiency

City Operations
Add renewable energy sources
Implement renewable energy portfolio of 5% by 2010
Identify sources of renewable energy City operations by Dec 2006 and implement by 2010

City’s Energy Policy
energy conservation, energy efficiency and use of renewable energy systems in all
city operations and planning”. . . “The City will also work to educate and support
citizens. . .”
• Includes some quick wins

Government Baseline
Government Energy Use by Sector
35%
22%
11%
15%
17%
Buildings
Vehicle Fleet
Employee Commute
Streetlights
Water/Sewage

Criteria Pollutants Government
Government Criteria Air Pollutants by Sector
0
50,000
100,000
150,000
200,000
250,000
300,000
350,000
400,000
450,000
500,000
NOX SOX CO VOC PM10
lbs
Buildings
Vehicle Fleet
Employee Commute
Streetlights
Water/Sewage

Government Baseline
Government Greenhouse Gas Emissions (Tonnes)
30,565; 35%
9,161; 10%
4,663; 5%
24,875; 28%
20,096; 22%
170; 0%
Buildings
Vehicle Fleet
Employee Commute
Streetlights
Water/Sewage
Waste

Community Baseline
Community Energy Use By Fuel Type
48%
20%
4%
28%
Electricity
Natural Gas
Gasoline
Diesel

Criteria Pollutants Community
Community Criteria Air Pollutants
0
10,000,000
20,000,000
30,000,000
40,000,000
50,000,000
60,000,000
70,000,000
80,000,000
Residential Commercial Industrial Transportation
lbs
NOX
SOX
CO
VOC
PM10

Community Baseline
Community Equivalent Tonnes CO2 Emissions By Fuel Type or Source
5,743,339; 65%
1,879,876; 21%
1,106,632; 12%
216,648; 2%
34,348; 0%
Electricity
Natural Gas
Gasoline
Diesel
Waste

Compact Fluorescent Bulbs
• 18seconds.org• Every home in U.S.
replaced just one– $8 Billion in energy
costs– 2 Million cars off the
road
• Avg. home TWICE the emissions Avg.
car

Home Energy Use