greenhouse gases from fuel cell vehicles · vehicles the best technology commercially available in...
TRANSCRIPT

ASSESSMENT OF EMISSIONS OF
GREENHOUSE GASES FROM FUEL CELL VEHICLES
Prepared For:
Methanex Corporation
Prepared By
(S&T)2 Consultants Inc.Delta, BCCanada
Date: June 5, 2000

(S&T)2Assessment of Emissions of Greenhouse
Gases from Fuel Cell Vehicles

(S&T)2Assessment of Emissions of Greenhouse
Gases from Fuel Cell Vehicles i
EXECUTIVE SUMMARY
Under the Kyoto Protocol, Canada committed to reduce GHG emissions by 6% from 1990levels by the period 2008 to 2012. Most of the other industrialized countries of the worldmade similar commitments, although the exact percentage reduction varies from country tocountry. In most industrial nations transportation represents the single largest source of GHGemissions, in Canada’s case accounting for 27 per cent of the total and 26 per cent in theUnited States. Transportation emissions arise from all sectors of the commercial economyand are inherent to the movement of people and goods for commercial, social andrecreational activities. Hence, measures to reduce emissions from the transportation sectormust be considered very carefully and respect the ramifications of such measures on theeconomy and peoples day-to-day activities. Emissions from transportation in Canada aregrowing faster than the average for all emissions and are forecast to exceed 1990 levels by26 per cent in 2010 and 42 per cent by 2020.
It is clear that the transportation sector has a significant role to play in helping Canada andthe United States meet their objectives under the Kyoto Protocol. One strategy that holdspromise is the development and commercialization of Fuel Cell Vehicles (FCV).
A number of studies have been performed on the GHG emissions of transportation systems.Not all of these studies consider FCV and the full range of fuels for FCV that are potentiallyviable. The studies use different assumptions making it difficult to compare one study toanother. Most of the studies are written from the perspective of the United States and sinceCanada has a different mix of energy sources than the US it is not clear that the results fromUS studies are directly applicable to Canada or other nations. The primary intent of thisreport is to cover most of the fuels currently being considered for FCV and to determine theGHG emissions in the Canadian context. The model being used to calculate GHG’s iscapable of calculating emissions in Canada and the United States so the results for theUnited States are also presented. There is some discussion of the likely results in Japan andEurope based on the carbon intensity of their electricity generating sectors.
The results that are obtained from full cycle emissions models are highly dependent on theassumptions that are modeled. This explains why very different results and conclusions aresometimes found in the literature. The philosophy used for this study is that for new fuels andvehicles the best technology commercially available in the year 2010 is modeled. In the caseof existing fuels such as gasoline the anticipated improvements applied to the existingemissions are modeled. This approach requires some judgement and care has been taken totreat all fuels the same in terms of projected improvements.
The following table presents the GHG emission reduction potential for each of the primaryfuel options in Canada and the United States compared to an equivalent vehicle with aninternal combustion engine operated on 30 ppm sulphur gasoline. It is interesting to note thedifferences in both the absolute value of the reductions and the ranking of the fuel optionsbetween the two countries. The reasons for the variances are many but the primarydifference is the difference in the carbon intensity of the electricity generation between thetwo countries.

(S&T)2Assessment of Emissions of Greenhouse
Gases from Fuel Cell Vehicles ii
Table ES-1 Greenhouse Gas Reductions in 2010
Fuel Source%
Reductionin Canada
Fuel Source%
Reductionin the US
CH2 Natural GasSMR
51.8 CH2 Natural Gas 44.5
LH2 Natural Gas 44.3 Methanol Natural Gas 41.7Methanol Natural Gas 43.5 Sulphur
FreeGasoline
Crude Oil 25.8
SulphurFreeGasoline
Crude Oil 27.5 LH2 Natural Gas 22.5
CH2 Natural GasPOX
25.0 FT Distillate Natural Gas 21.9
FT Distillate Natural Gas 22.5 CH2 Natural Gas toElectricity
13.8
CH2 Natural Gas toElectricity
15.5 CH2 Natural GasPOX
8.5
Electrolytic hydrogen from the existing national mixes of electricity is not a viable option forthe future since new electricity generating capacity will have a different mix than the existinggenerating capacity. The incremental source of electricity in both countries is primarily highefficiency natural gas fired facilities, thus that option is presented in the table.
In both countries the lowest greenhouse gases are derived from decentralized steammethane reforming of hydrogen at a service station site. There are concerns regarding thepracticality of decentralized hydrogen from SMR. The plants are relatively large, somerequire skilled operators, steam generators, cooling water and there may be zoning issueswith installing them on service station sites. Early demonstrations of hydrogen powered FCVhave used liquid hydrogen or electrolytic hydrogen followed by onboard storage ofcompressed hydrogen. Liquid hydrogen is heavily dependent on electricity and this cansignificantly reduce the benefit of the natural gas to liquid hydrogen option as seen in thecase for the US.
The use of partial oxidation reformers may be better suited for small decentralized facilitiesdue to their low cost, ease of operation and their size, but the projected reductions in GHGemissions from this option are only 25% in Canada, half of that projected for steam methanereforming facilities. The situation in the US is even less favorable with only an 8.5% reductionin GHG projected. Methanol fueled vehicles will provide a greater reduction in GHGemissions than hydrogen produced from POX reformers.
A number of sensitivity cases and alternative scenarios are examined as well as the maincases. These include reductions in the upstream emissions of natural gas gatheringsystems, remote methanol and FT distillate facilities using low cost stranded gas reserves,liquid natural gas for countries without gas reserves and high efficiency liquid hydrogen andGTL plants.
Remote methanol facilities are projected to have similar emissions to plants located inCanada or the United States. The extra transportation distances involve more efficient oceantransport and less relatively inefficient rail transport so that overall GHG emissions are littlechanged from the base case. The use of flared gas from these remote locations was not

(S&T)2Assessment of Emissions of Greenhouse
Gases from Fuel Cell Vehicles iii
considered. The GHG credit associated with this gas is substantial and potentially can offsetmost of the emissions associated with a remote processing facility. It should be noted thatapproximately two thirds of the world’s gas reserves could be classified as remote.
Some countries rely on the importation of Liquefied Natural Gas for their domestic naturalgas requirements. In those countries the greatest GHG reductions are derived from themethanol fueled FCV. The additional energy requirements to liquefy the gas outweigh thebenefits of steam methane reforming natural gas to hydrogen.
The use of either sulphur free gasoline or Fischer Tropsch fuels provides only about one halfof the greenhouse gas benefits of steam methane reformed hydrogen or methanol. Whileimprovements in the production efficiency of these gas to liquids processes are probable inthe longer term, due to a number of factors such as their carbon to hydrogen ratio, they arenot likely to reach the greenhouse gas emission reduction potential of the other liquid fuelstudied, methanol.
Fuel Cell Vehicles offer the potential for very significant reductions in greenhouse gasemissions compared to the gasoline powered internal combustion engine driven vehicle. Thechoice of fuel for the fuel cell can significantly impact on the GHG benefit received. Themagnitude of the reduction is dependent on the specific fuel production parameters and isalso country specific. In some countries such as Canada, natural gas to hydrogen via steammethane reforming offers the greatest theoretical reductions in GHG emissions, however ifthe hydrogen is produced using POX technology rather than SMR half of the GHG reductionis lost. In countries without pipeline natural gas, methanol derived from natural gas will givethe greatest reduction. Of the liquid fuels studied the greatest reductions in GHG are frommethanol. Natural gas to methanol offers the most consistent reduction of GHG emissionsfor the various production scenarios and countries examined.

(S&T)2Assessment of Emissions of Greenhouse
Gases from Fuel Cell Vehicles iv
TABLE OF CONTENTS
EXECUTIVE SUMMARY............................................................................................................... i
LIST OF TABLES .........................................................................................................................v
LIST OF FIGURES ......................................................................................................................vi
LIST OF APPENDICES ...............................................................................................................vi
LIST OF ABBREVIATIONS ........................................................................................................vii
1. INTRODUCTION...................................................................................................................... 1
1.1 BACKGROUND ....................................................................................................... 11.2 OVERVIEW OF PREVIOUS STUDIES......................................................................... 21.3 SCOPE OF WORK .................................................................................................. 3
2. GENERAL APPROACH AND METHODOLOGY .................................................................... 4
2.1 OVERALL APPROACH USED FOR THE STUDY .......................................................... 42.2 OVERVIEW OF FULL CYCLE CONCEPT FOR GASOLINE AND ALTERNATIVE FUELS ..... 42.3 FULL CYCLE AND ENERGY BALANCE ANALYSIS METHODS ...................................... 52.4 GREENHOUSE GASES INCLUDED............................................................................ 52.5 MOTOR VEHICLE EMISSION ANALYSIS METHODS.................................................... 6
3. ENERGY PATHWAYS OF INTEREST.................................................................................... 8
3.1 OIL BASED PATHWAYS .......................................................................................... 83.1.1 Crude Oil Production ........................................................................................... 83.1.2 Gasoline .............................................................................................................. 93.1.3 Low Sulphur (30 ppm) Gasoline.......................................................................... 93.1.4 Sulphur Free Gasoline ...................................................................................... 103.2 NATURAL GAS PATHWAYS ................................................................................... 103.2.1 Natural Gas Production..................................................................................... 113.2.2 Hydrogen ........................................................................................................... 123.2.2.1 Compressed Hydrogen ..................................................................................... 123.2.2.2 Liquid Hydrogen ................................................................................................ 133.2.3 Methanol............................................................................................................ 143.2.4 Gas to Liquids.................................................................................................... 153.3 ELECTRICITY PATHWAYS ..................................................................................... 163.3.1 Compressed Hydrogen ..................................................................................... 173.4 SUMMARY ........................................................................................................... 18
4. FUEL CELL VEHICLES ......................................................................................................... 20
4.1 VEHICLES WITH ON BOARD HYDROGEN STORAGE................................................ 214.2 VEHICLES WITH ON BOARD REFORMING.............................................................. 21
5. RESULTS ........................................................................................................................... 23
5.1 BASE CASES - CANADA ....................................................................................... 235.2 BASE CASES – UNITED STATES ........................................................................... 255.3 JAPAN AND EUROPE ............................................................................................ 275.4 ENERGY EFFICIENCY ........................................................................................... 27
6. SENSITIVITY ANALYSES ..................................................................................................... 29
6.1 NATURAL GAS EMISSIONS ................................................................................... 29

(S&T)2Assessment of Emissions of Greenhouse
Gases from Fuel Cell Vehicles v
6.2 HYDROGEN FROM NATURAL GAS ......................................................................... 296.2.1 Partial Oxidation Reformers .............................................................................. 306.2.2 Liquid Natural Gas............................................................................................. 316.3 METHANOL.......................................................................................................... 326.3.1 Remote Methanol Plants................................................................................... 326.3.2 Natural Gas Composition .................................................................................. 346.4 LIQUID HYDROGEN .............................................................................................. 356.5 GTL PLANTS....................................................................................................... 36
7. COMPARISON TO OTHER STUDIES .................................................................................. 38
8. CONCLUSIONS ..................................................................................................................... 41
9. REFERENCES....................................................................................................................... 43
LIST OF TABLES
Table 1-1 Transportation GHG Emissions for 1997 ........................................................... 1
Table 1-2 Previous Studies of Transportation Greenhouse Gas Emissions ..................... 2
Table 2-1 Key Baseline Information for Motor Vehicles in Canada .................................. 6
Table 3-1 GHG Emissions from Crude Oil Production in Canada ..................................... 8
Table 3-2 Greenhouse Gas Emissions for Low and Sulphur Free Gasoline................... 10
Table 3-3 GHG Emissions from Natural Gas in Canada ................................................. 11
Table 3-4 Energy Requirements for Small Scale SMR Plants......................................... 12
Table 3-5 Greenhouse Gas Emissions for Compressed Hydrogen................................. 13
Table 3-6 Greenhouse Gas Emissions for Liquid Hydrogen............................................ 14
Table 3-7 Greenhouse Gas Emissions for Methanol ....................................................... 15
Table 3-8 Energy Efficiencies of Various GTL Proposals ................................................ 15
Table 3-9 Greenhouse Gas Emissions for GTL’s. ........................................................... 16
Table 3-10 GHG Emissions from Electricity Generation.................................................... 17
Table 3-11 Greenhouse Gas Emissions for Electrolytic Hydrogen.................................... 18
Table 3-12 Comparisons of Upstream Emissions.............................................................. 19
Table 4-1 Incremental Weights of Fuel Cell Vehicles ...................................................... 20
Table 4-2 Relative Fuel Economy Ratios for Hydrogen Powered Fuel Cell Vehicles ..... 21
Table 4-3 Summary of Energy Efficiency Ratios for Hydrogen, Methanol, andHydrocarbon Powered Fuel Cell Engines.......................................................................... 22
Table 5-1 Full Cycle Greenhouse Gas Emissions for Fuel Cell Vehicles - Canada........ 24
Table 5-2 Full Cycle Greenhouse Gas Emissions for Fuel Cell Vehicles- United States 26
Table 5-3 Energy Consumed per Mile Traveled .............................................................. 28

(S&T)2Assessment of Emissions of Greenhouse
Gases from Fuel Cell Vehicles vi
Table 6-1 Emission Impact of Reducing Gas System Methane Losses.......................... 29
Table 6-2 GHG Emissions from a POX Reformer for Hydrogen Production Canada ..... 30
Table 6-3 GHG Emissions from a POX Reformer for Hydrogen Production US ............. 31
Table 6-4 GHG Emissions from Remote LNG for Hydrogen Production......................... 32
Table 6-5 Impact of a Remote Methanol Plant on GHG Emissions................................. 33
Table 6-6 Comparison of Remote Gas Options for the United States............................. 34
Table 6-7 Impact of Gas Composition on GHG Emissions for Methanol Plant ............... 34
Table 6-8 Gas Composition For Remote Locations ......................................................... 35
Table 6-9 GHG Emissions for High Efficiency Liquid Hydrogen System......................... 36
Table 6-10 GHG Emissions for a High Efficiency GTL Plant and FCV.............................. 37
Table 7-1 Comparison to Other Studies........................................................................... 38
Table 7-2 Comparison of Levelton Results with This Study ............................................ 39
Table 7-3 Comparison of Pembina Institute Results........................................................ 39
Table 7-4 Comparison of Pembina Vehicle Energy Efficiency Factors ........................... 40
Table 8-1 Reductions in GHG Emissions for Fuel Cell Vehicles in Canada and the US 41
Table 8-2 Comparison of Remote Gas Options for the United States............................. 42
LIST OF FIGURES
Figure 1-1 Energy Pathways for Fuel Cell Vehicles. ........................................................... 3
Figure 2-1 Full Cycle Including Fuel and Vehicle Cycles .................................................... 4
Figure 3-1 Natural Gas Pathways...................................................................................... 11
Figure 5-1 Full Cycle Greenhouse Gas Emissions for Fuel Cell Vehicles – Canada ....... 25
Figure 5-2 Full Cycle Greenhouse Gas Emissions for Fuel Cell Vehicles–United States 27
Figure 5-3 Energy Consumption per Mile.......................................................................... 28
LIST OF APPENDICESAppendix A Delucchi Model. ................................................................................................ 46

(S&T)2Assessment of Emissions of Greenhouse
Gases from Fuel Cell Vehicles vii
LIST OF ABBREVIATIONS
BTU British Thermal Units Energy. To convert to kJ multiply BTU by 1.055CH4 MethaneCH2 Compressed HydrogenCO Carbon monoxideCO2 Carbon dioxideCO2 Equivalent Weighted sum of CO2, CH4 and N2O emissions using the weighting GWP
factors defined below.FCV Fuel Cell VehiclesFT Fischer Tropschg Gramgal US gallon (3.785 L)GHG Greenhouse gasesGJ Gigajoule (109 Joules)GTL Gas to LiquidsGWP Global warming potential over a 100 year period: CO2, 1; CH4, 21; N2O,
310H2 HydrogenHHV Higher heating value of a fuel (combustion moisture as liquid)ICE Internal Combustion EngineIPCC Intergovernmental Panel on Climate Changek Prefix for thousandkm KilometrekWh Kilowatt-hourL or l LitreLH2 Liquid Hydrogenlb Pound (0.4536 kg)M Prefix for million, when used with metric unitm3 Cubic metre, 1000 litresmi Mile (1.609 km)MM Million when applied to an imperial unit of energympg Mile per United States gallonNMOG Non-methane organic gasesNRCan Natural Resources CanadaN2O Nitrous oxideNOx Oxides of nitrogenPM Particulate matterPOX Partial Oxidation Reformerppm Parts per million by volumeS SulphurSCF Standard Cubic Feet (60F, 14.7 psia)SFG Sulphur Free GasolineSMR Steam Methane Reformert Tonne (1000 kg)THC Total hydrocarbonUNFCCC United Nations Framework Convention on Climate ChangeUS United States of AmericaUSG United States GallonVOC Volatile organic compounds, excluding methane and ethane

(S&T)2Assessment of Emissions of Greenhouse
Gases from Fuel Cell Vehicles 1
1. INTRODUCTION
1.1 BACKGROUND
Under the Kyoto Protocol, Canada committed to reduce GHG emissions by 6% from 1990levels by the period 2008 to 2012. Most of the other industrialized countries of the world madesimilar commitments, although the exact percentage reduction varies from country to country.In most industrial nations transportation represents the single largest source of GHGemissions, in Canada’s case accounting for 27 per cent of the total. Transportation emissionsarise from all sectors of the commercial economy and are inherent to the movement of peopleand goods for commercial, social and recreational activities. Hence, measures to reduceemissions from the transportation sector must be considered very carefully and respect theramifications of such measures on the economy and peoples day-to-day activities. Emissionsfrom transportation in Canada are growing faster than the average for all emissions and areforecast to exceed 1990 levels by 26 per cent in 2010 and 42 per cent by 2020 (NRCan 1997).Table 1-1 summarizes transportation GHG emissions for 1997 (UNFCCC 1997 database).
Table 1-1 Transportation GHG Emissions for 1997
Emissions MtEmissions CO2
equivalent MtPercent of Canadian
Totals
Carbon Dioxide 174,000 174,000 33.5
Methane 25 525 0.58
Nitrous Oxide 29 8990 13.8
Total 183,515 27.1
It is clear that the transportation sector has a significant role to play in helping Canada meet itsobjectives under the Kyoto Protocol. One strategy that holds promise is the development andcommercialization of Fuel Cell Vehicles (FCV).
A number of studies have been performed on the GHG emissions of transportation systems.Not all of these studies consider FCV and the full range of fuels for FCV that are potentiallyviable. The studies use different assumptions making it difficult to compare one study toanother. Most of the studies are written from the perspective of the United States and sinceCanada has a different mix of energy sources than the US it is not clear that the results fromUS studies are directly applicable to Canada or other nations. The primary intent of this reportis to cover most of the fuels currently being considered for FCV and to determine the GHGemissions in the Canadian context. The model being used to calculate GHG’s is capable ofcalculating emissions in Canada and the United States so the results for the United States arealso presented as a sensitivity case. There will be some discussion of the likely results inJapan and Europe based on the carbon intensity of their electricity generating sectors.
Typically, about 72% of greenhouse gas emissions arising from a gasoline-fueled motorvehicle originate from the tailpipe, 21% from fuel supply and 7% from vehicle manufacture.Improvements in the fuel economy of vehicles will reduce emissions from the tailpipe andproportionately from fuel manufacturing and delivery for a given type of fuel/vehicle system sothat these percentages do not change significantly from changes in gasoline vehicletechnology. Because of the contribution made by the fuel manufacturing and delivery systemto the total emissions associated with motor vehicle use, it is essential that analysis offuel/vehicle transportation options consider full cycle or lifecycle greenhouse gas emissions.

(S&T)2Assessment of Emissions of Greenhouse
Gases from Fuel Cell Vehicles 2
For a full cycle analysis of greenhouse gas emissions the following types of emission sourcesneed to be considered:• Production of the raw energy source;• Transportation of the energy to a refinery or production plant;• Conversion of the energy to a fuel for use in an internal combustion or fuel cell engine;• Transportation of the fuel to a retail site;• Fuel storage and distribution;• Vehicle operation;• Vehicle assembly and transport, and;• Materials used in the vehicle.
The discussion of the options considered in this report will be grouped by primary energysource (oil, natural gas, and electricity). Within each pathway the discussion will cover theupstream energy production stages, the energy conversion stage where the energy source isconverted into a useful fuel and the vehicle operation stage where the fuel is consumed.
1.2 OVERVIEW OF PREVIOUS STUDIES
Wang (1999) provides an excellent overview of the history of the development of fuel cycleemissions and energy use studies. The first studies were reported by Delucchi in 1991 and1993. These studies have been widely cited in the literature. These studies used an earlyversion of the model used for this study. Delucchi’s early work did not consider fuel cellvehicles and did not consider all of the various hydrogen options and Fischer Tropsch fuelslooked at here. The other studies cited by Wang and their key points are shown in Table 1-2.
Table 1-2 Previous Studies of Transportation Greenhouse Gas Emissions
Authors Date Key PointsDelucchi 1991,1993 First Studies. No Fuel Cell Vehicles. Limited Fuel
OptionsNREL 1991,1992 Cellulosic ethanol and reformulated gasoline only. No
fuel cell vehiclesBently 1992 Idaho National Lab. Some fuel cell vehicles. Limited fuel
choices. Limited data from upstream stages.Brogan andVenkateswaran
1992 19 propulsion system-fuel choices studied includingFCV. Limited upstream data used. Incomplete fuelcycles.
Ecotraffic 1992 Results for Sweden. No FCV. Only 5% of electricity isgenerated from carbon based fuels gives very differentresults than US studies.
Wang and Santini 1993 Electric and gasoline vehicles only for 4 US cities.Darrow 1994 No fuel cell vehicles. Electric vehicles, CNG and other
alternative fuels. US and California data.Acurex 1996 California focus. No FCV. GHG and criteria emissions
considered.Delucchi 1997 Update of earlier work. No FCV. Additional fuels and fuel
options, eg compressed or liquid hydrogen, centralizedor decentralized options.
Argonne 1998 Electric vehicle focussed.Sheehan 1998 Biodiesel onlyWang 1999 Greet 1.5. Includes FCV. Wide range of Fuel OptionsLevelton 1999 Application of Delucchi model to Canada. Updated to
include FCV

(S&T)2Assessment of Emissions of Greenhouse
Gases from Fuel Cell Vehicles 3
Wang concluded that the work by Delucchi and Acurex was the most comprehensive in termsof fuels and vehicle technologies. Delucchi established the spreadsheet model approach to fullcycle emissions analyses.
1.3 SCOPE OF WORK
This study compares the full cycle emissions of seven energy pathways to power a fuel cellvehicle to that of the conventional oil to gasoline for the internal combustion engine pathway.The pathways are shown in Figure 1-1. Four pathways involve the off board production ofhydrogen, natural gas to compressed or liquid hydrogen, liquid natural gas to compressedhydrogen, and natural gas to electricity to compressed hydrogen and three involve the onboard generation of hydrogen from methanol, zero sulphur gasoline and from Fischer Tropschnaphtha or distillate. The study also investigates the sensitivity of the results to some of thekey input variables for each of the three stages in the full cycle. The later data is useful tounderstand the relative importance of the stages in the cycle, the degree of uncertainty ofsome of the processes, in how technologies may develop over time, and where researchefforts may offer the biggest rewards.
Figure 1-1 Energy Pathways for Fuel Cell Vehicles.
Oil Conventional Gasoline Internal Combustion Engine
Zero Sulphur Gasoline
Natural Gas Compressed Hydrogen
Liquid Hydrogen Hydrogen Fuel Cell Vehicle
Electricity Methanol
GTL Distillate Reformer Fuel Cell Vehicle

(S&T)2Assessment of Emissions of Greenhouse
Gases from Fuel Cell Vehicles 4
2. GENERAL APPROACH AND METHODOLOGY
2.1 OVERALL APPROACH USED FOR THE STUDY
The objectives of the study require the development of reliable estimates of the energy useand greenhouse gas emissions associated with production and use of gasoline and fuels usedin fuel cell vehicles. Given the developing nature of FCV the year 2010 was chosen as thetime of comparison. This recognizes that existing FCV are pre-production prototypes thatrequire further development. The technology for some of the fuel production options isdeveloping rapidly as well. With this information, the net effect on energy consumption andgreenhouse gas emissions of fuel cell vehicles can be determined.
Lifecycle energy use and greenhouse gas emissions for gasoline in Canada are thereferences for comparison in this study. All stages were considered in the lifecycle of gasoline,from crude oil production, through to refining and use in a motor vehicle. The energy used forrefining has been modeled considering the average Canadian refinery and the average forcrude oil produced in Canada. The differences between Canada and the United States arediscussed along with the likely impact in other regions such as Japan and Europe. Themethods used for the analysis are discussed later in this chapter.
2.2 OVERVIEW OF FULL CYCLE CONCEPT FOR GASOLINE AND ALTERNATIVE FUELS
The full cycle concept of analyses considers all inputs into the production and use of a fuel. Itcombines the fuel production, vehicle manufacture and fuel use in a single analysis (seeFigure 2-1.) It is also referred to as the fuel cycle by some authors. The ultimate result is avalue that can be used for comparison of different commodities on the same basis, such asper unit of fuel energy or per kilometre driven. Greenhouse gas emissions over the full cycleinclude all significant sources of these emissions from production of the energy source (i.e.crude oil, biomass, natural gas, etc.), through fuel processing, distribution, and onward tocombustion in a motor vehicle for motive power. A life cycle analysis should also includegreenhouse gas emissions from vehicle material and assembly as these emissions areaffected by the choice of alternative fuel/vehicle technology. Since most of the vehiclesconsidered here are Fuel Cell Vehicles this extra step does not significantly change theresults. Wide ranges of emission sources are involved in the production and distribution offuels, and these vary depending on the type of fuel.
Figure 2-1 Full Cycle Including Fuel and Vehicle Cycles

(S&T)2Assessment of Emissions of Greenhouse
Gases from Fuel Cell Vehicles 5
2.3 FULL CYCLE AND ENERGY BALANCE ANALYSIS METHODS
Two spreadsheet models are available from the United States to facilitate full cycle emissionanalysis; one developed by Delucchi (1991, 1993, and 1998), the other by Wang (1996, 1999).The work of Delucchi in the 1987-1993 period resulted in the development of a spreadsheetmodel based on Lotus software for AppleTM computers, which contained capabilities forpredicting emissions of greenhouse gases and criteria non-greenhouse gases from most ofthe alternative fuels of potential interest in this study. The model is comprehensive in scopeand level of detail, and, hence, requires input of extensive information on the energy usage forfuel production, distribution and related fuel cycle sources, as well as factors for emissions ofnon-greenhouse gases from these sources and motor vehicles. Using some of the results fromthe Delucchi model and a simplified approach based on the application of energy conversionefficiencies and relative emission factors for emissions from the full cycle sources, Wang(1996, 1999) developed a more user-friendly spreadsheet model for the US DOE in ExcelTM.This model is available on the Internet at www.ipd.anl.gov/ttrdc/greet/greet1-5.zip.
Delucchi has updated his model since 1993, as described in Delucchi and Lipman (1997) anda report by Energy and Environmental Analysis Inc. (1999). This work has focused primarilyon updating the earlier model to include recent data for motor fuel production, processing,distribution and use in the United States, and incorporation of improved algorithms forpredicting non-greenhouse gas emissions from motor vehicles based on the U.S. EPA Mobile5 model. A partial Canadianization of the Delucchi model was completed by Delucchi (1998)for Natural Resources Canada (NRCan) in late 1998 through to March, 1999, drawing frominformation on the production and distribution of conventional and alternative fuels that wasprovided by NRCan and Statistics Canada and some other Canadian government agencies.
The partially Canadianized version of the full cycle model prepared by Delucchi in 1998 wasfurther developed by Levelton and (S&T)2 (1999) for NRCan. Levelton and (S&T)2 has alsoused it for two studies for Agriculture and AgriFood Canada and (S&T)2 has used it for a studyfor the Province of Alberta. This Canadianized version was selected for use as the startingpoint for this study. It was considered to yield the most rigorous life cycle analysis of bothgreenhouse and non-greenhouse gases from alternative motor fuels, and had the advantageof incorporating functional capabilities and data for analysis of Canada specifically. Theparameters used in the model for predicting emissions from gasoline and ethanol productionand use were further refined to accurately simulate full cycle emissions in the study area. Themodel utilizes the higher heating value (HHV) for the energy content of all fuels. More detailon the model is presented in Appendix A.
2.4 GREENHOUSE GASES INCLUDED
The greenhouse gases include in the calculations for this report are carbon dioxide (CO2),methane (CH4) and nitrous oxide (N2O). The emissions have been weighted according to theIntergovernmental Panel on Climate Change (IPCC) guidelines where CO2 has a weightingfactor of 1.0, CH4 is assigned a value of 21.0 and N2O has a weighting factor of 310. These arethe 100-year global warming potential (GWP) multipliers recommended by the IPCC.Throughout the report we will report primarily CO2 equivalent values. This will be the weightedsum of the three greenhouse gases. In some areas this will be further broken down to providedetail on the separate gases.
Other gases and contaminants associated with the production and use of fossil and renewablefuels, such as carbon monoxide, non-methane organic gases, oxides of nitrogen andparticulates, also have the potential to influence climate change, either directly or indirectly.The global warming potential of these other gases has not been considered in this study, to be

(S&T)2Assessment of Emissions of Greenhouse
Gases from Fuel Cell Vehicles 6
consistent with the approach being used by the National Climate Change Secretariat and theIPCC.
2.5 MOTOR VEHICLE EMISSION ANALYSIS METHODS
The primary emphasis of the study was on life-cycle energy balances and greenhouse gasemissions. The fuel economy of conventional motor vehicles and the relative efficiency of FCVare important inputs to the analysis. The assumptions made for each of the fuel and vehiclecombinations are clearly described in the appropriate section of the report.
The baseline is a conventional gasoline vehicle fuelled by low sulphur (30 ppm) gasoline. Thetime period under consideration is 2010 when it is expected that FCV will be relatively maturetechnology. The average 2010 vehicle is expected to have slightly better fuel economy thanexisting vehicles. Some key baseline information for motor vehicles from NRCan is shown inTable 2-1. The distance travelled and fuel economy data is used in the model.
Table 2-1 Key Baseline Information for Motor Vehicles in Canada
Parameter 1995 2000 2010 2020
1995-2020
ANNUALGROWTHRATE(%/YR)
Vehicle stock (thousands of vehicles)Automobiles 11,349 11,436 12,249 13,964 + 0.83Gasoline Trucks 4,231 4,759 6,158 7,703 + 2.43Light-Duty Diesel Trucks 310 364 453 505 +1.97Heavy-Duty Diesel Trucks 210 216 257 315 +1.64Total (rounded) 16,100 16,780 19,120 22,520 + 1.35
Average Km Traveled (km/yr)
Automobiles 21,579 21,721 21,977 22,509 +0.170
Gasoline Trucks 21,229 21,061 21,095 21,364 +0.025
New Vehicle Fuel Economy 1,2
Automobiles (L/100km) 8.1 8.0 7.5 6.9 - 0.62Automobiles (miles/USG) 29.2 29.5 31.5 34.2 - 0.62Gasoline Trucks (L/100km) 11.2 11.1 10.6 10.0 -0.45
On-Road New Vehicle Fuel EconomyAutomobiles (L/100km) 9.7 9.6 9.0 8.3 - 0.62Automobiles (miles/USG) 24.3 24.6 26.2 28.5 - 0.62Gasoline Trucks (L/100km) 13 13.3 12.7 12.0 -0.45
Car Stock Fuel EconomyAutomobiles (L/100km) 10.0 9.7 9.1 8.4 - 0.7Automobiles (miles/USG) 23.6 24.3 26.0 28.1 - 0.7
Greenhouse Gas EmissionsCarbon Dioxide(Mt)3 108.9 112.6 124.8 140.6 + 1.03Methane (kt)3 17.1 17.7 19.6 22.0 + 1.03N2O (kt)3 44.0 46.0 50.8 57.2 + 1.03Total CO2 Equivalent 4 122.9 127.2 140.9 158.8 + 1.03
1 Combined city/highway fuel economy based on 0.55 city: 0.45 highway kilometers travelled assumed for the USEPA test
procedure2 On-Road vehicle fuel economy 1/1.2 (Jaques et al, 1997)3 Disaggregated from data in NRCAN, 1997 using data in Jaques, et al, 19974 CO2:1; CH4:21; N2O:310

(S&T)2Assessment of Emissions of Greenhouse
Gases from Fuel Cell Vehicles 7
The analysis of fuel cycle emissions utilizes annual distance traveled and vehicle survivalstatistics to estimate cumulative distance traveled by a typical vehicle and its non-greenhousegas emissions at the mid-point of its life.5
Emissions of regulated pollutants such as carbon monoxide, nitrogen oxides, VOC’s,particulates and sulphur oxides can be calculated by the model. For vehicle emissions themethodology used is a modified version of the Mobile 5 model developed by the US EPA. Itmust be recognized that very little information on these types of emissions is available for FCVat the current time. Ratios of expected emissions for FCV to the projected emissions of 2010gasoline powered vehicles have been estimated in order to complete the full cycle analyses.
5 The annual kilometer accumulation rates and survival fractions used in this study for passenger cars and heavy-dutyvehicles were originally provided by NRCan to Levelton (1999).

(S&T)2Assessment of Emissions of Greenhouse
Gases from Fuel Cell Vehicles 8
3. ENERGY PATHWAYS OF INTEREST
Fuel cell vehicles require hydrogen to produce electricity. Hydrogen must be viewed as anenergy carrier rather than an energy source. That is, it must be made from another source ofenergy such as crude oil, natural gas, electricity or perhaps coal or biomass. The energysource considered here are oil, natural gas and electricity from a variety of sources as theseare the most likely energy sources to be used in the 2010 time period.
For the conversion of the energy source to hydrogen and the utilization of the hydrogen in aFCV it is assumed that a state of the art facility will be used to make the conversion. This isappropriate given the 2010 time period under consideration and the fact that a significantmarket penetration of FCV will require new facilities to produce the hydrogen or hydrogencarrier. It has been assumed that there will be continual improvement in energy efficiency forthe conventional oil refineries but it is not assumed that new grass roots refineries will beconstructed. This comparison of new and old is valid because it is unlikely that new energyefficient refineries will be built to replace the existing facilities.
3.1 OIL BASED PATHWAYS
Two oil based pathways are studied, the baseline case of low sulphur gasoline used in aconventional internal combustion engine and the case where a zero sulphur gasoline is usedin a fuel cell vehicle with an onboard reformer. In the later case the fuel is produced in aconventional refinery and could be used in an internal combustion engine.
3.1.1 Crude Oil Production
The production of crude oil requires energy to extract it from the ground and in some cases toupgrade it to a form that can be used in a refinery. There can also be fugitive emissions ofmethane and carbon dioxide arising from the extraction process. Crude oil production can beclassified according to the type of oil produced (light, heavy, bitumen) and according to theprocess (conventional or oil sands). In Canada, the Canadian Association of PetroleumProducers (CAPP 1998) has inventoried the GHG emissions from oil extraction for thedifferent types of crude oils. That data is summarized in Table 3-1.
Table 3-1 GHG Emissions from Crude Oil Production in Canada
Type Indirect CO2 Methane Nitrous Oxide TotalUnits Gms CO2
eq/M3Gms CO2
eq/M3Gms CO2
eq/M3Gms CO2
eq/M3Gms CO2
eq/M3
Conventional 150,730 49,870 1,460 202,060Heavy Oil 260,620 80,490 373,750 270 715,130Bitumen 450,240 25,710 2,500 478,450Oil Sands 17,370 677,400 38,820 7,840 741,430
WeightedAverage
55,310 241,200 126,530 2,320 425,360
The indirect emissions are the result of purchased electricity used in the extraction process. Itis obvious from the table that there is considerable variation in emissions between the types ofcrude oil that can be processed to produce gasoline. Emissions in Canada have a tendency tobe higher than in some other countries due to the greater proportion of heavy oil and oil sandderived crude oil produced here. The US emissions for crude oil production that are includedin the model are about 195,000 gms CO2 eq/M3. This is very similar to the Canadian

(S&T)2Assessment of Emissions of Greenhouse
Gases from Fuel Cell Vehicles 9
conventional oil values. Higher emissions from the transportation of imported oil and higheremissions in the refineries due to more complex processing offset this lower US crude oilproduction value.
Oil producers are working hard to reduce emissions. The oil sands producers in particularhave plans to reduce emissions substantially from these 1995 levels. At the same time there isa great expansion underway in the oil sand and heavy oil sectors so it is not expected thatsignificant changes in the average emissions will occur in the near future.
The model has been calibrated to represent the volumetric weighted average emissions forCanadian crude oil production. This is a conservative approach as it could be argued that FCVwill displace the marginal source of crude oil which is likely to be tar sands synthetic crude oil.This oil has the highest GHG emission rate 75% higher than the average emission rate.
The distribution emissions for crude oil are based on the average pipeline emissions resultingfrom the movement of the crude from the field to refineries across Canada. No imported crudeoil is included in the Canadian results.
3.1.2 Gasoline
The energy and type of energy used to make gasoline in Canadian refineries was extractedfrom the Foundation Paper for the Downstream Petroleum Industry, (Purvin & Gertz 1999) andfrom published Canadian Refining Industry averages (Nyboer). Interviews with Canadianrefiners provided insight into expected energy efficiency improvements in the refineries overthe next decade and this was incorporated in the model.
The energy consumed in the refinery has been allocated to the individual products based onestimates of the energy used in each processing unit.
Canadian refiners use less energy to produce gasoline than American refiners. The positivevariances are due to lower gasoline production per barrel of oil in Canadian facilities, thusrequiring less intensive refining. The use of some octane additives in Canada also lessensenergy consumption. These are only partially offset by generally larger, more efficientrefineries in the US.
The industry does have some options for reducing energy consumption below the levelsprojected here depending on the processes chosen to reduce sulphur levels. New unprovenprocesses are available but most will not be proven until after the industry needs to make itsinvestment decisions to meet Canadian standards for 2002 and 2005.
3.1.3 Low Sulphur (30 ppm) Gasoline
Low sulphur (30 ppm) gasoline will be required in Canada and the United States starting in2005 and it is assumed that it will still be the requirement in 2010. This gasoline will enablevehicle catalytic converters to operate at maximum efficiency over the life of the unit and willresult in lower N2O emissions from the vehicle compared to today’s cars and fuels. This loweremission rate is factored into the full cycle emission data.
The Foundation Paper was used to verify the incremental refinery energy use in 2010 whenlow sulphur (30 ppm sulphur) gasoline will be required. This estimate is based on conventionalhydrotreating technologies and replacing the lost octane that these processes cause. Thereare newer processes being developed that use less energy, they have not yet beencommercially demonstrated.

(S&T)2Assessment of Emissions of Greenhouse
Gases from Fuel Cell Vehicles 10
The emissions for the storage and distribution of gasoline are based on the typical Canadiandistribution system with a combination of pipeline, rail and truck used to move the product fromrefineries to service stations.
The greenhouse emissions for the production and distribution of low sulphur gasoline areshown in Table 3-2.
3.1.4 Sulphur Free Gasoline
Sulphur free gasoline will be extremely difficult to produce and distribute without beingcontaminated with some sulphur. The industry is now suggesting that sulphur free gasolinemay contain 5 to 10 ppm of sulphur to allow for the inevitable contamination of the fuel throughthe distribution network. Within the refinery it will still be necessary to produce a product withvery close to zero sulphur. This will require more energy and a higher cost compared to the 30ppm level that will be commercialized by 2005.
There is very little data available on producing this very low sulphur gasoline. A recentanalysis by MathPro Inc. for the Alliance of Automobile Manufacturers investigated theprocess requirements, the costs, and included estimates of the extra energy required toachieve 5 ppm gasoline. It was determined that a multitude of measures will be requiredincluding increasing the severity and scope of FCC naphtha desulphurization, desulphurizingother refinery streams and applying best practices in refining operations to control the sulphurcontent of other refinery streams. The analysis only considered the new low energy processesunder development. There was a requirement for about 10% more energy to achieve 5 ppmcompared to 30 ppm sulphur. For the purposes of this analysis it will be assumed that there isan energy requirement of 10% more than the 30 ppm case. It should be noted that this sulphurfree gasoline is still likely to require a sulphur trap on the FCV.
The emissions for the production of crude oil, refining of gasoline and distribution of the fuel toa service station are shown in Table 3-2 for both low and zero sulphur gasolines.
Table 3-2 Greenhouse Gas Emissions for Low and Sulphur Free Gasoline
Stage 30 ppm S Gasoline Sulphur Free GasolineEmissions Emissions
Units Gms CO2 / million BTUdispensed
Gms CO2 / million BTUdispensed
Fuel Dispensing 162 156Fuel Distribution and Storage 1,212 1,196Fuel Production 12,733 13,848Feedstock Transmission 206 206Feedstock Recovery 8,880 8,877Gas Leaks and Flares 2,677 2,677Total 25,871 26,960
3.2 NATURAL GAS PATHWAYS
There are four natural gas pathways considered here. Natural gas can be reformed to makehydrogen, which can be compressed or liquefied and then used in a FCV, or the natural gascan be converted to methanol or naphtha/distillate via a Gas to Liquids process, the methanolor naphtha is then reformed to hydrogen on board a vehicle. The pathways are shown inFigure 3-1. The full cycle emissions for each of these pathways is considered in the followingsections.

(S&T)2Assessment of Emissions of Greenhouse
Gases from Fuel Cell Vehicles 11
Figure 3-1 Natural Gas Pathways
Natural Gas Compressed Hydrogen
Liquid Hydrogen Hydrogen Fuel Cell Vehicle
Methanol Reformer Fuel Cell Vehicle
GTL Distillate
3.2.1 Natural Gas Production
Natural gas supplies a significant portion of Canada’s and the world’s energy requirements. Itcan be used directly as a fuel or as feedstock for fuels such as methanol and hydrogen. It hasthe lowest carbon content of any fossil fuel and thus has the potential to reduce greenhousegas emissions compared to other fossil fuels. Natural gas reserves are abundant anddistributed throughout the world. There is also a significant amount of natural gas in the worldthat is vented or flared because it is remote from markets. There is the potential to capture thisgas, convert it to methanol, hydrogen or GTL’s and use the fuel for fuel cell vehicles. Thepotential impact of the use of this stranded gas is discussed in the sensitivity section of thereport.
The natural gas industry in Canada has inventoried the emissions of greenhouse gases thatarise from the production, processing, transmission, distribution and use of natural gas (CGA1997 and Radian 1997). This industry data for 1995 is summarized in Table 3-3. The data hasbeen used as inputs to the model for all natural gas based processes. The production,processing, transmission and storage emissions are attributed to all of the marketable gasproduced in Canada and the distribution emissions are attributed to the gas sold in Canada.
Table 3-3 GHG Emissions from Natural Gas in Canada
CarbonDioxide
Methane NitrousOxides
CO2
Equivalents% of Total
Units Kilotonnes Kilotonnes Kilotonnes KilotonnesProduction 3,879 607 0.8108 16,877 29.4Processing 18,038 115 1.0004 20,763 36.2Transmission 10,560 271 0.6002 16,437 28.7Storage 63 6.9 0.0158 213 0.4Distribution 95 141 0.0008 3,056 5.3Total 32,635 1,140 2.43 57,347 100.0% of Total 56.9 41.7 1.3 100.0
The industry has an active program in place to reduce GHG emissions. Emissions of methaneas a function of marketable gas have been declining through the 1990’s and comparefavourably with US emission rates. It has been assumed that methane leakage rates willdecline from these 1995 levels at 0.5% per year for processing, storage and transmissionstages and at 1% per year for the other stages. This is being accomplished by theimplementation of no-bleed pneumatic devices, turbine compressor engines, plastic pipeinstead of steel and cast iron distribution mains and by increased utilization of existing mainswhere losses are a function of the system configuration and not the throughput.

(S&T)2Assessment of Emissions of Greenhouse
Gases from Fuel Cell Vehicles 12
3.2.2 Hydrogen
The conversion of natural gas to hydrogen is a well-established commercial process. Theconversion is generally carried out by a process known as steam methane reforming (SMR).The commercial plants are usually fairly large with a capacity of two to 50 tonnes per day (0.8to 20 million SCF per day). For some niche applications units as small as a few hundredkilograms of hydrogen a day can be economic. The use of alternative technology known aspartial oxidation (POX) will be investigated as a sensitivity case.
Two concepts are evaluated. The first involves the onsite generation of compressed hydrogenat a service station and the second is a central facility for the production of liquid hydrogenwhich is then transported to a local service station. These concepts are considered to be themost likely scenarios for the development of a hydrogen fuel infrastructure.
It is beyond the scope of this report to consider the feasibility of the options being consideredbut it must be noted that the production of hydrogen by a SMR plant located at a servicestation is a very different concept to the modern service station. The SMR plant is quite large,although some manufacturers offer skid mounted units, and may not fit on many sites. Therewill be zoning issues in many jurisdictions as the plants are more of a chemical manufacturingfacility, utilizing steam, high process pressures and temperatures, than a fuel retailer. Somemanufacturers require skilled operators but others offer unattended operations. Thetechnology offers the highest efficiency and is included in most other studies so it is includedhere.
3.2.2.1 Compressed Hydrogen
The average Canadian urban service station will sell 5 million litres of gasoline per year. Thisstation supplies the needs of about 2500 vehicles. If a hydrogen system is sized to meet theequivalent energy demand and consideration is given to the higher efficiency of a FCV thenthere will be a requirement for approximately 2000 kg of hydrogen per day. This is equivalentto 800,000 SCF per day of hydrogen. This assumes that all of the vehicles using this stationuse hydrogen. This may not be a reasonable scenario in the early years of introduction of FCVso in the sensitivity section of the report the impact of smaller hydrogen production facilitieswill be studied.
There is some loss of efficiency when plants of this size are produced. The energyrequirements for SMR plants of this size are shown in Table 3-4.
Table 3-4 Energy Requirements for Small Scale SMR Plants
Vendor Natural Gas Used Electrical Power SourceSCF/million BTU H2 KWh/million BTU H2
Caloric 1445 2.3 www.caloric.deMahler 1500 2.7 Company brochurePraxair 1400 296 Thomas et al.BOC 1260 12.75 Thomas et al.
The specific case modeled will be 1450 SCF of natural gas (1000 BTU/SCF) and 2.5 kWh ofelectricity plus the electricity for compression per million BTU of hydrogen. It is assumed thatthis will improve by 0.20% per year between the base year of 1996 and 2010 and that in theyear 2010 the gas consumption will be 1387 SCF/million BTU. The system efficiency in 1996is 68% and it will improve by 2010 to be 69.9%.
6 Includes compression energy.

(S&T)2Assessment of Emissions of Greenhouse
Gases from Fuel Cell Vehicles 13
It is assumed that electricity will be used to drive the hydrogen compressors at the servicestation site and that the storage pressure will be 5000 psi. The greenhouse gas emissions forthe production and compression of hydrogen are shown in Table 3-5.
Table 3-5 Greenhouse Gas Emissions for Compressed Hydrogen
Stage EmissionsUnits Gms CO2 / million BTU dispensedFuel Dispensing 4,580Fuel Distribution and Storage 296Fuel Production 75,611Feedstock Transmission 3,365Feedstock Recovery 5,604Gas Leaks and Flares 5,836CO2 from Natural Gas 955Total 96,246
3.2.2.2 Liquid Hydrogen
Liquid hydrogen has a density 790 times that of gaseous hydrogen and 3.1 times that ofhydrogen compressed to 5000 psi. The higher density results in lower distribution costs andmay make off site hydrogen production an attractive option for the refueling infrastructure.
The concept of a large SMR facility producing liquid hydrogen which is then distributed bytruck to local service stations is one that is often described for the refueling infrastructure forhydrogen powered FCV’s. Large SMR can be more efficient than smaller units that wouldlocated on site due to the scale of the units and the potential to recover and reuse some of thesurplus energy generated by such units. However, the liquefaction process is relativelyinefficient and requires substantial electrical energy.
Liquefaction plants sizes have been reduced over the past fifty years. In the 1950’s plantstypically had capacities of 25 to 60 t/d. There are about 10 medium sized plants in operationaround the world with capacities of as small as 10 t/day. Recently, small-scale plants withcapacity of 3-12 t/d have been built in the US, Japan and Europe.
The natural gas requirements in very large plants can be as low as 1250 SCF/million BTU ofhydrogen produced (Linde). Thomas reported gas requirements for plants ranging is size from26.7 t/d to 327 t/d. In general gas consumption decreased with increasing plant size, with thesmaller plants needing 1470 SCF/million BTU and the largest plant using 1365 SCF/millionBTU.
The base case modeled will be a 26.7 t/d plant currently consuming 1378 SCF/million BTU ofhydrogen. The same 0.2% efficiency improvement rate used for smaller plants will be appliedbetween 1996 and 2010. The gas consumption in 2010 will be 1350 SCF/million BTU ofhydrogen. The liquid hydrogen will be transported by truck an average distance of 500 km toreflect the likely early introduction, low market penetration scenario. Fuel boil off and leakageis a problem with all cryogenic fuels. It has been assumed that in 2010 1.3% of the hydrogenis lost due to leakage and boil off at each of the three transfer stages in this scenario. This isthe same case modeled by Delucchi in his work. A sensitivity case will be run with a largermore efficient plant and shorter transportation distances to reflect the case of very significantmarket penetration.
The energy required for liquefaction will be supplied by electricity. Wurster (1994) reportselectrical consumption of 13 kW/kg of hydrogen equivalent to an efficiency of 69%. Wurster

(S&T)2Assessment of Emissions of Greenhouse
Gases from Fuel Cell Vehicles 14
reports on long term technology developments that may reduce this to 9 kW/kg (79%efficiency) by 2020 and perhaps as low as 5 kW/kg (88% efficiency) by 2050. Wang (2000)reports an efficiency of 65% for current technology and 70% for future applications. Delucchireports efficiencies of 74% for large central facilities and 67% for small remote locations.Wurster’s data for existing technology (69% efficiency) will be modeled here. Note that Wang’sestimate for future technology is only 70%. The greenhouse gas emissions for the productionof liquid hydrogen are shown in Table 3-6.
Table 3-6 Greenhouse Gas Emissions for Liquid Hydrogen
Stage EmissionsUnits Gms CO2 / million BTU dispensedFuel Dispensing 22,758Fuel Distribution and Storage 801Fuel Production 74,491Feedstock Transmission 3,339Feedstock Recovery 5,560Gas Leaks and Flares 5,860CO2 from Natural Gas 947Total 113,757
Greenhouse gas emissions for liquid hydrogen applications are about 18% higher than theemissions for compressed hydrogen due to the extra energy required for liquefaction.
3.2.3 Methanol
The production of methanol from natural gas is practiced around the world. The technology iswell known and most existing facilities use a version of steam methane reforming. There areabout ten process licensors offering process packages. Some of these licensors offeralternative designs such as autothermal or combined reforming and some of these newdesigns are starting to make inroads into the market. There is a considerable renewal effortunderway in the methanol industry. Small, old inefficient plants are being closed and replacedwith large, efficient lower cost facilities. This rapid, continual improvement in a competitiveindustry accounts for much of the variation concerning methanol plant efficiencies found in theliterature.
The efficiency of the methanol conversion process has a large impact on the greenhouse gasemissions produced. Existing SMR methanol plants consume about 100 SCF (35.8GJ/t)(63.3% efficiency HHV) of natural gas per USG of methanol produced. New combinedreforming facilities can reduce gas consumption to 30.0-31.2 GJ/t (84-88 SCF per USG)(72.5-75% energy efficiency HHV)(Lurgi, 1997). The basis for the modeling will be 31.8 GJ/t in theyear 2000, improving at the rate of 0.2% per year to the year 2010. The gas requirement in2010 will be 31.2 GJ/t. The plant is assumed to produce its own electricity and the energy forthat is included in the gas consumption.
Methanol is produced in large plants. This means that a few plants could supply the methanolrequirements of many FCV’s. The distribution of methanol may involve water transport,depending on where the plant is built, as well as rail and truck transport. The base casemodeled here assumes that the methanol moves 1700 miles by rail and 75 miles by truck. The1700 miles is the current weighted average rail distance that product moves from theMethanex plant in Medicine Hat to Canadian customers. This puts the methanol plant veryclose to the source of gas and it is assumed that the relative distance for the transmission ofthe feedstock is 12% of the average transmission distance for other gas uses such ashydrogen plants, commercial and residential applications. The impact of alternative distribution

(S&T)2Assessment of Emissions of Greenhouse
Gases from Fuel Cell Vehicles 15
scenarios will be investigated in the sensitivity of the report. With a large enough demand formethanol it is possible that it could be moved by pipeline which is more energy efficient thanrail movements. The greenhouse gas emissions and the impact of gas consumption on thoseemissions is shown in Table 3-7.
Table 3-7 Greenhouse Gas Emissions for Methanol
Emissions Emissions EmissionsGas Consumption 35.8 GJ/tonne 31.8 GJ/tonne 31.2 GJ/tonne
SMR Today CombinedReforming Today
CombinedReforming 2010
Units Gms CO2 / millionBTU dispensed
Gms CO2 / millionBTU dispensed
Gms CO2 / millionBTU dispensed
Fuel Dispensing 279 279 279Fuel Distribution and Storage 5,655 5,655 5,655Fuel Production 18,185 10,229 9,049Feedstock Transmission 442 399 393Feedstock Recovery 6,110 5,516 5,429Gas Leaks and Flares 3,371 3,045 2,995CO2 from Natural Gas 1,041 940 925Total 35,083 26,063 24,725
3.2.4 Gas to Liquids
The need for fuels with essentially no sulphur has resulted in some interest in naphtha anddistillates from gas to liquids processes being considered for FCV. Gas to liquids processesare commercially operated by Sasol and Shell in South Africa and Malaysia respectively. Theprocesses are seen by some as an attractive way to commercialize stranded gas resources.There are a number of process developers offering processes that produce a variety ofproducts. The processes all involve the production of synthesis gas and the conversion of gasto liquid paraffinic products that are a function of the catalysts used.
The energy requirements of the processes can vary depending on the process vendor. Wang(1999b) summarized the efficiency of some of the GTL processes. That information issummarized in Table 3-8.
Table 3-8 Energy Efficiencies of Various GTL Proposals
Source EnergyEfficiency
Comments
Marshall 55 A POX reformer with a small SMR reformer.62 Designs by Sasol, Shell and Exxon57 Syntroleum technology
Russell 66 Syntroleum technology with a steam co-product.49 Syntroleum technology with no demand for steam.
Choi 46 Shell design. Small plant. No co-product energy.61 Shell design. Small plant. Electricity co-product.
Choi 57 Shell design. Large plant. No co-product.58 Shell design. Large plant. Electricity co-product.
Wang’s base case 66 Syntroleum design. Steam and Electricity co-products.49 Syntroleum design. No co-products.57 Shell design. No co-products.
61.5 50% Syntroleum plants and 50% Shell plants.

(S&T)2Assessment of Emissions of Greenhouse
Gases from Fuel Cell Vehicles 16
For ease of comparison it will be assumed that the GTL plant is located in Canada and has thesame distribution scenario as a methanol plant. The case of a remote facility will be coveredas a sensitivity case.
A Syntroleum type process is modeled here as Syntroleum is one of the most active processdevelopers and has announced plans for a 10,000 bbl/day commercial plant. The gasrequirements for this process are 10,000 SCF/bbl of product and a net 50 kW of electricity isavailable for export. This gas requirement and electricity output is often quoted in the literature(Gradassi, Agee). This case represents a current efficiency of 55.2%. There is no creditassumed for steam that may be produced in addition to the fuel and electricity as it is lowquality and may be difficult to market. It is assumed that improvements will happen at therelatively rapid rate of 0.5% per year and that by 2010 gas requirements will be 9200 SCF/bbland an efficiency of over 58%. The greenhouse gas emissions are presented in Table 3-9.Sensitivity to gas use will be studied in the sensitivity section since Gradassi reports valuesfrom 8,000 to 11,400 SCF/bbl. The electricity that is produced will replace electricity generatedby natural gas, as that is the marginal source of electricity for most regions of Canada. Theproduct distribution distances are the same as assumed for methanol.
Table 3-9 Greenhouse Gas Emissions for GTL’s.
Stage EmissionsUnits Gms CO2 / million BTU dispensedFuel Dispensing 124Fuel Distribution and Storage 2,681Fuel Production 21,654Feedstock Transmission 488Feedstock Recovery 6,731Gas Leaks and Flares 3,713CO2 from Natural Gas 1,147Co-product electricity -446Total 36,091
These emissions are approximately 35% higher than the emissions for the production ofsulphur free gasoline as described in section 3.1.4. A case could be made that GTL’s willcompete against the marginal sources of crude oil. In Canada that would be oil sands derivedcrude. If the sulphur free gasoline was manufactured from oil sands synthetic crude ratherthan the average crude types in Canada those emissions would be approximately 34,000 gmsCO2 / million BTU dispensed based on today’s practices. This is almost as high as GTLprocesses but oil sands developers are making process modifications to reduce theiremissions of GHGs and it is anticipated that by 2010 emissions may be as low as 30,000 gmsCO2 / million BTU dispensed.
3.3 ELECTRICITY PATHWAYS
Electricity is not a pathway in the same manner as oil or natural gas since the electricity mustbe produced from a primary energy source such as oil, natural gas, nuclear, coal or hydro.Electrolytic hydrogen is of interest because electrolysis units are capable of rapid start up andshut down and thus may be better suited to hydrogen production for fluctuating loads such aswould be found at a service station.
Ideally the electricity would be produced from non-carbon sources such as hydro or nuclear.This would produce the lowest greenhouse gas emissions. In practice the two scenarios thatwould be logical to analyze are electricity from the average mix of electricity sources andelectricity produced from natural gas in high efficiency gas turbines since natural gas is the

(S&T)2Assessment of Emissions of Greenhouse
Gases from Fuel Cell Vehicles 17
marginal source of electricity is many parts of Canada. It is assumed that these facilities havean efficiency of 50%. The national mix is only appropriate if a very low penetration of FCV isassumed such that there is very little additional demand for electricity. Since most of the otheralternatives examined assumed significant vehicle sales requiring new facilities it will beassumed that the electricity will come from natural gas. The results from the national mix ofelectricity are shown for comparison to the electricity from natural gas option only.
In Table 3-10 the GHG emissions for each source of electricity are shown for Canada. Alsoshown is the Canadian national mix of sources, the US national mix and an estimate ofemissions for Japan and Western Europe based on the electricity mix in each of those regionsand the US emission factors for each energy source (coal, oil, nuclear etc.).
Table 3-10 GHG Emissions from Electricity Generation
GHG EmissionsUnits Gms CO2 / million BTU electricityCoal 329,509Oil 297,038Gas Boiler 197,328Gas Turbine 138,639Nuclear 4,102Hydro 7,114Canadian National Electricity Mix 70,505American National Electricity Mix 214,373Europe 128,000Japan 160,000
It can be seen from the table that Canadian and US emissions from electricity generationbracket the emissions from electricity generation in Japan and Europe.
3.3.1 Compressed Hydrogen
Hydrogen can be produced from the electrolysis of water. There are a number ofmanufacturers producing units that can produce from several kg per day of hydrogen up totens of tonnes per day. Electrolysis units are generally more cost competitive than SMR unitsat the very small sizes. For that reason only compressed hydrogen will be analyzed.
The energy consumption for hydrogen production by electrolysis is reported to be 50 kWh/kghydrogen (Thomas). This corresponds to an efficiency of 78.8%. It will be assumed that smallimprovements in efficiency will be made and that by 2010 the efficiency will be 81.0%. It will beassumed that the compression energy will be the same as for a SMR on site facility. The GHGemissions for the two sources of electricity, the current national mix of generating sources andthe production of electricity from natural gas for hydrogen production are shown in Table 3-11.

(S&T)2Assessment of Emissions of Greenhouse
Gases from Fuel Cell Vehicles 18
Table 3-11 Greenhouse Gas Emissions for Electrolytic Hydrogen
Stage National Electricity Mix Natural Gas to ElectricityEmissions Emissions
Units Gms CO2 / million BTUdispensed
Gms CO2 / million BTUdispensed
Fuel Dispensing 4,580 9,006Fuel Distribution and Storage 296 296Fuel Production 87,274 171,612Feedstock Transmission 0 0Feedstock Recovery 0 0Gas Leaks and Flares 0 0Total 92,150 180,914
3.4 SUMMARY
The greenhouse gas emissions for the base cases of the upstream fuel cycles are shown inTable 3-12. Care must be taken when comparing the emissions since the hydrogen optionshave no carbon in the fuel while the other options will release carbon dioxide on board thevehicles. To assist with the comparison the carbon imbedded in the hydrocarbon fuels hasbeen added to the table. In addition the fuels have varying hydrogen-generating efficiencies onboard the vehicles that will impact on the full cycle emissions. Comparisons between thehydrogen options are valid and informative.

(S&T)2Assessment of Emissions of Greenhouse
Gases from Fuel Cell Vehicles 19
Table 3-12 Comparisons of Upstream Emissions
30
ppm
S
Gaso
line
Com
pre
ssed
Hyd
rogen
fr
omN
G
Liq
uid
H
ydro
gen
from
NG
Ele
ctro
lytic
Hyd
rogen
fro
mN
atu
ral G
as
Meth
ano
l fro
mN
G
Sulp
hur
Fre
eG
aso
line
GT
L
Units
Gm
s C
O2 /
mill
ion
BT
Udis
pe
nse
d
Gm
s C
O2 /
mill
ion
BT
Udis
pe
nse
d
Gm
s C
O2 /
mill
ion
BT
Udis
pe
nse
d
Gm
s C
O2 /
mill
ion
BT
Udis
pe
nse
d
Gm
s C
O2 /
mill
ion
BT
Udis
pe
nse
d
Gm
s C
O2 /
mill
ion
BT
Udis
pe
nse
d
Gm
s C
O2 /
mill
ion
BT
Udis
pe
nse
d
FuelDispensing
162 4,580 22,758 9,006 279 156 124
FuelDistributionand Storage
1,212 296 801 296 5,655 1,196 2,681
FuelProduction
12,733 75,611 74,491 171,612 9,049 13,848 21,654
FeedstockTransmission
206 3,365 3,339 0 393 206 488
FeedstockRecovery
8,880 5,604 5,560 0 5,428 8,877 6,731
Gas Leaksand Flares
2,677 5,836 5,860 0 2,995 2,677 3,713
CO2 fromNatural Gas
0 955 947 0 925 0 1,147
Co-productCredits
0 0 0 0 0 0 -446
Total 25,871 96,246 113,757 180,914 24,725 26,960 36,091Carbon inFuel
70,842 0 0 0 63,868 70,842 69,212
TotalincludingFuel Carbon
96,713 96,246 113,757 180,914 88,593 97,802 105,303
On the basis of the assumptions made for each of the fuel options the lowest fuel cyclegreenhouse gas emissions are derived from methanol followed by compressed hydrogen fromnatural gas at decentralized facilities. In the next section the vehicle is considered andestimates of relative vehicle efficiencies are made.

(S&T)2Assessment of Emissions of Greenhouse
Gases from Fuel Cell Vehicles 20
4. FUEL CELL VEHICLES
Fuel cell vehicles have a number of advantages over vehicles powered by internal combustionengines. They have lower exhaust emissions and a higher efficiency due both to the higherefficiency of the fuel cell compared to the ICE and the torque characteristics of the electricdrive system. The efficiency advantage of the fuel cell is particularly large at part load and onlymodestly higher at full load. Thus, in the real world the relative efficiency of fuel cell vehiclescompared to the gasoline powered internal combustion engine is strongly dependent on thevehicle duty cycle. Relative fuel economy ratios of 3 or more are found in the literature (Wang,1999 and Stodolsky) but these are for mild driving cycles such as the EPA urban test. Realworld factors are expected to be lower.
Directed Technologies Inc. (Thomas, 1999) have published a number of papers describing therelative fuel economy of FCV’s using different fuels. These are based on a driving simulationmodel developed by DTI. Results have been published for a number of driving cycles includingone designed to mirror the real world fuel economy of vehicles in North America. This DTI datais used as the starting point for developing the relative efficiency of the FCV and fuelsconsidered here.
As the time period for the analyses is 2010 it has been assumed that there will be continueddevelopment of FCV. The best case scenarios developed by DTI are the starting point andthey are further adjusted for technology developments that have been demonstrated andannounced and are beyond the assumptions that DTI made. Real world fuel economy hasbeen used in this modeling so the DTI efficiency factors for the faster urban and highwaydriving cycles are used as the starting point for determining relative system efficiency.
The Delucchi model calculates the impact of vehicle weight separately from relative engineefficiency. It is thus necessary to determine the impact of the change in powertrain weight andthe change in fuel weight separately from the change in engine efficiency. Starting withinformation published by DTI and the California Air Resources Board the following incrementalweight factors for the powertrain have been developed. The model calculates the fuel tank andfuel weight required for the desired vehicle range. The model also uses a weight compoundingfactor of 1.065 to allow for the extra structure required for the higher powertrain weight. It hasbeen assumed that the gasoline ICE vehicle and all of the FCVs have the same range of 350miles.
Table 4-1 Incremental Weights of Fuel Cell Vehicles
CompressedHydrogen FCV
Methanol FCV Gasoline FCV
IncrementalPowertrain weight,lbs.
0 200 250
Calculated Fuelweight, lbs.
12.2 99 56.9
Calculated Tankweight, lbs.
86 36 23
Total curb weightincrement to ICE,lbs.
-19 233 228

(S&T)2Assessment of Emissions of Greenhouse
Gases from Fuel Cell Vehicles 21
4.1 VEHICLES WITH ON BOARD HYDROGEN STORAGE
The most rigorous analyses that DTI have performed is for vehicles that store hydrogen thathas been generated at a fixed location and is stored on board the vehicle as a compressedgas. There is no added complexity or weight of an onboard reformer to consider. The DTImodel compares the FCV to the same vehicle powered by an ICE and considers the extraweight of a FCV caused by the fuel cell system. Several driving cycles are compared andseparate urban and highway results are presented. The typical results presented by DTI aresummarized in Table 4-2. Small differences are found in different DTI papers andpresentations with the more recent papers having lower values similar to those shown in thistable.
Table 4-2 Relative Fuel Economy Ratios for Hydrogen Powered Fuel Cell Vehicles
Driving Cycle Fuel Economy Ratio Relative to ICEFederal Urban Driving Schedule 3.15Federal Highway Driving Schedule 2.22Combined (55 Urban/45 Highway) 2.621.25 Faster FUDS 2.61.25 Faster Highway 1.821.25 Faster Combined (55 Urban/45 Highway) 2.20
There will be no emissions of criteria pollutants from the hydrogen fuel cell vehicle.
4.2 VEHICLES WITH ON BOARD REFORMING
Fuel cell vehicles that produce their hydrogen onboard from fuels such as methanol, gasoline,or FT distillates have lower relative fuel economies compared to hydrogen vehicles. There area number of reasons for this including;
• The inefficiency of the reforming process,• Lower hydrogen utilization factors due to the need to vent carbon dioxide that is
present in the reformate and losing some hydrogen in the vent gas before it can beconverted to electricity,
• A lower hydrogen concentration of the fuel leading to a lower fuel cell efficiencyand,
• Extra weight.
For a methanol fueled FCV, DTI projected a best case based on 84.5% (LHV) reformerefficiency, 90% hydrogen utilization. The combined relative fuel economy for this system onthe faster driving cycle is 1.62. The basis for DTI’s efficiency calculations is a 1994 study byA.D. Little that considered methanol reformers. Since that study was done Johnson Matthey(Kalhammer, Reinkingh) have published results for a methanol reformer that had an efficiencyof 89.2% (LHV). Utilizing the higher reformer efficiency and considering the impact that has onheat recovery, the driving cycle efficiency increases to 1.72. Increasing the heat recoveryefficiency from 75% to 80% would increase this ratio to 1.74. This is the ratio modeled here.
The exhaust emissions from the methanol reformer will obtain small amounts of unburnedhydrocarbons, carbon monoxide and nitrogen oxides. There is very little quantitative data onthese emissions particularly for a methanol reformer. Mark (1996) estimated NOx emissions of0.001 g/mile, CO emissions of 0.003 g/mile and VOC emissions of 0.007 g/mile. This data ismodeled. These emissions have a very small impact on GHG emissions so the uncertainty ofthe data is acceptable. It has also been suggested that NOx and CO emissions could bebelow detection limits. Real data is required before definitive conclusions can be reached.

(S&T)2Assessment of Emissions of Greenhouse
Gases from Fuel Cell Vehicles 22
A gasoline or FTD fuel cell vehicle is also expected to have lower efficiencies than hydrogenpowered vehicles. DTI have calculated the relative fuel economy of a gasoline FCV to be 1.41in their best case for the faster driving cycle. That is based on a reformer efficiency of 75%,90% hydrogen utilization and 70% anode heat recovery. The case modeled here assumes77% reformer efficiency, 90% hydrogen utilization and a 75% heat recovery. This is the best-demonstrated reformer performance and a similar improvement in heat recovery that methanolwas assigned. This assumption may overestimate the potential heat recovery for gasolinegiven the exothermic nature of the gasoline reforming process and the endothermic methanolreforming process. The efficiency ratio improves to 1.45. The same ratio will be used for FTDreforming as for gasoline.
Epyx have reported preliminary emissions for their fuel processor operated on gasoline. Thedata is based on tests conducted on the reformer and extrapolated to a Federal Urban Drivingcycle. They did not include the start up phase but also represent an early stage ofdevelopment. The results were NOx 0.003 g/mile, CO emissions of 0.013 g/mile andhydrocarbon emissions of 0.017 g/mile. These are slightly higher than Mark reported formethanol, which is not unexpected. This data will be used in the model.
The greenhouse gas model used calculates the impact of vehicle and fuel weight separatelyfrom the impact of relative engine efficiency. In Table 4-3 the energy efficiency ratios of thethree fuel cells before the weight adjustments are shown. These values are approximately 3 %higher than the DTI values and represent the efficiency of the fuel cell engine versus the fuelcell vehicle.
Table 4-3 Summary of Energy Efficiency Ratios for Hydrogen, Methanol, andHydrocarbon Powered Fuel Cell Engines
Driving Cycle EnergyEfficiency Ratio
EnergyEfficiency Ratio
EnergyEfficiency Ratio
Fuel Hydrogen Methanol Gasoline1.25 Faster FUDS 2.63 1.94 1.721.25 Faster Highway 1.82 1.58 1.221.25 Faster Combined(55 Urban/45 Highway)
2.26 1.78 1.50
This vehicle information can be combined with the data developed in section 3 to calculate thefull life cycle emissions for the various potential Fuel Cell Vehicles. That data will be presentedin the next section.

(S&T)2Assessment of Emissions of Greenhouse
Gases from Fuel Cell Vehicles 23
5. RESULTS
The full cycle greenhouse gas emissions have been calculated for the base cases of the fuelsand vehicle combinations described in the previous sections. The base for comparison is theinternal combustion engine vehicle operating on low sulphur gasoline. The average vehicle onroad fuel economy has improved from 9.6 L/100 km (24.6 m/USG) in 2000 to 9.0 L/100 km in2010 (26.25 m/USG) The exhaust emissions are reduced from today’s levels due in large partto low sulphur gasoline. The model is used to calculate the GHG emissions for both Canadaand the United States. Qualitative comments are made for the potential situations in Japanand Europe.
5.1 BASE CASES - CANADA
The results for Canada are shown in Table 5-1. All of the fuels are made in Canada fromdomestic oil and natural gas. The emissions are for the full cycle and include the energy andemissions embedded in vehicle manufacturing and assembly. These emissions are amortizedover the life of the vehicle.

(S&T)2Assessment of Emissions of Greenhouse
Gases from Fuel Cell Vehicles 24
Table 5-1 Full Cycle Greenhouse Gas Emissions for Fuel Cell Vehicles - Canada
Engine ICE FC FC FC FC FC FCFuel
Ga
solin
e
CH
2
LH
2
CH
2
Me
tha
nol
Sul
phu
rF
ree
Ga
solin
e
FT
D
SourceO
il
NG
(S
mal
ld
ece
ntr
aliz
e)
NG
(L
arg
ece
ntr
aliz
ed
)
Ele
ctro
lysi
s(n
atu
ral
gas
to e
lect
ricity
)
NG
Oil
NG
Units GmCO2
eq/mile
GmCO2
eq/mile
GmCO2
eq/mile
GmCO2
eq/mile
GmCO2
eq/mile
GmCO2
eq/mile
GmCO2
eq/mileVehicleOperation
338.5 0.0 0.0 0.0 176.2 234.0 228.8
Fuel Dispensing 0.8 9.7 48.3 19.1 0.8 0.5 0.4Fuel Distribution 5.8 0.6 1.7 0.6 15.6 4.0 8.9Fuel Production 60.9 160.6 158.3 364.6 25.0 45.8 71.6FeedstockTransport
1.0 7.1 7.1 0.0 1.1 0.7 1.6
FeedstockProduction
42.5 11.9 11.8 0.0 15.0 29.4 22.3
Gas Leaks andFlares
12.8 14.4 14.5 0.0 10.8 8.9 16.1
EmissionsDisplaced byCo-products
0.0 0.0 0.0 0.0 0.0 0.0 -1.5
Sub Total 462.2 204.5 241.7 384.4 244.5 323.2 348.1% Changes - -55.8 -47.7 -16.8 -47.1 -30.1 -24.7VehicleAssembly
5.3 5.4 5.4 5.4 5.8 5.9 5.9
Materials inVehicles
28.4 29.2 29.2 29.2 29.9 30.4 30.4
Grand Total 495.9 239.1 276.3 419.0 280.2 359.5 384.4% Change - -51.8 -44.3 -15.5 -43.5 -27.5 -22.5
The results are shown graphically in Figure 5-1.

(S&T)2Assessment of Emissions of Greenhouse
Gases from Fuel Cell Vehicles 25
Figure 5-1 Full Cycle Greenhouse Gas Emissions for Fuel Cell Vehicles – Canada
5.2 BASE CASES – UNITED STATES
The model is capable of calculating the results for the United States as well as for Canada.The results will be different due to several factors. These include;
• The US has electricity profile that is much more carbon intensive,• The US refineries use more energy to make gasoline than Canadian refineries,• The emissions in the oil and natural gas production sectors are different.
All of the other process variables for the various fuels are held constant and all of thetransportation assumptions for raw materials supply and finished product distribution areunchanged from the Canadian case. Given the similarities in the size of the two countriesthese are reasonable assumptions. The fuel distribution emissions for methanol may beoverestimated for the US case since some of the rail movements assumed for Canada wouldprobably be replaced with barge shipments once volumes became larger. This mode oftransport is more energy efficient than rail transport. Processes that are more electricityintensive will have higher greenhouse gas emissions in the United States than in Canada. Theresults are shown in Table 5-2.
The overall emissions are slightly higher in the United States than in Canada. Most of thisdifference is due to the higher carbon intensity of electricity generation. Emissions from naturalgas production and distribution are almost the same in the two countries and the emissionsfrom oil production, transport and refining in the two countries are within 2.5% of each otherdespite large differences in the sectors between the two countries.
0
100
200
300
400
500
GasolineICE
CH2 ElecNG FCV
GTL FCV SFG FCV LH2 NGFCV
Meoh FCV CH2 NGFCV
Fuel Production Vehicle Use Vehicle Assembly Total

(S&T)2Assessment of Emissions of Greenhouse
Gases from Fuel Cell Vehicles 26
Table 5-2 Full Cycle Greenhouse Gas Emissions for Fuel Cell Vehicles- UnitedStates
Engine ICE FC FC FC FC FC FCFuel
Ga
solin
e
CH
2
LH
2
CH
2
Me
tha
nol
Sul
phu
rF
ree
Ga
solin
e
FT
D
SourceO
il
NG
(S
mal
ld
ece
ntr
aliz
e)
NG
(L
arg
ece
ntr
aliz
ed
)
Ele
ctro
lysi
s(n
atu
ral
gas
to e
lect
ricity
)
NG
Oil
NG
Units GmCO2
eq/mile
GmCO2
eq/mile
GmCO2
eq/mile
GmCO2
eq/mile
GmCO2
eq/mile
GmCO2
eq/mile
GmCO2
eq/mileVehicleOperation
338.5 0.0 0.0 0.0 176.2 234.0 228.8
Fuel Dispensing 2.0 29.6 147.0 19.2 2.2 1.4 1.2Fuel Distribution 7.1 0.7 1.8 0.7 15.9 4.8 9.0Fuel Production 72.1 163.2 158.3 367.3 25.0 54.8 71.6FeedstockTransport
8.0 7.7 7.7 0.0 1.2 5.5 1.7
FeedstockProduction
16.9 9.6 9.5 0.0 12.1 11.7 17.9
Gas Leaks andFlares
17.3 18.9 18.9 0.0 10.9 12.0 16.1
EmissionsDisplaced byCo-products
0.0 0.0 0.0 0.0 0.0 0.0 -2.1
Sub Total 461.9 229.8 343.2 387.3 243.5 324.2 344.4% Changes - -50.3 -25.7 -16.1 -47.3 -29.8 -25.4VehicleAssembly
7.8 8.1 8.1 8.1 8.6 8.7 8.7
Materials inVehicles
44.9 47.9 47.9 47.9 48.0 48.9 48.9
Grand Total 514.6 285.7 399.1 443.3 300.1 381.8 402.0% Change - -44.5 -22.5 -13.8 -41.7 -25.8 -21.9
There are significant differences in the relative reductions of the options between Canada andthe United States. These are caused primarily by the higher carbon intensity of electricity inthe US. Any option that is more dependent on electricity will have higher emissions in the USthan in Canada. The liquid hydrogen from natural gas is much less attractive than in Canadaand there is now only a small difference between compressed hydrogen from natural gas andthe onboard production of hydrogen from methanol.
The results are presented graphically in Figure 5-2. Note that there are no GHG emissionsfrom the vehicle for the hydrogen FCV but the fuel production emissions are higher for thesecases.

(S&T)2Assessment of Emissions of Greenhouse
Gases from Fuel Cell Vehicles 27
Figure 5-2 Full Cycle Greenhouse Gas Emissions for Fuel Cell Vehicles–UnitedStates
5.3 JAPAN AND EUROPE
The Japanese and European driving cycles are substantially different from North Americancycles. They are slower and the higher efficiency of the FCV at low loads provides a greaterfuel economy benefit than for the cycles modeled here. As shown in section 4 FCV are moreefficient on the slower driving cycles. The GHG emissions per distance traveled for the urbanpart of the cycle will therefore be lower than North American values and for this part of thecycle the FCV will show a greater reduction in GHG emissions than they do for North America.The relative differences between fuel options for FCV are independent of the driving cycle andcan be commented on.
The carbon intensity of electricity production in Japan and Europe is in between Canada andthe United States. The fuel options Gasoline in an ICE, Methanol FCV, Sulphur Free GasolineFCV and GTL FCV are relatively low consumers of electricity and produce similar results inCanada and the US. It is expected that the Japanese and European results would also besimilar to those shown here.
The electricity consumption of the other options increases in this order; CompressedHydrogen from Natural Gas, Liquid Hydrogen and Electrolytic Hydrogen. The full cycleemissions for Japan are expected to be approximately 62% of the way between those ofCanada and the US. The emissions in Europe are expected to be 40% of the way betweenCanada and the US. A better understanding of the emissions in Europe and Japan will bedeveloped at a later date.
5.4 ENERGY EFFICIENCY
Different fuels have different amounts of GHG released for the same amount of energy. It istherefore informative to consider the total energy consumed per mile traveled as well as thegreenhouse gas emissions for the various options. The data for Canada is shown in Table 5-3.The electricity pathways are not shown in the table because of the difficulty of assigningvalues to some of the generation paths such as hydro and nuclear.
0
100
200
300
400
500
600
GasolineICE
CH2 ElecNG FCV
LH2 NGFCV
GTL FCV SFG FCV Meoh FCV CH2 NGFCV
Fuel Production Vehicle Use Vehicle Assembly Total

(S&T)2Assessment of Emissions of Greenhouse
Gases from Fuel Cell Vehicles 28
Table 5-3 Energy Consumed per Mile Traveled
Engine ICE FC FC FC FC FCFuel Gasoline CH2 LH2 Methanol Sulphur
FreeGasoline
FTD
Source Oil NG NG NG Oil NGUnits BTU/Mile BTU/Mile BTU/Mile BTU/Mile BTU/Mile BTU/MileVehicleOperation
4,782 2,124 2,124 2,761 3,307 3,307
FuelDispensing
8 138 686 10 6 6
FuelDistribution
43 207 219 136 30 78
FuelProduction
706 910 870 1,032 489 2,326
FeedstockTransport
11 95 94 14 7 21
FeedstockProduction
577 146 145 184 399 272
Total 6,128 3,621 4,138 4,138 4,215 6,010
The energy consumption results are presented graphically in Figure 5-3.
Figure 5-3 Energy Consumption per Mile
0
1000
2000
3000
4000
5000
6000
7000
GasolineICE
GTL FCV SFG FCV LH2 FCV MeohFCV
CH2 FCV
BT
U/M
ile
Vehicle Operation Fuel Production Total

(S&T)2Assessment of Emissions of Greenhouse
Gases from Fuel Cell Vehicles 29
6. SENSITIVITY ANALYSES
The cases and results presented in the previous sections represent what the best technologywould produce in a North American location and with moderate market penetration of FCV. Itis likely that some of this production technology will not be built in North America but in moreremote locations where natural gas costs are lower and the emissions from natural gasproduction may be lower. There is also the possibility that other technologies will be usedbecause of cost or they may be more appropriately sized, especially during the early years ofmarket development. Some of these possibilities are investigated here.
6.1 NATURAL GAS EMISSIONS
The emissions from the production and transmission of natural gas to the fuel productionfacility comprise 9 to 14% of the full cycle GHG emissions for the options studied here. Largefacilities that can be built close to the gas production areas such as the methanol and GTLplants modeled here can reduce the emissions arising from transportation and distribution.Another opportunity for reducing the emissions is to reduce losses of methane as the industryis currently undertaking. To determine the magnitude of this change the rate of improvement inthis area assumed in the model is quadrupled to determine the impact on full cycle emissionsin the year 2010. The improvement rates become 4% distribution and recovery systems and2% for transmission, storage and processing operations. No changes to the other emissionrates for gas processing are made.
The changes in the full cycle GHG emissions for the methanol, compressed hydrogen fromSMR and the GTL process are shown in Table 6-1.
Table 6-1 Emission Impact of Reducing Gas System Methane Losses
Base Case Low Methane Losses % ChangeUnits Gm CO2 eq/mile Gm CO2 eq/mileMethanol Gas Production 26.9 23.9 -11.2 Full Cycle 280.2 276.9 -1.2Compressed Hydrogen Gas Production 33.4 29.4 -12.0 Full Cycle 239.1 234.6 -1.9GTL Gas Production 40.0 35.5 -11.2 Full Cycle 384.4 379.8 -1.2
The reduction in methane losses from the natural gas system can make a significant impacton the GHG emissions from that stage of the life cycle but the reduction is relative small whenconsidered over the full life cycle of the full and vehicle option and the impact is similar on allof the natural as based pathways.
6.2 HYDROGEN FROM NATURAL GAS
There are two possible alternative cases for natural gas to hydrogen. The first is the use ofPartial Oxidation Reformers instead of Steam Methane Reformers and the second is theliquefaction of natural gas in a remote location, shipping it to market and then vapourizing thegas for use in a domestic natural gas system. These two cases are studied below.

(S&T)2Assessment of Emissions of Greenhouse
Gases from Fuel Cell Vehicles 30
6.2.1 Partial Oxidation Reformers
The production of hydrogen from Steam Methane Reforming (SMR) of natural gas is the mostefficient process but it is better suited to larger systems. Partial Oxidation (POX) reformers canalso be used to produce hydrogen from natural gas. These systems are generally smaller, withlower capacity than SMR, have a lower capital cost but are not as efficient. They may beeasier to start up and shutdown and thus better suited to the load factor of a service station.The smaller size may be better suited to a service station type installation than a SMR.
Phoenix Gas Systems manufacture a POX reactor combined with a Pressure SwingAbsorption unit. The largest size is capable of producing 10 kg/hr of hydrogen. This wouldsupport about 350 vehicles at a station. This is equivalent to the number of vehicles that mightbuy premium gasoline at a typical Canadian service station.
The utility requirements for this unit are 2180 SCF of natural gas per million BTU of hydrogenproduced and 54 kWh of electricity per million BTU of hydrogen (43.3% efficiency). The otherparameters for compressed hydrogen systems have been held constant. In Table 6-2 theGHG emissions for a POX system are compared with those of a SMR system and thegasoline ICE.
Table 6-2 GHG Emissions from a POX Reformer for Hydrogen Production Canada
Engine ICE FC FCFuel Gasoline CH2 CH2
Source Oil SMR NG (Smalldecentralize)
POX NG (Smalldecentralized)
Source Oil NG NGUnits Gm CO2 eq/mile Gm CO2 eq/mile Gm CO2 eq/mileVehicle Operation 338.5 0.0 0.0Fuel Dispensing 0.8 9.7 10.0Fuel Distribution 5.8 0.6 0.6Fuel Production 60.9 160.6 272.8Feedstock Transport 1.0 7.1 11.0Feedstock Production 42.5 11.9 18.3Gas Leaks and Flares 12.8 14.4 22.2Sub Total 462.2 204.5 335.0% Changes - -55.8 -27.5Vehicle Assembly 5.3 5.4 5.8Materials in Vehicles 28.4 29.2 31.3Grand Total 495.9 239.1 372.1% Change - -51.8 -25.0
The greenhouse gas emissions benefit from a compressed hydrogen fuel cell vehicle isreduced by half with the use of a POX reactor system for hydrogen production. This is asignificant reduction that makes this lower cost hydrogen production system less attractivefrom a GHG perspective.
The same case is modeled for the United States. The relatively high electricity consumptioncoupled with the carbon intensity of the US electricity produces a substantially different resultwith a much lower GHG reduction. The results are shown in Table 6-3.

(S&T)2Assessment of Emissions of Greenhouse
Gases from Fuel Cell Vehicles 31
Table 6-3 GHG Emissions from a POX Reformer for Hydrogen Production US
Engine ICE FC FCFuel Gasoline CH2 CH2
Source Oil SMR NG (Smalldecentralize)
POX NG (Smalldecentralized)
Source Oil NG NGUnits Gm CO2 eq/mile Gm CO2 eq/mile Gm CO2 eq/mileVehicle Operation 338.5 0.0 0.0Fuel Dispensing 2.0 29.6 29.6Fuel Distribution 7.1 0.7 0.7Fuel Production 72.1 163.2 329.0Feedstock Transport 8.0 7.7 11.9Feedstock Production 16.9 9.6 14.8Gas Leaks and Flares 17.3 18.9 29.1Sub Total 461.9 229.8 415.1% Changes - -50.3 -10.1Vehicle Assembly 7.8 8.1 8.1Materials in Vehicles 44.9 47.9 47.9Grand Total 514.6 285.7 471.1% Change - -44.5 -8.5
6.2.2 Liquid Natural Gas
Not all countries have indigenous supplies of natural gas sufficient to supply all of their needs.Some of these countries rely on the importation of liquefied natural Gas (LNG). LNG is acryogenic liquid with a much higher energy density than compressed natural gas. There is asizeable world trade in LNG. The United States and Japan are two countries that are importersof LNG. The natural gas is assumed to be liquefied in a region with remote gas using naturaldriven compressors to drive the process. It is then move by LNG tanker the same 5500 kmdistance that has been assumed for the other liquid remote gas cases. The natural gas is thenvapourized and shipped a further 300 miles by pipeline to the service station for conversion tohydrogen in a SMR. This essentially assumes that LNG would be used in the coastal regionsand not throughout the whole country. LNG is being used to augment and not to replaceexisting supplies. The full cycle emissions for the United States for this case are compared togasoline in an ICE, domestic natural gas and domestic methanol production in the followingtable. The United States is a more appropriate comparison than Canada since it is not likelythat Canada will be an importer of LNG in the foreseeable future.

(S&T)2Assessment of Emissions of Greenhouse
Gases from Fuel Cell Vehicles 32
Table 6-4 GHG Emissions from Remote LNG for Hydrogen Production
Engine ICE FC FCFuel Gasoline CH2 CH2
Source Oil SMR NG (Smalldecentralize)
SMR NG (Smalldecentralize)
Source Oil NG LNGUnits Gm CO2 eq/mile Gm CO2 eq/mile Gm CO2 eq/mileVehicle Operation 338.5 0.0 0.0Fuel Dispensing 2.0 29.6 29.6Fuel Distribution 7.1 0.7 0.7Fuel Production 72.1 163.2 163.2Feedstock Transport 8.0 7.7 7.3Feedstock Production 16.9 9.6 45.8Gas Leaks and Flares 17.3 18.9 26.7Sub Total 462.2 229.8 273.2% Changes - -50.3 -40.8Vehicle Assembly 7.8 8.1 8.1Materials in Vehicles 44.9 47.9 47.9Grand Total 514.6 285.7 329.1% Change - -44.5 -36.1
There is a significant increase in GHG emissions for the LNG case. In the next section thecase of a remote methanol plant will be considered and a further comparison will be madebetween remote gas via LNG to remote gas via methanol.
6.3 METHANOL
Two sensitivity cases for methanol are considered, a remote methanol plant that would takeadvantage of low cost remote natural gas and the impact of natural gas composition isinvestigated.
6.3.1 Remote Methanol Plants
New methanol plants are being built today in areas that have low cost natural gas. Most ofthese areas are remote and a long distance from markets, which accounts for the low gascost. The gas fields supplying these plants are relatively new and the plants will be locatedvery close to the field. The gas supply to the methanol plant will assume the low methaneemission rate modeled in the sensitivity case above, a shorter relative distance between theplant and the field of 5% rather than the 12%. The emissions from gas production andprocessing will be the same as modeled for Canada due to the lack of specific data for theseremote gas fields. The specific case of flared gas being utilized for methanol production hasnot been considered. While the flared gas resource is substantial it is ultimately limited andcould only power a small fraction of the world’s vehicles.
There will be a significant change in the distribution of the methanol to the market. It will beassumed that the product will move 5500 miles by ship, and average of 200 miles by rail andthe same 75 miles by truck. The rail distances are much less than the base case but arereasonable given that a large fraction of the Canadian population is located close to water.The results of this case are presented in Table 6-5. There is very little difference in theemissions due to the remote location. Ocean shipment is a more energy efficient mode of

(S&T)2Assessment of Emissions of Greenhouse
Gases from Fuel Cell Vehicles 33
transportation than rail. The energy use for the ocean shipping is modeled based on data fromMethanex’s newest ocean vessel, the 100,000 tonne Millennium Explorer. The 5500 miledistance is considered to be more than sufficient to move methanol to Canada and the USfrom a mix of remote locations including South America, the Caribbean, the North Sea and theMiddle East.
Table 6-5 Impact of a Remote Methanol Plant on GHG Emissions
Engine ICE FC FCFuel Gasoline Methanol Methanol
Source Oil Canada Remote LocationLow Methane
LossesSource Oil NG NGUnits Gm CO2 eq/mile Gm CO2 eq/mile Gm CO2 eq/mileVehicle Operation 338.5 176.2 176.2Fuel Dispensing 0.8 0.8 0.8Fuel Distribution 5.8 15.6 15.8Fuel Production 60.9 25.0 25.0Feedstock Transport 1.0 1.1 0.4Feedstock Production 42.5 15.0 14.8Gas Leaks and Flares 12.8 10.8 7.8Sub Total 462.2 244.5 240.9% Changes - -47.1 -47.8Vehicle Assembly 5.3 5.8 5.8Materials in Vehicles 28.4 29.9 29.9Grand Total 495.9 280.2 276.6% Change - -43.5 -44.2
The transportation emissions are remarkably similar in the two cases. The primary differencesfor the case arise from the low methane loss assumption for a methanol plant located veryclose to the source of gas.
This remote gas to methanol case for the United States is now compared to the LNG option inthe following table. It can be seen that for this scenario GHG emissions are lower for methanolthan for compressed hydrogen. For a country like Japan where essentially all of the naturalgas is imported as LNG it is likely that methanol FCV will have lower full cycle emissions thanhydrogen FCVs. The lower carbon intensity of Japanese electrical production compared to theUS will not be sufficient to overcome the methanol advantage shown below.

(S&T)2Assessment of Emissions of Greenhouse
Gases from Fuel Cell Vehicles 34
Table 6-6 Comparison of Remote Gas Options for the United States
Engine ICE FC FCFuel Gasoline Methanol CH2
Source Oil Remote LocationLow Methane
Losses
SMR NG (Smalldecentralize)
Source Oil NG LNGUnits Gm CO2 eq/mile Gm CO2 eq/mile Gm CO2 eq/mileVehicle Operation 338.5 176.2 0.0Fuel Dispensing 2.0 2.2 29.6Fuel Distribution 7.1 15.8 0.7Fuel Production 72.1 25.0 163.2Feedstock Transport 8.0 0.4 7.3Feedstock Production 16.9 14.8 45.8Gas Leaks and Flares 17.3 7.8 26.7Sub Total 462.2 242.2 273.2% Changes - -47.6 -40.8Vehicle Assembly 7.8 8.6 8.1Materials in Vehicles 44.9 48.0 47.9Grand Total 514.6 298.8 329.1% Change - -41.9 -36.1
6.3.2 Natural Gas Composition
The composition of natural gas can have an impact on GHG emissions from the fuel processorsince the carbon to hydrogen ratio can change relative to the energy content of the fuel andthe gas may contain some inert CO2, which goes through the process unchanged. It theorythis will impact all natural gas based systems but in practice it is most likely to impact remotegas processing where the higher hydrocarbons are not removed for further upgrading. Toshow the magnitude of the change, the upstream emissions that would result from a methanolplant processing raw Norwegian gas are compared to those calculated here for Canadian gas.All plant energy efficiencies are held constant so that the only variable is the gas composition.The results are compared in the following table.
Table 6-7 Impact of Gas Composition on GHG Emissions for Methanol Plant
Emissions EmissionsGas Source Norway CanadaGas Consumption 31.2 GJ/tonne 31.2 GJ/tonneUnits Gms CO2 / million BTU
dispensedGms CO2 / million BTU
dispensedFuel Dispensing 279 279Fuel Distribution and Storage 5,704 5,655Fuel Production 14,058 9,049Feedstock Transmission 405 393Feedstock Recovery 5,745 5,429Gas Leaks and Flares 2,677 2,995CO2 from Natural Gas 809 925Total 29,645 24,725

(S&T)2Assessment of Emissions of Greenhouse
Gases from Fuel Cell Vehicles 35
The emissions from the plant are 55% higher with small changes in some of the othercategories due to the different gas composition and the different density of the gas. Gascomposition data from other remote gas locations was obtained to gain an understanding ofthe likely gas composition from remote locations. That data is shown in Table 6-7 andcompared to the Canadian gas composition used in this modeling.
Table 6-8 Gas Composition For Remote Locations
Canada Chile Australia Trinidad NorwayComponents Vol % Vol % Vol % Vol % Vol %Methane 94.4 93.46 91.6 95.39 80.9Ethane 2.7 4.95 5 3.91 9.4Propane 0.4 0.18 0.4 0.03 4.4Butane 0.1 0.03 0.1 3.1Pentane 0.06 0.0 0.0 0.0Pentane plus 0.04 0.0 0.0 0.0Carbondioxide
0.5 0.2 0.8 0.59 1.8
Nitrogen 1.8 1.18 2.1 0.08 0.4Total 100 100 100 99.97 100
The Norwegian gas appears to be an anomaly with the other gas sources being much closerto the data used here. With very large gas developments there is usually a financial incentiveto remove the heavier hydrocarbons for further value added processing.
6.4 LIQUID HYDROGEN
A high penetration rate of hydrogen powered FCV may make very large-scale liquid hydrogenplants a possibility. It will be assumed that these plants have a natural gas utilization of 1250SCF per million BTU of hydrogen, there is no extra electricity required for the hydrogenproduction stage. No changes have been made to the liquefaction energy requirements andthe transportation distance is reduced to 200 miles from 300 miles reflecting the higher marketpenetration.
The results for this scenario are shown in Table 6-9 and compared to the gasoline ICE and thebase case for liquid hydrogen. Full cycle greenhouse gas emissions are reduced by 10.6%compared to the base case for this high efficiency SMR system. These results are for Canadawhere the electricity has relatively low carbon intensity. The difficulty with this scenario is thesize of the market required to support a very large facility and how quickly the FCV demandcan be built to match the hydrogen supply.

(S&T)2Assessment of Emissions of Greenhouse
Gases from Fuel Cell Vehicles 36
Table 6-9 GHG Emissions for High Efficiency Liquid Hydrogen System
Engine ICE FC FCFuel Gasoline Liquid Hydrogen Liquid Hydrogen
Case Base Case High Efficiency
Source Oil NG NGUnits Gm CO2 eq/mile Gm CO2 eq/mile Gm CO2 eq/mileVehicle Operation 338.5 0 0Fuel Dispensing 0.8 48.3 48.3Fuel Distribution 5.8 1.7 1.2Fuel Production 60.9 158.3 143.6Feedstock Transport 1.0 7.1 6.4Feedstock Production 42.5 11.8 10.7Gas Leaks and Flares 12.8 14.5 13.1Sub Total 462.2 241.7 223.4% Changes - -47.7 -51.7Vehicle Assembly 5.3 5.4 5.4Materials in Vehicles 28.4 29.2 29.2Grand Total 495.9 276.3 258.0% Change - -44.3 -48.0
6.5 GTL PLANTS
Gas to Liquids plants are at an early stage of technological development. As such there is stilla great deal of uncertainty with respect to the energy efficiency of these plants. The base casemodeled use a gas utilization factor that is widely quoted in the literature. As noted earlyGradassi has performed economic modeling on plants that use 20% less gas as well as plantsthat use 15% more gas. GTL plants are also most likely to be built at remote locations wherelow cost natural gas can be obtained.
This sensitivity case is performed with all of the remote gas characteristics the same as theremote methanol case and a gas conversion factor of 202 SCF/USG of FTD. The results andcomparison with the base case and a gasoline powered ICE is shown in Table 6-10.

(S&T)2Assessment of Emissions of Greenhouse
Gases from Fuel Cell Vehicles 37
Table 6-10 GHG Emissions for a High Efficiency GTL Plant and FCV
Engine ICE FC FCFuel Gasoline FTD FTD
Case Base Case High Efficiency
Source Oil NG NGUnits Gm CO2 eq/mile Gm CO2 eq/mile Gm CO2 eq/mileVehicle Operation 338.5 228.8 228.8Fuel Dispensing 0.8 0.4 0.4Fuel Distribution 5.8 8.9 7.9Fuel Production 60.9 71.6 26.4Feedstock Transport 1.0 1.6 0.6Feedstock Production 42.5 22.3 18.9Gas Leaks and Flares 12.8 16.1 13.3Co-products -1.5 -1.5Sub Total 462.2 348.1 294.8% Changes - -24.7 -36.2Vehicle Assembly 5.3 5.9 5.9Materials in Vehicles 28.4 30.4 30.4Grand Total 495.9 384.4 331.1% Change - -22.5 -33.2

(S&T)2Assessment of Emissions of Greenhouse
Gases from Fuel Cell Vehicles 38
7. COMPARISON TO OTHER STUDIES
It is useful to compare the results calculated here with those of other published studies. Whilea number of studies were identified in section that dealt with the full life cycle emissions oftransportation fuels very few of them addressed fuel cell vehicles due to the newness of thetechnology. The Delucchi model as first delivered to NRCan was capable of looking at the fuelpart of the fuels considered here but did not include a fuel cell vehicle for the vehicle part of afull cycle. Delucchi (1992) analyzed hydrogen fuel cell vehicles primarily from a life cycle costperspective. For the year 2000 he projected a 43% reduction in GHG emissions for a naturalgas to hydrogen FCV. That value is remarkably similar to the 44.5% reduction for the UnitedStates that was calculated here. The other fuel cycles considered by Delucchi were biomassor solar powered and can’t be compared to the cycles considered here.
Two recent studies and an update on full cycle greenhouse gas emissions have beenpublished by Wang (1999, 1999b, 2000). Both of these studies use the Greet model, arebased primarily on US data and contain many of the same vehicle and fuel combinations thatare of interest here. The assumptions for each of the fuel cycles may be different from thejudgements made in this study nevertheless the comparison can be informative. In Wang’smost recent work (1999b, 2000) he reports on two cases, an incremental scenario and a leapforward scenario. All three of Wang’s cases are shown in Table 7-1 and are compared to theresults found here.
Table 7-1 Comparison to Other Studies
WangAugust 1999
Greet 1.5
WangJanuary
2000. Greet1.5a
Natural GasPathways.
WangJanuary
2000. Greet1.5a
Natural GasPathways.
This ReportUnitedStates
This ReportCanada
Scenario Incremental LeapForward
Base Case Base Case
% Reductionfrom
Gasoline ICE
% Reductionfrom
Gasoline ICE
% Reductionfrom
Gasoline ICE
% Reductionfrom
Gasoline ICE
% Reductionfrom
Gasoline ICECH2,decentralized
61.2 54.8 60.5 44.5 51.8
LH2,centralized
61.0 45.0 55.1 22.5 44.3
Methanol 60.5 51.3 60.5 41.7 43.5SF Gasoline 50.6 43.7 56.1 25.8 27.5
Wang predicts greater reductions in GHG than does this study. This is in large part to domuch higher relative fuel economies assumed by Wang. The hydrogen FCV has a relative fueleconomy of 3.0 in Greet 1.5, 2.8 for the incremental scenario and 3.2 for the leap forward casedescribed in GREET 1.5a. These are all higher than the 2.2 used for this study. Wang’srelative fuel economy values for methanol FCV vary from 2.1 to 2.6 and for gasoline from 1.75to 2.25. Interestingly, the ratio of methanol to hydrogen relative fuel economy used by Wang(0.79) is the same as calculated for this study.
If Wang’s results are adjusted for the lower vehicle efficiency used in this study, then therevised results for methanol and compressed hydrogen (a 42.2% reduction in GHG) are verysimilar to those calculated here for the United States. There are still differences for gasoline(an adjusted value for Wang would be a 36% reduction) and for liquid hydrogen (adjusted to

(S&T)2Assessment of Emissions of Greenhouse
Gases from Fuel Cell Vehicles 39
42.6% reduction). Wang has assumed that large hydrogen liquefaction plants are able togenerate a portion of their electrical requirements from surplus steam that they generate andno such assumption is made here.
Levelton (1999) studied and reported on a wide variety of propulsion systems and fuels for theNational Climate Change Process Transportation Table in Canada. Hydrogen and methanolfueled FCV were included in the study. A comparison of those results and those reported hereis shown in Table 7-2.
Table 7-2 Comparison of Levelton Results with This Study
Levelton This Study% reduction from gasolineICE
% reduction from gasolineICE
Methanol FCV 39 43.5Hydrogen from Natural Gas 53 51.8Electrolytic Hydrogen 49 53.6
The Levelton hydrogen natural gas reformer efficiency was very high and is probably notachievable in the 2010 time period and the relative vehicle efficiencies were slightly lower thanthose used here. These two inputs account for most of the differences.
The Pembina Institute for Appropriate Development (2000) released a report on the life cyclegreenhouse gas emissions for selected fuel cell vehicle systems. This study used a life cycleassessment approach and considered all of the stages considered here except the vehiclematerials and vehicle assembly and transport. The authors gathered data from a wide varietyof sources, including previous work by (S&T)2. The results are shown in Table 7-3 andcompared to the Canadian results reported here. The data for this report in Table 7-3 does notinclude the vehicle materials and assembly to be consistent with the Pembina approach.
Table 7-3 Comparison of Pembina Institute Results
Pembina This Report% reduction in GHG
emissions% reduction in GHG
emissionsCompressed Hydrogen 67.7 55.8On Board Methanol 34.6 47.1On Board Gasoline 22.2 30.1Electrolytic Hydrogen(electricity from natural gas)
4.4 16.8
The results are quite different although they are in the same relative order. The differencesappear to be in the relative vehicle efficiencies chosen by Pembina. It is not clear from thePembina report if the data all came from the same source or if the hydrogen data came from adifferent source to the gasoline and methanol data. The driving cycle used for comparisonappears to be the combined urban and highway EPA cycle rather than the faster cycle usedhere. The following table compares the vehicle efficiency factors used in the Pembina study tothose used here.

(S&T)2Assessment of Emissions of Greenhouse
Gases from Fuel Cell Vehicles 40
Table 7-4 Comparison of Pembina Vehicle Energy Efficiency Factors
Pembina Pembina This Study
Fuel Economy,USMPG
Vehicle EnergyEfficiency ratio togasoline ICE
Vehicle EnergyEfficiency ratio togasoline ICE
Gasoline ICE32
Hydrogen FCV84.2 2.63 2.2
Methanol FCV56.2 1.76 1.74
Gasoline FCV38.5 1.20 1.45
The much larger range in vehicle efficiency ratios used by Pembina accounts for the largerrange in GHG emission reductions reported by them. If the hydrogen FCV modeled byPembina had used the 2.2 vehicle efficiency factor the reduction in GHG emissions would be56.6% which is very close to that reported here. For the methanol FCV the differencesbetween this study and the Pembina report are in the production of natural gas and theproduction of methanol. Pembina used an older source of data for natural gas productionemissions than was used for this study. Their assumption for emissions from a methanol plantwere based on conventional steam reforming rather than the more energy efficient combinedreforming technology used for this study. The new methanol plants being built around theworld today are using technologies more advanced than conventional steam reforming.
The studies report differing results for GHG emissions reduction potential for FCV and thevarious possible fuels for those vehicles. The differences between studies can usually beexplained by the different assumptions used in the development of the data. Since FCV arestill at a very early stage of development and good test data is not readily available it isunderstandable that different authors might make different assumptions about the futuretechnology. As shown above the different results can usually be explained.
All of the studies have indicated a reduction in GHG emissions for methanol powered FCV.The degree of reduction is dependent on the assumptions made.

(S&T)2Assessment of Emissions of Greenhouse
Gases from Fuel Cell Vehicles 41
8. CONCLUSIONS
Fuel cell vehicles offer the potential to significantly reduce the greenhouse gas emissions fromthe transportation sector. The reductions are due to a higher efficiency for the fuel cellcompared to the internal combustion engine and a different load profile that results in muchhigher efficiencies particularly at low load. The magnitude of the reduction in GHG isdependent on the fuel used to power the FCV, where and how that fuel is produced.
In Canada the greatest reduction in GHG would be from the use of compressed hydrogenmanufactured by SMR of natural gas. There are concerns regarding the practicality of thisoption for decentralized service stations. If POX units are used instead of SMR plants theGHG benefit is reduced by one half. The next greatest reductions come from centralized liquidhydrogen plants and from methanol reformed to hydrogen onboard the vehicle. The productionof hydrogen onboard the vehicles from sulphur free gasoline or Fischer Tropsch distillateproduce smaller reductions in greenhouse gases. Hydrogen produced by electrolysis fromelectricity produced by natural gas yields the lowest GHG reductions.
In the United States the results are somewhat different due to the higher carbon intensity ofelectricity generation in that country. The decentralized compressed hydrogen from SMR stillhas the greatest reduction but the centralized liquid hydrogen option is not as attractive asmethanol reformed on board the vehicle. These are followed by the onboard reforming ofgasoline and FTD, liquid hydrogen from natural gas, and electrolytic hydrogen from highefficiency gas turbines and hydrogen produced by POX systems. The percent change in GHGemissions from the various fuels for both countries is shown in Table 8-1.
Table 8-1 Reductions in GHG Emissions for Fuel Cell Vehicles in Canada and theUS
Fuel Source%
Reductionin Canada
Fuel Source%
Reductionin the US
CH2 Natural GasSMR
51.8 CH2 Natural GasSMR
44.5
LH2 Natural GasSMR
44.3 Methanol Natural Gas 41.7
Methanol Natural Gas 43.5 SulphurFreeGasoline
Crude Oil 25.8
SulphurFreeGasoline
Crude Oil 27.5 LH2 Natural GasSMR
22.5
CH2 Natural GasPOX
25.0 FT Distillate Natural Gas 21.9
FT Distillate Natural Gas 22.5 CH2 Natural Gas toElectricity
13.8
CH2 Natural Gas toElectricity
15.5 CH2 Natural GasPOX
8.5
Not all countries have local supplies of natural gas and some, such as Japan, rely on theimportation of Liquefied Natural Gas for their domestic gas requirements. For these areasmethanol made from the same remote gas as the LNG would be produced from will provide agreater reduction in GHG’s than will the natural gas to hydrogen option. Using the USelectricity mix for the distribution phases (but not the fuel production phases) and using 300miles as the inland distribution distance for both the methanol and LNG option the methanol
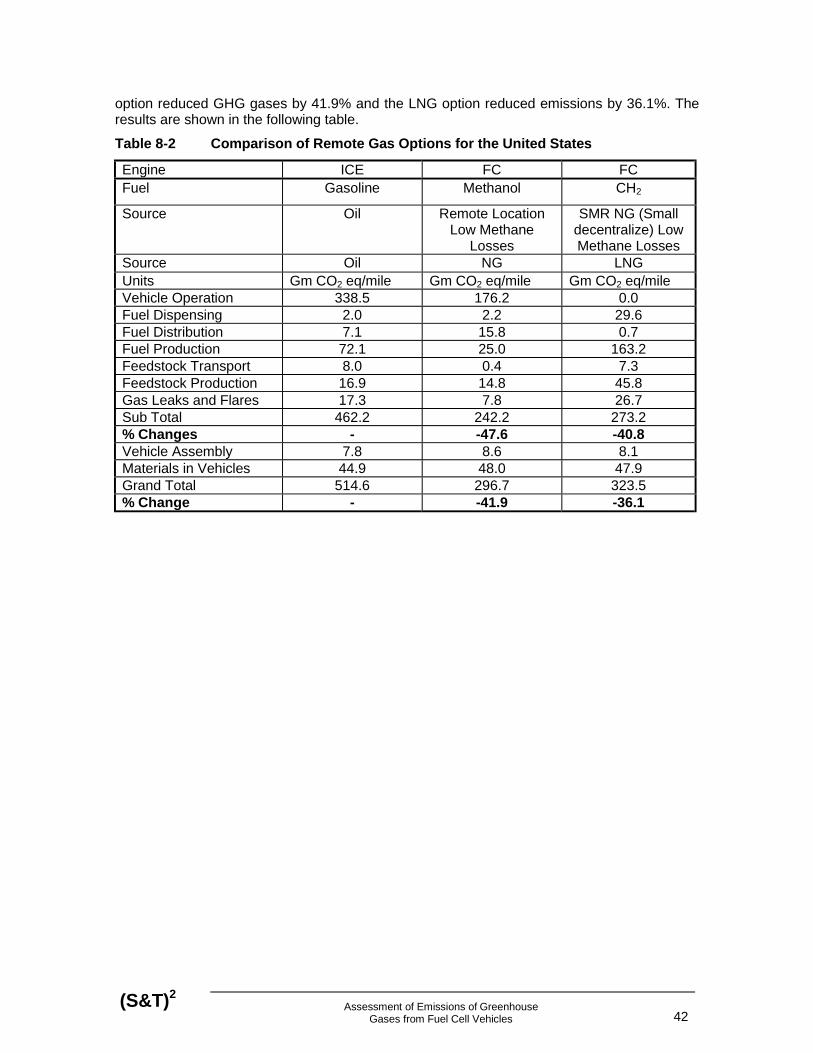
(S&T)2Assessment of Emissions of Greenhouse
Gases from Fuel Cell Vehicles 42
option reduced GHG gases by 41.9% and the LNG option reduced emissions by 36.1%. Theresults are shown in the following table.
Table 8-2 Comparison of Remote Gas Options for the United States
Engine ICE FC FCFuel Gasoline Methanol CH2
Source Oil Remote LocationLow Methane
Losses
SMR NG (Smalldecentralize) LowMethane Losses
Source Oil NG LNGUnits Gm CO2 eq/mile Gm CO2 eq/mile Gm CO2 eq/mileVehicle Operation 338.5 176.2 0.0Fuel Dispensing 2.0 2.2 29.6Fuel Distribution 7.1 15.8 0.7Fuel Production 72.1 25.0 163.2Feedstock Transport 8.0 0.4 7.3Feedstock Production 16.9 14.8 45.8Gas Leaks and Flares 17.3 7.8 26.7Sub Total 462.2 242.2 273.2% Changes - -47.6 -40.8Vehicle Assembly 7.8 8.6 8.1Materials in Vehicles 44.9 48.0 47.9Grand Total 514.6 296.7 323.5% Change - -41.9 -36.1

(S&T)2Assessment of Emissions of Greenhouse
Gases from Fuel Cell Vehicles 43
9. REFERENCES
Agee, M.A. 1999. Taking GTL Conversion Offshore. Presented at 1999 Offshore TechnologyConference. Houston Texas, May 1999.
California Air Resources Board. Research Division. Evaluation of Fuel Cell ReformerEmissions. Contract No. 95-313. Final Report. August 1999.
Canadian Association of Petroleum Producers. September 1998. Oil and Natural Gas IndustryFoundation Paper. Prepared for the National Climate Change Secretariat.
Delucchi, M. 1992. Hydrogen Fuel-Cell Vehicles. Institute of Transportation Studies, Universityof California, Davis.
Delucchi, M. 1998. Lifecycle Energy Use, Greenhouse-Gas Emissions, and Air Pollution fromthe Use of Transportation Fuels and Electricity. Institute of Transportation studies. Universityof California. Davis.
Delucchi, M. and Lipman, T., 1997. “Emissions of Non-CO2 Greenhouse Gases from theProduction and Use of Transportation Fuels and Electricity”, Institute of TransportationStudies, University of California, at Davis, UCD-ITS-RR-97-5, February
Delucchi, M.A. 1993. “Emissions of Greenhouse Gases from the Use of Transportation Fuelsand Electricity”, Volume 2: Appendixes A-S, Argonne National Laboratory, Argonne, IL, U.S.Department of Commerce, NTIS.
Delucchi, M.A., 1991. “Emissions of Greenhouse Gases from the Use of Transportation Fuelsand Electricity” Volume 1: main text, Argonne National Laboratory, Argonne, IL, U.S.Department of Commerce, NTIS, Nov.
Energy and Environment Analysis, Inc., 1999. “Fuel Supply Database Documentation, FuelStrategy Database Development Project” prepared for US Department of Energy, Washington,DC”, Revised Report, February, 1999.
Epyx. 1998. Fuel Cells for Transportation 1998. Contractor’s Annual Progress Report. USDepartment of Energy. November 1998.
Hochhauser, A.M., Benson, J.D., Burns, V.R., Gorse, R.A., Koehl, W.J., Painter, L.J., Reuter,R.M., Rutherford, J.A. 1993. Fuel Composition Effects on Automotive Fuel Economy –Auto/Oil Air Quality Improvement Research Program. SAE 930138.
Gradassi, M.J. 1998. Gas to Liquids Manufacturing Economics. Presented at MonetizingStranded Gas Reserves ’98. San Francisco, Ca. December 1998.
Jaques, A, Neitzert, F. and Boileau, P., 1997, “Trends in Canada’s Greenhouse GasEmissions (1990-1995), Environment Canada Report En49-5/5-8E, ISBN 0-662-25643-3,April.
Kalhammer, F.R., Prokopius, P.R., Roan, V.P., Voecks, G.E. Status and Prospects of FuelCells as Automobile Engines. Prepared for State of California Air Resources Board. July 1998.
Levelton Engineering Ltd. 1999. Alternative and Future Fuels and Energy Sources for RoadVehicles. Prepared for Transportation Issue Table. National Climate Change Process.

(S&T)2Assessment of Emissions of Greenhouse
Gases from Fuel Cell Vehicles 44
Lurgi Ol-Gas-Chemie. H. Gohna. Concepts for Modern Methanol Plants. Presented to 1997World Methanol Conference. Tampa, Florida. December 1997.
Mark, J. 1996. Zeroing Out Pollution, The Promise of Fuel Cell Vehicles. Union Of ConcernScientists.
Natural Resources Canada. 1997. Canada’s Energy Outlook 1996-2020.
Nyboer, J., Oliver, J. 1998. A Review of Energy Consumption in Canadian Oil Refineries andUpgraders 1990, 1994 to 1997. Simon Fraser University.
Pembina Institute for Appropriate Development. 2000. Climate-Friendly Hydrogen Fuel: AComparison of the Life-cycle Greenhouse Gas Emissions for Selected Fuel Cell VehicleHydrogen Production Systems. March 2000. Prepared with support from the David SuzukiFoundation.
Purvin & Gertz, Inc. 1999. Petroleum Downstream Sector Industry Foundation Paper.Prepared for CPPI and presented to Climate Change Issue Table.
Radian International LLC. 1995 Air Emissions Inventory of the Canadian Natural Gas industry.Prepared for Canadian Gas Association. September 1997.
Reinkingh, J., Carpenter, I., Edwards, N., Ellis, S., Frost, J., Golunski, S., van Keulen, N.,Petch, M., Pignon, J. On-board Hydrogen Generation for PEM Fuel Cells in AutomotiveApplications. SAE 1999-01-1320.
Stodolsky, F., Gaines, L., Marshall, C.L., An, F. 1999. Total Fuel Cycle Impacts of AdvancedVehicles. SAE 1999-01-0322.
Thomas, C.E., James, B.D., Kuhn, I.F., Lomax, F.D., Baum, G. N. Hydrogen InfrastructureStudy Summary. Prepared for the US DOE, Office of Transportation Technologies. July 1997.
Thomas, C.E., James, B.D., Kuhn, I.F., Lomax, F.D., Kuhn, I. F. 1999. Hydrogen InfrastructureCosts for Fuel Cell Vehicles. Presented at the 9th Canadian Hydrogen Conference. VancouverBC, February 1999.
UNFCCC Database. www.unfccc.de/resource/index.html
US EPA. 1998. EPA Staff Paper on Gasoline Sulfur Issues. US EPA Office of Mobile Sources.EPA420-R-98-005.
US EPA. 1998b. Emissions of Nitrous Oxide from Highway Mobile Sources. EPA420-R-98-009.
Wang, M.Q. 2000. GREET 1,5a: Changes from GREET 1.5. Centre for TransportationResearch. Argonne National Laboratory.
Wang, M.Q., Huang, H.-S. 1999b. December 1999 “A Full Fuel-Cycle Analysis of Energy andEmissions Impacts of Transportation Fuels produced from Natural Gas”, prepared by theCenter for Transportation Research, Energy Systems Division, Argonne National Laboratory,Argonne, IL. ANL/ESD-40.

(S&T)2Assessment of Emissions of Greenhouse
Gases from Fuel Cell Vehicles 45
Wang, M.Q., 1999. August 1999 “Transportation Fuel Cycles Model: Methodology,Development, Use, and Results”, Greet 1.5, prepared by the Center for TransportationResearch, Energy Systems Division, Argonne National Laboratory, Argonne, IL. ANL/ESD-39.Vol. 1 and Vol. 2.
Wang, M.Q., June 1996 “Transportation Fuel Cycles Model: Methodology and Use”, Greet 1.0,prepared by the Center for Transportation Research, Energy Systems Division, ArgonneNational Laboratory, Argonne, IL.
Wurster, R.,Zittel. W., Energy Technologies to Reduce CO2 Emissions in Europe: Prospects,Competition, Synergy. April 1994.

(S&T)2Assessment of Emissions of Greenhouse
Gases from Fuel Cell Vehicles 46
Appendix A Delucchi Model.
The Delucchi model, as used in this study, is capable of estimating fuel cycle emissions ofthe primary greenhouse gases, carbon dioxide, methane, nitrous oxide, and the criteriapollutants, nitrogen oxides, carbon monoxide, sulphur oxides, nonmethane organiccompounds (also known as VOCs) and exhaust particulate matter. The model also iscapable of analyzing the emissions from gasoline and alternative fuelled internal combustionengines for both light-duty and heavy-duty vehicles, and for light duty battery poweredelectric vehicles.
The full cycle model predicts emissions for past, present and future years using historicaldata or correlations for changes in energy and process parameters with time that are storedin the model. The model is thus capable of analyzing what is likely to happen in future yearsas technologies develop. The model allows for segmentation of the predicted emissions intocharacteristic steps in the production, refining, distribution and use of fuels and theproduction of motor vehicles. The fuel cycle segments considered in the model are asfollows:• Vehicle Operation
Emissions associated with the use of the fuel in the vehicle. Includes all threegreenhouse gases.
• Fuel Dispensing at the Retail LevelEmissions associated with the transfer of the fuel at a service station from storageinto the vehicles. Includes electricity for pumping, fugitive emissions and spills.
• Fuel Storage and Distribution at all StagesEmissions associated with storage and handling of fuel products at terminals, bulkplants and service stations. Includes storage emissions, electricity for pumping,space heating and lighting.
• Fuel Production (as in production from raw materials)Direct and indirect emissions associated with conversion of the feed stock into asaleable fuel product. Includes process emissions, combustion emissions for processheat/steam, electricity generation, fugitive emissions and emissions from the lifecycle of chemicals used for ethanol fuel cycles.
• Feedstock TransportDirect and indirect emissions from transport of feedstock, including pumping,compression, leaks, fugitive emissions, and transportation from point of origin to thefuel refining plant. Import/export, transport distances and the modes of transport areconsidered.
• Feedstock Production and RecoveryDirect and indirect emissions from recovery and processing of the raw feedstock,including fugitive emissions from storage, handling, upstream processing prior totransmission, and mining.
• Fertilizer ManufactureDirect and indirect life cycle emissions from fertilizers, and pesticides used forfeedstock production, including raw material recovery, transport and manufacturingof chemicals. This segment is only applicable to biomass based cycles.
• Land use changes and cultivation associated with biomass derived fuelsEmissions associated with the change in the land use in cultivation of crops,including N2O from application of fertilizer, changes in soil carbon and biomass,methane emissions from soil and energy used for land cultivation.
• Carbon in Fuel from AirCarbon dioxide emissions credit for biomass based fuels arising from use of arenewable carbon source that obtains carbon from the air. This is consistent withIPCC guidelines.
• Leaks and flaring of greenhouse gases associated with production of oil and gas

(S&T)2Assessment of Emissions of Greenhouse
Gases from Fuel Cell Vehicles 47
Fugitive hydrocarbon emissions and flaring emissions associated with oil and gasproduction.
• Emissions displaced by co-products of alternative fuelsEmissions displaced by DDGS, a co-product of ethanol production, equal toemissions from corn feed and soybean meal displaced net of emissions fromtransport of the product to the end-users. This is also a factor for processes that alsoproduce electricity and/or steam as part of the alternative fuel production process.
• Vehicle assembly and transportEmissions associated with the manufacture and transport of the vehicle to the pointof sale, amortized over the life of the vehicle.
• Materials used in the vehiclesEmissions from the manufacture of the materials used to manufacture the vehicle,amortized over the life of the vehicle.
Fuel economy in units of miles per US gallon is the principal input variable available to theuser of the model for case studies and is used within the model as the energy demand thatmust be satisfied by the fuel production, refining and other segments of the fuel cycle. Fueleconomy values are input separately for city and highway travel and for light-duty and heavy-duty vehicles. The model inputs are all in US units. Most of the full cycle energy andgreenhouse analyses found in the literature use US units.