green supply chain decision-making
TRANSCRIPT

energies
Article
Evolutionary Game on Government Regulation andGreen Supply Chain Decision-Making
Jiayang Xu 1, Jian Cao 1,2 , Yunfei Wang 1, Xiangrong Shi 3,* and Jiayun Zeng 1
1 School of Management, Zhejiang University of Technology, Hangzhou 310023, China;[email protected] (J.X.); [email protected] (J.C.); [email protected] (Y.W.); [email protected] (J.Z.)
2 Center for Global & Regional Environmental Research, The University of Iowa, Iowa City, LA 52242, USA3 School of Information Management and Engineering, Zhejiang University of Finance and Economics,
Hangzhou 310018, China* Correspondence: [email protected]; Tel.: +86-130-64741835; Fax: +86-571-87557066
Received: 6 January 2020; Accepted: 22 January 2020; Published: 1 February 2020�����������������
Abstract: Sustainability issues have gained growing awareness in recent years. Governmentsplay an important role in environment and resources problems since they can affect enterprises’production activities by enacting policies and regulations. To promote green production in the longterm associated with the consideration of financial intervention of governments, we establish athree-population model of suppliers, manufacturers and governments based on evolutionary gametheory, and analyze the evolutionary stable strategies (ESS) of their unilateral and joint behaviors.Further, system dynamics (SD) is applied to empirical analysis for exploring the dynamic interactionof the populations’ strategy, and the key factors affecting ESS are also discussed in detail. The resultsshow that: (1) the proportion of green suppliers and manufacturers in their groups determineswhether the government implements regulation; (2) any party of the supplier and manufacturer thatadopts green strategy could promote green behavior of the other; (3) the government is advised tosupervise and implement reward and punishment mechanism under the low proportion of greensupply chain; (4) government regulation could promote the corporations to adopt green behavior andshould preferentially implements the mechanism on manufacturers. The results provide insights intothe policy-making of governments and enterprises management on sustainable development.
Keywords: green strategy; government regulation; reward and punishment; evolutionary game
1. Introduction
With the increase of various industries and economic development throughout the world,environmental issues such as global warming, resource shortage, and waste pollution have becomeimportant concerns for society [1–3]. In this context, the green supply chain concept is generatedand has gained growing attraction from people who are aware of environmental protection andhave a consensus on green and sustainable development [4–6]. The enterprises in a green supplychain achieve their profits while adopting green development strategies in different stages of theproduct life cycle. Governments have also paid special attention to these environmental issues andreleased related policies to encourage manufacturers to implement green production activities. Forexample, the Chinese government has embraced green supply chain incorporation into the key nationaldevelopment strategy and stepped up guidance and supervision in a bid to encourage enterprises todevelop green development schemes that integrate benefit growth with resource conservation andenvironmental protection.
In 2001, the National People’s Congress of China (NPCC) passed the Clean Production Propel Lawto promote energy conservation, highly efficient utilization of resources, and clean production of
Energies 2020, 13, 620; doi:10.3390/en13030620 www.mdpi.com/journal/energies

Energies 2020, 13, 620 2 of 25
manufactured products [7]. In order to regulate recycling and disposal of waste electrical and electronicproducts, the Regulation on Management of E-waste Disposal implemented since 2011 stipulates thedisposal catalogue, disposal plan and qualification standards for e-waste treatment corporations [8,9].In 2017, the State Council issued the Implementation Plan of Extended Manufacturer Responsibility Principle,which advocates that manufacturers’ responsibilities for products involve the whole life cycle ofproduct design, consumption, recycling and waste disposal [10,11]. With the increasingly stringentenvironmental regulations, many enterprises cooperate to build a green supply chain for promotingthe production and development of green products. In recent years, the market share of greenappliances such as high-efficiency and energy-saving air conditioners, refrigerators, and water heatershas gradually increased. For example, inverter air conditioners have accounted for about 58% of theair-conditioning market in 2019. In the auto industry, the share of new-energy vehicles is also rising.Many auto manufacturers such as Geely, Changan, BYD, Chery, and Roewe have launched a seriesof electric vehicles. Dell, a leading manufacturer of electronic products, minimizes the consumptionof resources from materials used to the end-of-life (EOL) products management. In October 2018,more than 150 enterprises including Gree, Midea, Huawei, Yuanda and Schneider, as well as someuniversities, scientific research institutes, financial institutions and industry associations, establishedGreen Supply Chain Alliance in Beijing, in order to set up a sustainable development mode for enterprises.
In the context of growing consumer environmental protection consciousness and green marketdevelopment, the long-term dynamic game between government’s environmental regulation andgreen activities of supply chain members has led to managerial research, which combines participants’benefits with environmental sustainability. Accordingly, the main objectives of our research are: (1) toidentify the relationships of green activity strategies between suppliers and manufacturers, (2) toexplore the relationships between the green activity strategy of supply chain and supervision behaviordecision of governments and (3) to investigate the effect of environmental regulations, includingsupervision and reward and punishment mechanism, on the green activity strategies of suppliersand manufacturers.
The issues could be addressed by evolutionary game theory that shows the mutation processof strategy selection and solves multiple equilibriums considering bounded rationality and learningmechanisms [12]. A three-population evolutionary game model is proposed in which each supplieror manufacture in their population can choose to implement green production activity or non-greenproduction activity and the government agency also has two strategies, that is, supervision andnon-supervision. In particular, if governments choose to supervise the supply chain, they will executereward and punishment mechanism where the green corporations are provided for incentives andpenalties are levied on the non-green corporations. In this paper, green strategy for suppliers refers tousing clean technology to provide or produce environmental-protection raw materials. Manufacturers’green behavior involves introducing clean and energy-saving technology to produce green productswhich may contain recyclable materials [13]. The final price of products is considered as being dependentupon whether the suppliers and manufacturers adopt a green strategy. We analyze the evolutionpath of the population of suppliers, manufacturers and governments under different preconditions.Subsequently, the multi-player evolutionary game is simulated by adopting system dynamics (SD) andthe implementation effect of different strategies for the participants are analyzed. This paper makescontributions primarily in the following aspects:
(1) The government is added to the game between suppliers and manufacturers, and a three-partyevolutionary game model is constructed.
(2) To analytically identify the long-term decision-making about green behavior of the supply chainmembers from the perspective of internal factors or external environmental regulation.
(3) To propose the effect of supply chain members’ strategies on government regulation. And thegovernment environmental policy is optimized to encourage more suppliers and manufacturersto take green activities.
Energies 2020, 13, 620 3 of 25
The reminder of this paper is organized as follows: A review of the literature is introducedin Section 2. Section 3 describes assumptions and notations and proposes the basic evolutionarygame model. Section 4 presents the evolutionary path and strategy stability of each population aswell as the equilibrium points of the system. In Section 5, a case study and sensitivity analysis areprovided. Finally, Section 6 summarizes the key results and discusses managerial insights and futureresearch directions.
2. Literature Review
The literature associated with our study can be divided into three categories: (i) static and dynamicgames between green supply chain members; (ii) influence of government intervention on supply chainmembers’ behavior; (iii) applications of system dynamics in analyzing supply chain members’ behavior.
2.1. Static and Dynamic Game between Green Supply Chain Members
Game theory is extensively applied in green supply chain research. As remanufacturing is anenvironmental activity for a supply chain, Savaskan et al. [14] considered three reverse channel formatswhere the manufacturer acts as the Stackelberg leader, and discussed the most effective undertaker ofproduct collection activity for the manufacturer. Nagarajan and Sošic [15] constructed cooperativebargaining models to find profit allocations between supply chain partners and study coalitionformation among the players. Nagurney and Yu [16] developed an oligopoly model for fashionsupply chain competition which considers differentiation in product brand and degrees of consumers’environmental consciousness. Different Nash equilibria are discussed for demonstrating the impactof different factors on product demands, the product prices, and firms’ profits. By incorporating theconcept of fairness into a green product supply chain, Shi et al. [17] explored the impacts of fairnessconcerns and green efficiency on retail price, product’s green degree and profits of the manufacturerand retailer based on a Stackelberg game. Under uncertain market conditions, Bai and Tang [18]developed Nash, Stackelberg, and cooperative game models, respectively, to discuss the relationshipsof environmental investments, market demand, market price and profits of companies. Hong etal. [19] studied the competitive pricing of green products and non-green products under a Nashgame framework. The relationship of pricing strategy and product quality as well as consumers’environmental awareness are discussed. In order to coordinate the green supply chain members’interest conflicts, Song and Gao [20] established a retailer-led revenue sharing contract game model anda bargaining revenue-sharing contract game model. They proved that the revenue-sharing contractscan improve the products’ greening level and the overall profitability of the supply chain. Taleizadehet al. [21] formulated two types of remanufacturing models, where a manufacturer-led Stackelberggame is used, to analyze the effects of remanufacturing characteristics on carbon emissions, qualityimprovement, and the supply chain’s profit. Capraro et al. [22] proposed that the reduction of airpollution and the redistribution of scarce resources reflected the conflict between pro-self and pro-socialbehaviors. They used Dictator Game (DG) and Prisoner’s Dilemma (PD) to measure individuals’altruistic and cooperative attitudes.
The research above concentrates primarily on single- or several-period games between thevarious entities of a green supply chain to improve the supply chain’s performance and ensure thatthe production activities cause a minimum amount of environmental degradation. The theme ofthe research has also been elaborated by evolutionary game theory since this game theory extendsthe traditional game theory to focus on the multiple-period and long-term evolution process anddescribe the interaction among different strategies of populations [23]. Barari et al. [24] presenteda two-population evolutionary game between manufacturers and retailers with different strategiesand derived the stable strategy set by considering the environmental and commercial benefits. Baduand Mohan [25] modeled a supply chain as an evolutionary game to study its sustainability fromeconomic, social and environmental dimensions and analyze how the trivial actions by members of thesupply chain affect the equilibrium of the system. Ji et al. [26] applied evolutionary game theory to
Energies 2020, 13, 620 4 of 25
new energy vehicle diffusion by establishing an interaction mechanism between local governmentsand auto manufactures. The evolutionary stable strategies with and without government subsidy weredemonstrated and the impacts of some parameters on agents’ benefits were discussed.
The work about green supply chain using game theory mainly constructed a two-party gamemodel including enterprise-enterprise game and government-enterprise game. In this research, atripartite evolutionary game model of suppliers, manufacturers and governments is formulated toanalyze their behaviors’ change process.
2.2. Influence of Government Intervention on Supply Chain Members’ Behavior
A capacious body of the work focuses on the impacts of the environmental regulation and financialintervention of governments on enterprises’ decisions on generating green products. Bansal andGangopadhyay [27] explored the influences of different government incentives and tax policies onenterprises’ green production and social welfare. To investigate the factors which could promoteimplementation of extended producer responsibility principle for green supply chain firms, Chenand Sheu [28] designed a differential game model in which an integrated financial incentive isprovided for treatment agency and regulation standard of recycling rate is imposed for the competitivemanufacturers. Zhu and Dou [29] took into account government subsidies, product greennessand competition in the Stackelberg model with two manufacturers and discussed effects of thevarious factors on decision-making of companies. Krass and Nedorezov [30] examined the role ofenvironmental taxation in environmental pollution reduction and greener technology strategy ofthe firms. Hafezalkotob [31] investigated the influence of government financial intervention on acompetition model consisting of one green supply chain and one regular supply chain, and revealedthat governmental tariffs and subsidies exert significant effects on the members’ profits. Wang etal. [32] constructed a reverse supply chain system composed of two manufacturers and a recyclerand introduced government recycling reward and punishment mechanism to promote manufacturers’recycling and remanufacturing.
Besides considering the government environmental policies as exogenous variables, somestudies paid attention to government’s decision-making or the relationships between the strategies ofgovernment and corporations. Ghosh and Shah [33] established a two-part tariff contract to coordinatethe decentralized green channel and found that cooperation between supply chain participants couldenhance greening levels. Yang et al. [34] discussed the influence of government subsidies on the cost,output and profit of renewable energy enterprises and traditional energy enterprises under perfectinformation and asymmetric information conditions. Mahmoudi and Rasti-Barzoki [35] used gametheory to analyze the performance of supply chain members under different governmental policies. Ina sustainable supply chain with an energy supplier, an energy-efficient manufacturer, and an inefficientmanufacturer, Safarzadeh and Rasti-Barzoki [36] proposed two policies, i.e., tax deductions and subsidyschemes, and found that tax deduction was a more effective policy than a subsidy scheme to supportthe energy-efficient manufacturer, but subsidy policies could help the government reduce the energyconsumption better. Zhang et al. [37] demonstrated manufacturer’s low carbon strategy under variousgovernmental cap with three power structures.
In the above research, the scholars have employed traditional game theory, e.g., Cournot andStackelberg games, which assume that the participants are completely rational to analyze the strategies ofparticipants. Instead, evolutionary game theory regards the participants as bounded rationality, whichappears to have more realistic significance. Although Ji et al. [26] and Mahmoudi and Rasti-Barzoki [35]used the evolutionary game theory in their study, but they took the government policy as externalfactors and did not analyze the equilibrium utility of governments. Accordingly, compared withexisting literature about government and green supply chain members’ behavior, our research usedevolutionary game theory to analyze the equilibrium points and utility of multiple participants.
Energies 2020, 13, 620 5 of 25
2.3. Applications of System Dynamics (SD) in Analyzing Supply Chain Members’ Behavior
The method of SD is used by some scholars on studying government environmental policiesand green supply chain operations. Li et al. [38] established a SD model to simulate CO2 emissionsunder different scenarios, and proposed suggestions on simultaneously reducing CO2 emissions andenvironmental costs. Yang et al. [39] applied SD to ordering strategy simulation, by which theyanalyzed the impacts of emission cap policy and carbon tax policy on the decision-making of thesupplier and retailer as well as supply chain efficiency. Taking the Chinese automobile manufacturingindustry as an example, Tian et al. [40] discussed the relationship of the government, enterprisesand consumers through system dynamics and evolutionary game theory and provided guidance forthe development of green supply chain. Gupta [41] used a SD model in radial tyre manufacturingfor computing lean–green performance of the plant, which helps predicting their performance indynamic scenarios. Zhou et al. [42] introduced various governmental regulation parameters into asystem dynamics model and compared the effects of different policies. Tong et al. [43] developed anevolutionary game model concerning cap-and-trade mechanism to analyze the evolutionary behaviorof the retailers and the manufacturers.
From the above studies, we can see that SD is a common and important method in the researchof evolutionary game. However, the above research mainly focuses on the influence of governmentregulation on supply chain members’ behavior. In this paper, we investigate the influence ofcorporations’ decision-making on environmental regulation formulation for the government anddescribes the long-term dynamic interaction of strategies of multiple participants including suppliers,manufacturers and governments by SD.
2.4. Research Gaps and Contributions to Literature
Some literature has studied the behavior of corporations from the perspective of sustainability orhas discussed the influence of environmental regulations on enterprises’ green behavior. Moreover,some scholars also use the system dynamics method to simulate players’ behavior under differentgovernment environmental policies. Our contributions to existing research lie in two aspects. First, inthe decision-making process of government and supply chain members, we simultaneously analyzethe dynamic equilibrium of government’ utility and supply chain members’ profits. Second, combinedwith SD, the long-term interaction among governments, suppliers and manufacturers is discussedfrom the perspective of equilibrium. In reality, the government’ decision-making changes with thegreen product market and the relationship between the government and enterprises is more in linewith the process of dynamic game, so it is of practical guiding significance to discuss the long-termdynamic relationship between government environmental regulation and enterprise green behaviorbased on evolutionary game.
3. Model Formulation
3.1. Assumptions and Notations
Consider a population of suppliers and a population of manufacturers in a specific industryand local governments that supervise the industry. Manufacturers procure raw materials from theirsuppliers and sell their products to consumers. It is assumed that the suppliers and manufacturers canadopt green behaviors in the production processes of raw materials and finished products, respectively.For the suppliers, the green activities include investing the research and development of green andcleaner technology, energy-saving and clean production process, utilizing renewable materials andetc [44,45]. Green manufacturers choose to apply low-carbon and eco-friendly production process,reduce the emission of harmful substances, etc [46,47]. Two strategies, green behavior and non-greenbehavior, are defined for suppliers and manufacturers. Local governments could monitor the activitiesof suppliers and manufacturers or not. If the governments choose supervision strategy, they wouldsubsidize suppliers and manufacturers that perform green behaviors and punish the non-green

Energies 2020, 13, 620 6 of 25
corporations. Suppose that the suppliers, manufacturers and governments are all rationally bound,and they change their strategies dynamically based on the principle of maximizing their own benefit.In order to explore the relationship and benefit balance among government environmental regulations,green decisions of suppliers and manufacturers, we make the following assumptions:
Assumption 1. A population of suppliers, a population of manufacturers and local governments are theparticipants of the game; they use bounded rationality and continuous learning from multiple gaming andseeking the Evolutionary Stable Strategy (ESS) to achieve the optimal equilibrium.
Assumption 2. The suppliers and manufacturers have two strategies: adopt green behavior and keeptraditional non-green behavior. The governments also have two strategies, that is, to supervise the suppliers andmanufacturers, and not supervise them.
Assumption 3. If the suppliers choose to adopt green behavior, they need additional cost including productionequipment improvement and investment in R&D for green and cleaner technologies. The unit cost for green(non-green) suppliers is cg (cn), respectively, and it is generally believed that cg > cn. The wholesale price ofgreen (non-green) raw materials sold to manufacturers is viewed as wg (wn), and it satisfies that wg > wn.
Assumption 4. The raw material greenness affects the production process and green investment of manufacturers,the unit production cost for manufacturers can be described in the following four scenarios:
i. When the suppliers adopt green behavior and the manufacturers keep non-green behavior, the unit cost fornon-green manufacturers is cgn;
ii. When the suppliers offer non-green raw materials or components while the manufacturers adopt greenstrategy, the unit cost for green manufacturers is cng;
iii. When both the suppliers and the manufacturers choose to perform green behaviors, the cost of manufacturersiscgg;
iv. When both the suppliers and the manufacturers choose to perform non-green behaviors, the cost ofmanufacturers is cnn.
Consider that manufacturers’ cost is related to greenness of raw materials and green raw materialscould reduce manufacturers’ green cost, so manufacturers’ cost under various conditions meets withcng > cgg > cnn > cgn.
Assumption 5. The manufacturers add their profit margin to the procurement and production cost and decidethe final sale price which is related to the environment investment, thus the final price of the products differ underdifferent strategies of the supply chain members, as is shown as follow:
i. If the suppliers and manufacturers are both non-green, the products offered by the supply chain is alsonon-green, and the final price is regarded as pnn;
ii. If the suppliers and manufacturers both implement green activity, the final price is pgg;iii. If only the suppliers adopt green behavior, the price is denoted as pgn;iv If only the manufacturers adopt green behavior, the price is png.
Suppose the green behavior of suppliers and manufacturers affects final prices equally,pgg > pgn = png > pnn should be satisfied.
Assumption 6. With the increasing green awareness of consumers, product value and corporate reputation canbe enhanced through green activity implementation. Assume that producing green products per unit increasesthe reputation of the suppliers and the manufacturers by rS and rM, respectively.
Assumption 7. When the governments choose supervision strategy, they undertake supervisory cost andimplement reward and punishment mechanism. The government subsidy to the suppliers and manufacturers thatperform green activities is iS and iM for per unit product, respectively; the non-green suppliers and manufacturersare punished by fS and fM of per unit product, respectively.

Energies 2020, 13, 620 7 of 25
Assumption 8. Assume that the social benefit generated by both the suppliers and manufacturers adoptinggreen behaviors is ϕ, so only one of the parties performing greenly causes ϕ/2 social benefit. When any partyfails to take green actions, the governments should bear the cost of pollution treatment cGd.
The parameters and variables and their descriptions are shown in Table 1.
Table 1. Parameters and variables.
Notations Descriptions
Parametercn The cost per unit for each non-green suppliercg The greening cost per unit for each green supplierwg The wholesale price of green materialswn The wholesale price of non-green materialscgg Each green manufacturer’s production cost per unit with green materialscng Each green manufacturer’s production cost per unit with non-green materialscgn Each non-green manufacturer’s production cost per unit with green materialscnn Each non-green manufacturer’s production cost per unit with no-green materialspgg The final price under green suppliers and green manufacturerspng The final price under non-green suppliers and green manufacturerspgn The final price under green suppliers and non-green manufacturerspnn The final price under non-green suppliers and non-green manufacturersrS Each supplier’s corporate reputation by adopting green strategyrM Each manufacturer’s corporate reputation by adopting green strategyiS Government subsidy to green suppliers for per unit of productsiM Government subsidy to green manufacturers for per unit of productsfS Government punishment to non-green suppliers for per unit of productsfM Government punishment to non-green manufacturers for per unit of productscGe Government regulatory cost on per unit of productscGd Pollution treatment cost on per unit productϕ The social benefit when both suppliers and manufacturers adopt green behaviors
Variablesx The probability that the suppliers adopt green behaviory The probability that the manufacturers adopt green behaviorz The probability that governments implement the regulation
3.2. Basic Model
According to the aforementioned assumptions, payoff matrixes of the suppliers, manufacturersand governments can be obtained. Table 2 shows the payoff matrix without government supervision,and the payoff matrix under government regulation is presented in Table 3.
It is assumed that the probability of the supplier to adopt or not adopt green strategy is x and 1 − x,x ∈ [0, 1], and the probability of the manufacturer to adopt green strategy is y, y ∈ [0, 1]. Suppose z and1 − z represent the probability of the governments to implement or not implement regulation, z ∈ [0, 1].
Let ESg and ESn be respectively the expected profit of “adopt green behavior” and “adopt non-greenbehavior” for suppliers. Combined Tables 2 and 3, the expected profit of the suppliers with the twodifferent behavior strategies are as follows:
ESg = yz(wg − cg + rS + iS
)+ z(1− y)
(wg − cg + rS + iS
)+ y(1− z)
(wg − cg + rS
)+ (1− y)(1− z)
(wg − cg + rS
)(1)
ESn = yz(wn − cn − fS) + z(1− y)(wn − cn − fS) + y(1− z)(wn − cn) + (1− y)(1− z)(wn − cn) (2)

Energies 2020, 13, 620 8 of 25
Table 2. Payoff matrix without government supervision.
When the Government does not Supervise the Supply Chain
Manufacturers
Adopt Green Behavior Adopt Non-Green Behavior
Suppliers Manufacturers Governments Suppliers Manufacturers Governments
Suppliers Adopt green behavior wg − cg + rS pgg −wg − cgg + rM ϕ wg − cg + rS pgn −wg − cgn ϕ/2− cGdAdopt non-green behavior wn − cn png −wn − cng + rM ϕ/2− cGd wn − cn pnn −wn − cnn −2cGd
Table 3. Payoff matrix with government supervision.
When the Government Supervises the Supply Chain
Manufacturers
Adopt Green Behavior Adopt Non-Green Behavior
Suppliers Manufacturers Governments Suppliers Manufacturers Governments
Suppliers Adopt green behavior wg − cg + rS + iS pgg −wg − cgg + rM + iM ϕ− iM − iS − cGe wg − cg + rS + iS pgn −wg − cgn − fM ϕ/2− iS − cGe + fM − cGdAdopt non-green behavior wn − cn − fS png −wn − cng + rM + iM ϕ/2− iM − cGe + fS − cGd wn − cn − fS pnn −wn − cnn − fM fS + fM − cGe − 2cGd
Energies 2020, 13, 620 9 of 25
According to Equations (1) and (2), the average expected payoff of the suppliers is calculated:
ES = xESg + (1− x)ESn (3)
Similarly, let EMg and EMn represent the expected profit of “adopt green behavior” and “adoptnon-green behavior” for manufacturers, respectively, which are presented as:
EMg = xz(pgg −wg − cgg + rM + iM
)+ z(1− x)
(png −wn − cng + rM + iM
)+ x(1− z)
(pgg −wg − cgg + rM
)+(1− x)(1− z)
(png −wn − cng + rM
) (4)
EMn = xz(pgn −wg − cgn − fM
)+ z(1− x)(pnn −wn − cnn − fM) + x(1− z)
(pgn −wg − cgn
)+ (1− x)(1− z)(pnn −wn − cnn) (5)
According to Equations (4)–(5), the average expected payoff of the manufacturers is:
EM = yEMg + (1− y)EMn (6)
For the governments, their expected benefits that choose “implement supervision” and “notsupervision” are:
EGy = xy(ϕ− iS − iM − cGe) + x(1− y)(ϕ/2− iS − cGe + fM − cGd) + y(1− x)(ϕ/2− iM − cGe + fS − cGd)
+(1− x)(1− y)( fS + fM − cG0 − 2cGd)(7)
EGn = xyϕ+ x(1− y)(ϕ/2− cGd) + y(1− x)(ϕ/2− cGd) + (1− x)(1− y)(−2cGd) (8)
The average benefit of governments is:
EG = zEGy + (1− z)EGn (9)
In the evolutionary game theory, the replicator dynamic system is dynamic differential equationsthat describes the frequency of an especial strategy used in a population [48]. Therefore, the replicatordynamic equations of “adopt green behavior” chosen by suppliers and manufacturers are presented as:
F(x) =dxdt
= x(ESg − ES
)= x(1− x)
[wg −wn + cn − cg + rS + z(iS + fS)
](10)
F(y) = dydt = y
(EMg − EM
)= y(1− y)
[x(pgg − pgn − cgg + cgn
)+ (1− x)
(png − pnn − cng + cnn
)+ rM +z(iM + fM)] (11)
Similarly, the replicator dynamic equation for the governments is:
F(z) =dzdt
= z(1− z)[−xiS − cGe − yiM + (1− y) fM + (1− x) fS] (12)
4. Model Analysis
In what follows, we investigate the strategy of each group based on replicator dynamicEquations (10)–(12).
4.1. Strategy Stability Analysis for Suppliers
Let ∆w = wg −wn, ∆c = cg − cn, and the replicator dynamic equation of suppliers Equation (4)can be transformed into:
F(x) =dxdt
= x(1− x)[∆w− ∆c + rS + z(iS + fS)] (13)

Energies 2020, 13, 620 10 of 25
The first derivative of F(x) is as follows:
dF(x)dx
= (1− 2x)[∆w− ∆c + rS + z(iS + fS)] (14)
Observing Equation (13), x = 0, x = 1, z =∆c−∆w−rS
iS+ fSare the roots of F(x) = dx/dt= 0. Based
on stability theorem of replication dynamic equation, when F(x) = 0, F′(x) ≤ 0, the ESS is x [49].Let A1 =
∆c−∆w−rSiS+ fS
, then the following discussion is conducted:If z = A1, for any x, F(x) ≡ 0, then axis x is in a stable state, i.e., any strategy of the suppliers is a
stable strategy.If z , A1, the different cases are analyzed as follows:Case 1: if ∆c − ∆w − rS < 0, then z > A1, for two solutions x = 0 and x = 1 of Equation (13),
F′(x)∣∣∣x=0 > 0 and F′(x)
∣∣∣x=1 < 0 , so x = 1 is the ESS, that is, suppliers will implement a green activity.Case 2: if ∆c− ∆w− rS > iS + fS, then z < A1, for two solutions x = 0 and x = 1 of Equation (13),
F′(x)∣∣∣x=0 < 0 and F′(x)
∣∣∣x=1 > 0 , so x = 0 is the ESS, that is, suppliers will not implement a green activity.Case 3: if 0 < ∆c− ∆w− rS < iS + fS, there are two scenarios.
(1) when z > A1, F′(x)∣∣∣x=0 > 0 and F′(x)
∣∣∣x=1 < 0 , so x = 1 is the ESS;(2) when z < A1, F′(x)
∣∣∣x=0 < 0 and F′(x)∣∣∣x=1 > 0 , so x = 0 is the ESS.
The corresponding evolutionary paths of suppliers’ strategy are illustrated in Figure 1.
Energies 2020, 13, x FOR PEER REVIEW 10 of 26
The first derivative of ( )F x is as follows:
( ) ( ) ( )1 2 S S S
dF xx w c r z i f
dx= − Δ − Δ + + + (14)
Observing Equation (13), 0x= , 1x= , S
S S
c w rzi f
Δ − Δ −=
+ are the roots of ( ) =0F x dx dt= . Based
on stability theorem of replication dynamic equation, when ( ) 0F x = , ( ) 0F x′ ≤ , the ESS is x [49].
Let 1S
S S
c w rAi f
Δ − Δ −=
+, then the following discussion is conducted:
If 1z A= , for any x, ( ) 0F x ≡ , then axis x is in a stable state, i.e., any strategy of the suppliers is a stable strategy.
If 1z A≠ , the different cases are analyzed as follows: Case 1: if 0Sc w rΔ −Δ − < , then 1z A> , for two solutions 0x= and 1x= of Equation (13),
( ) 0| 0xF x =′ > and ( ) 1| 0xF x =′ < , so 1x= is the ESS, that is, suppliers will implement a green activity.
Case 2: if S S Sc w r i fΔ −Δ − > + , then 1z A< , for two solutions 0x= and 1x= of Equation (13), ( ) 0| 0xF x =′ < and ( ) 1| 0xF x =′ > , so 0x = is the ESS, that is, suppliers will not implement a green
activity. Case 3: if 0 S S Sc w r i f< Δ − Δ − < + , there are two scenarios.
(1) when 1z A> , ( ) 0| 0xF x =′ > and ( ) 1| 0xF x =′ < , so 1x = is the ESS;
(2) when 1z A< , ( ) 0| 0xF x =′ < and ( ) 1| 0xF x =′ > , so 0x = is the ESS.
The corresponding evolutionary paths of suppliers’ strategy are illustrated in Figure 1.
(a) 0Sc w rΔ − Δ − < (b) S S Sc w r i fΔ − Δ − > + (c) 0 S S Sc w r i f< Δ − Δ − < +
Figure 1. Evolutionary path of suppliers’ strategy.
As shown in Figure 1a, when 0Sc w rΔ − Δ − < , no matter what the initial state of the system is, the suppliers will eventually adopt a green strategy. It indicates that whether the government regulates the supply chain or not, the profit of the suppliers choosing a green strategy is greater than that of not adopting one. The proportion of suppliers choosing green behavior strategy increases after a long-term game between the corporations and governments, and finally all suppliers choose to implement green activity.
When S S Sc w r i fΔ − Δ − > + , the suppliers maintain non-green behavior and their strategies are not affected by governments’ action, as described in Figure 1b. Under this condition, adopting green activity cannot improve the suppliers’ profit, thus a non-green strategy is adopted by the suppliers.
When 0 S S Sc w r i f< Δ − Δ − < + , in Figure 1c, the ESS of suppliers is related to government
behavior. If the possibility of government regulation is higher than S
S S
c w ri f
Δ − Δ −+
, the trend of
1
1
x
z
1
x
z
1
x
z
Figure 1. Evolutionary path of suppliers’ strategy.
As shown in Figure 1a, when ∆c − ∆w − rS < 0, no matter what the initial state of the systemis, the suppliers will eventually adopt a green strategy. It indicates that whether the governmentregulates the supply chain or not, the profit of the suppliers choosing a green strategy is greater thanthat of not adopting one. The proportion of suppliers choosing green behavior strategy increasesafter a long-term game between the corporations and governments, and finally all suppliers choose toimplement green activity.
When ∆c− ∆w− rS > iS + fS, the suppliers maintain non-green behavior and their strategies arenot affected by governments’ action, as described in Figure 1b. Under this condition, adopting greenactivity cannot improve the suppliers’ profit, thus a non-green strategy is adopted by the suppliers.
When 0 < ∆c − ∆w − rS < iS + fS, in Figure 1c, the ESS of suppliers is related to governmentbehavior. If the possibility of government regulation is higher than ∆c−∆w−rS
iS+ fS, the trend of suppliers’
strategy is to implement green activity; otherwise, a non-green strategy is the suppliers’ choice.
4.2. Strategy Stability Analysis for ManufacturersEquation (11) indicates that the manufacturers’ strategy relates to the probability of suppliers’
green behavior and government regulation. Let ∆p1 = pgg − pgn, ∆p2 = png − pnn, ∆c1 = cgg − cgn,
∆c2 = cng − cnn and A2 =x(∆c1−∆p1)+(1−x)(∆c2−∆p2)−rM
iM+ fM, we can obtain the following results (the specific
steps of the proof are provided in Appendix A):

Energies 2020, 13, 620 11 of 25
If z = A2, then for any y, F(y) ≡ 0, i.e., for an arbitrary y, any strategy of the suppliers andgovernments is a stable strategy.
If z , A2, we demonstrate different cases as follows:Case 4: if x(∆c1 − ∆p1) + (1− x)(∆c2 − ∆p2) − rM < 0, then z > A2, for two solutions y = 0 and
y = 1 of Equation (15), F′(y)∣∣∣y=0 > 0 and F′(y)
∣∣∣y=1 < 0 , so y = 1 is the ESS, that is, manufactures willimplement a green activity.
Case 5: if x(∆c1 − ∆p1) + (1− x)(∆c2 − ∆p2)− rM > iM + fM, then z < A2. We can get F′(y)∣∣∣y=0 < 0
and F′(y)∣∣∣y=1 > 0 , so y = 0 is the ESS, that is, the manufacturers will not implement green activity.
Case 6: if 0 < x(∆c1 − ∆p1) + (1−x)(∆c2 − ∆p2) − rM < iM + fM, there are two scenarios.
(1) when z > A2, F′(y)∣∣∣y=0 > 0 and F′(y)
∣∣∣y=1 < 0 , so y = 1 is the ESS;(2) when z < A2, F′(y)
∣∣∣y=0 < 0 and F′(y)∣∣∣y=1 > 0 , so y = 0 is the ESS.
The dynamic evolutionary path and stability of the manufacturers are shown in Figure 2,where xM1 =
rM−∆c2+∆p2∆c1−∆p1−∆c2+∆p2
, xM2 =rM−∆c2+∆p2+iM+ fM
∆c1−∆p1−∆c2+∆p2.
Energies 2020, 13, x FOR PEER REVIEW 11 of 26
suppliers’ strategy is to implement green activity; otherwise, a non-green strategy is the suppliers’ choice.
4.2. Strategy Stability Analysis for Manufacturers
Equation (11) indicates that the manufacturers’ strategy relates to the probability of suppliers’ green behavior and government regulation. Let 1 gg gnp p pΔ = − , 2 ng nnp p pΔ = − , 1 gg gnc c cΔ = − ,
2 ng nnc c cΔ = − and ( ) ( )( )1 1 2 2
2
+ 1- M
M M
x c p x c p rA
i fΔ −Δ Δ −Δ −
=+
, we can obtain the following results (the
specific steps of the proof are provided in Appendix A):
If 2z A= , then for any y, ( ) 0F y ≡ , i.e., for an arbitrary y, any strategy of the suppliers and governments is a stable strategy.
If 2z A≠ , we demonstrate different cases as follows:
Case 4: if ( ) ( )( )1 1 2 2+ 1- 0Mx c p x c p rΔ − Δ Δ − Δ − < , then 2z A> , for two solutions 0y = and 1y =
of Equation (15), ( ) 0| 0yF y =′ > and ( ) 1| 0yF y =′ < , so 1y = is the ESS, that is, manufactures will implement a green activity.
Case 5: if ( ) ( )( )1 1 2 2+ 1- M M Mx c p x c p r i fΔ − Δ Δ − Δ − > + , then 2z A< . We can get ( ) 0| 0yF y =′ < and
( ) 1| 0yF y =′ > , so 0y = is the ESS, that is, the manufacturers will not implement green activity.
Case 6: if ( ) ( )( )1 1 2 20 + 1- M M Mx c p x c p r i f< Δ − Δ Δ − Δ − < + , there are two scenarios.
(1) when 2z A> , ( ) 0| 0yF y =′ > and ( ) 1| 0yF y =′ < , so 1y = is the ESS;
(2) when 2z A< , ( ) 0| 0yF y =′ < and ( ) 1| 0yF y =′ > , so 0y = is the ESS.
The dynamic evolutionary path and stability of the manufacturers are shown in Figure 2, where 2 2
11 1 2 2
MM
r c pxc p c p
−Δ +Δ=
Δ −Δ −Δ +Δ, 2 2
21 1 2 2
M M MM
r c p i fxc p c p−Δ +Δ + +
=Δ −Δ −Δ +Δ
.
(a) 1 1 2 2 0c p c pΔ − Δ − Δ + Δ < (b) 1 1 2 2
1 2
0orM M
c p c px x x x
Δ − Δ − Δ + Δ >< >
,
(c) 1 1 2 2
1 2
0
M M
c p c px x x
Δ − Δ − Δ + Δ >< <
,
Figure 2. Evolutionary path of manufacturers’ strategy.
Figure 2a indicates that the manufacturers ultimately adopt green activity regardless of the initial state of the system when 1 1 2 2 0c p c pΔ −Δ −Δ + Δ < . 1 1c pΔ − Δ depends on the values of the difference in production costs between green and non-green manufacturers and the difference in selling prices when suppliers adopt a green strategy; when suppliers adopt a non-green strategy, by subtracting the difference in selling prices between green and non-green manufacturers from the difference in selling prices, we get 2 2c pΔ − Δ . In this case where 1 1 2 2c p c pΔ −Δ < Δ −Δ , the behavior of the suppliers and the governments will not affect the manufacturers’ decisions, and the profit of each
Figure 2. Evolutionary path of manufacturers’ strategy.
Figure 2a indicates that the manufacturers ultimately adopt green activity regardless of the initialstate of the system when ∆c1 − ∆p1 − ∆c2 + ∆p2 < 0. ∆c1 − ∆p1 depends on the values of the differencein production costs between green and non-green manufacturers and the difference in selling priceswhen suppliers adopt a green strategy; when suppliers adopt a non-green strategy, by subtracting thedifference in selling prices between green and non-green manufacturers from the difference in sellingprices, we get ∆c2 −∆p2. In this case where ∆c1 −∆p1 < ∆c2 −∆p2, the behavior of the suppliers and thegovernments will not affect the manufacturers’ decisions, and the profit of each manufacturer choosinggreen strategy is greater than that of not performing green behavior. Therefore, after a long-term game,all manufacturers choose green strategy.
Figure 2b,c show the dynamic evolution of manufacturers’ strategies when ∆c1 −∆p1 −∆c2 +∆p2 > 0.If x < xM1, that is, the probability of suppliers adopting green activity is at a low level, the manufacturerswill finally choose the strategy “adopt green behavior”; if x > xM2, “adopt non-green behavior” strategyis preferred by the manufacturers (see Figure 2b). If xM1 < x < xM2, manufacturer’s ESS is related toboth supplier’s decision and government’s action. When the probability of government regulation isat high level, i.e., z > A2, manufacturers will adopt a green strategy; otherwise, they choose to remainnon-green (see Figure 2c). Therefore, increasing the proportion of green suppliers and strengtheninggovernment supervision can promote green production by manufacturers.
4.3. Strategy Stability Analysis for Governments
It can be seen that government’s strategy has an impact on the suppliers’ and manufacturers’decisions, so in what follows, we analyze the evolutionary process and stability of government’s

Energies 2020, 13, 620 12 of 25
strategy. Let A3 =(1−y) fM+ fS−yiM−cGe
iS+ fS, the derivation procedure is similar with Sections 4.1 and 4.2, and
the results are as follows (The specific steps of the proof are provided in Appendix B).If x = A3, then for any z, F(z) ≡ 0, that is, for an arbitrary z, any strategy of the suppliers and
manufacturers is a stable strategy.If x , A3, different cases are as follows:Case 7: if (1− y) fM + fS − yiM − cGe < 0, then x > A3, for two solutions z = 0 and z = 1 of
Equation (12), F′(z)∣∣∣z=0 < 0 and F′(z)
∣∣∣z=1 > 0 , so z = 0 is the ESS, that is, governments will notregulate the supply chain.
Case 8: if (1− y) fM + fS − yiM − cGe > iS + fS, for any x, x < A3 can be satisfied, and we can getF′(z)
∣∣∣z=0 > 0 and F′(z)∣∣∣z=1 < 0 , so z = 1 is the ESS.
Case 9: if 0 < (1− y) fM + fS − yiM − cGe < iS + fS, there are two scenarios.
(1) when x > A3, F′(z)∣∣∣z=0 < 0 and F′(z)
∣∣∣z=1 > 0 , so z = 0 is the ESS;(2) when x < A3, F′(z)
∣∣∣z=0 > 0 and F′(z)∣∣∣z=1 < 0 , so z = 1 is the ESS.
Figure 3 demonstrates the dynamic evolutionary path and stability of the governments, whereyG1 =
fM−iS−cGefM+iM
and yG2 =fM+ fS−cGe
fM+iM.
Energies 2020, 13, x FOR PEER REVIEW 12 of 26
manufacturer choosing green strategy is greater than that of not performing green behavior. Therefore, after a long-term game, all manufacturers choose green strategy.
Figures 2b,c show the dynamic evolution of manufacturers’ strategies when 1 1 2 2 0c p c pΔ − Δ − Δ + Δ > . If 1Mx x< , that is, the probability of suppliers adopting green activity is at a
low level, the manufacturers will finally choose the strategy “adopt green behavior”; if 2Mx x> , “adopt non-green behavior” strategy is preferred by the manufacturers (see Figure 2b). If
1 2M Mx x x< < , manufacturer’s ESS is related to both supplier’s decision and government’s action. When the probability of government regulation is at high level, i.e., 2z A> , manufacturers will adopt a green strategy; otherwise, they choose to remain non-green (see Figure 2c). Therefore, increasing the proportion of green suppliers and strengthening government supervision can promote green production by manufacturers.
4.3. Strategy Stability Analysis for Governments
It can be seen that government’s strategy has an impact on the suppliers’ and manufacturers’ decisions, so in what follows, we analyze the evolutionary process and stability of government’s
strategy. Let ( )
3
1 M S M Ge
S S
y f f yi cA
i f− + − −
=+
, the derivation procedure is similar with Section 4.1 and
Section 4.2, and the results are as follows (The specific steps of the proof are provided in Appendix B).
If 3x A= , then for any z, ( ) 0F z ≡ , that is, for an arbitrary z, any strategy of the suppliers and manufacturers is a stable strategy.
If 3x A≠ , different cases are as follows:
Case 7: if ( )1 0M S M Gey f f yi c− + − − < , then 3x A> , for two solutions 0z = and 1z = of
Equation (12), ( ) 0| 0zF z =′ < and ( ) 1| 0zF z =′ > , so 0z = is the ESS, that is, governments will not regulate the supply chain.
Case 8: if ( )1 M S M Ge S Sy f f yi c i f− + − − > + , for any x, 3x A< can be satisfied, and we can get
( ) 0| 0zF z =′ > and ( ) 1| 0zF z =′ < , so 1z = is the ESS.
Case 9: if ( )0 1 M S M Ge S Sy f f yi c i f< − + − − < + , there are two scenarios.
(1) when 3x A> , ( ) 0| 0zF z =′ < and ( ) 1| 0zF z =′ > , so 0z = is the ESS;
(2) when 3x A< , ( ) 0| 0zF z =′ > and ( ) 1| 0zF z =′ < , so 1z = is the ESS.
Figure 3 demonstrates the dynamic evolutionary path and stability of the governments, where
1M S Ge
GM M
f i cyf i− −
=+
and 2M S Ge
GM M
f f cyf i+ −
=+
.
(a) 1Gy y< , 2Gy y> (b) 1 2G Gy y y< <
Figure 3. Evolutionary path of governments’ strategy. Figure 3. Evolutionary path of governments’ strategy.
Figure 3a illustrates two cases of the governments’ strategy. When y < yG1, the governments’strategy is supervision; when y > yG2, they will not supervise the supply chains. It means that if theproportion of green manufacturers in its population is lower than yG1, the governments will supervisethe supply chains and implement a reward and punishment mechanism to improve the number ofgreen manufacturers. If the proportion is high enough (y > yG2), it is unnecessary to be regulated.
When yG1 < y < yG2, as depicted in Figure 3b, the strategy of governments is related to both thesuppliers’ and manufacturers’ actions. If x > [(1− y) fM + fS − yiM − cGe]/(iS + fS), the governmentswill not regulate the supply chains; if x < [(1− y) fM + fS − yiM − cGe]/(iS + fS), governmentalsupervision should be implemented. Combined with Figure 3a, we see that when the proportion ofsuppliers or manufacturers taking green actions is high (x > [(1− y) fM + fS − yiM − cGe]/(iS + fS) ory > yG2), they are not needed to be supervised, but if most suppliers and manufacturers do not adopt agreen strategy, the governments should choose a supervision strategy and implement a reward andpunishment mechanism.
4.4. ESS Analysis for ParticipantsBy combining the replicator dynamic equations of suppliers, manufacturers and governments, we
can obtain the replicator dynamic system:F(x) = dx
dt = x(1− x)[wg −wn + cn − cg + rS + z(iS + fS)
]F(y) = dy
dt = y(1− y)[x(pgg − pgn − cgg + cgn
)+ (1− x)
(png − pnn − cng + cnn
)+ rM +z(iM + fM)]
F(z) = dzdt = z(1− z)[−xiS − cGe − yiM + (1− y) fM + (1− x) fS]
(15)

Energies 2020, 13, 620 13 of 25
According to the above dynamic system, the equilibrium points of this game are deduced.
Proposition 1. The equilibrium points of the game are E1(0, 0, 0), E2(0, 0, 1), E3(0, 1, 0), E4(0, 1, 1), E5(1, 0, 0),E6(1, 0, 1), E7(1, 1, 0), E8(1, 1, 1) and E9(x∗, y∗, z∗). x∗, y∗ and z∗ meet with
x∗ =(iS + fS)(∆p2 − ∆c2 + rM) + (iM + fM)(∆c− ∆w− rS)
(iS + fS)(∆p2 − ∆p1 + ∆c1 − ∆c2)(16)
y∗ =1
iM + fM
[(iS + fS)(∆p2 − ∆c2 + rM) + (iM + fM)(∆c− ∆w− rS)
∆p1 − ∆p2 + ∆c2 − ∆c1+ fS + fM − cGe
](17)
z∗ =∆c− ∆w− rS
iS + fS(18)
Proof. See Appendix C. �
The equilibrium points obtained by the replicator dynamic system are not necessarily the ESS.According to Friedman [48] and Mahmoudi [35], the stability of the equilibrium points can be analyzedusing the Jacobian matrix. The Jacobian matrix of the game is:
J =
∂F(x)/∂x ∂F(x)/∂y ∂F(x)/∂z∂F(y)/∂x ∂F(y)/∂y ∂F(y)/∂z∂F(z)/∂x ∂F(z)/∂y ∂F(z)/∂z
=
a11 a12 a13
a21 a22 a23
a31 a32 a33
(19)
where a11 = (1− 2x)[∆w− ∆c + rS + z(iS + fS)], a12 = 0, a13 = x(1− x)(iS + fS),a21 = y(1− y)(∆p1 − ∆p2 − ∆c1 + ∆c2), a22 = (1− 2y)[x(∆p1 − ∆c1) + (1− x)(∆p2 − ∆c2) + rM +
z(iM + fM)],a23 = y(1− y)(iM + fM), a31 = −z(1− z)(iS + fS), a32 = −z(1− z)(iM + fM), anda33 = (1− 2z)[−xiS − cGe − yiM + (1− y) fM + (1− x) fS].
The det J and tr J of the fixed strategies are shown in Table 4. When the equilibrium point satisfiesthe conditions det J > 0 and tr J < 0, the equilibrium point is an ESS. But as presented in Table 4, due tothe complexity of the values, there is no evidence to directly determine whether these equilibriumpoints are greater or less than zero. We then use SD to analyze the stability of each equilibrium point.
Table 4. The det J and tr J of eight strategies.
Strategy det J tr J
E1(0, 0, 0) (∆w− ∆c + rS)(∆p2 − ∆c2 + rM)( fM + fS − cGe) ∆w− ∆c + rS + ∆p2 − ∆c2 + rM + fM + fS − cGeE2(0, 0, 1) (∆w− ∆c + rS + iS + fS)(∆p2 − ∆c2 + rM + iM + fM)(cGe − fM − fS) ∆w− ∆c + rS + iS + ∆p2 − ∆c2 + rM + iM + cGeE3(0, 1, 0) (∆w− ∆c + rS)(∆c2 − ∆p2 − rM)( fS − cGe − iM) ∆w− ∆c + rS + ∆c2 − ∆p2 − rM + fS − cGe − iME4(0, 1, 1) (∆w− ∆cs + rS + iS + fS)(∆c2 − ∆p2 − rM − iM − fM)(cGe + iM − fS) ∆w− ∆c + rS + iS + ∆c2 − ∆p2 − rM − fM + cGeE5(1, 0, 0) (∆c− ∆w− rS)(∆p2 − ∆c1 + rM)( fM − iS − cGe) ∆c− ∆w− rS + ∆p2 − ∆c1 + rM + fM − iS − cGeE6(1, 0, 1) (∆c− ∆w− rS − iS − fS)(∆p1 − ∆c1 + rM + iM + fM)(iS + cGe − fM) ∆c− ∆w− rS − fS + ∆p1 − ∆c1 + rM + iM + cGeE7(1, 1, 0) (∆c− ∆w− rS)(∆c1 − ∆p1 − rM)(−iS − cGe − iM) ∆c− ∆w− rS + ∆c1 − ∆p1 − rM − iS − cGe − iME8(1, 1, 1) (∆c− ∆w− rS − iS − fS)(∆c1 − ∆p1 − rM − iM − fM)(iS + cGe + iM) ∆c− ∆w− rS − fS + ∆c1 − ∆p1 − rM − fM + cGe
5. Numerical Simulation
5.1. Simulation Model Construction Based on SYSTEM Dynamics (SD)
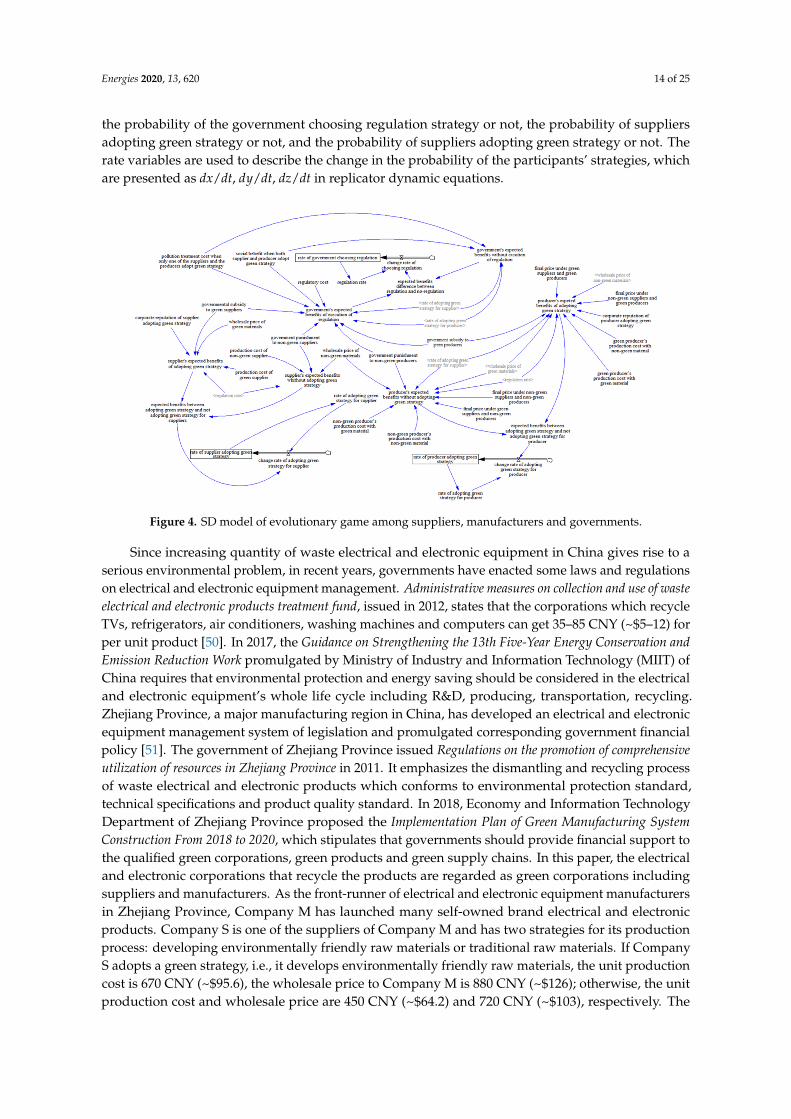
In the multi-player game, the individuals constantly imitate and learn from other individuals byobserving and comparing their payoffs with others and then adjusting their strategy selection, whichconstitutes the feedback behavior in the group. Therefore, based on above evolutionary game model,we establish a system dynamic model of the suppliers, manufacturers and governments by VensimPLE 5.6a to analyze the participants’ dynamic behavior trends and their long-term game relationships,which is shown in Figure 4. The SD model consists of three level variables, three rate variables, twelveintermediate variables and twenty external variables. The three level variables are used to indicate
Energies 2020, 13, 620 14 of 25
the probability of the government choosing regulation strategy or not, the probability of suppliersadopting green strategy or not, and the probability of suppliers adopting green strategy or not. Therate variables are used to describe the change in the probability of the participants’ strategies, whichare presented as dx/dt, dy/dt, dz/dt in replicator dynamic equations.
Energies 2020, 13, x FOR PEER REVIEW 15 of 26
Figure 4. SD model of evolutionary game among suppliers, manufacturers and governments.
Since increasing quantity of waste electrical and electronic equipment in China gives rise to a serious environmental problem, in recent years, governments have enacted some laws and regulations on electrical and electronic equipment management. Administrative measures on collection and use of waste electrical and electronic products treatment fund, issued in 2012, states that the corporations which recycle TVs, refrigerators, air conditioners, washing machines and computers can get 35–85 CNY (~$5–12) for per unit product [50]. In 2017, the Guidance on Strengthening the 13th Five-Year Energy Conservation and Emission Reduction Work promulgated by Ministry of Industry and Information Technology (MIIT) of China requires that environmental protection and energy saving should be considered in the electrical and electronic equipment’s whole life cycle including R&D, producing, transportation, recycling. Zhejiang Province, a major manufacturing region in China, has developed an electrical and electronic equipment management system of legislation and promulgated corresponding government financial policy [51]. The government of Zhejiang Province issued Regulations on the promotion of comprehensive utilization of resources in Zhejiang Province in 2011. It emphasizes the dismantling and recycling process of waste electrical and electronic products which conforms to environmental protection standard, technical specifications and product quality standard. In 2018, Economy and Information Technology Department of Zhejiang Province proposed the Implementation Plan of Green Manufacturing System Construction From 2018 to 2020, which stipulates that governments should provide financial support to the qualified green corporations, green products and green supply chains. In this paper, the electrical and electronic corporations that recycle the products are regarded as green corporations including suppliers and manufacturers. As the front-runner of electrical and electronic equipment manufacturers in Zhejiang Province, Company M has launched many self-owned brand electrical and electronic products. Company S is one of the suppliers of Company M and has two strategies for its production process: developing environmentally friendly raw materials or traditional raw materials. If Company S adopts a green strategy, i.e., it develops environmentally friendly raw materials, the unit production cost is 670 CNY (~$95.6), the wholesale price to Company M is 880 CNY (~$126); otherwise, the unit production cost and wholesale price are 450 CNY (~$64.2) and 720 CNY (~$103), respectively. The production cost and final price for Company M are related to the green-degree of the products, which are shown in four scenarios.
i. Suppose Company M implements recycling activity and procures environmentally friendly materials from Company S, the unit production cost is 700 CNY (~$99.9) and the final price is 2,350 CNY (~$335);
Figure 4. SD model of evolutionary game among suppliers, manufacturers and governments.
Since increasing quantity of waste electrical and electronic equipment in China gives rise to aserious environmental problem, in recent years, governments have enacted some laws and regulationson electrical and electronic equipment management. Administrative measures on collection and use of wasteelectrical and electronic products treatment fund, issued in 2012, states that the corporations which recycleTVs, refrigerators, air conditioners, washing machines and computers can get 35–85 CNY (~$5–12) forper unit product [50]. In 2017, the Guidance on Strengthening the 13th Five-Year Energy Conservation andEmission Reduction Work promulgated by Ministry of Industry and Information Technology (MIIT) ofChina requires that environmental protection and energy saving should be considered in the electricaland electronic equipment’s whole life cycle including R&D, producing, transportation, recycling.Zhejiang Province, a major manufacturing region in China, has developed an electrical and electronicequipment management system of legislation and promulgated corresponding government financialpolicy [51]. The government of Zhejiang Province issued Regulations on the promotion of comprehensiveutilization of resources in Zhejiang Province in 2011. It emphasizes the dismantling and recycling processof waste electrical and electronic products which conforms to environmental protection standard,technical specifications and product quality standard. In 2018, Economy and Information TechnologyDepartment of Zhejiang Province proposed the Implementation Plan of Green Manufacturing SystemConstruction From 2018 to 2020, which stipulates that governments should provide financial support tothe qualified green corporations, green products and green supply chains. In this paper, the electricaland electronic corporations that recycle the products are regarded as green corporations includingsuppliers and manufacturers. As the front-runner of electrical and electronic equipment manufacturersin Zhejiang Province, Company M has launched many self-owned brand electrical and electronicproducts. Company S is one of the suppliers of Company M and has two strategies for its productionprocess: developing environmentally friendly raw materials or traditional raw materials. If CompanyS adopts a green strategy, i.e., it develops environmentally friendly raw materials, the unit productioncost is 670 CNY (~$95.6), the wholesale price to Company M is 880 CNY (~$126); otherwise, the unitproduction cost and wholesale price are 450 CNY (~$64.2) and 720 CNY (~$103), respectively. The
Energies 2020, 13, 620 15 of 25
production cost and final price for Company M are related to the green-degree of the products, whichare shown in four scenarios.
i. Suppose Company M implements recycling activity and procures environmentally friendlymaterials from Company S, the unit production cost is 700 CNY (~$99.9) and the final price is2350 CNY (~$335);
ii. If Company M does not consider green activity or procures non-green materials, the unitproduction cost and final price are 660 CNY (~$94.1) and 2190 CNY (~$313), respectively;
iii. If Company M implements recycling activity but Company S offers non-green materials, the unitproduction cost and final price are 780 CNY (~$111) and 2280 CNY (~$325), respectively;
iv. If Company M purchases environmentally friendly materials but does not embrace recyclingstrategy, it would spend 500 CNY (~$71.3) for unit production and selling at 2280 CNY (~$325).
Besides, green activity could improve corporations’ reputations that are qualified as 20 CNY(~$2.85). It costs 15 CNY (~$2.14) for the government to supervise Company S and Company M onper unit product. The waste electrical and electronic products are disposed by the government andif Company S does not produce green materials or Company M does not recycle used products, thegovernment tends to pay 50 CNY (~$7.13) per unit. The two companies can receive 50 CNY (~$7.13)per unit incentives for green production action, or the same amount of punishment is gotten fornon-green production.
So the parameters are as follows: wg = 880, wn = 720, cn = 450, cg = 670, cgg = 700, cng = 780,cgn = 500, cnn = 660, pgg = 2350, png = 2280, pgn = 2280, pnn = 2190, rS = 20, rM = 20, iS = iM = 50,fS = fM = 50, cGe = 15, cGd = 50.
5.2. Equilibrium Stability Analysis
(1) Equilibrium stability analysis of pure strategies
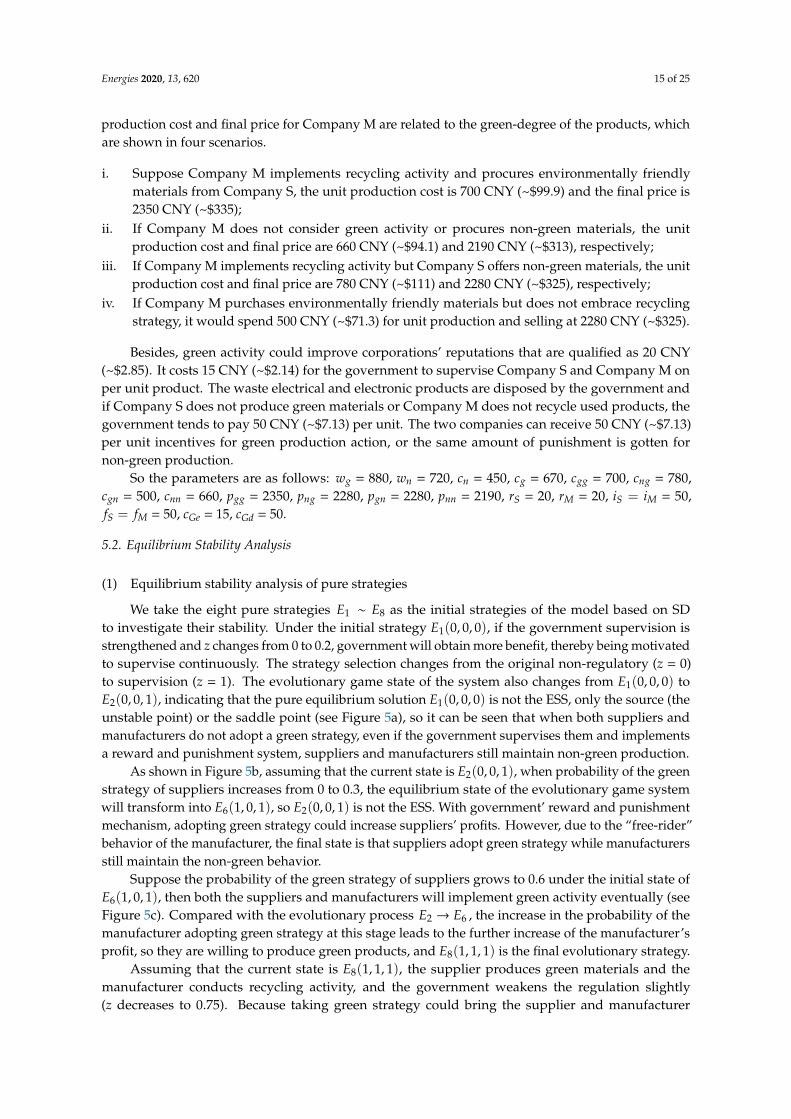
We take the eight pure strategies E1 ∼ E8 as the initial strategies of the model based on SDto investigate their stability. Under the initial strategy E1(0, 0, 0), if the government supervision isstrengthened and z changes from 0 to 0.2, government will obtain more benefit, thereby being motivatedto supervise continuously. The strategy selection changes from the original non-regulatory (z = 0)to supervision (z = 1). The evolutionary game state of the system also changes from E1(0, 0, 0) toE2(0, 0, 1), indicating that the pure equilibrium solution E1(0, 0, 0) is not the ESS, only the source (theunstable point) or the saddle point (see Figure 5a), so it can be seen that when both suppliers andmanufacturers do not adopt a green strategy, even if the government supervises them and implementsa reward and punishment system, suppliers and manufacturers still maintain non-green production.
As shown in Figure 5b, assuming that the current state is E2(0, 0, 1), when probability of the greenstrategy of suppliers increases from 0 to 0.3, the equilibrium state of the evolutionary game systemwill transform into E6(1, 0, 1), so E2(0, 0, 1) is not the ESS. With government’ reward and punishmentmechanism, adopting green strategy could increase suppliers’ profits. However, due to the “free-rider”behavior of the manufacturer, the final state is that suppliers adopt green strategy while manufacturersstill maintain the non-green behavior.
Suppose the probability of the green strategy of suppliers grows to 0.6 under the initial state ofE6(1, 0, 1), then both the suppliers and manufacturers will implement green activity eventually (seeFigure 5c). Compared with the evolutionary process E2 → E6 , the increase in the probability of themanufacturer adopting green strategy at this stage leads to the further increase of the manufacturer’sprofit, so they are willing to produce green products, and E8(1, 1, 1) is the final evolutionary strategy.
Assuming that the current state is E8(1, 1, 1), the supplier produces green materials and themanufacturer conducts recycling activity, and the government weakens the regulation slightly(z decreases to 0.75). Because taking green strategy could bring the supplier and manufacturer
Energies 2020, 13, 620 16 of 25
more profit, their strategy is not affected by the probability of government’s supervision when theyinitially implement green activity (see Figure 5d).
Under the initial strategy E7(1, 1, 0), if either the supplier or manufacturer reduces the probability ofgreen behavior, the final equilibrium strategy after long-term evolutionary game process is E3(0, 1, 0) andE5(1, 0, 0), respectively. Similarly, E3(0, 1, 0), E4(0, 1, 1) and E5(1, 0, 0) are not ESS for the evolutionarystate will be changed when the strategy of one party changes.
Energies 2020, 13, x FOR PEER REVIEW 17 of 26
process is ( )3 0,1,0E and ( )5 1,0,0E , respectively. Similarly, ( )3 0,1,0E , ( )4 0,1,1E and ( )5 1,0,0E are not ESS for the evolutionary state will be changed when the strategy of one party changes.
(a) Evolution process under (0,0,0.2) (b) Evolution process under (0.3,0,1)
(c) Evolution process under (1,0.6,1) (d) Evolution process under (1,1,0.75)
Figure 5. Evolutionary game process of one population’s mutation when initial state is pure strategies.
(2) Equilibrium stability analysis of mixed strategy
By substituting the parameter values in Section 5.1 to Equations (16)–(18), we obtain9 =(0.8,0.05,0.4)E . Considering the 9 (0.8,0.05,0.4)E as the initial state, we observe the influence of
the strategy change on the evolutionary process. When the initial state is 9 (0.8,0.05,0.4)E , the evolutionary process is illustrated in Figure 6a. The
probability values of green strategies for the supplier and manufacturer as well as government regulation fluctuate over time, and the fluctuation ranges of manufacturer’s and government’s probability decrease with time. If the probability of the manufacturer’s green behavior increases from 0.05 to 0.2, the supplier tends to be stable after a period of fluctuation, but the probabilities of the manufacturer’s green behavior and the government’s regulatory still fluctuate with time (see Figure 6b). If the probability of the supplier reduces to 0.2, with the process of long-term continuous gaming, the supplier tends to take non-green action after short-term fluctuations, while the probability of the manufacturer and the government tends to fluctuate with stable amplitude (see Figure 6c). Figure 6d shows the evolutionary process when the probability of government regulation increases to 0.8, of which the trend is similar with Figure 6a.
Thus 9 (0.8,0.05,0.4)E is not a stable equilibrium point because the groups’ strategies constantly fluctuate with time. Increase in the proportion of green manufacturers will cause the supplier group to keep non-green production and volatility in green supplier proportion will be greater with the probability of government’s regulation increases. For the manufacturers, when the initial probability of their taking green actions is not high, increasing green supplier proportion promotes manufacturers to adopt green strategy, while the increase in the probability of government regulation cannot stimulate them to be greener.
Figure 5. Evolutionary game process of one population’s mutation when initial state is pure strategies.
(2) Equilibrium stability analysis of mixed strategy
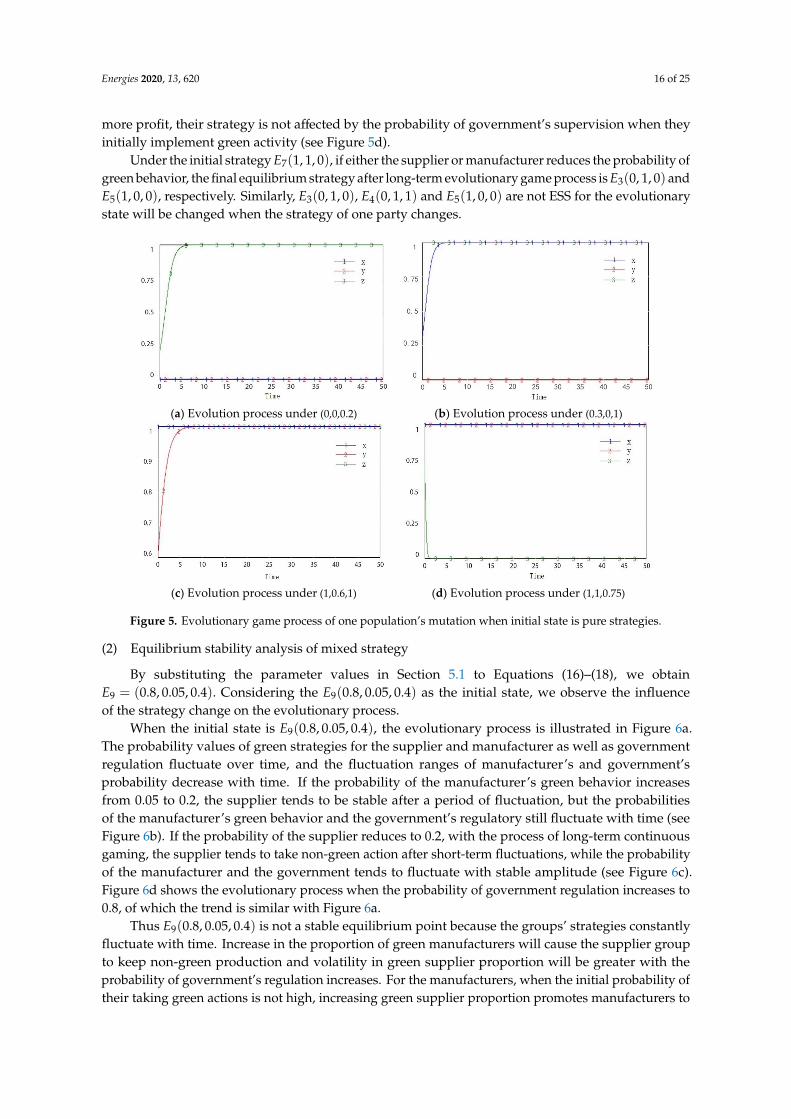
By substituting the parameter values in Section 5.1 to Equations (16)–(18), we obtainE9 = (0.8, 0.05, 0.4). Considering the E9(0.8, 0.05, 0.4) as the initial state, we observe the influenceof the strategy change on the evolutionary process.
When the initial state is E9(0.8, 0.05, 0.4), the evolutionary process is illustrated in Figure 6a.The probability values of green strategies for the supplier and manufacturer as well as governmentregulation fluctuate over time, and the fluctuation ranges of manufacturer’s and government’sprobability decrease with time. If the probability of the manufacturer’s green behavior increasesfrom 0.05 to 0.2, the supplier tends to be stable after a period of fluctuation, but the probabilitiesof the manufacturer’s green behavior and the government’s regulatory still fluctuate with time (seeFigure 6b). If the probability of the supplier reduces to 0.2, with the process of long-term continuousgaming, the supplier tends to take non-green action after short-term fluctuations, while the probabilityof the manufacturer and the government tends to fluctuate with stable amplitude (see Figure 6c).Figure 6d shows the evolutionary process when the probability of government regulation increases to0.8, of which the trend is similar with Figure 6a.
Thus E9(0.8, 0.05, 0.4) is not a stable equilibrium point because the groups’ strategies constantlyfluctuate with time. Increase in the proportion of green manufacturers will cause the supplier groupto keep non-green production and volatility in green supplier proportion will be greater with theprobability of government’s regulation increases. For the manufacturers, when the initial probability oftheir taking green actions is not high, increasing green supplier proportion promotes manufacturers to

Energies 2020, 13, 620 17 of 25
adopt green strategy, while the increase in the probability of government regulation cannot stimulatethem to be greener.Energies 2020, 13, x FOR PEER REVIEW 18 of 26
(a) Evolution process under E9 (0.8,0.05,0.4) (b) Evolution process under (0.8,0.2,0.4)
(c) Evolution process under (0.2,0.05,0.4) (d) Evolution process under (0.8,0.05,0.8)
Figure 6. Evolutionary game process of one population’s mutation when initial state is mixed strategies.
5.3. Sensitivity Analysis
In this section, a set of sensitivity analysis is conducted to further clarify the impact of key parameters on the evolutionary process. The parameter setting is consistent with Section 5.1.
(1) Effect of initial strategy on game equilibrium
As can be seen from Equation (10), the evolutionary process of the suppliers is related to their initial state and government regulatory probability, so we firstly analyze the initial probabilities of suppliers implementing green activities and government’s regulation on game equilibrium of supplier group. Let the probability value of the government’s regulatory strategy be 0.6, and the impact of different initial values 0x on x can be observed in Figure 7a. As the value of 0x increases, that is, more green suppliers are in the group at the beginning of the evolutionary game, the likelihood and speed of the evolution of supplier groups toward adopting green strategies enhance. Suppose the initial probability value of the government’s regulatory strategy 0z ranges from 0.1 to
0.9, and Figure 7b elaborates the supplier’s strategy x under different values of 0z . If 0 0.5z < , the supplier group finally choose not to adopt green behavior and the evolution speed to greening strategy slows down with the increase of the value; if 0 0.5z = , the supplier group also maintains a probability value of 0.5; in order to promote suppliers to take green production measures, the government should strengthen supervision, i.e., if 0 0.5z > , all suppliers will adopt green strategies
and the evolution rate increases with the increase of value 0z .
Figures 7c–e depict the effects of the initial green strategy likelihood of manufacturers 0y and
the probability of suppliers 0x as well as initial probability of regulation 0z on the manufacturer’s green behavior y, respectively. As shown in Figure 7c, for any initial probability of manufacturers themselves taking green behavior, the manufacturer group tends to choose not to take green actions, and with the increase of 0y , the evolutionary speed toward non-green actions slows down. Suppose
Figure 6. Evolutionary game process of one population’s mutation when initial state is mixed strategies.
5.3. Sensitivity AnalysisIn this section, a set of sensitivity analysis is conducted to further clarify the impact of key
parameters on the evolutionary process. The parameter setting is consistent with Section 5.1.
(1) Effect of initial strategy on game equilibrium
As can be seen from Equation (10), the evolutionary process of the suppliers is related to theirinitial state and government regulatory probability, so we firstly analyze the initial probabilities ofsuppliers implementing green activities and government’s regulation on game equilibrium of suppliergroup. Let the probability value of the government’s regulatory strategy be 0.6, and the impact ofdifferent initial values x0 on x can be observed in Figure 7a. As the value of x0 increases, that is, moregreen suppliers are in the group at the beginning of the evolutionary game, the likelihood and speedof the evolution of supplier groups toward adopting green strategies enhance. Suppose the initialprobability value of the government’s regulatory strategy z0 ranges from 0.1 to 0.9, and Figure 7belaborates the supplier’s strategy x under different values of z0. If z0 < 0.5, the supplier group finallychoose not to adopt green behavior and the evolution speed to greening strategy slows down withthe increase of the value; if z0 = 0.5, the supplier group also maintains a probability value of 0.5; inorder to promote suppliers to take green production measures, the government should strengthensupervision, i.e., if z0 > 0.5, all suppliers will adopt green strategies and the evolution rate increaseswith the increase of value z0.
Figure 7c–e depict the effects of the initial green strategy likelihood of manufacturers y0 and theprobability of suppliers x0 as well as initial probability of regulation z0 on the manufacturer’s greenbehavior y, respectively. As shown in Figure 7c, for any initial probability of manufacturers themselvestaking green behavior, the manufacturer group tends to choose not to take green actions, and withthe increase of y0, the evolutionary speed toward non-green actions slows down. Suppose y0 = 0.7,the proportion of manufacturers who adopt green strategy changes with the values of x0 and z0 (see

Energies 2020, 13, 620 18 of 25
Figure 7d). If x0 ≥ 0.85, the manufacturer group gradually take green actions, and the evolution togreen strategy accelerates with x0 increases; if x0 ≤ 0.75, non-green strategy is all the manufacturers’choice. The influence of z0 on the evolutionary process of the manufacturer is similar with that on thesupplier, shown in Figure 7e. High probability of government regulation stimulates manufacturers toadopt green strategies.
For the government, according to Equation (12), their evolutionary process is related to x0, y0 andz0. When x0 = y0 = 0.5, no government will adopt regulatory strategy no matter what their initialstate is and the change rate gets smaller as z0 increases (see Figure 7f). The values of x0 and y0 have thesame influence on government decision. If x0 = y0 ≤ 0.25, regulatory strategy will be adopted by allgovernments. If x0 = y0 ≥ 0.8, that is, the proportions of green suppliers and manufacturers in theirgroup are high, the government do not need to supervise them, as presented in Figure 7g,h.
From the above simulation analysis, it is clear that increasing the initial probability of governmentsupervision, namely, the reward and punishment regulation is strengthened, could promote suppliersand manufacturers to carry out green production, and the stronger the supervision, the faster the twogroups adopt green behaviors. In addition, suppliers’ green activity would improve the willingnessof adopting green strategy for manufacturers. Low probability of suppliers and manufacturersadopting green strategy will provoke governments to execute supervision and implement reward andpunishment mechanism.
Energies 2020, 13, x FOR PEER REVIEW 19 of 26
0=0.7y , the proportion of manufacturers who adopt green strategy changes with the values of 0x and
0z (see Figure 7d). If 0 0.85x ≥ , the manufacturer group gradually take green actions, and the
evolution to green strategy accelerates with 0x increases; if 0 0.75x ≤ , non-green strategy is all the
manufacturers’ choice. The influence of 0z on the evolutionary process of the manufacturer is similar with that on the supplier, shown in Figure 7e. High probability of government regulation stimulates manufacturers to adopt green strategies.
For the government, according to Equation (12), their evolutionary process is related to 0x , 0y
and 0z . When 0 0 0.5x y= = , no government will adopt regulatory strategy no matter what their
initial state is and the change rate gets smaller as 0z increases (see Figure 7f). The values of 0x and
0y have the same influence on government decision. If 0 0 0.25x y= ≤ , regulatory strategy will be
adopted by all governments. If 0 0 0.8x y= ≥ , that is, the proportions of green suppliers and manufacturers in their group are high, the government do not need to supervise them, as presented in Figure 7g–h.
From the above simulation analysis, it is clear that increasing the initial probability of government supervision, namely, the reward and punishment regulation is strengthened, could promote suppliers and manufacturers to carry out green production, and the stronger the supervision, the faster the two groups adopt green behaviors. In addition, suppliers’ green activity would improve the willingness of adopting green strategy for manufacturers. Low probability of suppliers and manufacturers adopting green strategy will provoke governments to execute supervision and implement reward and punishment mechanism.
(a) Effect of x0 on x ( 0 0.6z = ) (b) Effect of z0 on x
(c) Effect of y0 on y ( 0 =0.8x , 0 0.6z = ) (d) Effect of x0 on y
Figure 7. Cont.

Energies 2020, 13, 620 19 of 25Energies 2020, 13, x FOR PEER REVIEW 20 of 26
(e) Effect of z0 on y (f) Effect of z0 on z ( 0 =0.5x , 0 0.5y = )
(g) Effect of x0 on z (h) Effect of y0 on z
Figure 7. Effect of initial probability on the evolution process of suppliers, manufacturers and governments.
(2) Effect of reward and punishment mechanism on game equilibrium
Considering the influence of different degree of government’s reward and punishments on the strategies of suppliers and manufacturers, we set high level of reward to suppliers and manufacturers as 50S Mi i= = , high level of punishment as 50S Mf f= = , low level of reward as 20S Mi i= = and low level of punishment as 20S Mf f= = . According to the replicator dynamic Equations (10) and
(11), we see that the reward and penalty values have the same role in the evolution of the enterprise groups, so the influence of incentives and penalties are reflected in the same figure.
Figure 8a demonstrates the evolutionary game process of suppliers under different reward and punishment regulations. When incentives and penalties are relatively low ( 20S Si f= = ), suppliers will not implement green production no matter what the initial probability of them adopting green strategy is. With higher initial probability, the evolution to 0x= is faster. When incentives and penalties are relatively high ( 50S Si f= = ), in contrast, regardless of the probability of suppliers’ initial choice, the group will eventually evolve toward green behavior, and the higher the initial probability is, the faster the evolution to 1x = becomes.
Figure 7. Effect of initial probability on the evolution process of suppliers, manufacturersand governments.
(2) Effect of reward and punishment mechanism on game equilibrium
Considering the influence of different degree of government’s reward and punishments on thestrategies of suppliers and manufacturers, we set high level of reward to suppliers and manufacturersas iS = iM = 50, high level of punishment as f S = f M = 50, low level of reward as iS = iM = 20 andlow level of punishment as f
S= f
M= 20. According to the replicator dynamic Equations (10) and
(11), we see that the reward and penalty values have the same role in the evolution of the enterprisegroups, so the influence of incentives and penalties are reflected in the same figure.
Figure 8a demonstrates the evolutionary game process of suppliers under different reward andpunishment regulations. When incentives and penalties are relatively low (iS = fS = 20), suppliers willnot implement green production no matter what the initial probability of them adopting green strategyis. With higher initial probability, the evolution to x = 0 is faster. When incentives and penalties arerelatively high (iS = fS = 50), in contrast, regardless of the probability of suppliers’ initial choice, thegroup will eventually evolve toward green behavior, and the higher the initial probability is, the fasterthe evolution to x = 1 becomes.
The simulation results show that Figure 8b has evolutionary characteristics similar to those ofFigure 8a, with the same management implications. A high level of incentives to green activity andpenalties to non-green activity provided by governments could enhance the enthusiasm for adoptinggreen strategy for suppliers and manufacturers, and the higher the initial willingness of enterprises togreen production, the greater the incentive effect is.

Energies 2020, 13, 620 20 of 25
Energies 2020, 13, x FOR PEER REVIEW 21 of 26
(e) Effect of z0 on y (f) Effect of z0 on z ( 0 =0.5x , 0 0.5y = )
(g) Effect of x0 on z (h) Effect of y0 on z
Figure 7. Effect of initial probability on the evolution process of suppliers, manufacturers and governments.
(2) Effect of reward and punishment mechanism on game equilibrium
Considering the influence of different degree of government’s reward and punishments on the strategies of suppliers and manufacturers, we set high level of reward to suppliers and manufacturers as 50S Mi i= = , high level of punishment as 50S Mf f= = , low level of reward as 20S Mi i= = and low level of punishment as 20S Mf f= = . According to the replicator dynamic Equations (10) and
(11), we see that the reward and penalty values have the same role in the evolution of the enterprise groups, so the influence of incentives and penalties are reflected in the same figure.
Figure 8a demonstrates the evolutionary game process of suppliers under different reward and punishment regulations. When incentives and penalties are relatively low ( 20S Si f= = ), suppliers will not implement green production no matter what the initial probability of them adopting green strategy is. With higher initial probability, the evolution to 0x= is faster. When incentives and penalties are relatively high ( 50S Si f= = ), in contrast, regardless of the probability of suppliers’ initial choice, the group will eventually evolve toward green behavior, and the higher the initial probability is, the faster the evolution to 1x = becomes.
(a) Effect of reward and punishment
regulation on x (b) Effect of reward and punishment regulation
on y
Figure 8. Effect of reward and punishment regulation on strategies of suppliers and manufacturers. Figure 8. Effect of reward and punishment regulation on strategies of suppliers and manufacturers.
6. Conclusions and Management Implications
In developing economies such as China, India and Brazil, green products are in their initialstage and enterprises are faced with challenges such as insufficient funds for research and immatureproduction technology. The increasing costs for enterprises due to adopt green behavior, includinggreen production technology development, new equipment introduction, utilization of clean energyand green raw materials, have greatly reduced the enthusiasm of enterprises for green production [52].On the other hand, an increasing number of consumers in China with environmental awareness arepursuing eco-friendly products, providing driving force for the green development of enterprises [53].At the same time, governments attach great importance to the sustainable development and haveimplemented a set of policies and regulations to promote green manufacturing, constantly strengtheningthe detection and supervision of the emission of enterprises and the greenness of products. This paperexplores the use of evolutionary game theory to describe the long-term dynamic process of game amongsuppliers, manufacturers and governments on green activities and regulation. We firstly investigateevolutionary path of individual group and find equilibrium strategies of the system. Furthermore, wetake a numerical example to analyze the interaction of participants’ strategies and the implementationeffects of initial probability and different reward and punishment strategies on game process and gameequilibrium. The main conclusions from this study are as follows:
(1) Suppliers’ strategy depends on production cost, reputation gained by green behavior and thegovernment’s reward and punishment mechanism. Manufacturers’ strategy is influenced byproduction cost, retail price, reputation gained by green behavior and government reward andpunishment mechanism. In particular, whether the cooperated supplier adopts green behavioraffects the manufacturer’s production cost and the price of the final product, so manufacturer’sstrategy is also related to supplier’s action. Reducing the cost of green raw materials (greenproduction cost), increasing consumer acceptance of green products, and strengthening therewards and punishments mechanism contribute to the evolution of suppliers and manufacturersto green behavior strategies.
(2) The government’s strategy is related to the degree of incentives and penalties, supervision cost,and the cost of pollution treatment. When a high proportion of suppliers or manufacturersadopt green strategy, governments do not need to supervise them. On the contrary, if mostof the suppliers or manufacturers maintain a non-green strategy, supervision and reward andpunishment mechanism should be applied.
(3) In the long-term game process, the strategies of suppliers, manufacturers and the governmentschange with the behavior of other groups. Under the condition that suppliers and manufacturers

Energies 2020, 13, 620 21 of 25
do not adopt green strategy and governments do not execute regulatory strategy, strengtheninggovernment’s regulation could promote suppliers to implement green production but themanufacturers will remain non-green as a free rider. If the suppliers adopt green strategy andthe government carry out regulation, raising the probability of green decision-making for thenon-green manufacturers leads to both the two enterprises groups finally take greening measures.Under this situation, reduction on the probability of regulatory behaviors will not affect theenterprises’ green behavior strategy.
(4) The strategies of suppliers, manufacturers, and governments are related to the initial probabilityof themselves and other groups. For suppliers, high initial probability of their adopting greenstrategy lead to high evolution speed to green behavior of all group when the probability value ofgovernment regulation behavior is a constant. When government’s regulation is strengthenedand a large number of suppliers implement green production, the manufacturers tend to keepnon-green behavior. Both the strategies of suppliers and manufacturers affect governments’evolutionary path and speed. Government’s regulation is taken when most suppliers andmanufacturers do not adopt green strategy, and strengthening incentives and penalties couldprovoke enterprises to take green actions.
Based on the above conclusions, we provide the following recommendations for governmentsand enterprises:
(1) Immature eco-friendly production technology and high production cost are the main factorsrestricting enterprises to implement green activities, thus the government should increase theinvestment in new technology research and development, cultivating innovative and technicalpersonnel, and providing subsidies for green enterprises.
(2) The strategies of the enterprises (suppliers and manufacturers) and governments cannot reachan stable evolutionary point. Therefore, governments should focus on production behavior ofenterprises and the development of green product market, so as to adjust existing mechanism toformulate the best possible reward and punishment regulation for suppliers and manufacturers toadopt green technology. More incentives should be provided for green enterprises and penaltiesshould be strengthened for non-green enterprises.
(3) When both the supplier and manufacturer in the supply chain are less likely to adopt greenstrategies, the government could first implement regulation on the manufacturer because thesupplier will also be greener if its cooperating manufacturer adopts a green strategy after along-term evolution process.
(4) Governments are supposed to distinguish the non-green enterprises that are to be supervised andguided to carry out green production, thereby enhancing the proportion of green suppliers andmanufacturers in their group. A high proportion of green enterprises contributes to acceleratingthe green product development.
(5) The probability of the government regulation will decrease with the increase of governmentalregulation cost, and vice versa. Therefore, the governments not only constantly improve theirregulatory capability to monitor the production activity of enterprises enough, but also graduallyreduce the supervision cost, and improve regulatory efficiency and effectiveness by formulating amore perfect information disclosure system and standardized enterprise green assessment system.
The paper expounds the long-term and dynamic interaction between government regulation andgreen behavior of supply chain enterprises and provides some recommendations on the formulationand improvement of environmental policy for governments. There also exists several limitations inour work: (1) Only one type of mechanism providing a fixed subsidy and punishment is considered,while in reality, the government can formulate various forms of reward and punishment. For instance,the government can construct different reward and punishment systems according to greenness ofproducts or carbon emissions; (2) The evolutionary game model construction is based on profit of unitproduct, without considering the quantity of products. For the future research, it is of more value in
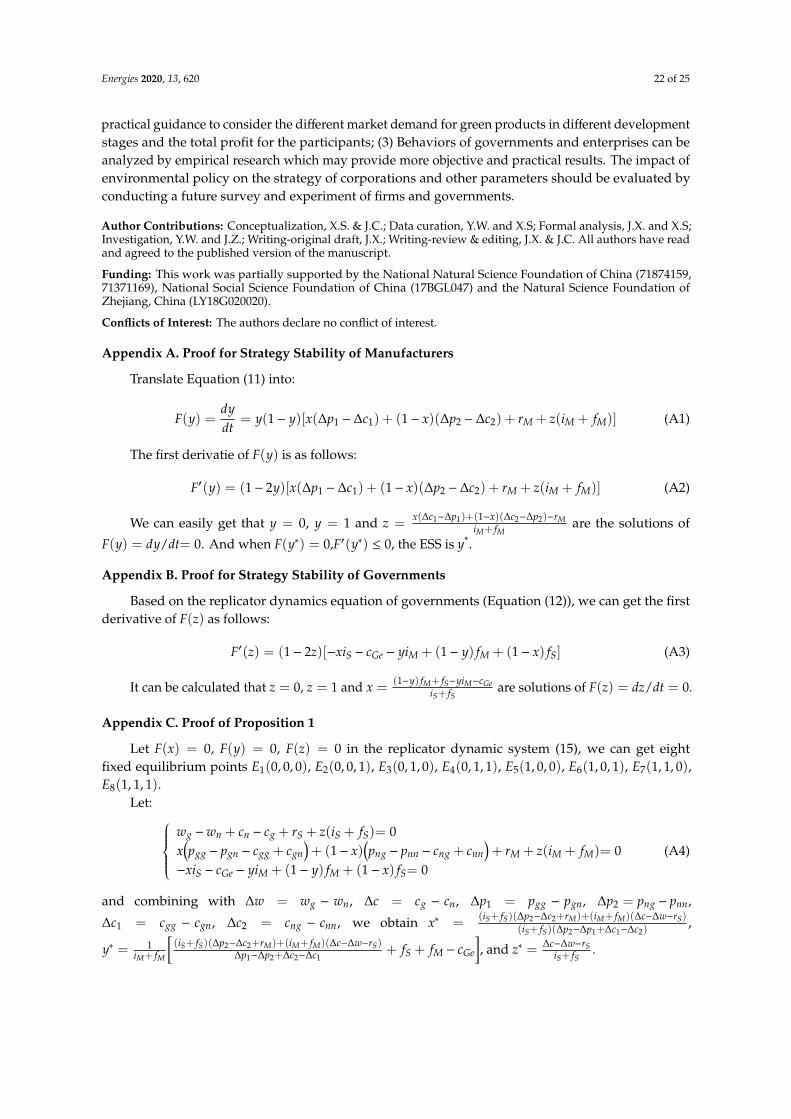
Energies 2020, 13, 620 22 of 25
practical guidance to consider the different market demand for green products in different developmentstages and the total profit for the participants; (3) Behaviors of governments and enterprises can beanalyzed by empirical research which may provide more objective and practical results. The impact ofenvironmental policy on the strategy of corporations and other parameters should be evaluated byconducting a future survey and experiment of firms and governments.
Author Contributions: Conceptualization, X.S. & J.C.; Data curation, Y.W. and X.S; Formal analysis, J.X. and X.S;Investigation, Y.W. and J.Z.; Writing-original draft, J.X.; Writing-review & editing, J.X. & J.C. All authors have readand agreed to the published version of the manuscript.
Funding: This work was partially supported by the National Natural Science Foundation of China (71874159,71371169), National Social Science Foundation of China (17BGL047) and the Natural Science Foundation ofZhejiang, China (LY18G020020).
Conflicts of Interest: The authors declare no conflict of interest.
Appendix A. Proof for Strategy Stability of Manufacturers
Translate Equation (11) into:
F(y) =dydt
= y(1− y)[x(∆p1 − ∆c1) + (1− x)(∆p2 − ∆c2) + rM + z(iM + fM)] (A1)
The first derivatie of F(y) is as follows:
F′(y) = (1− 2y)[x(∆p1 − ∆c1) + (1− x)(∆p2 − ∆c2) + rM + z(iM + fM)] (A2)
We can easily get that y = 0, y = 1 and z =x(∆c1−∆p1)+(1−x)(∆c2−∆p2)−rM
iM+ fMare the solutions of
F(y) = dy/dt= 0. And when F(y∗) = 0,F′(y∗) ≤ 0, the ESS is y*.
Appendix B. Proof for Strategy Stability of Governments
Based on the replicator dynamics equation of governments (Equation (12)), we can get the firstderivative of F(z) as follows:
F′(z) = (1− 2z)[−xiS − cGe − yiM + (1− y) fM + (1− x) fS] (A3)
It can be calculated that z = 0, z = 1 and x =(1−y) fM+ fS−yiM−cGe
iS+ fSare solutions of F(z) = dz/dt = 0.
Appendix C. Proof of Proposition 1
Let F(x) = 0, F(y) = 0, F(z) = 0 in the replicator dynamic system (15), we can get eightfixed equilibrium points E1(0, 0, 0), E2(0, 0, 1), E3(0, 1, 0), E4(0, 1, 1), E5(1, 0, 0), E6(1, 0, 1), E7(1, 1, 0),E8(1, 1, 1).
Let: wg −wn + cn − cg + rS + z(iS + fS)= 0x(pgg − pgn − cgg + cgn
)+ (1− x)
(png − pnn − cng + cnn
)+ rM + z(iM + fM)= 0
−xiS − cGe − yiM + (1− y) fM + (1− x) fS= 0(A4)
and combining with ∆w = wg − wn, ∆c = cg − cn, ∆p1 = pgg − pgn, ∆p2 = png − pnn,
∆c1 = cgg − cgn, ∆c2 = cng − cnn, we obtain x∗ =(iS+ fS)(∆p2−∆c2+rM)+(iM+ fM)(∆c−∆w−rS)
(iS+ fS)(∆p2−∆p1+∆c1−∆c2),
y∗ = 1iM+ fM
[(iS+ fS)(∆p2−∆c2+rM)+(iM+ fM)(∆c−∆w−rS)
∆p1−∆p2+∆c2−∆c1+ fS + fM − cGe
], and z∗ = ∆c−∆w−rS
iS+ fS.
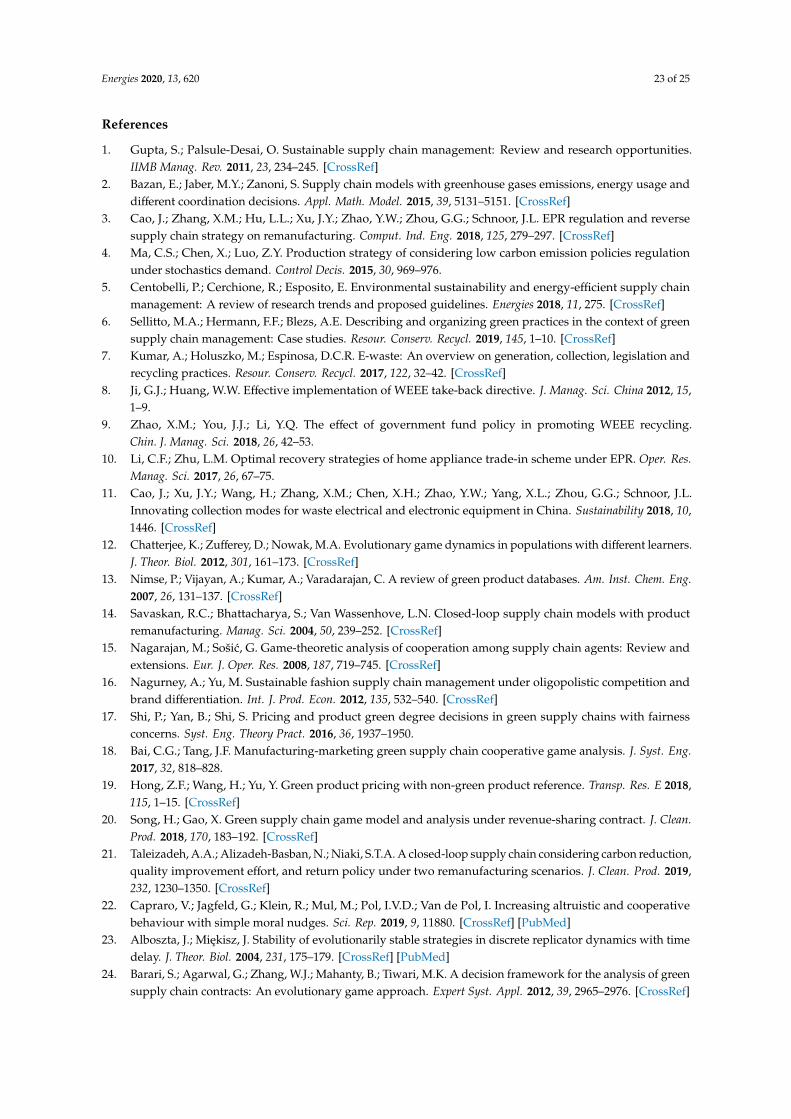
Energies 2020, 13, 620 23 of 25
References
1. Gupta, S.; Palsule-Desai, O. Sustainable supply chain management: Review and research opportunities.IIMB Manag. Rev. 2011, 23, 234–245. [CrossRef]
2. Bazan, E.; Jaber, M.Y.; Zanoni, S. Supply chain models with greenhouse gases emissions, energy usage anddifferent coordination decisions. Appl. Math. Model. 2015, 39, 5131–5151. [CrossRef]
3. Cao, J.; Zhang, X.M.; Hu, L.L.; Xu, J.Y.; Zhao, Y.W.; Zhou, G.G.; Schnoor, J.L. EPR regulation and reversesupply chain strategy on remanufacturing. Comput. Ind. Eng. 2018, 125, 279–297. [CrossRef]
4. Ma, C.S.; Chen, X.; Luo, Z.Y. Production strategy of considering low carbon emission policies regulationunder stochastics demand. Control Decis. 2015, 30, 969–976.
5. Centobelli, P.; Cerchione, R.; Esposito, E. Environmental sustainability and energy-efficient supply chainmanagement: A review of research trends and proposed guidelines. Energies 2018, 11, 275. [CrossRef]
6. Sellitto, M.A.; Hermann, F.F.; Blezs, A.E. Describing and organizing green practices in the context of greensupply chain management: Case studies. Resour. Conserv. Recycl. 2019, 145, 1–10. [CrossRef]
7. Kumar, A.; Holuszko, M.; Espinosa, D.C.R. E-waste: An overview on generation, collection, legislation andrecycling practices. Resour. Conserv. Recycl. 2017, 122, 32–42. [CrossRef]
8. Ji, G.J.; Huang, W.W. Effective implementation of WEEE take-back directive. J. Manag. Sci. China 2012, 15,1–9.
9. Zhao, X.M.; You, J.J.; Li, Y.Q. The effect of government fund policy in promoting WEEE recycling.Chin. J. Manag. Sci. 2018, 26, 42–53.
10. Li, C.F.; Zhu, L.M. Optimal recovery strategies of home appliance trade-in scheme under EPR. Oper. Res.Manag. Sci. 2017, 26, 67–75.
11. Cao, J.; Xu, J.Y.; Wang, H.; Zhang, X.M.; Chen, X.H.; Zhao, Y.W.; Yang, X.L.; Zhou, G.G.; Schnoor, J.L.Innovating collection modes for waste electrical and electronic equipment in China. Sustainability 2018, 10,1446. [CrossRef]
12. Chatterjee, K.; Zufferey, D.; Nowak, M.A. Evolutionary game dynamics in populations with different learners.J. Theor. Biol. 2012, 301, 161–173. [CrossRef]
13. Nimse, P.; Vijayan, A.; Kumar, A.; Varadarajan, C. A review of green product databases. Am. Inst. Chem. Eng.2007, 26, 131–137. [CrossRef]
14. Savaskan, R.C.; Bhattacharya, S.; Van Wassenhove, L.N. Closed-loop supply chain models with productremanufacturing. Manag. Sci. 2004, 50, 239–252. [CrossRef]
15. Nagarajan, M.; Sošic, G. Game-theoretic analysis of cooperation among supply chain agents: Review andextensions. Eur. J. Oper. Res. 2008, 187, 719–745. [CrossRef]
16. Nagurney, A.; Yu, M. Sustainable fashion supply chain management under oligopolistic competition andbrand differentiation. Int. J. Prod. Econ. 2012, 135, 532–540. [CrossRef]
17. Shi, P.; Yan, B.; Shi, S. Pricing and product green degree decisions in green supply chains with fairnessconcerns. Syst. Eng. Theory Pract. 2016, 36, 1937–1950.
18. Bai, C.G.; Tang, J.F. Manufacturing-marketing green supply chain cooperative game analysis. J. Syst. Eng.2017, 32, 818–828.
19. Hong, Z.F.; Wang, H.; Yu, Y. Green product pricing with non-green product reference. Transp. Res. E 2018,115, 1–15. [CrossRef]
20. Song, H.; Gao, X. Green supply chain game model and analysis under revenue-sharing contract. J. Clean.Prod. 2018, 170, 183–192. [CrossRef]
21. Taleizadeh, A.A.; Alizadeh-Basban, N.; Niaki, S.T.A. A closed-loop supply chain considering carbon reduction,quality improvement effort, and return policy under two remanufacturing scenarios. J. Clean. Prod. 2019,232, 1230–1350. [CrossRef]
22. Capraro, V.; Jagfeld, G.; Klein, R.; Mul, M.; Pol, I.V.D.; Van de Pol, I. Increasing altruistic and cooperativebehaviour with simple moral nudges. Sci. Rep. 2019, 9, 11880. [CrossRef] [PubMed]
23. Alboszta, J.; Miekisz, J. Stability of evolutionarily stable strategies in discrete replicator dynamics with timedelay. J. Theor. Biol. 2004, 231, 175–179. [CrossRef] [PubMed]
24. Barari, S.; Agarwal, G.; Zhang, W.J.; Mahanty, B.; Tiwari, M.K. A decision framework for the analysis of greensupply chain contracts: An evolutionary game approach. Expert Syst. Appl. 2012, 39, 2965–2976. [CrossRef]
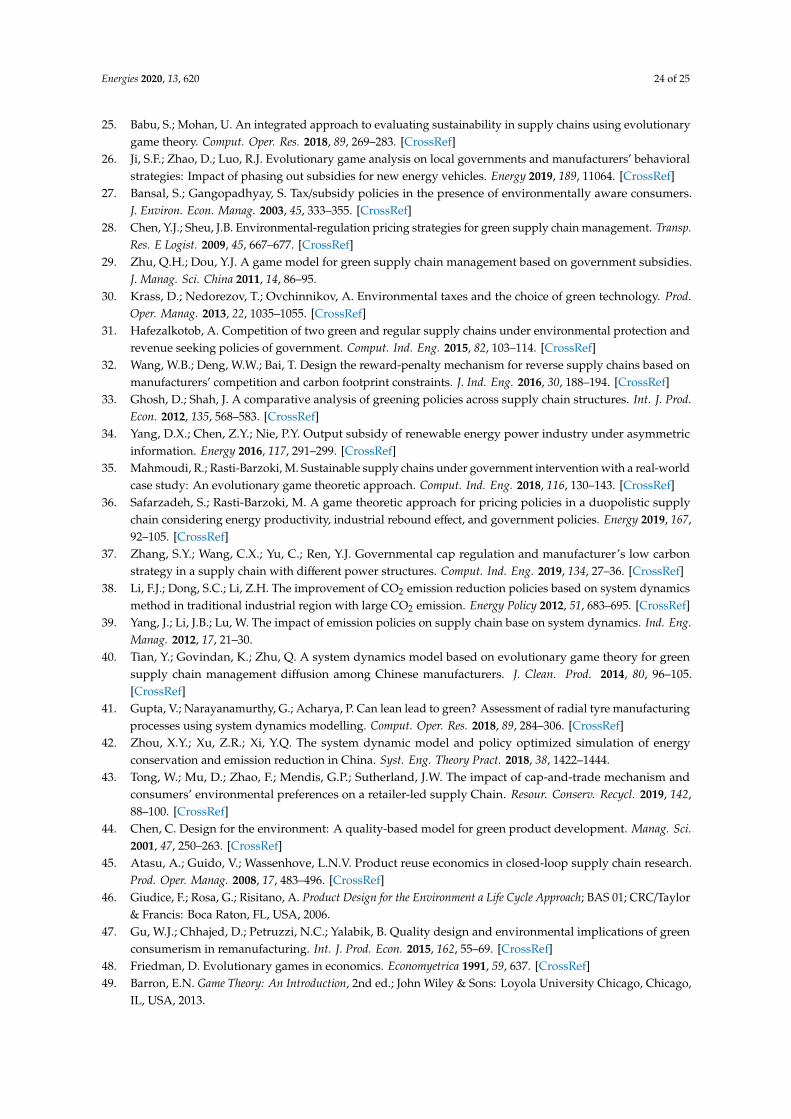
Energies 2020, 13, 620 24 of 25
25. Babu, S.; Mohan, U. An integrated approach to evaluating sustainability in supply chains using evolutionarygame theory. Comput. Oper. Res. 2018, 89, 269–283. [CrossRef]
26. Ji, S.F.; Zhao, D.; Luo, R.J. Evolutionary game analysis on local governments and manufacturers’ behavioralstrategies: Impact of phasing out subsidies for new energy vehicles. Energy 2019, 189, 11064. [CrossRef]
27. Bansal, S.; Gangopadhyay, S. Tax/subsidy policies in the presence of environmentally aware consumers.J. Environ. Econ. Manag. 2003, 45, 333–355. [CrossRef]
28. Chen, Y.J.; Sheu, J.B. Environmental-regulation pricing strategies for green supply chain management. Transp.Res. E Logist. 2009, 45, 667–677. [CrossRef]
29. Zhu, Q.H.; Dou, Y.J. A game model for green supply chain management based on government subsidies.J. Manag. Sci. China 2011, 14, 86–95.
30. Krass, D.; Nedorezov, T.; Ovchinnikov, A. Environmental taxes and the choice of green technology. Prod.Oper. Manag. 2013, 22, 1035–1055. [CrossRef]
31. Hafezalkotob, A. Competition of two green and regular supply chains under environmental protection andrevenue seeking policies of government. Comput. Ind. Eng. 2015, 82, 103–114. [CrossRef]
32. Wang, W.B.; Deng, W.W.; Bai, T. Design the reward-penalty mechanism for reverse supply chains based onmanufacturers’ competition and carbon footprint constraints. J. Ind. Eng. 2016, 30, 188–194. [CrossRef]
33. Ghosh, D.; Shah, J. A comparative analysis of greening policies across supply chain structures. Int. J. Prod.Econ. 2012, 135, 568–583. [CrossRef]
34. Yang, D.X.; Chen, Z.Y.; Nie, P.Y. Output subsidy of renewable energy power industry under asymmetricinformation. Energy 2016, 117, 291–299. [CrossRef]
35. Mahmoudi, R.; Rasti-Barzoki, M. Sustainable supply chains under government intervention with a real-worldcase study: An evolutionary game theoretic approach. Comput. Ind. Eng. 2018, 116, 130–143. [CrossRef]
36. Safarzadeh, S.; Rasti-Barzoki, M. A game theoretic approach for pricing policies in a duopolistic supplychain considering energy productivity, industrial rebound effect, and government policies. Energy 2019, 167,92–105. [CrossRef]
37. Zhang, S.Y.; Wang, C.X.; Yu, C.; Ren, Y.J. Governmental cap regulation and manufacturer’s low carbonstrategy in a supply chain with different power structures. Comput. Ind. Eng. 2019, 134, 27–36. [CrossRef]
38. Li, F.J.; Dong, S.C.; Li, Z.H. The improvement of CO2 emission reduction policies based on system dynamicsmethod in traditional industrial region with large CO2 emission. Energy Policy 2012, 51, 683–695. [CrossRef]
39. Yang, J.; Li, J.B.; Lu, W. The impact of emission policies on supply chain base on system dynamics. Ind. Eng.Manag. 2012, 17, 21–30.
40. Tian, Y.; Govindan, K.; Zhu, Q. A system dynamics model based on evolutionary game theory for greensupply chain management diffusion among Chinese manufacturers. J. Clean. Prod. 2014, 80, 96–105.[CrossRef]
41. Gupta, V.; Narayanamurthy, G.; Acharya, P. Can lean lead to green? Assessment of radial tyre manufacturingprocesses using system dynamics modelling. Comput. Oper. Res. 2018, 89, 284–306. [CrossRef]
42. Zhou, X.Y.; Xu, Z.R.; Xi, Y.Q. The system dynamic model and policy optimized simulation of energyconservation and emission reduction in China. Syst. Eng. Theory Pract. 2018, 38, 1422–1444.
43. Tong, W.; Mu, D.; Zhao, F.; Mendis, G.P.; Sutherland, J.W. The impact of cap-and-trade mechanism andconsumers’ environmental preferences on a retailer-led supply Chain. Resour. Conserv. Recycl. 2019, 142,88–100. [CrossRef]
44. Chen, C. Design for the environment: A quality-based model for green product development. Manag. Sci.2001, 47, 250–263. [CrossRef]
45. Atasu, A.; Guido, V.; Wassenhove, L.N.V. Product reuse economics in closed-loop supply chain research.Prod. Oper. Manag. 2008, 17, 483–496. [CrossRef]
46. Giudice, F.; Rosa, G.; Risitano, A. Product Design for the Environment a Life Cycle Approach; BAS 01; CRC/Taylor& Francis: Boca Raton, FL, USA, 2006.
47. Gu, W.J.; Chhajed, D.; Petruzzi, N.C.; Yalabik, B. Quality design and environmental implications of greenconsumerism in remanufacturing. Int. J. Prod. Econ. 2015, 162, 55–69. [CrossRef]
48. Friedman, D. Evolutionary games in economics. Economyetrica 1991, 59, 637. [CrossRef]49. Barron, E.N. Game Theory: An Introduction, 2nd ed.; John Wiley & Sons: Loyola University Chicago, Chicago,
IL, USA, 2013.
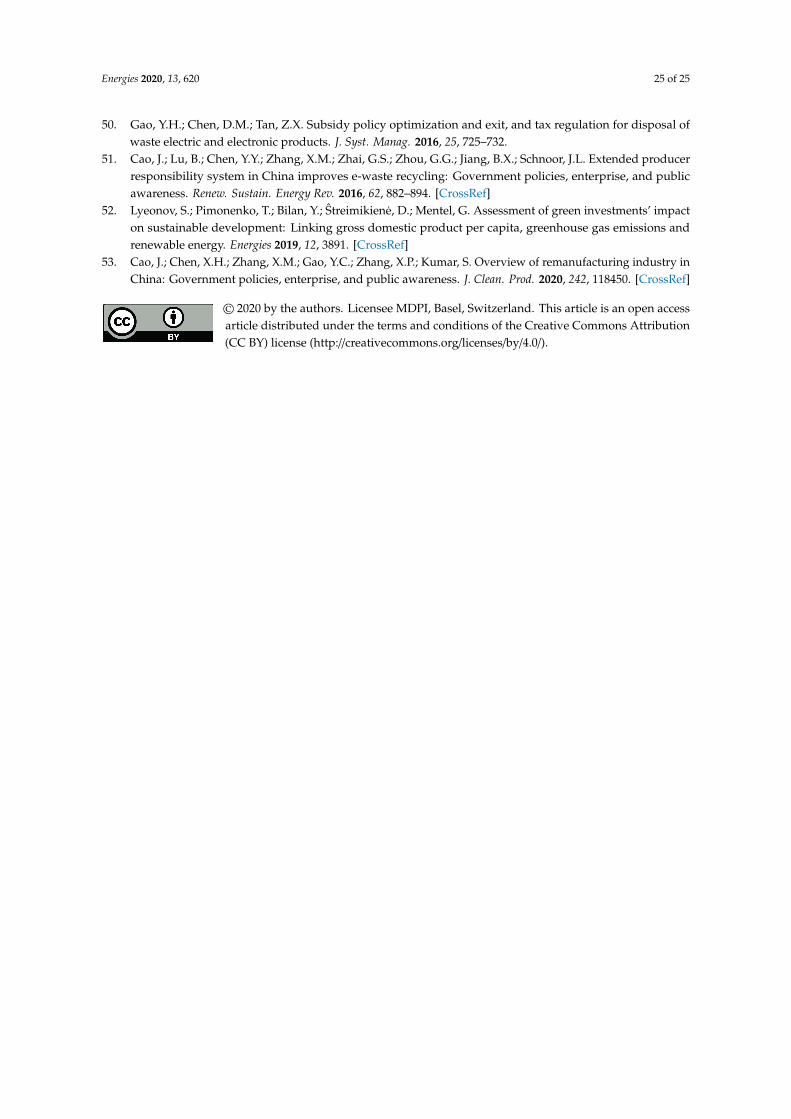
Energies 2020, 13, 620 25 of 25
50. Gao, Y.H.; Chen, D.M.; Tan, Z.X. Subsidy policy optimization and exit, and tax regulation for disposal ofwaste electric and electronic products. J. Syst. Manag. 2016, 25, 725–732.
51. Cao, J.; Lu, B.; Chen, Y.Y.; Zhang, X.M.; Zhai, G.S.; Zhou, G.G.; Jiang, B.X.; Schnoor, J.L. Extended producerresponsibility system in China improves e-waste recycling: Government policies, enterprise, and publicawareness. Renew. Sustain. Energy Rev. 2016, 62, 882–894. [CrossRef]
52. Lyeonov, S.; Pimonenko, T.; Bilan, Y.; Streimikiene, D.; Mentel, G. Assessment of green investments’ impacton sustainable development: Linking gross domestic product per capita, greenhouse gas emissions andrenewable energy. Energies 2019, 12, 3891. [CrossRef]
53. Cao, J.; Chen, X.H.; Zhang, X.M.; Gao, Y.C.; Zhang, X.P.; Kumar, S. Overview of remanufacturing industry inChina: Government policies, enterprise, and public awareness. J. Clean. Prod. 2020, 242, 118450. [CrossRef]
© 2020 by the authors. Licensee MDPI, Basel, Switzerland. This article is an open accessarticle distributed under the terms and conditions of the Creative Commons Attribution(CC BY) license (http://creativecommons.org/licenses/by/4.0/).