green power purchasing intention of chinese consumers · ... five were in china. in 2015, ......
TRANSCRIPT

1
Green Power Purchasing Intention of Chinese Consumers
August 2016

2
Unlike conventional power, green power produces little or zero harmful emissions.

1
INTRODUCTION
In recent years, China has been faced with increasingly serious environmental
pollution, and in particular, issues arising from air pollution. Data showed that of the
ten most polluted cities in the world, five were in China. In 2015, up to 265 (78.4%) of
the 338 prefecture-level cities in China had air quality that breached standards.
Thermal power remains the largest source of power supply in China, and
it is one major cause of air pollution. According to China's 2016 Power Industry
Annual Development Report released by the China Electricity Council, in 2015
China generated 5,739.9 billion kWh of electric power, of which 73.7% was thermal
power. A large proportion of thermal power plants are coal-fired.
According to statistics from the China National Coal Association, China’s
power sector consumed 1.939 billion tonnes of coal in 2015, accounting for 49% of
the total coal consumed nationally. A joint study conducted by Tsinghua University
and the Health Effects Institute revealed that about 40% of PM 2.5 comes from
coal. Among all sources of air pollution, coal burning poses the most risk to human
health. The American Cancer Society’s studies indicate that the risk of developing
lung cancer is 10% to 15% higher for residents in highly polluted areas than those
living in clean cities. About 70% of people in China live in areas with an annual PM
2.5 concentration rate of higher than 35 µg/m³.
In this report, green power refers to electricity generated from non-hydro
renewable energy, including wind power, solar power and biomass power, among
others. Unlike conventional power, green power produces little or zero harmful
emissions. There has been a global consensus to boost renewable energy sources
and use them to replace thermal power.
Despite China having more installed wind and solar capacity than any other
country, green power (non-hydro renewable energy) generation accounts for less
than 5% of its total power consumption. China’s renewable energy sector struggles

2
to get hold of its share of small-scale government subsidies. In addition, wind and
solar remains seriously curtailed within China; the renewable power capacity has
not been fully tapped. In the first half of 2016, 32.2 billion kWh, accounting for 21%
of wind power, was wasted.
China’s electric power market consists of power generators, power
distribution companies, and users. Power generators use a range of equipment to
produce electricity, grid companies distribute electricity to users, and consumers
(industrial and business users, and households) use electricity according to their
own needs. Chinese consumers, however, are not currently given the option to
choose the source of their power supply.
This research is commissioned by the Chinese Renewable Energy Industries
Association (CREIA) and conducted by IPSOS. This report seeks to answer:
How aware of environmental pollution is the public? How aware and inclined are they to purchase green power?

3
The public is concerned about environmental pollution, and in particular, air pollution.
Over 95% of the respondents were aware of environmental pollution
and nearly half were very concerned about this issue.
For half of the respondents, air pollution was their biggest worry,
followed by water pollution.
The respondents believed that thermal power was the major cause of
air pollution.
The public is very aware of green power and have a strong willingness to buy it.
More than 80% of the respondents were aware of green power and
thought it could reduce air pollution to some extent.
87.9% of the respondents said they would like to know the
composition of their power supply.
The majority of respondents (97.6%) expressed willingness to buy
green power, and of these 40% said they would buy it, with those from
Beijing indicating the highest intention to purchase.
Of those willing to buy green power, most (over 90%) would be willing
to pay more.
MAJOR FINDINGS

4
Energy supply is essential to all societies. Consumers have every right to ask for a better and cleaner energy supply.

5
POLICY RECOMMENDATION
Energy supply is essential to all societies. Consumers
have every right to ask for a better and cleaner energy supply.
This research shows that many urban residents are fully
aware that green power can reduce air pollution, and are even
willing to pay more for it. However, currently they do not have
the option to purchase green power. Therefore, we suggest
power companies should indicate the sources of consumers’
power supply on their bills (e.g. thermal power, hydro power,
renewable power and nuclear power), provide the option
for households to buy green power, and allow consumers
independent choice over their power supply sources.
How can Chinese households gain access to green
power in the future?
(1) Purchase a green power certificate: The National
Energy Administration will issue green power certificates for
renewable electricity. It will be mandatory for thermal power
companies to produce a certain share of green power, allowing
end consumers to have the right to buy and consume green
power. In this way, companies and individuals can purchase
green power certificates to complete compulsory targets,
and fulfill their intention of using green power. Meanwhile,
renewable power companies can increase revenue by selling
certificates. Issuing certificates based on the volume of green
power generated could also increase the production of
renewable energy and the percentage of green power usage.
(2) Distributed power generation projects: In China,
companies and individuals can consume green power from
distributed solar power generation projects. Companies and
households can get direct access to electricity generated from
local equipment, often installed on roofs, in factories, on land,
or through investment. This follows the operation model of
self-generation, self-consumption, feeding surplus electricity
into the grid and making adjustments via the grid.
(3 ) Purchase green power di rec t ly f rom power
companies: Power companies should provide support and
make options available for the purchase of green power.
Consumers should be allowed to choose from various power
supply sources. We call on power companies to provide bill
options for households and companies, and allow users to
meet their demands by buying green power directly from
power companies.

6
Environmental awareness
Green power awareness
Green power purchasing intention
DETAILED FINDINGS

7
DETAILED FINDINGS
Public concern about environmental pollution in China
The vast majority of the respondents (95.9%) were worried about current domestic pollution issues, of which nearly half (43.4%) showed great concern.
How concerned are you about environmental pollution problems in China at the moment?
N=3000
40.6%
11.9%
3.2%
0.9%
43.4%Care about it very much
Somewhat care about it
Care about it
Do not care about it much
Do not care about it at all
Environmental awareness

8
How concerned are you about environmental pollution problems in China at the moment?
Public concern about environmental pollution in China – by groups of people
There was no significant difference in terms of gender; People aged 35 to 44 were most concerned; The more educated people were, the more concerned they were about environmental pollution.
N=
Below 18 Aged 18-34 Aged 35-44 Aged 45-59Male Female 60 and above Primary education
Seconddary education
Higher education
1593 1407 180 1307 693 583 237 51 785 2164
Do not care about it at all Care about it
“Care about it”or more
than it
Care about it very muchDo not care about it much Somewhat care about it
44.8%
39.5%
95.8%
11.5%
3.4%0.8%
42.0%
41.8%
96.2%
12.4%
2.9%0.9%
41.0%
40.6%
92.7%
11.1%
6.7%0.6%
39.7%
43.2%
95.7%
12.8%
3.8%0.5%
49.7%
36.5%
97.7%
11.5%1.6%0.7%
46.4%
40.0%
96.4%
10.0%
2.1%1.5%
41.0%
39.2%
94.1%
13.9%
4.2%1.7%
31.3%
39.2%
88.2%
17.7%
9.8%2.0%
35.9%
40.5%
93.0%
16.6%
5.7%1.3%
46.5%
40.6%
97.2%
10.1%2.1%0.7%
DETAILED FINDINGS
Environmental awareness

9
How concerned are you about environmental pollution problems in China at the moment?
Public concern about environmental pollution in China – by region
The vast majority of respondents (over 90%) from all cities surveyed indicated concern; Of all the cities surveyed, respondents from Guangzhou indicated the least concern.
95.0%
95.7%97.3%96.3%
95.3%
97.0%95.3%
98.0%
97.0%
92.7%
84.3%
81.3%88.3%83.0%
85.3%
84.7%81.3%
89.3%
85.0%
77.7%
Lanzhou
Xi'an
Taiyuan
WuhanShanghai
Guangzhou
JInan
Beijing
Shenyang
Chengdu
N=300 ( each city )
"Care about it or" more than it
"Somewhat care about it" or more than it
DETAILED FINDINGS
Environmental awareness

10
Specific environmental issues of public concern
Of all the environmental issues, the public was most concerned about air pollution with half of the respondents saying it was their biggest concern, and up to 85% expressing concern. This was followed by water pollution, over which 80% expressed concern. Both of these issues received substantially more attention than other forms of pollution.
For the following specific environmental issues, please choose the one you are most concerned about. Are there any others? Please choose a maximum of two.
N=3000
Total
85.6%
81.1%
44.2%
30.7%
39.3%
56.6%24.5%
32.0%32.0%
7.5%
5.8%
23.2%
33.5%
35.6%50.0%Air pollution
Specific environmental issues the public is most concerned by
Specific environmental problems the public is concerned by
Water pollution
Climate change
Construction/industrial noise pollution
Soil pollution
DETAILED FINDINGS
Environmental awareness

11
39
58
52 62 81
72
53
90
70
64
Specific environmental issues of public concern – air pollution
92% of Beijing respondents were concerned about air pollution, a much higher percentage than for other cities. Lanzhou respondents were the least concerned, with only 73% expressing concern about air pollution.
According to the "Report on the State of Environment in China in 2015" released by the Ministry of Environmental Protection, the annual average concentration of PM2.5 in Beijing and Jinan exceeded 80 µg/m3. However, concern was much higher in Beijing
For the following specific environmental issues, please choose the one you are most concerned about. Are there any others? Please choose a maximum of two.
73.0%
%85.3%
90.7%
86.0%
Average annual PM2.5 concentration (µg/m3)
Proportion of people concerned about air pollution
86.3%
86.3%
87.3%
85.3%
83.7% 92.0%
DETAILED FINDINGS
Environmental awareness
Lanzhou
Xi'an
Taiyuan
WuhanShanghai
Guangzhou
JInan
Beijing
Shenyang
Chengdu

12
Major causes to air pollution
Do the public care about air
pollution?
Major causes to air pollution
Industry (83.5%), transportation (77.1%), and thermal power (58.2%) were considered to be the three major causes to air pollution.
Which do you think are the major causes to air pollution? Please choose a maximum of three
N=2568
83.5%
77.1%
58.2%
22.2%
15.0%
Industry
Transportation
Temal power
Municipal heating boilers
Stoves for civil use
85.6% (N=2568)
14.4% (N=432)
Yes
No
N=3000
DETAILED FINDINGS
Environmental awareness

13
"Green power" awareness
Most of the respondents (81.2%) knew about “green power”; There was no significant difference in terms of gender; People aged 18 to 59 showed more awareness of green power; People with higher education had a better awareness of green power.
Have you ever heard about “green power” or “renewable power”?
N=3000
81.2% 18.8%Heard about it Not heard about it
“Green power” awareness
“Green power”awareness
Not heard about it Heard about it
81.0%
19.0%
81.4%
18.6%
78.9%
21.1%
81.2%
18.8%
82.5%
17.5%
81.3%
18.7%
79.3%
20.7%
74.5%
25.5%
71.0%
29.0%
85.1%
14.9%
DETAILED FINDINGS
Green power awareness
N=
Below 18 Aged 18-34 Aged 35-44 Aged 45-59Male Female 60 and above Primary education
Seconddary education
Higher education
1593 1407 180 1307 693 583 237 51 785 2164

14
“Green power” awareness – by region
Awareness of “green power” varied between cities: it was highest in Beijing, Shanghai and Xi’an (about 85%), and relatively low in Shenyang and Guangzhou.
Have you ever heard about “green power” or “renewable power”?
95.0%
97.0%95.3%
97.0%
92.7%
81.3%88.3%83.0%
85.3%
89.3%
DETAILED FINDINGS
Green power awareness
Lanzhou
Xi'an
Taiyuan
Wuhan Shanghai
Guangzhou
JInan
Beijing
Shenyang
Chengdu

15
Green power awareness
How do you think the role of “green power” in reducing air pollution?
The role of “green power” in reducing air pollution
The vast majority of respondents (96.3%) thought that “green power” could reduce air pollution, and of these more than half (56.7%) stated that “green power” could largely reduce air pollution, while 14.5% were fully confident of its role in reducing air pollution.
N=3000
56.7%
25.1%
3.0%
0.7%
14.5%It can completely reduce it
It can largely reduce it
It can reduce it
It is unlikely to reduce it
It can't reduce it at all
DETAILED FINDINGS

16
The vast majority (90%) of respondents from all cities believed that “green power” could reduce air pollution;
Meanwhile, people from Beijing and other cities in north China displayed a greater confidence than those in the south of the role of “green power” to (largely or completely) reduce air pollution.
The role of “green power” in reducing air pollution – by region
How do you think the role of “green power” in reducing air pollution?
97.7%
96.3%96.7%95.0%
97.7%
94.0%95.3%
99.0%
97.0%
93.7%
72.7%
73.7%76.0%71.3%
74.0%
65.3%66.3%
73.0%
71.3%
67.3%
DETAILED FINDINGS
Green power awareness
Lanzhou
Xi'an
Taiyuan
WuhanShanghai
Guangzhou
JInan
Beijing
Shenyang
Chengdu
N=300 ( each city )
"Can reduce it" and more than that
"Largely reduce it" and more than that

17
Desire to learn about the composition of electric power
87.9% of respondents wanted to know where their power came from; Females were more willing to learn about the composition of power supply than males; People aged 18 to 44 expressed more intention to learn about the composition of power supply; Intention also increased proportionally to education background.
Do you want to know about the composition of the power supply you purchase, such as whether it comes from thermal power, hydropower, renewable power, or nuclear power?
N=3000
87.9% 12.1%Yes No
Do you want to know about the composition of the power supply you purchase?
Do you want to know about the composition of the power supply you purchase?
No Yes
86.2%
13.8%
89.8%
10.2%
82.8%
17.2%
88.5%
11.5%
88.7%
11.3%
86.8%
13.2%
88.2%
11.8%
80.4%
19.6%
84.3%
15.7%
89.3%
10.7%
DETAILED FINDINGS
Green power purchasing intention
N=
Below 18 Aged 18-34 Aged 35-44 Aged 45-59Male Female 60 and above Primary education
Seconddary education
Higher education
1593 1407 180 1307 693 583 237 51 785 2164

18
Do you want to know about the composition of the power supply you purchase, such as whether it comes from thermal power, hydropower, renewable power, or nuclear power?
Desire to learn about the composition of electric power – by region
Over 85% of respondents from all cities – with the exception of Lanzhou – wanted to know the composition of their power supply, and in Taiyuan and Shanghai this exceeded 90%.
90.0%
87.0%88.3%
89.0%
87.0%
88.0%89.0%91.3%
88.3%
80.7%
DETAILED FINDINGS
Green power purchasing intention
Lanzhou
Xi'an
Taiyuan
WuhanShanghai
Guangzhou
JInan
Beijing
Shenyang
Chengdu

19
Currently consumers are unable to choose the source of the power supply they purchase. If in the future as a consumer you were free to choose either “green power” or “thermal power,” would you choose “green power”?
Green power purchase intention
The majority of respondents (97.6%) were willing to buy “green power,” and over 40% said they would definitely buy it.
N=3000
39.6%
17.3%
1.8%
0.6%
40.5%Certainly yes
Probably
Possibly
Unlikely
Surely not
DETAILED FINDINGS
Green power purchasing intention

20
Green power purchase intention – by groups of people
The purchasing intention was lower in males than females, but more male respondents said they would definitely buy green power;
People aged 45 to 59 displayed the strongest purchasing intention towards green power; This purchasing intention also increased along with education.
Surely not Possibly
Possibly or more
than it
Certainly yesUnlikely Probably
42.8%
37.7%
97.1%
16.6%
2.5%0.4%
38.5%
41.7%
98.2%
18.0%
1.1%0.7%
41.7%
38.3%
97.8%
17.8%
1.1%1.1%
38.0%
41.6%
97.6%
18.1%
2.1%0.2%
40.8%
39.3%
98.3%
18.2%
1.3%0.4%
45.8%
35.3%
97.3%
16.1%
1.9%0.9%
43.0%
40.5%
96.2%
12.7%
1.7%2.1%
33.3%
27.5%
96.0%
35.2%
2.0%2.0%
41.3%
36.2%
96.8%
19.4%
1.9%1.2%
40.8%
41.0%
97.8%
16.1%
1.8%0.3%
DETAILED FINDINGS
Green power purchasing intention
N=
Below 18 Aged 18-34 Aged 35-44 Aged 45-59Male Female 60 and above Primary education
Seconddary education
Higher education
1593 1407 180 1307 693 583 237 51 785 2164
Currently consumers are unable to choose the source of the power supply they purchase. If in the future as a consumer you were free to choose either “green power” or “thermal power,” would you choose “green power”?

21
Green power purchase intention – by region
The vast majority of respondents (90%) in all the cities surveyed said that they would buy “green power”; Beijing had the largest number of respondents saying that they would “probably or definitely buy it”.
98.7%
98.3%99.3%99.7%
97.3%
97.0%98.3%
92.0%
98.3%
97.3%
81.7%
78.0%84.3%83.0%
80.7%
78.3%80.7%
77.7%
82.0%
77.3%
DETAILED FINDINGS
Green power purchasing intention
Lanzhou
Xi'an
Taiyuan
WuhanShanghai
Guangzhou
JInan
Beijing
Shenyang
Chengdu
Currently consumers are unable to choose the source of the power supply they purchase. If in the future as a consumer you were free to choose either “green power” or “thermal power,” would you choose “green power”?
N=300 ( each city )
"Possibly" and more than that
"Probably" and more than that

22
Green power purchasing intention
Green power purchase intention – increase in costs
Of those willing to buy green power, 90.6% would accept a certain increase in costs, and up to 44% would accept a monthly increase of 10 to 30 yuan (US$ 1.50 to US$4.50).
Green power purchase intention – increase in costsGreen power purchase intention
N=3000 N=2929
9.4%
40.7%
20.2%
39.6%
44.0%
17.3%
3.8%
19.0%
1.8%
3.6%0.6%
Don't want any increase in costs
Certainly yes
Monthly increase within 10 yuan
Monthly increase of 50-100 yuan
Monthly increase of 30-50 yuan
Monthly increase of 10-30 yuan
Probably
Possibly
Unlikely
Don't careSurely not
97.6%of the
respondents would like to
buy “green power”
DETAILED FINDINGS
Currently consumers can not choose the source of power supply when purchasing power. If in the future consumers are allowed to freely choose “green power or “thermal power,” would you like to choose “green power”?
According to statistics, the average cost of electricity consumption is currently around 100 yuan (US$ 15) per month per household. If electricity tariffs for “green power” were to increase in the future, what increase on the current basis would you accept?

23
Green power purchasing intention
According to statistics, the average cost of electricity consumption is currently around 100 yuan (US$ 15) per month per household. If electricity tariffs for “green power” were to increase in the future, what increase on the current basis would you accept?
Green power purchase intention – increase in costs
Respondents from all cities expressed willingness to pay an increased cost of 10 to 30 yuan, and it was over 50% in Beijing.
Region City no increase Within 10 yuan 10-30 yuan 30-50 yuan 50-100 yuan Don’t care
Northwest Xi'an 5.5% 22.3% 45.9% 19.9% 3.1% 3.4%
Northwest Lanzhou 6.9% 19.9% 43.5% 18.8% 2.9% 8.0%
Southwest Chengdu 8.5% 18.3% 46.4% 18.6% 4.4% 3.7%
Central Wuhan 8.3% 19.9% 41.6% 25.4% 3.1% 1.7%
South Guangzhou 13.7% 18.5% 39.0% 19.5% 5.8% 3.4%
North Beijing 8.7% 18.1% 51.3% 16.8% 3.0% 2.0%
North Taiyuan 13.7% 18.4% 43.8% 16.1% 2.7% 5.4%
North Jinan 10.5% 23.1% 39.7% 19.3% 5.1% 2.4%
East Shanghai 9.1% 19.3% 45.3% 19.3% 4.1% 3.0%
Northeast Shenyang 8.5% 24.4% 44.8% 15.9% 3.4% 3.1%
DETAILED FINDINGS
Lanzhou
Xi'an
Taiyuan
Wuhan
Shanghai
Guangzhou
JInan
Beijing
Shenyang
Chengdu
24
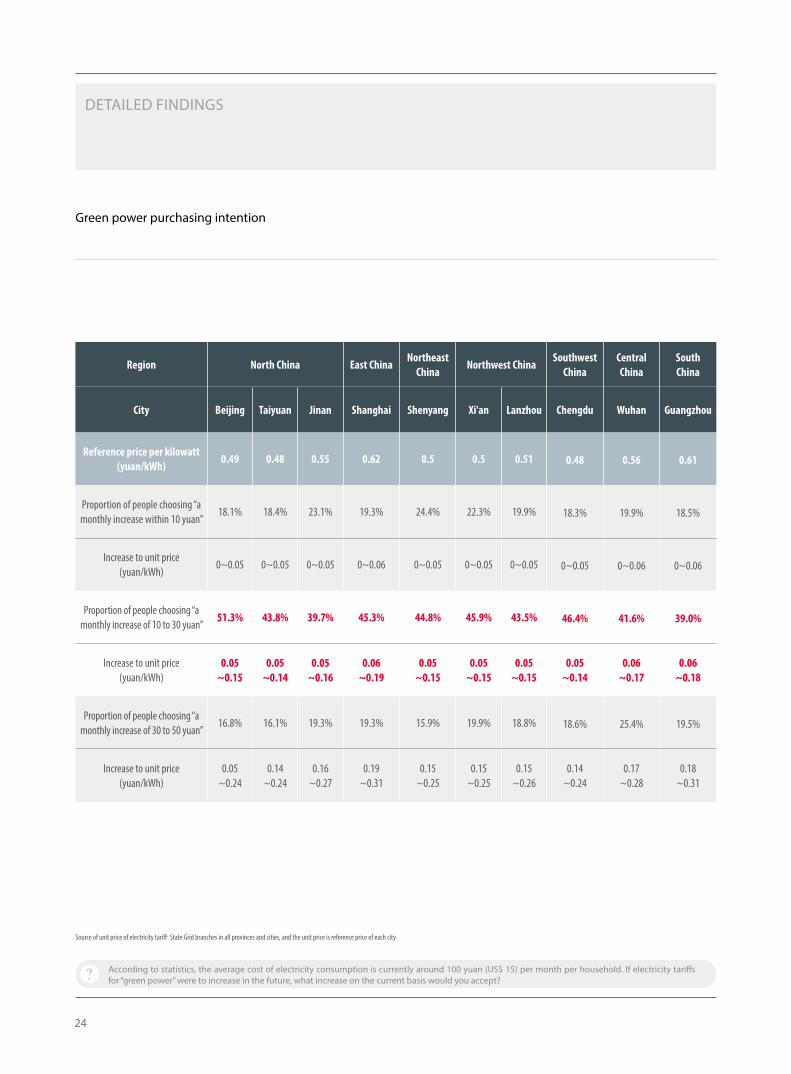
Green power purchasing intention
According to statistics, the average cost of electricity consumption is currently around 100 yuan (US$ 15) per month per household. If electricity tariffs for “green power” were to increase in the future, what increase on the current basis would you accept?
Source of unit price of electricity tariff: State Grid branches in all provinces and cities, and the unit price is reference price of each city
Region North China East ChinaNortheast
ChinaNorthwest China
SouthwestChina
Central China
South China
City Beijing Taiyuan Jinan Shanghai Shenyang Xi'an Lanzhou Chengdu Wuhan Guangzhou
Reference price per kilowatt (yuan/kWh)
0.49 0.48 0.55 0.62 0.5 0.5 0.51 0.48 0.56 0.61
Proportion of people choosing “a monthly increase within 10 yuan”
18.1% 18.4% 23.1% 19.3% 24.4% 22.3% 19.9% 18.3% 19.9% 18.5%
Increase to unit price(yuan/kWh)
0~0.05 0~0.05 0~0.05 0~0.06 0~0.05 0~0.05 0~0.05 0~0.05 0~0.06 0~0.06
Proportion of people choosing “a monthly increase of 10 to 30 yuan”
51.3% 43.8% 39.7% 45.3% 44.8% 45.9% 43.5% 46.4% 41.6% 39.0%
Increase to unit price(yuan/kWh)
0.05~0.15
0.05~0.14
0.05~0.16
0.06~0.19
0.05~0.15
0.05~0.15
0.05~0.15
0.05~0.14
0.06~0.17
0.06~0.18
Proportion of people choosing “a monthly increase of 30 to 50 yuan”
16.8% 16.1% 19.3% 19.3% 15.9% 19.9% 18.8% 18.6% 25.4% 19.5%
Increase to unit price(yuan/kWh)
0.05~0.24
0.14~0.24
0.16~0.27
0.19~0.31
0.15~0.25
0.15~0.25
0.15~0.26
0.14~0.24
0.17~0.28
0.18~0.31
DETAILED FINDINGS

25
RESEARCH DESIGN

26
RESEARCH DESIGN
Research design
Methodology: CATI and online survey
Respondents: Members of the general public
Duration: July 21 to August 10, 2016
Region City CATI Online Total
North China
Beijing 50 250 300
Taiyuan 50 250 300
Jinan 50 250 300
East China Shanghai 50 250 300
Northeast china Shenyang 50 250 300
Northwest ChinaXi'an 50 250 300
Lanzhou 50 250 300
Southwest China Chengdu 50 250 300
Central China Wuhan 50 250 300
South China Guangzhou 50 250 300
Total 500 2500 3000
Lanzhou
Xi'an
Taiyuan
Wuhan
Shanghai
Guangzhou
JInan
Beijing
Shenyang
Chengdu

27
Survey Topics Specific Question Areas
Environmental pollution awareness
Public concern of current environmental pollution in China
Specific environmental problems of public concern
Major causes of air pollution
Green power awareness
Awareness of the terms “green power” and “renewable power”
The role of “green power” in reducing air pollution
Green power purchase intention
Whether there is a desire to know the composition of power when purchasing it
Whether they would buy “green power” in the future when given free choice between “green power” or “thermal power”
Increase in cost of current power rate that the public would accept when buying green power
RESEARCH DESIGN
Research content

28
Actual composition of survey sample
Gender Age
Education Occupation
98.3% 43.6%
27.1%
5.1%
16.4%
9.1%8.6%
6.9%
6.5%
4.8%
4.5%
2.5% 1.9%
1.6%1.9%
3.1%
98.3% 19.4%
7.9%
6.0%
23.1%
Male Aged 18-34Female Aged 45-60
1. Enterprise employee; 2. Corporate middle or senior management; 3. Professional (lawyer, doctor, professor, teacher, etc.); 4. Student; 5. Freelancer; 6. Self-employed(owners of small shops or restaurants); 7. Worker/blue-collar or manual worker; 8. Government department/institution staff; 9. Private entrepreneur/business partner; 10. Government department/institution middle or senior cadre; 11. Housewife;
12. Blue-collar staff from service industry (restaurants, shops, etc.); 13. Farmer; 14. Other
60 and above
Below 18
Aged 35-44
N=3000
N=3000 N=3000
N=3000
44.1%
23.9%
19.7%
6.4%
1.4%
0.3%
4.2%Graduate and above
Undergraduate
College
Senior high/vocational/polytechnic school
Junior high school
Primary school
Not received formal education
1
2
34
5
6
7
8
910
111213 14
RESEARCH DESIGN

29
Actual composition of survey sample
Monthly household income
Living situation
N=3000
N=3000
11.6%
15.8%
24.0%
13.0%
5.0%
2.4%
3.3%
18.3%
6.6%Below 3,000 yuan
3,000-5,000 yuan
5,000-8,000 yuan
8,000-10,000 yuan
10,000-15,000 yuan
15,000-20,000 yuan
Not disclosed
Above 30,000 yuan
20,000-30,000 yuan
4.2%
13.6%
52.4%
2.3%
19.7%
7.8%Live alone
Shared living
Live with parents
Live with the spouse/boyfriend/girlfriend (no kid)
Live with the spouse/boyfriend/girlfriend (with kid(s))
Other
RESEARCH DESIGN

30
Add: 2-123 Core Plaza, No.1 Shanyuan St., Haidian District, Beijing, China Tel: +86 10 62416774
Add: A2105-2107 Wuhua Plaza, A4 Chegongzhuang Dajie, Xicheng District, Beijing, ChinaTel: +86 10 68002617
中国循环经济协会可再生能源专业委员会