green energy telecom - · pdf filepowering bts sites • the fi tfirst ... batch process,...
TRANSCRIPT

GREEN ENERGY ‐ TelecomE O i i iEnergy Optimization
& Alternative sources of Energy
A.K. Nagpal
10th August 2009

Energy Requirement: Current Base Stationsgy q
1. Global: Number of mobile telephones currently is 4.1billion and isexpected to reach 5 billion by 2015 In India currently (2009 Q1) theexpected to reach 5 billion by 2015. In India currently (2009 Q1) themobile subscriber base is 420 Million and is expected to reach 500Million by 2010
2 More than 90% of the additions will come from emerging economies2. More than 90% of the additions will come from emerging economiesglobally, with 60 to 80 % of them located in rural areas.
3. In India we expect that the number of new Base stations to be setup by2011 ill d 2 00 0002011 will exceed 2,00,000.
4. Energy related expenditure accounts for nearly 70% of total operatingcost per cell site in the rural areas.p

POWER STATUS IN INDIA . as on June 30,2008
Installed capacity 144,912.97 MWThermal 92,564.64 MW
•Coal 76,648.88 MW•Gas 14,716.01MW Oil 1 199 75 MW•Oil 1,199.75 MW
Hydro 36,033.76 MWNuclear 4 120 00 MWNuclear 4,120.00 MWRenewable 12,194.57 MW

INDIA’S ENERGY CONSUMPTION (PROJECTION)
(Data units “million tons equivalent in oil” or “MTEO”)

Energy Requirement: Current Base Stationsgy q
h f l f1. The Power requirement of a BTS currently varies from 1300 –2500 watts.
2. A large percentage of these deployments are still indoor typeg p g p y ypneeding air conditioning.
3. Current SLAs (with operators) need shelter temperature to bemaintained between 22 – 300 C rangemaintained between 22 30 C range.
4. Powering systems are based on grid supply as primary sourcewith diesel generators as stand by sources and Storagebatteries as secondary sourcesbatteries as secondary sources

Energy Requirement: Current Base Stations
5. In case of indoor shelters where specified temperature needs tobe maintained:be maintained:‐
a. Rise in temperature is faster than decrease in batteryvoltage to its threshold
b. DG set needs to be switched “on” to power the A/Cs andmaintain the temperature
c. Battery Capacity is not fully utilized.
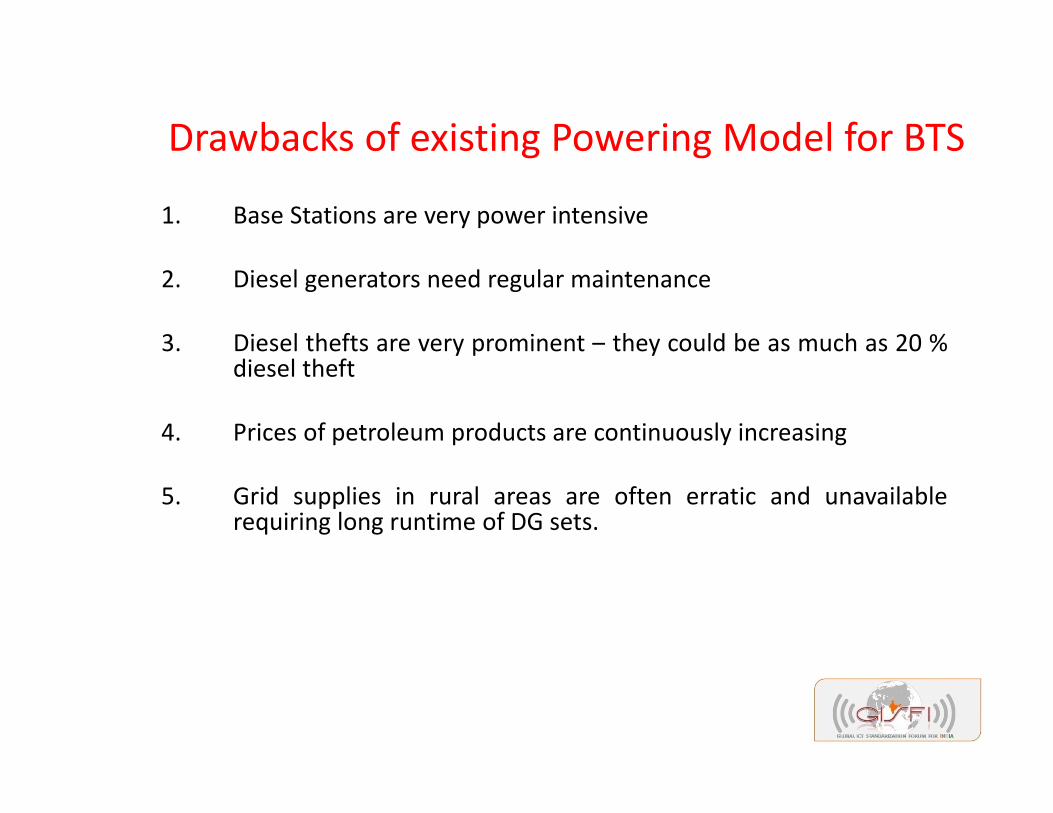
Drawbacks of existing Powering Model for BTSDrawbacks of existing Powering Model for BTS
1. Base Stations are very power intensive
2. Diesel generators need regular maintenance
3. Diesel thefts are very prominent – they could be as much as 20 %y p ydiesel theft
4. Prices of petroleum products are continuously increasing
5. Grid supplies in rural areas are often erratic and unavailablerequiring long runtime of DG sets.
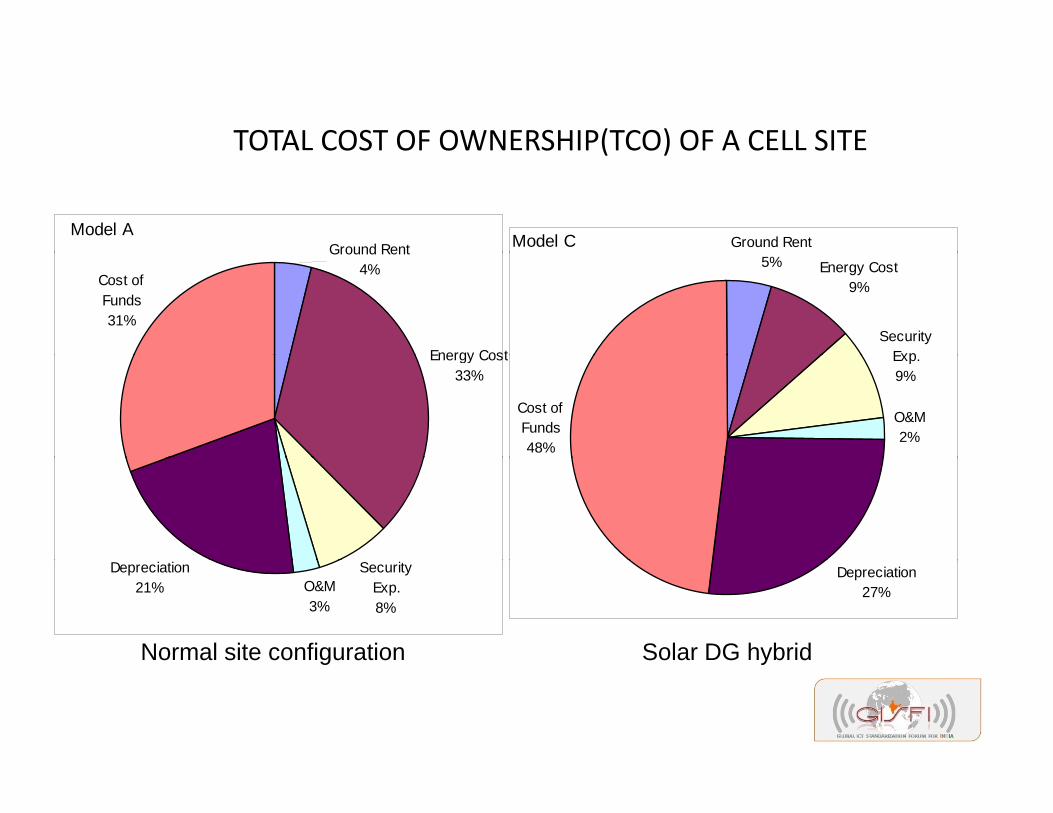
TOTAL COST OF OWNERSHIP(TCO) OF A CELL SITETOTA COST OF OWN RSHIP(TCO) OF A C SIT
Model AGround Rent Model C Ground Rent
Energy Cost
Cost of Funds31%
Ground Rent4% 5% Energy Cost
9%
Security ExpEnergy Cost
33%Exp.9%
O&M2%
Cost of Funds48%
Security Exp.8%
O&M3%
Depreciation21%
Depreciation27%
Normal site configuration Solar DG hybridg y

TOTAL COST OF OWNERSHIP(TCO) OF A CELL SITETOTA COST OF OWN RSHIP(TCO) OF A C SIT
Model BGround
Rent5%
Model D Energy Cost4%Ground Rent
Energy Co26%
Cost of Funds34%
Security Exp.9%
O&M2%
5%
c
2%
Cost of Funds52%
Security Exp.9%
Depreciation Depreciation28%9%O&M
2%24%
28%
Solar flow technology batteryDG FLOWTECH BTY HYBRID Solar flow technology battery DG FLOWTECH BTY HYBRID
Optimizing Energy Requirement of a Cell Siteof a Cell Site
Realizing a OBTS(Optimized Energy Base Stations)

Cell site configurationCell site configuration
Base Station Equipment Base Station Site-level Equipment
RF parts Cooling and/or heating unitg g
Power amplifier (PA) Rectifier
Di it l i l i (DSP) A t li (f d )Digital signal processing (DSP) Antenna line (feeder)
Transmission Antenna
Control Mast-head amplifier (MHA)

Cell site Energy Optimization
Traditional Base Station Energy-Optimized Base Station
Component (s)
GSM%Energy
Consumption
WCDMA%Energy
Consumption
Component (s)
GSM% Energy
Consumption
WCDMA% Energy
Consumptionn
RF + PA 50% 40% RF + PA 85% 75%
DSP DSPDSP, transmission,
MHA10% 20%
DSP, transmission,
MHA10% 20%
Feeder, 35% 35% Feeder, N/A N/ACooling 35% 35% Cooling N/A N/A
Rectifier 5% 5% Rectifier 5% 5%
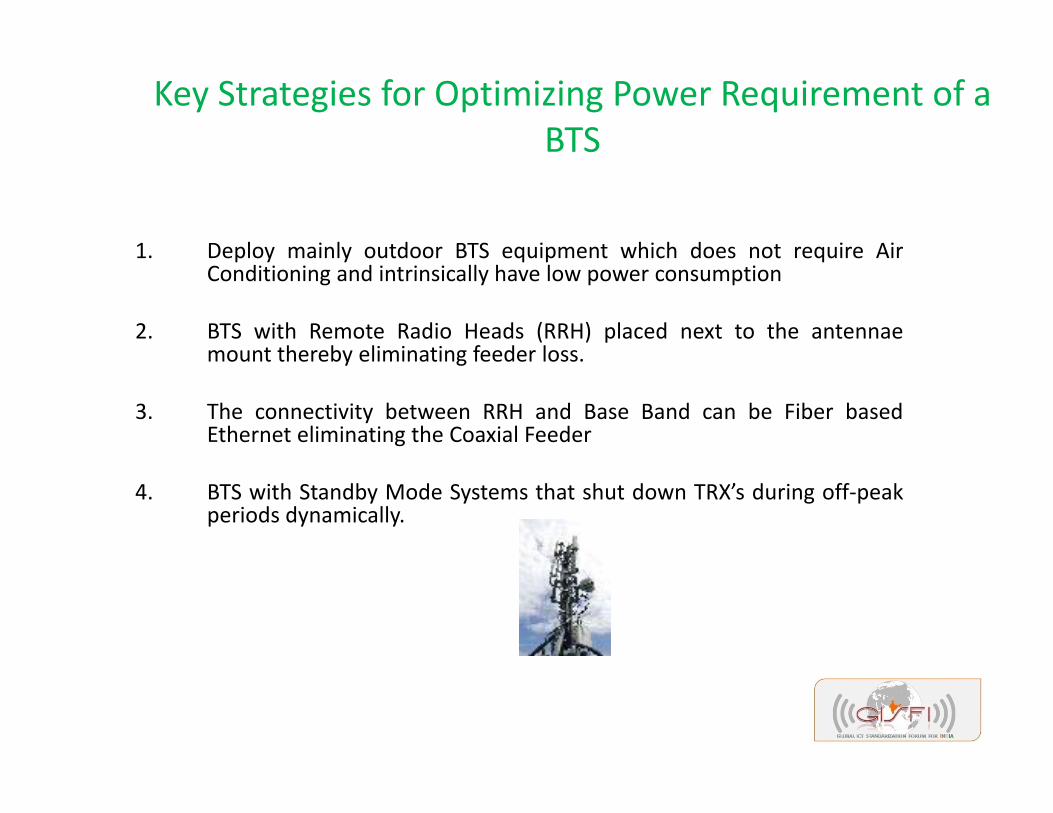
Key Strategies for Optimizing Power Requirement of a BTSBTS
1 Deploy mainly outdoor BTS equipment which does not require Air1. Deploy mainly outdoor BTS equipment which does not require AirConditioning and intrinsically have low power consumption
2. BTS with Remote Radio Heads (RRH) placed next to the antennaemount thereby eliminating feeder lossmount thereby eliminating feeder loss.
3. The connectivity between RRH and Base Band can be Fiber basedEthernet eliminating the Coaxial Feeder
4. BTS with Standby Mode Systems that shut down TRX’s during off‐peakperiods dynamically.
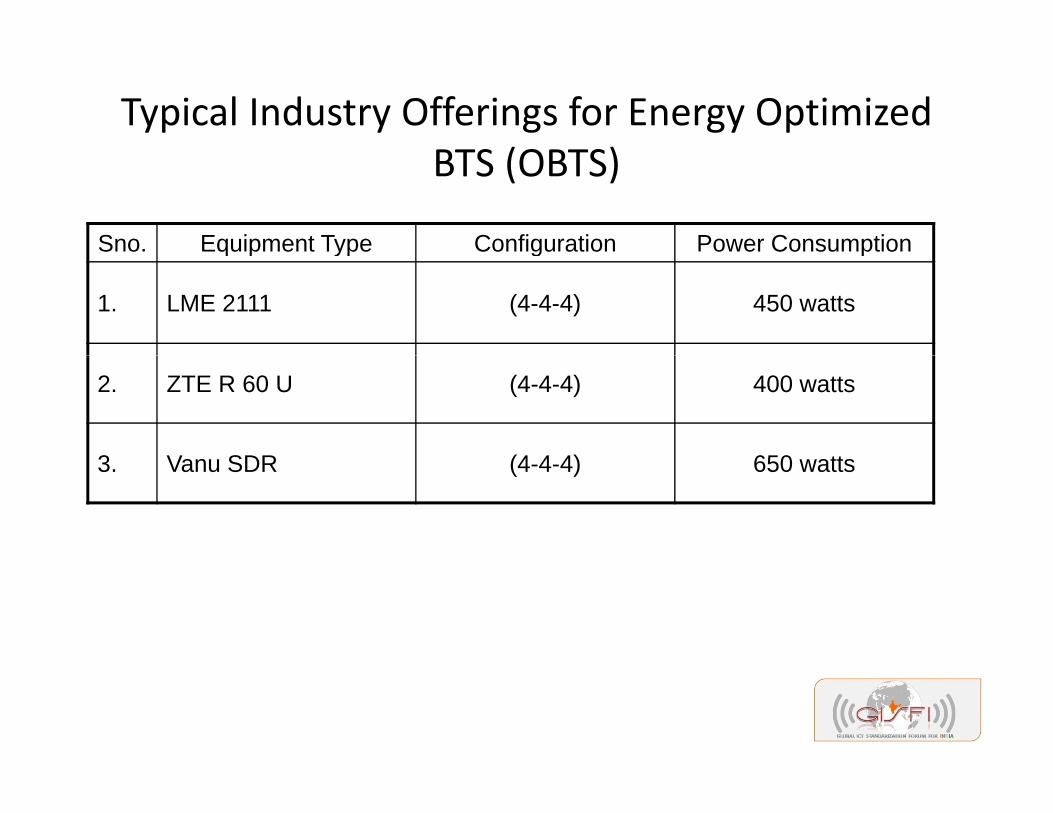
Typical Industry Offerings for Energy Optimized BTS (OBTS)BTS (OBTS)
Sno. Equipment Type Configuration Power Consumptionq p yp g p
1. LME 2111 (4-4-4) 450 watts
2. ZTE R 60 U (4-4-4) 400 watts
3 V SDR (4 4 4) 650 tt3. Vanu SDR (4-4-4) 650 watts

Adapting Alternative Sources for
Powering BTS Sites

Adapting Alternative Sources of Energy for Powering BTS Sites
Th fi t t t d d ti lt ti f f• The first step towards adapting alternative sources of energy forpowering cell sites is to realize OBTS.
• The CAPEX for adopting alternative source of energy forpowering such sites will become sustainable.
• A number of technologies amongst alternative sources are indifferent stages of evolution
• Often a combination of one or more sources of alternativeenergy needs to be deployed with / without DG sets.
Adapting Alternative Sources of Energy for Powering BTS Sites: The RationaleSites: The Rationale
1. These sources are CLEAN, GREEN & FREE (RUNNING COST)
2. The capex levels although high at present will come down astechnologies mature and volumes attain critical mass.
3. The operating costs are almost nil as these sources are free.Maintenance and replacements are very low compared to diesel –driven sites.
4. Carbon credits can be a revenue stream on green sites (EstimatedRs. 20 K per annum per site)

Adapting Alternative Sources of Energy for Powering BTS Sit A il bl t h l iBTS Sites: Available technologies
1. SOLAR – DG HYBRID
2 WIND DG HYBRID2. WIND – DG HYBRID
3. SOLAR – WIND HYBRID
4. BIOFUELS
5 FUEL CELLS5. FUEL ‐ CELLS

Adapting Alternative Sources of Energy for Powering BTS Sites: Solar EnergyBTS Sites: Solar Energy
1. MOST MATURED amongst all such technologies.
2. Power converted from light per m2 – efficiency*
Polycrystalline Silicon: 12 – 15%
Monocrystalline Silicon: 13 – 15%
S t M t lli Sili 15 18%Saturn Monocrystalline Silicon: 15 – 18%
*The percentage of sunlight falling on 1 Sq. Meter surface of a Solar Cell that isconverted into Electrical power is defined as efficiency of solar cell. Thus a Solar cellwith 15% efficiency delivers 150 Watt of Power converted from light falling on 1 Sq.Mtr. Surface at Noon.

Adapting Alternative Sources of Energy for Powering BTS Sites: Solar EnergyBTS Sites: Solar Energy
3 Main advantages3. Main advantages
Free, Clean, Green
No Moving Parts – No Maintenance Cost
4. Suggested configuration
a. Solar – DG Hybrid
b. Solar – Wind Hybrid

Adapting Alternative Sources of Energy for Powering BTS Sites: WIND – BASED SYSTEMS
FREE CLEAN & GREENFREE, CLEAN & GREEN1. Advanced systems are widely available
2. Smaller systems can be mounted on existing radio‐masts, reducing costs.
3. Horizontal wind turbines are more efficient
4. Systems available with low “cut – in” speeds of 2.4 m/sec
CHALLENGESCHALLENGES
• Site – selection must be carefully done for deployment of wind – turbines, ISO – 820 windmaps must be studied before deploying wind turbines
d l f h d ff h ll d k f• Wind velocity is often erratic. Thus we need a very efficient charge controller and a sink forexcess power
• Sink for excess power can be a tube well for example

Adapting Alternative Sources of Energy for Powering BTS Sites: Bio‐FuelPowering BTS Sites: Bio‐Fuel
1. Biodiesel is commonly produced by the transesterification of thet bl il i l f t f d t k Th l th d fvegetable oil or animal fat feedstock. There are several methods for
carrying out this transesterification reaction including the commonbatch process, supercritical processes, ultrasonic methods, and evenmicrowave methods.
2. Much of the world uses a system known as the "B" factor tostate the amount of biodiesel in any fuel mix: fuel containing20% biodiesel is labeled B20, while pure biodiesel is referred toas B100 It is common to see B99 since 1% petrodiesel isas B100. It is common to see B99, since 1% petrodiesel issufficiently toxic to retard mold. Blends of 20 percent biodieselwith 80 percent petroleum diesel (B20) can generally be usedin unmodified diesel engines.
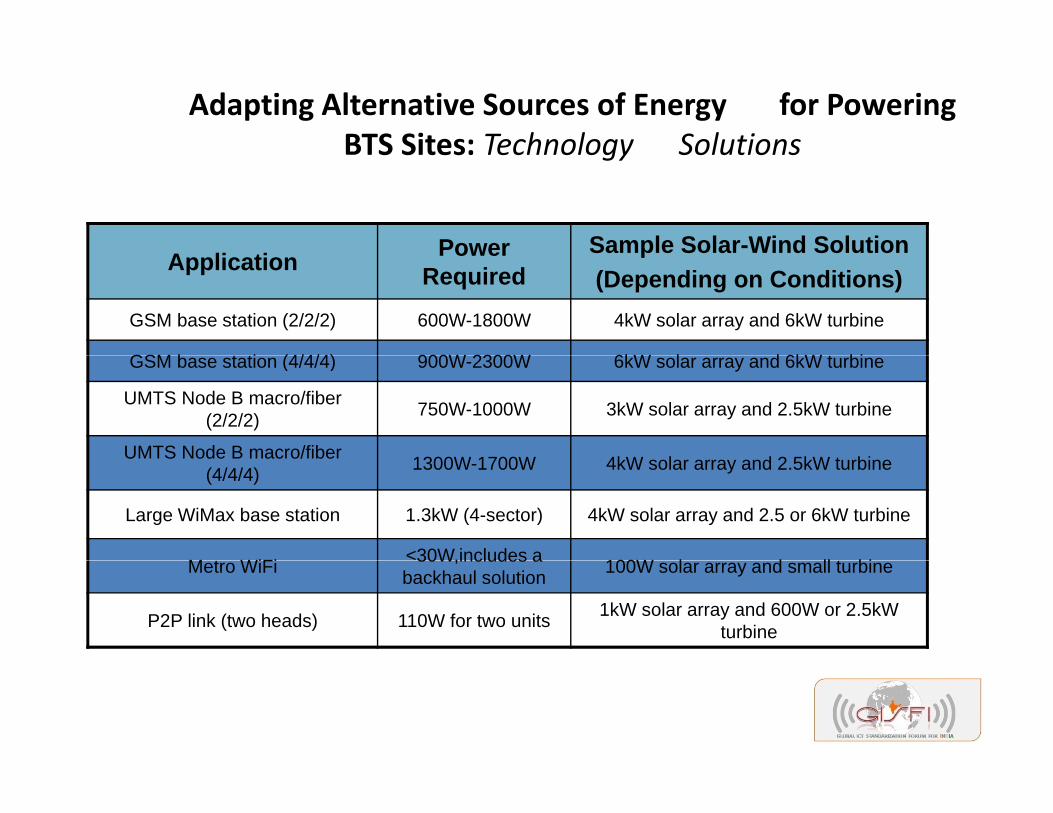
Adapting Alternative Sources of Energy for Powering BTS Sites: Technology SolutionsBTS Sites: Technology Solutions
Power Sample Solar-Wind SolutionApplication Power
RequiredSa p e So a d So ut o(Depending on Conditions)
GSM base station (2/2/2) 600W-1800W 4kW solar array and 6kW turbine
GSM b t ti (4/4/4) 900W 2300W 6kW l d 6kW t biGSM base station (4/4/4) 900W-2300W 6kW solar array and 6kW turbine
UMTS Node B macro/fiber (2/2/2) 750W-1000W 3kW solar array and 2.5kW turbine
UMTS Node B macro/fiber 1300W 1700W 4kW l d 2 5kW t biUMTS Node B macro/fiber (4/4/4) 1300W-1700W 4kW solar array and 2.5kW turbine
Large WiMax base station 1.3kW (4-sector) 4kW solar array and 2.5 or 6kW turbine
M t WiFi <30W,includes a 100W l d ll t biMetro WiFi 30W,includes a backhaul solution 100W solar array and small turbine
P2P link (two heads) 110W for two units 1kW solar array and 600W or 2.5kW turbine

C St dCase Study
Solar Powering of SBI ATM Sites

AssumptionsAssumptions• Peak load of an ATM is 1600 watts.• Activity curve of an ATM site varies from locality to locality and area attributes such as rural, y y y
semi‐urban and urban.• Grid availability varies considerably throughout the state. No authentic data can be given.
However, in rural/remote sites, it varies from 0 hrs a day to 8 hrs a day. In semi‐urban areas, it may be 8 hrs a day to 12 hrs a day and in urban areas it may be 12 hrs a day to 20 hrs a day.
• Rural, semi‐urban and urban areas have different activity curves and peak hit hours.• There are approximately 400 ATM hits/day.• Average transaction time is 30 sec. Power consumption during this time is peaky when
mechanical movement is involved and low during data feeding and idle time.• For a rural ATM, main activity time would be 10 AM to 4 PM.• For a urban site, main activity time would be from 9 AM to 8 PM.• For a rural site, it is estimated that the average power consumption will be 1000 watt during
main activity time and 100 watt during other time of the day.main activity time and 100 watt during other time of the day.• For a urban site, it is estimated that the average power consumption will be 1000 watt during
main activity time and 150 watt during other time of the day

Design parameters for Solar PoweringP l (W) 100Power output per panel (W) 100Rated Voltage (V) 17.2Output voltage per panel (V) 12DOD 0.6Inverter Efficiency 0.9System Voltage (V) 50Peak Load 1000Duration for peak load 6Duration for peak load 6Off-peak load 100Duration for off-peak load 18Grid Availability (hrs) 4
Battery charging rate (Solar) (C/?) 15Battery AH 274.0741Battery charging current 18.2716No. of panels in series 4.166667No. of panels in series (actual) 4No. of strings in parallel 6.582716g pNo. of strings in parallel (actual) 7Total number of panels 28Total power output 2800

Component CostsComponent CostsS.No AH Number Price S.No Cost per watt Panel Wattage Price
1 90 0 0 1 150 2800 420000
Price of Battery bank Price of Solar panel
2 100 0 03 120 0 04 135 0 0 S.No Unit Price Requirement Price5 150 0 0 1 3000 1 30006 165 0 0
Price of Equalizer (12V)
6 165 0 07 180 0 08 200 0 0 S.No Unit Price Requirement Price9 220 0 0 1 5000 4 20,000
10 250 0 0
Price of Battery Coolant
10 250 0 011 300 4 108000
108000 S.No Unit Price Requirement Price1 45700 1 45700
Price of PCU (2 KW, 50V)Total price of the battery bank
(Note: All prices are in INR)
Total 716,040119,340Installation & Commissioning charges

Return on Investment (ROI)
AssumptionsDiesel Price (Rs./liter) 35Diesel usage by DG (Liters/hour) 2F el pilferage/ astage (%) 5%
Assumptions
Fuel pilferage/wastage (%) 5%DG service running hours 250Life of DG (Years) 10Price of DG (7.5 KVA) 200000Scrap value of DG 20000Cost of DG Service 1000Cost of DG Service 1000DG running hours per day 6

Return on Investment (ROI)6 Hr
Usage 12 Hr Usage
18 Hr Usage
R i t 153300 153300 306600 459900
OpEx
Running cost 153300 153300 306600 459900Fuel pilferage/wastage cost 7665.0 7665 15330 22995Fuel filling/transportation charges/year
12000 12000 12000 12000charges/yearNo. of services required 9 9 18 26Service cost 9000 9000 18000 26000Maintenance+ConsumableMaintenance+Consumable spares
10000 10000 16000 22000
Depreciation cost (Straight line)
18000 18000 18000 18000line)Total per year cost (In Rs.) 209965 209965 385930 560895Break-Even Time (Years) 3.41 3.41 1.86 1.28

ThanksThanks