great lakes consortium for fish consumption …...best practice the great lakes consortium for fish...
TRANSCRIPT
Great Lakes Consortium for Fish Consumption Advisories
Best Practice for Perfluorooctane Sulfonate (PFOS) Guidelines
November 2019

Table of Contents
Best Practice.................................................................................................................................................. 1
Background ................................................................................................................................................... 1
History of PFOS Fish Consumption Advisories in the Great Lakes Basin ...................................................... 3
Risk Assessment ............................................................................................................................................ 7
Noncancer toxicity .................................................................................................................................... 7
Cancer toxicity........................................................................................................................................... 8
Exposure Parameters .................................................................................................................................... 9
Meal size and body weight ....................................................................................................................... 9
Relative source ........................................................................................................................................ 10
Exposure reduction factor for cleaning and cooking .............................................................................. 11
Risk-Benefit ................................................................................................................................................. 11
Application of Guidelines ............................................................................................................................ 13
Sample collection .................................................................................................................................... 13
Achievability ............................................................................................................................................ 13
Mixtures ...................................................................................................................................................... 14
Conclusion ................................................................................................................................................... 15
References .................................................................................................................................................. 16
Appendices (available by request) .............................................................................................................. 20
Appendix A Fish PFOS Risk/Benefit Analysis: Comparing the Uncertainty Associated with the Immunotoxicity Component of Risk-Based Intake Values with the Uncertainty of Benefits Lost from Limiting Fish Consumption
Appendix B Review of Epidemiology Evidence for Increased Cholesterol as Critical Endpoint for PFOS Risk Assessment and Summary Statement on Fish CVD Benefit
Appendix C Summary of Human Immunotoxicity Evidence to Support Dose Response and RfD Development
Appendix D Comparison of Values for Exposure Parameters, Associated Assumptions, and Final Guidelines

PFOS Best Practice - 1
Best Practice The Great Lakes Consortium for Fish Consumption Advisories (Consortium) Best Practice for Perfluorooctane Sulfonate (PFOS) Guidelines (Best Practice) is based on the 2016 US EPA Drinking Water Health Advisory reference dose (RfD) of 2x10⁻⁵ milligrams per kilogram per day (mg/kg/day). Resulting PFOS concentrations corresponding to meal frequency categories are shown in Table 1. Consortium members may choose which categories to implement. Through this Best Practice, the Consortium promotes consistency of the basis for fish consumption guidelines.
Table 1. Levels of PFOS in Fish and Corresponding Meal Advice Categories for all Populations
PFOS in Fish (µg/kg) Meal Frequency ≤ 10 Unrestricted > 10-20 2 meals/week > 20-50 1 meal/week > 50-200 1 meal/month > 200 DO NOT EAT
Background The Consortium is a collaboration of fish advisory program managers from U.S. state (Illinois, Indiana, Michigan, Minnesota, New York, Ohio, Pennsylvania, and Wisconsin) governmental health, water quality, and fisheries agencies bordering the Great Lakes, the Ministry of the Environment, Conservation and Parks of Ontario, Canada, and the Great Lakes Indian Fish and Wildlife Commission.
The Consortium originally formed in the early 1980s on an ad hoc basis to share contaminant data and coordinate fish sampling. Later, the group was formally established as the Council of Great Lakes Governors’ Fish Consumption Advisory Task Force as a part of the Great Lakes Toxic Substances Control Agreement of 1986. The Task Force was charged by the Council of Great Lakes Governors with developing common fish advisories for important sport fish species that range widely in open waters of the Great Lakes (i.e., Lakes Superior, Michigan, Huron, Erie, and Ontario). In response, the Task Force developed the Protocol for a Uniform Great Lakes Sports Fish Consumption Advisory (Protocol) for assessing risks and issuing fish consumption advice so that the advice issued by each state bordering the Great Lakes would be consistent in protecting the health of people who eat fish from the Great Lakes. Following development of the Protocol, the Consortium continued to operate less formally through grant funding, and currently functions through US EPA Great Lakes Restoration Initiative grant funding to:
• Provide the primary forum for Great Lakes Fish Advisory Programs to collaborate on generating data for and guidance on developing fish consumption advisories
• Share and review data on fish contaminants
PFOS Best Practice - 2
• Identify and share assessment methods, and promote consistency of health risks and benefits assessments utilized by members to develop fish consumption advice
• Share and coordinate approaches for health education and community engagement
This Best Practice is a product of the Consortium and is intended to reflect the best science for application to fish consumption guidelines and consistent methods for advice determination. Differences in actual advice may exist due to differences in species occurrence, contaminant concentrations, and other implementation factors. Risk Management is a separate process and not addressed in the Best Practice. This Best Practice will be reviewed and updated every two years, or as new science becomes available to the Consortium.
Per- and polyfluoroalkyl substances (PFAS) are chemicals that are used for fire-fighting foams, non-stick materials manufacturing, and many other applications. They are persistent in the environment and can accumulate in living things, including people. One of these PFAS, PFOS, tends to accumulate in fish (e.g., in the muscle tissue and liver) at higher concentrations than the other PFAS, including perfluorooctanoic acid (PFOA). Scientific literature suggests that PFOS concentrations in fish are higher where water PFOS concentrations are higher as evident in reported bioaccumulation factors (Bhavsar et al., 2016).
Epidemiological literature suggests that fish is an important source of exposure to PFOS. Rylander et al. (2009) conducted a small study of Norwegian men and women (n = 60) to investigate predictors of serum PFOS and found that consumption of fatty fish was significantly and positively associated with PFOS concentrations. A subsequent study of coastal and inland Norwegians (n = 174) who participated in a fish and wildlife dietary consumption study examined correlations between serum PFOS and dietary habits; seafood consumption was estimated to account for 81% of total dietary intake of PFOS (Haug et al., 2010). In a targeted investigation of anglers in Germany (n = 105), Holzer et al. (2011) demonstrated a dose-dependent relationship between fish consumption and angler PFOS concentrations. A similar targeted study of French anglers (n = 478) also concluded that freshwater fish consumption was most strongly correlated with serum PFOS (Denys et al., 2014). Finally, a small (n = 74) study of Norwegians who lived near surface waters impacted by aqueous film-forming foams showed that PFOS concentrations were highest among high consumers of freshwater fish caught in polluted waters.
Larger cohort and cross-sectional studies have yielded somewhat conflicting results. Halldorsson et al. (2008) assessed dietary consumption and PFOA and PFOS concentrations in a cohort of pregnant Danish women (n = 1,076); serum PFOS was inversely correlated with fish consumption in both adjusted and unadjusted analyses. However, a cross-sectional study from Yamaguchi et al. (2013) of Japanese men and women (n = 608) found that increased frequency of fish consumption was positively and significantly associated with PFOS concentrations after adjustment for potential confounders. Lastly, a study by Christensen et al. (2017) using National Health and Nutrition Examination Survey (NHANES) data (considering a large population across
PFOS Best Practice - 3
many geographic areas) did not find correlations between fish consumption and increased PFOS concentrations in adjusted analyses, but PFOS was positively associated with shellfish consumption. Levels of fish consumption were generally much lower in NHANES participants compared to those in the Yamaguchi study. Overall, targeted epidemiologic studies have generally found that the body burden of PFOS is positively correlated with fish consumption.
History of PFOS Fish Consumption Advisories in the Great Lakes Basin Several Great Lakes states as well as the Canadian province of Ontario have established fish consumption guidelines at various consumption frequencies and corresponding PFOS concentrations that are meant to be health protective based on noncancer risk assessments (See Table 2). Michigan established fish consumption advice of one meal per week at a maximum concentration of 38 micrograms (µg)/kg and don’t eat advice starting at 300 µg/kg based on an RfD of 1.4x10⁻⁵ mg/kg/day (Michigan Department of Community Health, 2016).
The maximum concentration for one meal per week advice in the Canadian Province of Ontario is 140 µg/kg for the sum of PFAS, and a don’t-eat advisory is issued for the sensitive population (women of child bearing age and children <15 years old) and general population at 140 and 560 µg/kg, respectively, based on a tolerable daily intake (TDI) of 6x10⁻⁵ mg/kg/day (Ontario, 2017; Health Canada, 2016). In 2008, Minnesota developed an approach based on an RfD of 8x10⁻⁵ mg/kg/day, resulting in guideline values of 200 µg/kg for the maximum concentration for one meal per week advice, and don’t-eat advice starting at 800 µg/kg (Minnesota Department of Health, 2008). Wisconsin has issued advice based on Minnesota's approach. In 2018, the Minnesota (MN) and New York fish advisory programs independently adopted the 2016 US EPA RfD of 2x10⁻⁵ mg/kg/day and corresponding advisory guidelines of up to 50 µg/kg for one meal per week advice and 200 µg/kg for triggering don’t-eat advice.

PFOS Best Practice - 4
Table 2. PFOS Noncancer Risk Assessment Summaries, Corresponding Fish Consumption Guidelines, and their Use by Great Lakes Fish Advisory Programs
PFOS RfD/TDI
Oral Exposure
Source
Study Critical Endpoint
Point of Departure (mg/liter
(L) Serum)
Point of Departure for Human Equivalent
Dose (mg/kg/day)
Uncertainty Factors RfD/TDI/MRL Oral Exposure
Value (mg/kg/day)
Maximum Concentration
for Meal/Week
Advice (µg/kg)
Used by Great Lakes Fish Advisory Programs
MN DOH RfD, 2008
Seacat et al., 2002
Liver 35 0.0025 total = 30 (3 for animal to human toxicodynamic differences and 10 for human to human variability)
8 x 10⁻⁵ 200 MN (where data are more than five years old), WI
MI DCH RfD, 2014
Seacat et al., 2002
Liver 5.06 0.00041 total = 30 (3 for animal to human variability not accounted for in the human equivalency dose calculation and 10 for human to human variability)
1.4 x 10⁻⁵ 38 MI
Health Canada, 2016
Butenhoff et al., 2012
Liver 0.0015 total = 25 (2.5 for animal to human variability not accounted for in the human equivalency dose calculation and 10 for human to human variability)
6 x 10⁻⁵
(For the sum of PFAS)
140 (For the sum of PFAS)
Ontario
EPA Health
Luebker et al., 2005
Developmental 6.26 0.00051 total = 30 (3 for animal to human toxicodynamic
2 x 10⁻⁵ 50
MN, NY

PFOS Best Practice - 5
Advisory, 2016
differences and 10 for human to human variability)
MN DOH RfD, 2017
Luebker et al., 2005
Developmental 6.26 0.00051 total = 100 (3 for animal and human toxicodynamic differences, 10 for human to human variability and 3 for database uncertainties regarding immunotoxicity)
5.1 x 10⁻⁶ 10
New Jersey RfD, 2018
Dong et al., 2009
Immune 0.674 total = 30 (3 for animal to human toxicodynamic differences and 10 for human to human variability)
1.8 x 10⁻⁶ 4
ATSDR, 2018
Luebker et al., 2005
Developmental 7.43 0.00051 total = 300 (3 for extrapolation from animals to humans with dosimetric adjustments and 10 for human to human variability) and a modifying factor of 10 for concern that immunotoxicity may be a more sensitive endpoint than developmental toxicity)
2 x 10⁻⁶ 5
EFSA, 2018
Weight of evidence(?)
Cholesterol and immune (epi)
NA NA None 1.8 x 10⁻⁶ 4
PFOS Best Practice - 6
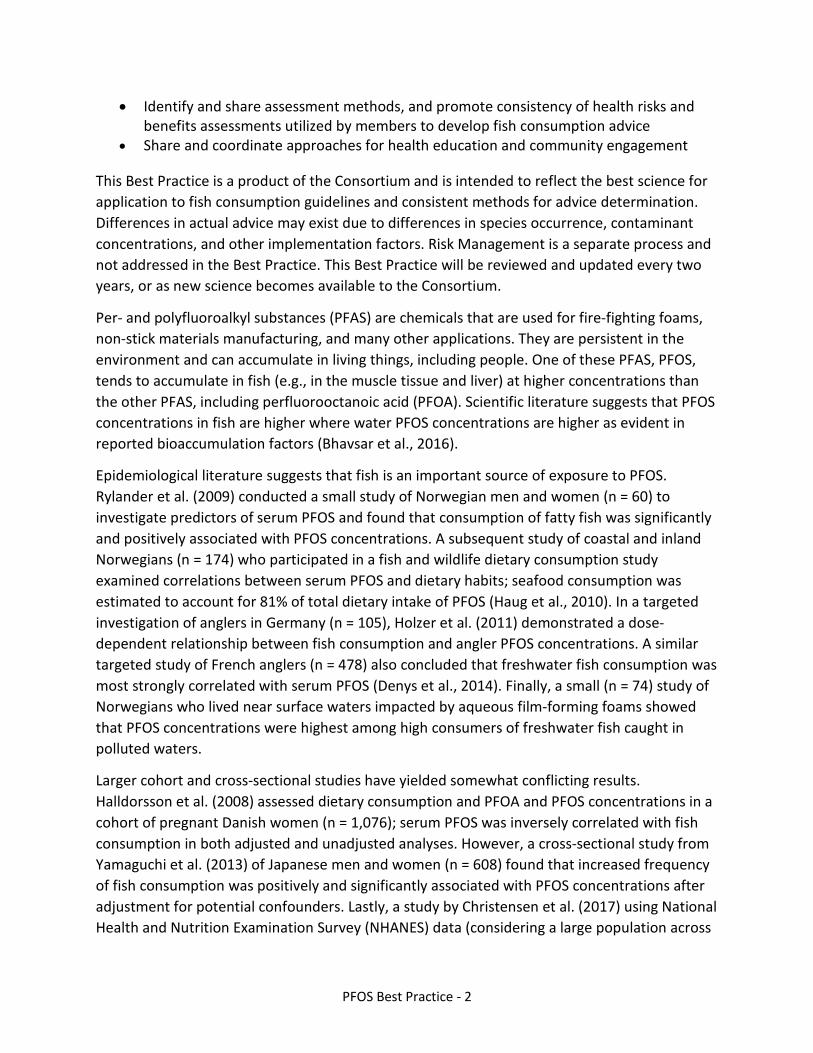
MN DOH RfD, 2019
Dong et al., 2011
Immune 2.36 0.000307 total = 100 (3 for animal to human toxicodynamic differences, 10 for human to human variability, and 3 for database uncertainty (impacts on serum thyroxine (T4) in developing animals have been reported at serum concentrations ~3-fold lower than the POD. Additional studies regarding thyroid effects and a more complete assessment of developmental immune effects are warranted.)
3.1 x 10⁻⁶ 8

PFOS Best Practice - 7
Risk Assessment Noncancer toxicity The most common health risk basis for fish consumption guidelines in the US is noncancer risk. A standard screening level in risk assessment practice for noncancer risks is an HQ (hazard quotient) or hazard index (HI) of 1. Noncancer health effects associated with exposure to PFOS include chronic, developmental, and reproductive effects observed in humans and animals. The noncancer risk assessments reviewed for this Best Practice are listed and summarized in Table 2. The US EPA, in its lifetime drinking water health advisory (US EPA, 2016), derived an RfD for PFOS using scientifically sound methods based on a developmental study in rats, which found reduced pup body weights when exposed during gestation and lactation (Luebker et al., 2005). Because it was based on developmental effects, the US EPA RfD for PFOS is considered to be protective of sensitive subgroups, including children and women of childbearing age. Additionally, the uncertainty factor (UF) applied to the human equivalent dose (HED) for the no observable effect level (NOEL) of 0.00051 mg/kg/day is 30 (three for animal-to-human toxicodynamic differences times 10 for human-to-human variability) providing a reasonable margin of protection. Therefore, the Consortium recommends 2 x 10⁻⁵ mg/kg/day (US EPA, 2016) as the noncancer toxicity value for use in the derivation of the risk-based fish consumption guidelines for PFOS for this Best Practice document.
Other recent toxicity values for PFOS have been developed based upon the same Luebker et al. (2005) study that USEPA used and, therefore, the same developmental end points, including the ATSDR 2018 minimum risk level (MRL) and the MN 2017 RfD. However, these toxicity values are lower because ATSDR and MN accounted for uncertainty associated with the immunotoxicity endpoints in mice (Dong et al., 2009). The ATSDR draft MRL is 2x10⁻⁶ mg/kg/day after applying a 10x modifying factor and the MN (2017) RfD is 5.1x10⁻⁶ mg/kg/day after applying a 3x modifying factor.
Other reports deriving lower toxicity values than USEPA 2016 are based on the immunotoxicity end points. New Jersey (NJ) Dept of Environmental Protection (NJ DWQI, 2018) and MN (2019) derived RfDs not very different from the ATSDR MRL of 2x10⁻⁶ mg/kg/d based upon a total level of uncertainty of 30- to 100-fold from the immunotoxicity dose response in Dong et al., 2009. These RfDs as well as those described above (MN 2017, ATSDR 2018) all rely to one degree or another on immunotoxicity and involve a sizeable degree of uncertainty, which is exemplified by the approximately 150-fold gap between the LOAEL for immunotoxicity in Dong et al. 2009 and an RfD of 2x10⁻⁶ mg/kg/d, as summarized in a report developed for the Consortium (Appendix A). Given that the RfDs/MRLs derived by ATSDR, MN, and NJ were derived for a general oral dose (discounting the media involved), these additional uncertainty factors are prudent. However, from a fish advisory perspective, it is important to recognize the added likelihood of benefits on immune function from fish consumption. Much of this fish benefit could be lost if a more conservative RfD based upon prevention of PFOS-related immunotoxicity were to be used. The degree to which this immune benefit from fish consumption may help

PFOS Best Practice - 8
offset the uncertainty associated with a low dose effect of PFOS on immune function is further discussed below (See Risk-Benefit section).
Another detailed literature review by the European Food Safety Authority (EFSA, 2018) derived a tolerable weekly intake (TWI) of 13 x 10-6 mg/kg for PFOS, which converts to 1.8x10⁻⁶ mg/kg/day. The TWI is based upon cholesterol and immunotoxicity endpoints in human studies, some involving populations eating large quantities of fish. However, as reviewed by the Consortium (see Appendix B and C), both the epidemiology-based cholesterol and immunotoxicity dose-response profiles have numerous confounding and interpretative issues, and so the uncertainties are at least as great with these derivations as with the animal-based immunotoxicity-based RfDs described above. Again, the uncertainty in the EFSA cholesterol and immunotoxicity analyses is in some measure counterbalanced by the benefits of fish consumption on both endpoints as discussed below and in Appendix A.
Cancer toxicity Health protective fish consumption guidelines developed by states and tribes have traditionally not been based on specific cancer risk targets. Reasons for this include the uncertainty in cancer risk assessment, low level of cancer risks associated with exposure compared to the background rate of cancer, and the inherent protection against cancer risk provided by protection against noncancer risk (Great Lakes Sport Fish Advisory Task Force, 1993). Other reasons given have been the overly conservative nature of cancer risk estimates, correspondingly much lower fish consumption guidelines, and the fear the public has about cancer – all of which could result in reduced fish consumption and accompanying benefits (Stone et al., 2014). Furthermore, cancer risk estimates assume exposure over a lifetime, which may not be consistent with typical anglers’ exposure. Nonetheless, cancer risk was an ancillary consideration in development of the PCB Protocol as part of the weight-of-evidence approach and with the understanding that the guidelines are supportive of the 10-6 to 10-4 lifetime cancer risk range which is commonly considered for cancer risk screening in risk assessment practice across multiple media (Great Lakes Sport Fish Advisory Task Force, 1993).
In their 2016 Drinking Water Health Advisory, US EPA concluded there is only suggestive evidence of carcinogenic potential for PFOS (US EPA, 2016). They reported that epidemiology studies did not find a direct correlation between PFOS exposure and the incidence of carcinogenicity in humans. In animal studies, identified tumors did not show a direct relationship to dose, and the evidence for cancer in animals was judged by US EPA to be too limited to support a quantitative cancer assessment. While the New Jersey Drinking Water Quality Institute (2018) did conduct a quantitative cancer risk assessment, it acknowledged the greater uncertainty associated with cancer risk precluded its use for the derivation of a health-based guideline (for drinking water) (NJ DWQI, 2018). Due to the uncertainties and limited evidence of cancer risk, the better non-cancer effects database, the greater consensus that noncancer PFOS effects occur, and the reasons for putting

PFOS Best Practice - 9
greater emphasis on non-cancer risk for fish advisories in general as outlined above, the Consortium recommends that fish consumption guidelines be based on a noncancer endpoint.
Exposure Parameters Meal size and body weight Regulatory requirements of some state and federal programs may dictate that specific exposure factors (e.g., body weight) be used in the risk assessment process. However, fish advisory programs, due to their non-regulatory nature and in consideration of the benefits of fish consumption, have traditionally maintained more autonomy in choices of exposure factors. Some state fish advisory programs may rely upon different values for exposure parameters, and these choices may or may not have significant effects on calculated guidelines.
For the Great Lakes Task Force Protocol for a Uniform Great Lakes Sport Fish Consumption Advisory (Anderson et al., 1993) (PCB Protocol), the Task Force agreed to the use of 227 grams (g) (equal to ½ pound (lb)) of raw fish and 70 kg as the uniform meal size and body weight (BW), respectively, with the assumption that meal size changes proportionally with body weight. The PCB Protocol stated that the 227 g meal size appeared to be the most widely used for exposure assessment, often with the caveat that any overestimate provides an additional "margin of safety." This ratio approach was also used in A Protocol for Mercury-based Fish Consumption Advice (Great Lakes Consortium for Fish Consumption Advisories, 2007) (Mercury Protocol).
Meal Frequency Concentration �𝝁𝝁𝝁𝝁𝝁𝝁 � =
RfD � 𝝁𝝁𝝁𝝁𝒌𝒌𝝁𝝁 ∙ 𝒅𝒅𝒅𝒅𝒅𝒅� × BW (kg)
Consumption rate (g/day)
Few studies have surveyed typical fish meal sizes. The average meal size in two studies reported in the 2011 US EPA Exposure Factors Handbook was around 117 and 114 g (¼ lb) (Pao et al., 1982; Smiciklas-Wright et al., 2002). Table 8-1 in Chapter 8 of the 2011 US EPA’s Exposure Factors Handbook shows the mean body weight for all adults (male and female, all age groups combined) is 80 kg (US EPA, 2011). Federal and state agencies have begun using this higher body weight for risk calculations (for example, https://www.epa.gov/risk/regional-screening-levels-rsls-equations).
A body weight of 75 kg was assumed for the 2017 EPA- FDA Advice about Eating Fish and Shellfish (US EPA-US FDA, 2017) meal frequency calculations, based on the average body weight of a pregnant woman per the 2011 US EPA Exposure Factors Handbook (US EPA, 2018). They assumed a 75 kg woman would eat a serving size of 113 grams (1/4 lb) raw fish weight based on US FDA reference amounts consumed for fish and shellfish. Because the meal size is half the

PFOS Best Practice - 10
amount assumed by the Consortium for a similar body weight, the US EPA-US FDA advice is to consume fish about twice as often.
PFOS concentration ranges corresponding to meal frequency categories in this Best Practice accommodate the different meal size, body weight assumptions, rounding conventions, and approaches to calculating intake used by Consortium members. For example, New York State assumed a half pound meal per week resulted in a consumption rate of 32.4 g/day (versus the Consortium’s 32 g/day), and that a half pound meal per month was a quarter of that or 8.1 g/day (vs. the Consortium’s 7.4 g/day). New York State assumed a body weight of 80 kg while the Consortium has used 70 kg. After calculations and rounding using the equations below, both approaches arrived at the same guidelines (see Appendix D).
Concentration meal frequency category �𝛍𝛍𝛍𝛍𝛍𝛍� =
RfD � 𝛍𝛍𝛍𝛍𝐤𝐤𝛍𝛍 ∙ 𝐝𝐝𝐝𝐝𝐝𝐝� × BW (kg)
Consumption rate (g/day)
Where:
Relative source Populations that eat fish from a specific waterbody may have various “background” sources of exposure to PFOS (including fish consumption from other water bodies), in addition to exposure due to consumption of fish from the specific waterbody that contribute to a larger total exposure. In non-cancer risk assessment, there may be an exposure threshold above which there are observable adverse effects. Therefore, total exposure inclusive of background exposures may be considered when determining exposure guidelines based on non-cancer endpoints, such as fish consumption guidelines for PFOS. This consideration could result in limiting the “relative source contribution” (RSC) of fish consumption to reduce the likelihood that total exposure exceeds a risk target. In Table 3, we used NHANES data on “background” population PFOS levels in blood serum to calculate background exposure, and then compared background exposure to exposures for a 70 kg adult eating one meal per month of fish containing 50 µg/kg PFOS (the lower potential exposure in the 1 meal/month concentration range of 50-200 µg/kg) as a conservative approach for this calculation. This analysis indicates the dominant PFOS exposure pathway for someone eating a meal per month from a waterbody with a meal/month advisory would be fish consumption by far, and thus further consideration of background exposure and an RSC limit is not needed.
Consumption rate (g/day) = 𝐌𝐌𝐌𝐌𝐝𝐝𝐌𝐌 𝐬𝐬𝐬𝐬𝐬𝐬𝐌𝐌 (𝛍𝛍) 𝐱𝐱𝐌𝐌𝐌𝐌𝐝𝐝𝐌𝐌𝐬𝐬𝐘𝐘𝐌𝐌𝐝𝐝𝐘𝐘
𝐱𝐱𝐘𝐘𝐌𝐌𝐝𝐝𝐘𝐘
𝟑𝟑𝟑𝟑𝟑𝟑 𝐝𝐝𝐝𝐝𝐝𝐝𝐬𝐬

PFOS Best Practice - 11
Table 3. PFOS Exposure from Fish Consumption vs. Background Exposure
Background Blood Serum Concentration (ng/mL)
Background Exposure (ng/kg/day) *
Exposure from Eating One Fish Meal/Month Containing 50 µg/kg PFOS (ng/kg/d)
Relative Source Contribution of Fish to Background (%)
Geometric mean
5.22 0.423 5.4 93%
95th percentile
19.5 1.58 5.4 77%
Source/ Derivation
NHANES, 2013-2014, age 20 and older
One compartment PFOS pharmaco-kinetic model, USEPA 2016 parameters
50 μgkg ∗ 0.227 kg ∗ 1000 ng
μg70 kg ∗ 30 days
Fish Exposure ∗ 100Fish Expos. + Background Expos.
* 𝐵𝐵𝐵𝐵𝐵𝐵𝐵𝐵𝐵𝐵𝐵𝐵𝐵𝐵𝐵𝐵𝐵𝐵𝐵𝐵 𝐸𝐸𝐸𝐸𝐸𝐸𝐵𝐵𝐸𝐸𝐵𝐵𝐵𝐵𝐸𝐸 �𝑛𝑛𝑛𝑛𝑘𝑘𝑛𝑛
𝑑𝑑𝑑𝑑𝑑𝑑� = 𝑏𝑏𝐵𝐵𝐵𝐵𝐵𝐵𝐵𝐵𝐵𝐵𝐵𝐵𝐵𝐵𝐵𝐵𝐵𝐵 𝐸𝐸𝐸𝐸𝐵𝐵𝐵𝐵𝑠𝑠 𝐵𝐵𝐵𝐵𝐵𝐵𝐵𝐵. �𝑛𝑛𝑛𝑛
𝑚𝑚𝑚𝑚� ∗ 𝑉𝑉𝐵𝐵𝑉𝑉. 𝐵𝐵𝑜𝑜 𝐷𝐷𝐷𝐷𝐸𝐸𝐷𝐷𝐵𝐵𝐷𝐷𝑏𝑏𝐵𝐵𝐷𝐷𝐷𝐷𝐵𝐵𝐵𝐵 �𝑚𝑚𝑚𝑚
𝑘𝑘𝑛𝑛� ∗ ln(2)
𝑡𝑡1/2 (𝑑𝑑𝑑𝑑𝑑𝑑𝑑𝑑)
With half-life (t1/2) of 1,971 days; volume of distribution of 230 ml/kg.
Exposure reduction factor for cleaning and cooking Unlike PCBs and other organochlorine contaminants, PFOS does not preferentially accumulate in fatty tissue. Therefore, methods of removing fat through skinning, trimming, and cooking that would result in a substantial reduction in exposure for PCBs (assumed exposure reduction factors of 50% and 30% depending upon the species per the Consortium’s PCB Protocol) are not expected to result in any reduction of exposure for PFOS (0% exposure reduction).
Risk-Benefit It has become increasingly clear that the health effects of exposure to contaminants from eating fish may be modified by fish nutrients, including, omega-3 fatty acids (Ginsberg and Toal, 2008; Gochfeld and Burger, 2005; Stern and Korn, 2011; Groth, 2016; Mahaffey et al., 2011) . These nutrients co-occur with contaminants and have benefits on a wide range of human health endpoints including neurodevelopment, blood lipids and cardiovascular health, and immune system function (Mozafarian and Rimm, 2006; Strain et al., 2015; Innis, 2007; Ginsberg et al., 2015). Setting fish consumption guidelines should therefore take into consideration the benefit of fish consumption, and the degree to which this may offset the adverse effects of fish contaminants.
Fish are the main dietary sources of beneficial nutrients such as omega-3 fatty acids, which are antioxidant and anti-inflammatory and thus beneficial to several systems in the body (Mahaffey et al., 2008; Williams et al., 2017). The most sensitive toxic effects of PFOS are on fetal

PFOS Best Practice - 12
development, immune function, and liver toxicity. Omega-3 fatty acids have beneficial effects in each of these areas and, thus to some degree, may offset the adverse effects of PFOS in fish.
PFOS adverse effects have been demonstrated primarily in animal exposure studies and in human epidemiology studies involving contaminated drinking water. There are few epidemiology studies describing the effect of PFOS on human health from fish ingestion. Thus, the extent to which PFOS adverse effects will be observed in fish eating populations is uncertain.
The potential risk for higher cholesterol and related cardiovascular disease (CVD) effects from the ingestion of PFOS in fish should be considered in light of the well documented benefits of fish consumption on similar endpoints. For example, an analysis of 20 different prospective cohort or dietary intervention studies found that omega-3 fatty acids consistently had an effect on decreasing acute myocardial events (Mozzafarian and Rimm, 2006). A benefit slope from this evidence (14.6% decrease in CVD mortality per 100 mg/day chronic ingestion of omega-3 fatty acids) was incorporated in a fish risk-benefit model, which showed substantial CVD benefit from ingestion of most species of commonly available commercial fish, in spite of the mercury content of these fish (Ginsberg and Toal, 2009). The association between fish consumption in general, and omega-3 fatty acids in particular, on CVD outcomes is supported by evidence that fatty fish consumption is associated with improved blood lipid profiles (lowered triglycerides, increased HDL-cholesterol) (Hagen et al., 2016). A recent review of the metabolic and heart health benefits of fish also highlights the evidence that lean fish, even though they do not contribute much omega-3 fatty acids, contain nutrients that can be beneficial to cardiovascular health (Torris et al., 2018). Human studies on associations between fish consumption and CVD indicate an inverse relationship, while associations between intake of omega-3 fatty acid supplements and CVD are unclear (Hooper et al., 2006; He et al., 2004). Thus, a substantial blood lipid and cardiovascular benefit would likely be lost if highly restrictive fish consumption advice were put into place. This lost benefit should be at least qualitatively considered for PFOS-based consumption advisories aimed at preventing cholesterol elevation and cardiovascular risk. This is especially the case given the fish oil benefit appears to impact disease, while as summarized above, the evidence for PFOS effect is only at the level of blood lipid perturbation but not actual worsening of CVD.
The potential benefits of fish consumption on immune endpoints is also well documented. As summarized in Appendix A, this benefit has been shown in omega-3 fatty acid supplementation studies in animals and humans as well as omega-3 fatty acid dosing studies in animals. These studies have shown decreased allergy and inflammation and increased vaccination response and host resistance to infection. While the mechanism and dose response for these beneficial effects have not been fully explored, it is clear that there is a health benefit from fish oils and possibly other fish nutrients that could be lost from very restrictive consumption advice. Therefore, the Consortium recognizes the potential risks/benefits of consuming fish when recommending the PFOS fish consumption guidelines best practices in this document.
PFOS Best Practice - 13
Application of Guidelines Sample collection PFOS is distributed differently among fish tissues compared to other contaminants. While it is found in muscle tissue like mercury, it has also been found in fish skin and can have high concentrations in blood and particularly the liver (Honda et al., 2018). Nonetheless, the standard Consortium fish flesh sample collection protocol of using a raw, skin-on fillet with an exception for certain species as described in the PCB Protocol is likely to adequately characterize the PFOS levels in the most commonly eaten portions of fish.
Achievability Background concentrations of PFOS in fish can provide an indication of the likelihood that a guideline could be achieved while still preserving some waters for fish consumption. Relatively pristine and remote waterbodies subject only to atmospheric deposition appear to have relatively low levels of PFOS in fish. For example, a recent study in Sweden reported concentrations in Yellow Perch as low as 0.31 µg/kg in one lake (Åkerblom et al., 2017). In New York, sampling conducted in two reference waters with no known sources found species-specific mean PFOS concentrations ranging from <1 to 9.8 µg/kg (n = 52) (NYSDEC, 2018). However, waterbodies in populated areas potentially impacted by surface water runoff, wastewater treatment plant effluent, and other potential sources may have higher levels. Examining surveys of US rivers and streams will illustrate the prevalence of fish with elevated concentrations of PFOS.
US EPA examined PFAS in freshwater fish on the national scale using a probability design as part of US EPA's 2008–2009 National Rivers and Streams Assessment (NRSA), with results published in 2014 (Stahl et al., 2014). The assessment included 682 fish of 25 species (primarily Largemouth Bass, Smallmouth Bass, and Channel Catfish) from 164 randomly selected urban river sampling sites; one composite sample of five individual fish were processed as skin-on fillets for a single commonly occurring predatory species per site (total of 162 composites). Based on national data downloaded from the US EPA web site, median PFOS and total PFAS concentrations were 17 and 20 µg/kg, respectively, and the maximum PFOS and total PFAS concentrations were 127 and 139 µg/kg, respectively (US EPA, 2009). The NRSA was repeated in 2013-2014, resampling many of the same rivers, with median PFOS and total PFAS concentrations of 6.6 and 8.5 µg/kg, respectively, and maximum PFOS and total PFAS concentrations of 283 and 286 µg/kg, respectively. Results are not yet publicly available.
Of the species sampled in these US EPA studies, Smallmouth and Largemouth Bass tended to have the highest concentrations of PFOS. These species have also been found to have relatively high levels in other studies. Although these bass are predator species that would be expected to accumulate high levels of contaminants over their lifespans, the reasons for differences among other species are not well understood. For example, some studies have reported that panfish like Sunfish and crappie species, which would be expected to have low levels of

PFOS Best Practice - 14
contaminants like mercury or PCBs, can have among the highest levels of PFOS in a waterbody (MN Pollution Control Agency, 2008).
For this Best Practice document, a Monte Carlo simulation was performed to better characterize distributions of PFOS fish concentrations for the eight Consortium states based on data extracted from the 50 rivers sampled in 2008-2009 and the 96 rivers sampled in 2013-2014, as part of the US EPA’s NRSA program. For the 2008-2009 period, approximately 40.7 % of simulated PFOS concentrations are below 10 µg/kg, 48.5 % are between 10 and 50 µg /kg, and 10.2 % of the values are between 50 and 200 µg/kg. For the 2013-2014 period, approximately 53.0 % of the simulated concentrations are below 10 µg/kg, 41.2 % are between 10 and 50 µg /kg, and 5.6 % of the values are between 50 and 200 µg/kg. Thus, if a lower toxicity value than the 2016 US EPA RfD was used, fish from numerous waterbodies throughout the Great Lakes states could trigger the correspondingly more stringent guidelines where advice for other contaminants is less restrictive.
Mixtures The Consortium developed a Best Practices for Risk Assessment of Chemical Mixtures (Great Lakes Consortium for Fish Consumption Advisories, 2018), which concluded that additive effects of chemicals should only be considered if it was known that the mode of action and target organ were shared. Adverse noncancer effects observed following exposures to PFOA are the same or similar to those of PFOS and include effects in humans (on serum lipids, birth weight, and serum antibodies) and in animals (common tumors and effects on the liver, neonate development, and responses to immunological challenges). While data are sparse, other PFAS may have similar effects, although lower carbon PFAS (e.g., <6 carbons) may be less toxic. The 2016 US EPA RfDs for both PFOA and PFOS are based on similar developmental effects and are numerically identical. For this reason, US EPA issued their drinking water lifetime health advisory level of 70 nanograms per liter (ng/L) for the sum of PFOS and PFOA. Nonetheless, the modes of action of other PFAS are not well understood. For example, the Michigan Scientific Advisory Panel concluded that there was no scientific consensus at this point on how to combine risks for PFAS analytes for human health risk assessment (Michigan PFAS Science Advisory Panel, 2018). As a general observation, PFOS seems to contribute ~75% or more of the total commonly measured PFAS concentration in fish (e.g., average 79% of total 13 measured PFAS in the NRSA study (USEPA, 2009)), although this can be lower at low concentrations (e.g., <20 µg/kg) particularly if another PFAS rather than PFOS is the primary site contaminant.
A conservative approach for applying a PFOS fish advisory guideline would be to apply it to the sum of all measured PFAS. However, laboratories may vary in the specific PFAS (and the number thereof) included in their analysis, and this approach for application of the guideline could result in the identity and number of the specific compounds analyzed affecting the total concentration. Further, laboratories seem to be offering analytical results for an increasing

PFOS Best Practice - 15
large number of PFAS. Additionally, because of the dominance of PFOS in fish, the added complexity of summing PFAS before comparing the guideline may result in little added conservatism. Finally, data suggest that some PFAS (e.g., PFBS) have much lower toxicity than PFOS (US EPA, 2018).
The Province of Ontario currently applies its guidelines to the sum of PFAS, but no Great Lakes state with PFOS-based advisories apply their guidelines to the sum of PFOS and PFOA or other PFAS.
Due to the paucity of data indicating a shared mode of action and target organ across multiple PFAS, consistent with the Best Practice for Risk Assessment of Chemical Mixtures, the Consortium recommends that fish consumption advice be based on PFOS levels only. However, the Consortium also recommends that the literature be reviewed every 2 years (or sooner if critical new information becomes available) to evaluate if other PFAS should be included in a mixtures calculation. Members will submit new evidence that emerges for Consortium review.
Conclusion In conclusion, considering noncancer and cancer risk levels, historical precedents of the Consortium, amenability to communication with the public (e.g., in light of communication of other states’ advisories), the potential for nearly ubiquitous low levels of PFOS in fish, and recognition of the benefits of angling and eating fish, the Best Practice for PFOS recommended by the Consortium is: adoption of guidelines for PFOS exposure via fish consumption using the 2016 US EPA Health Advisory RfD and a HQ of one for risk-based fish consumption guidance. The determined UF of 30 based on developmental effects indicates a substantial measure of protection, and the 2x10⁻⁵ mg/kg/day RfD would provide a reasonable basis to limit to fish ingestion that does not restrict all health benefits associated with fish consumption and angling. This RfD also affords a reasonable margin of protection beyond the immunotoxicity NOEL reported in mice that was part of the basis for several PFOS RfDs and the ATSDR MRL.

PFOS Best Practice - 16
References
Åkerblom, S., Negm, N., Wu, P., Bishop, K., & Ahrens, L. (2017). Variation and accumulation patterns of poly-and perfluoroalkyl substances (PFAS) in European perch (Perca fluviatilis) across a gradient of pristine Swedish lakes. Science of the Total Environment, 599, 1685-1692.
Anderson, H. A., Amrhein, J., Shubat, P., & Hesse, J. (1993). Great Lakes Sport Fish Advisory Task Force. Protocol for a Uniform Great Lakes Sport Fish Consumption Advisory.
Bhavsar, S. P., Fowler, C., Day, S., Petro, S., Gandhi, N., Gewurtz, S. B., Hao, C., Zhao, X., Drouillard, K.G, & Morse, D. (2016). High levels, partitioning and fish consumption based water guidelines of perfluoroalkyl acids downstream of a former firefighting training facility in Canada. Environment international, 94, 415-423.
Butenhoff, J. L., Chang, S. C., Olsen, G. W., & Thomford, P. J. (2012). Chronic dietary toxicity and carcinogenicity study with potassium perfluorooctanesulfonate in Sprague Dawley rats. Toxicology, 293(1-3), 1-15.
Christensen, K. Y., Raymond, M., Blackowicz, M., Liu, Y., Thompson, B. A., Anderson, H. A., & Turyk, M. (2017). Perfluoroalkyl substances and fish consumption. Environmental research, 154, 145-151.
Denys, S., Fraize-Frontier, S., Moussa, O., Le Bizec, B., Veyrand, B., & Volatier, J. L. (2014). Is the fresh water fish consumption a significant determinant of the internal exposure to perfluoroalkylated substances (PFAS)?. Toxicology letters, 231(2), 233-238.
Dong, G. H., Liu, M. M., Wang, D., Zheng, L., Liang, Z. F., & Jin, Y. H. (2011). Sub-chronic effect of perfluorooctanesulfonate (PFOS) on the balance of type 1 and type 2 cytokine in adult C57BL6 mice. Archives of toxicology, 85(10), 1235-1244.
Dong, G. H., Zhang, Y. H., Zheng, L., Liu, W., Jin, Y. H., & He, Q. C. (2009). Chronic effects of perfluorooctanesulfonate exposure on immunotoxicity in adult male C57BL/6 mice. Archives of toxicology, 83(9), 805-815.
EFSA Panel on Contaminants in the Food Chain (CONTAM), Knutsen, H. K., Alexander, J., Barregård, L., Bignami, M., Brüschweiler, B., ... & Grasl-Kraupp, B. (2018). Risk to human health related to the presence of perfluorooctane sulfonic acid and perfluorooctanoic acid in food. EFSA Journal, 16(12), e05194.
Ginsberg, G. L., & Toal, B. F. (2008). Quantitative approach for incorporating methylmercury risks and omega-3 fatty acid benefits in developing species-specific fish consumption advice. Environmental Health Perspectives, 117(2), 267-275.
Ginsberg, G. L., Toal, B. F., & McCann, P. J. (2015). Updated risk/benefit analysis of fish consumption effects on neurodevelopment: Implications for setting advisories. Human and Ecological Risk Assessment: An International Journal, 21(7), 1810-1839.
Gochfeld, M., & Burger, J. (2005). Good fish/bad fish: a composite benefit–risk by dose curve. Neurotoxicology, 26(4), 511-520.

PFOS Best Practice - 17
Great Lakes Consortium for Fish Consumption Advisories. (2007). A Protocol for Mercury-based Fish Consumption Advice.
Great Lakes Consortium for Fish Consumption Advisories. (2018). Best Practices for Risk Assessment of Chemical Mixtures.
Groth E., (2016). Scientific foundations of fish-consumption advice for pregnant women: Epidemiological evidence, benefit-risk modeling, and an integrated approach. Environmental Research, 152, 386-406.
Hagen, I. V., Helland, A., Bratlie, M., Brokstad, K. A., Rosenlund, G., Sveier, H., ... & Gudbrandsen, O. A. (2016). High intake of fatty fish, but not of lean fish, affects serum concentrations of TAG and HDL-cholesterol in healthy, normal-weight adults: a randomised trial. British Journal of Nutrition, 116(4), 648-657.
Halldorsson, T. I., Fei, C., Olsen, J., Lipworth, L., Mclaughlin, J. K., & Olsen, S. F. (2008). Dietary predictors of perfluorinated chemicals: a study from the Danish National Birth Cohort. Environmental science & technology, 42(23), 8971-8977.
Haug, L. S., Thomsen, C., Brantsæter, A. L., Kvalem, H. E., Haugen, M., Becher, G., Alexander, H., Meltzer, M., & Knutsen, H.K. (2010). Diet and particularly seafood are major sources of perfluorinated compounds in humans. Environment international, 36(7), 772-778.
He, K., Song, Y., Daviglus, M. L., Liu, K., Van Horn, L., Dyer, A. R., & Greenland, P. (2004). Accumulated evidence on fish consumption and coronary heart disease mortality: a meta-analysis of cohort studies. Circulation, 109(22), 2705-2711.
Health Canada. (2016). Perfluorooctane Sulfonate (PFOS) in Drinking Water. Federal-Provincial-Territorial Committee on Drinking Water. Retrieved from https://www.canada.ca/en/health-canada/programs/consultation-perfluorooctane-sulfonate-pfos-in-drinking-water/document.html.
Hölzer, J., Göen, T., Just, P., Reupert, R., Rauchfuss, K., Kraft, M., Müller, J., & Wilhelm, M. (2011). Perfluorinated compounds in fish and blood of anglers at Lake Mohne, Sauerland area, Germany. Environmental science & technology, 45(19), 8046-8052.
Honda, M., Muta, A., Shimazaki, A., Akasaka, T., Yoshikuni, M., Shimasaki, Y., & Oshima, Y. (2018). High concentrations of perfluorooctane sulfonate in mucus of tiger puffer fish Takifugu rubripes: a laboratory exposure study. Environmental Science and Pollution Research, 25(2), 1551-1558.
Hooper, L., Thompson, R. L., Harrison, R. A., Summerbell, C. D., Ness, A. R., Moore, H. J., Worthington, H.V., Durrington, P.N., Higgins, J.P., Capps, N.E., & Riemersma, R. A. (2006). Risks and benefits of omega 3 fats for mortality, cardiovascular disease, and cancer: systematic review. Bmj, 332(7544), 752-760.
Innis, S. M. (2007). Dietary (n-3) fatty acids and brain development. The Journal of nutrition, 137(4), 855-859.
Luebker, D. J., York, R. G., Hansen, K. J., Moore, J. A., & Butenhoff, J. L. (2005). Neonatal mortality from in utero exposure to perfluorooctanesulfonate (PFOS) in Sprague–Dawley rats: dose–response, and biochemical and pharamacokinetic parameters. Toxicology, 215(1-2), 149-169.

PFOS Best Practice - 18
Mahaffey, K. R., Clickner, R. P., & Jeffries, R. A. (2008). Methylmercury and omega-3 fatty acids: co-occurrence of dietary sources with emphasis on fish and shellfish. Environmental Research, 107(1), 20-29.
Mahaffey, K. R., Sunderland, E. M., Chan, H. M., Choi, A. L., Grandjean, P., Mariën, K., ... & Yan, C. H. (2011). Balancing the benefits of n-3 polyunsaturated fatty acids and the risks of methylmercury exposure from fish consumption. Nutrition reviews, 69(9), 493-508.
Michigan Department of Community Health. (2016). Michigan Fish Consumption Advisory Program – Guidance Document. Retrieved from https://www.michigan.gov/documents/mdch/MFCAP_Guidance_Document_500546_7.pdf
Michigan PFAS Science Advisory Panel (2018). Scientific Evidence and Recommendations for Managing PFAS Contamination in Michigan. Lansing, MI.
Minnesota Department of Health. (2008). Health risk limits for perfluorochemicals: report to the Minnesota legislature.
Minnesota Pollution Control Agency. (2008). PFCs in Minnesota’s Ambient Environment: 2008 Progress Report. Retrieved from https://www.pca.state.mn.us/sites/default/files/c-pfc1-02.pdf
Mozaffarian, D., & Rimm, E. B. (2006). Fish intake, contaminants, and human health: evaluating the risks and the benefits. Jama, 296(15), 1885-1899.
New Jersey Drinking Water Quality Institute (NJ DWQI). (2018). Appendix A Health-based Maximum Contaminant Level Support Document: Perfluorooctane Sulfonate (PFOS). Retrieved from https://www.state.nj.us/dep/watersupply/pdf/pfos-recommendation-appendix-a.pdf
New York State Department of Environmental Conservation (NYSDEC), unpublished data. (2018).
Ontario. (2015). Guide to Eating Ontario Fish 2017 – 2018. Ontario Ministry of the Environment and Climate Change. Retrieved from https://www.ontario.ca/page/eating-ontario-fish-2017-18.
Pao, E. M., Fleming, K. H., Guenther, P. M., & Mickle, S. J. (1982). Foods commonly eaten by individuals: amount per day and per eating occasion.
Rylander, C., Brustad, M., Falk, H., & Sandanger, T. M. (2009). Dietary predictors and plasma concentrations of perfluorinated compounds in a coastal population from northern Norway. Journal of environmental and public health, 2009.
Seacat, A. M., Thomford, P. J., Hansen, K. J., Olsen, G. W., Case, M. T., & Butenhoff, J. L. (2002). Subchronic toxicity studies on perfluorooctanesulfonate potassium salt in cynomolgus monkeys. Toxicological Sciences, 68(1), 249-264.
Smiciklas-Wright, H., Mitchell, D. C., Mickle, S. J., Cook, A. J., & Goldman, J. D. (2002). Foods commonly eaten in the United States. US Department of Agriculture NFS report, 965, 1-264.
Stahl, L. L., Snyder, B. D., Olsen, A. R., Kincaid, T. M., Wathen, J. B., & McCarty, H. B. (2014). Perfluorinated compounds in fish from US urban rivers and the Great Lakes. Science of the Total Environment, 499, 185-195.

PFOS Best Practice - 19
Stern, A. H., & Korn, L. R. (2011). An approach for quantitatively balancing methylmercury risk and omega-3 benefit in fish consumption advisories. Environmental health perspectives, 119(8), 1043-1046.
Stone, D., & Hope, B. K. (2010). Carcinogenic risk as the basis for fish advisories: a critique. Integrated Environmental Assessment and Management: An International Journal, 6(1), 180-183.
Strain, J. J., Yeates, A. J., van Wijngaarden, E., Thurston, S. W., Mulhern, M. S., McSorley, E. M., ... & Harrington, D. (2015). Prenatal exposure to methyl mercury from fish consumption and polyunsaturated fatty acids: associations with child development at 20 mo of age in an observational study in the Republic of Seychelles. The American journal of clinical nutrition, 101(3), 530-537.
Tørris, C., Småstuen, M., & Molin, M. (2018). Nutrients in fish and possible associations with cardiovascular disease risk factors in metabolic syndrome. Nutrients, 10(7), 952.
U.S. Environmental Protection Agency (USEPA). (2009). The National Study of Chemical Residues in Lake Fish Tissue. EPA-823-R-09-006. U.S. Environmental Protection Agency, Office of Water, Washington, DC. Retrieved from https://www.epa.gov/sites/production/files/2018-11/documents/national-study-chemical-residues-lake-fish-tissue.pdf. USEPA. (2011). Exposure factors handbook: 2011 edition. Intake of fish and shellfish. National Center for Environmental Assessment, 10, 66.
USEPA. (2016). Drinking water health advisory for perfluorooctane sulfonate (PFOS). Office of Water (4304T), Health and Ecological Criteria Division EPA. Retrieved from https://www.epa.gov/sites/production/files/2016-05/documents/pfos_health_advisory_final_508.pdf.
USEPA-USFDA. (2017). EPA-FDA Fish Advice: Technical Information. Downloaded on July 25, 2019 from https://www.epa.gov/fish-tech/epa-fda-fish-advice-technical-information.
USEPA. (2018). Human Health Toxicity Values for Perfluorobutane Sulfonic Acid (CASRN 375-73-5) and Related Compound Potassium Perfluorobutane Sulfonate. EPA-823-R-18-307. Retrieved from https://www.epa.gov/sites/production/files/2018-11/documents/pfbs_public_comment_draft_toxicity_assessment_nov2018-508.pdf
USEPA. (Last updated November 7, 2018). EPA-FDA Fish Advice: Technical Information. Retrieved from https://www.epa.gov/fish-tech/epa-fda-fish-advice-technical-information.
Williams, M. C., Murphy, E. W., McCarty, H. B., Snyder, B. D., Schrank, C. S., McCann, P. J., & Crimmins, B. S. (2017). Variation in the essential fatty acids EPA and DHA in fillets of fish from the Great Lakes region. Journal of Great Lakes Research, 43(3), 150-160.
Yamaguchi, M., Arisawa, K., Uemura, H., Katsuura-Kamano, S., Takami, H., Sawachika, F., ... & Hasegawa, M. (2013). Consumption of seafood, serum liver enzymes, and blood levels of PFOS and PFOA in the Japanese population. Journal of occupational health, 12-0264.
20
PFOS Best Practice, Appendix D
Appendices (available by request)
Appendix A - Fish PFOS Risk/Benefit Analysis: Comparing the Uncertainty Associated with the Immunotoxicity Component of Risk-Based Intake Values with the Uncertainty of Benefits Lost from Limiting Fish Consumption
Appendix B - Review of Epidemiology Evidence for Increased Cholesterol as Critical Endpoint for PFOS Risk Assessment and Summary Statement on Fish CVD Benefit
Appendix C - Summary of Human Immunotoxicity Evidence to Support Dose Response and RfD Development
Appendix D – Comparison of Possible Values for Exposure Parameters, Associated Assumptions, and Final Guidelines