great british beach clean for secondary schools
TRANSCRIPT

Great British Beach Clean for Secondary Schools
Age 11+
Sustainability goals:
About The Project
Every year we run the Great British Beach Clean, with thousands of people getting involved by heading to the beach to clear litter and make note of what they find. If you can’t make it to the coast, no problem! That’s where the Source to Sea: Litter Quest comes in. All of the data you collect on the beach, on your street or in a local park helps us campaign for change.
We’ve used data collected in previous years to make the case for the 5p carrier bag charges across the UK, and are campaigning for a Deposit Return Scheme for all types of drinks containers.
Why Get Involved
Taking part is simple, all you need to do is download the survey form, grab some gloves or litter pickers and head outside! The survey gives students a great opportunity to see first-hand the impact of litter in the environment.
It’s a great way to help your school or group reach its sustainability goals and takes advantage of outdoor spaces for learning. By improving their local environment, young people will develop a sense of social responsibility and awareness of how to take personal action.
Curriculum Links
This project links to learning in: Geography, Science, Social Science, English, I.T., PSHCE and Maths. It’s a great opportunity to run an innovative cross-curriculum project across the week, building on knowledge and skills ateach stage. For example, pupils could start by gaining subject knowledge ingeography, survey techniques could be written and evaluated in science,data presented in IT and data analysed in maths. The project could thenculminate in a citizenship class with a discussion and debate on societalbehaviour and how political movement could make a positive change toour environment.

Use our beach clean information if you’re by the coast or our street clean information if you’re inland.
Inland clean
Head out to your local river, street, park or even your school ground. Collect litter and record it using our Source to Sea: Litter Quest survey form. Health and safety guidance and an example safety briefing and risk assessment can be found on our website.
Beach clean
You will need to register online, all the information and resources you need are available at on the beachwatch website, including an organisers’ guide and risk assessment. There’s also some additional guidance on leading a litter pick with groups and schools. If you have any questions about leading a beach clean, please contact [email protected]
Option B
If you’re unable to take your school out into the local area, you could use the surveys to discuss what litter items students have seen in the local area, or items which young people have in their homes that could end up as litter. Discussion could then centre around which items are ‘new’ types of litter (e.g. Covid related items), how items end up as litter and which items could be recycled or managed without. Older groups could debate whether single-use items should be allowed.
Please read and follow the government, and local rules, in your area.
Ages 11+
Chose Your Litter Survey

Before
o Choose the location for your litter pick and survey to suit the age andability of your group. Work away from roads.
o Equipment list:o Sturdy shoes.o Gloves - ideally gardening style gloves.o Or use litter pickers or metal tongs, which make good improvised
pickers.o Cover up any cuts.o Bin bags.o Hand sanitiser.o Waterproofs or sunscreen – whichever is needed.
o Check and update your risk assessment on the day, run through thesafety guidelines and set clear expectations for behaviour. Have a ruleregarding alerting an adult if anything sharp, dangerous or nasty isfound.
o If you’re using our beach clean forms ensure everyone understands thedifferent categories and explain how this data is used by the MarineConservation Society.
o If using our source to sea forms, students should read the source to seaposter to understand why we are asking them to record these items,follow this up with a group discussion. More information is provided inthe source to sea fact file.
o Run through the survey forms before you start to ensure everyoneunderstands how to record the data.
During
o Head out on your litter picker and record the items you collect.o Do not touch your face when litter picking, and use your hand sanitiser
often.o Put any sharp items in a separate bucket or container and not in your
bin bag whilst litter picking.o Make sure you take photos and share them with us using #LitterQuest or
#GreatBritshBeachClean or email [email protected] including yourgroup name.
After
o Wash your hands with soap for 20 seconds, as soon as possible.o Clean your litter picking kit thoroughly with household disinfectant.o Snap a photo of your Source to Sea survey card and post it on social
media using the hashtag #LitterQuesto Upload your data to our national database via the using either the
Source to Sea page or Great British Beach Clean page. Explain to thegroup that the data they collected will be analysed and used to informour clean seas campaign work.

Follow up Curriculum LinkedActivity Suggestions
Geography
o Discuss possible routes by which litter from your local area could end upthe ocean.
o To understand the concept of “source to sea”, follow a local river on itsjourney to the coast. This is a great way of connecting the topics of riversand place. Pupils could use online maps, like Google Earth, to locate thenearest river, estimate miles from the sea and look into physical andhuman factors along the river which could influence the amount of litterentering the watercourse.
o Discuss the longevity of plastics and their pervading nature once theybreak into micro-plastics. Encourage young people to identify ways wecan stop litter reaching the beach – it’s important to emphasise that waste can become litter unintentionally and reducing the amount of waste weproduce is key. Link this to the need to have a circular economy.
Science
o The Source to Sea: Litter Quest is a great research project to develop andenhance student’s scientific report writing skills. The data collectionmethod could be written up, with students evaluating the methods anddiscussing opportunities to build on the data collection techniques used.
o Students could design their own scientific experiment on marine litter tobuild on what they have learnt. For example, a degradation study lookingat how long it takes various forms of litter to begin to degrade in landfillconditions and in salt water conditions.
I.C.T.
o Using the 10-year beach clean dataset provided by MCS along with datayou have collected during the week, students could use software to input,analyse and manipulate data in a spreadsheet. Students could selectappropriate graphs (pie chart, line chart, bar/column chart) and formatthese accordingly.

Follow up Curriculum LinkedActivity Suggestions
Citizenship
o Discuss the findings of their litter survey. Encourage students to add theirpersonal views on what the data suggests and debate the wider topicalissue of marine litter.
o Students could use this project as a case study to research how citizenscan make a difference in society. Students should think creativelysuggesting problem solving ideas, and developing a campaign tohighlight issues of litter in their local community. Litter survey data that hasbeen collected and analysed should be included in a campaign tohighlight the problem on a local level.
Sociology
o Explore the societal behaviours that have led to the problem of plasticpollution in our environment. For example, students could look into howproduct choice, consumerist culture and a throwaway society have had anegative impact on the environment. Discuss opportunities to influencepersonal and societal behaviours and to create positive social change.
Politics
o Use knowledge gained through both taking part in the Source to Sea LitterQuest and subsequent research in other subjects, to discuss and debatethe political opportunities to reduce the impact of marine litter on theenvironment. Use MCS as a case study to research how our past andcurrent campaigns aim to bring about political change. What methods areused and what influence have these campaigns had?
Maths
o Use the 10-year beach clean dataset or data collected by the students toconstruct and interpret tables, charts and diagrams such as line graphs,pictograms and box plots and statistically analyse and evaluate the data.

Please note that by downloading our data you are agreeing to our termsand conditions, namely that you will only use any data as part of Sourceto Sea and for no other purposes. Full T&Cs can be found atbit.ly/GBBCDataTerms.
Delve deeper into data
Suggested analysis
o Data could be used to explore patterns in a particular litter itemover time, identify patterns in litter sources or look at frequency ofdifferent materials.
o Pivot tables are useful to help compare various elements of dataand are a key tool we use in our analysis.
o After a walkthrough of the data and how to sort it, young peoplecould then work to interrogate the data, in collaborative groups (ifpossible), to identify a particular issue with an item, source or typeof material, and then develop an action plan to reduce the issue.
o To provide contextual information our survey methodology take alook at page 7 of our organisers guide and we’ve also provided anannotated data set.
o Access the secondary level datasets at:
10 year data set
o We’ve collated 10 years of GBBC data in areas around the UK foryoung people to explore.
o We’ve organised the data and standardised the results to showaverage per 100m of beach (because in some cases our surveysare conducted over more than the standard 100m in our surveyprotocol). To compare results, they must therefore bestandardised. This should make the data a bit easier to interpretand manipulate, but you could also tailor this further depending on your current curriculum focus and the age of your group.
o If a raw dataset is preferred please contact [email protected]
EnglandNorthern Ireland Scotland WalesChannel IslandsUK

Inspire action
Reflect
Take time to reflect on what students have learnt by asking the following questions:o Why is it important that we all reduce the amount of plastic being
produced?o How does collecting data help make a positive change?o What is the most impactful change you could personally make, reduce,
reuse or recycle?o Are there any changes you are going to make to your life to reduce your
personal impact on the environment?o How are you going to share what you’ve leant with others?
Follow Up
o If you’re interested in engaging your students with more ocean topics takea look at our online lessons that cover topics such as climate change,carers in conservation and ocean diversity.
o We are in the process of redeveloping our education resources and will beadding content to our website throughout next year so keep a look out forlots more resources soon.
Keep In Touch
o If you have any questions about the activity suggestion or resourcesprovided please don’t hesitate to contact the education team.
o We would also love to see photos of your school out and about collectinglitter. You can share with us on social media or through our email address.
o Please also share examples and celebrate the amazing work of yourstudents using #LitterQuest or #GreatBritishBeachClean
Contact detailsEducation email: [email protected]:@mcsukFacebook: @mcsuk
Don’t forget to upload your survey results onto our beach clean web-page or source to sea webpage.

From source to sea
It is estimated that 11 million tonnes of plastic ends up in the sea worldwide each year (1), and that 80% of litter found in the sea is from inland sources. (2)
Sources on land can include intentional and accidental littering, items flushed down toilets, sinks and drains, windblown litter from bins and landfills, and litter carried by rainwater into drains, rivers and eventually the sea. Litter is also a problem at sea, with sources like fishing, sailing, speed boats, commercial ships and container spills causing litter pollution.
Marine Litter Fact File
Litter timeline
Litter in the ocean takes longer to degrade than litter on land, but will eventually start to break up due to wave action, currents, saltwater and sunlight. Degradation time varies greatly from 1–450 years depending on the properties of the litter.
Microplastics are a serious environmental issue. They are plastics that have broken up into pieces less than 5mm, as well as pieces that enter the environment this size like microfibres or plastic nurdles, which are the small plastic pellets used in the production of plastic products.
1. Pew 20202. Europa 2016
© Natasha Ewins© Natasha Ewins

Marine Litter Fact File
Gannet carrying fishing rope. © JHS Archer-Thomson
Marine life and litter
Litter items can cause harm to all sorts of marine life, from tiny plankton to whales.
Animals can become entangled in litter, causing injury, reduced mobility and even death. Ingestion of litter, particularly plastic, is very problematic for marine life who are unable to digest it. Large amounts of plastic ingestion can lead to starvation, as there is no room left for food. One study found 100% of turtles to have plastic in their stomach. (3) In some areas, the extreme amount of plastic on the sea floor can suffocate the animals and plants living there.
Invasive speciesOcean currents can move plastics around the world. Small animals and plants can hitch a ride on the surface of plastic and travel with the currents, introducing non-native species to new areas. The introduction of non-native species could cause harm to the ecosystem.
Plastic chemicals Several chemicals used in the production of plastic materials are carcinogenic. Toxic contaminants can also accumulate on the surface of plastic materials that have broken up and been underwater for a long time. When marine animals ingest plastic accidentally, these toxic contaminants enter their digestive systems and could build up in the food web over time.
Microplastic pieces amongst seaweed. © Natasha Ewins
3. Duncan et al 2018

Reducing litter
We all need to do our bit to reduce litter in the environment. By rethinking how we shop and what we use in our daily lives, we can all make a difference. Refusing unnecessary plastic and other materials, reducing the amount of products we consume, and repairing rather than replacing are all important actions we can take. Through education, we can help raise awareness, encourage positive consumer behaviour, and campaign for change from businesses and the government.
Marine Litter Fact File
Litter surveys
Litter surveys are not only important for clearing rubbish, but also for gathering data on the types of litter polluting our environment. Beachwatchis our national beach clean and survey initiative, and has been running for over 25 years. Our brilliant volunteers head out to beaches across the UK to clean and survey our coastline, collecting and recording the rubbish they find in a 100m stretch of beach. This litter data helps inform our campaigns and lobby government, and has led to influential changes like the UK-wide carrier bag charge, microbead bans and changes to wet wipe packaging.
We also use the data to determine the sources of litter. For example, if a significant amount of sewage-related debris (SRD) is found in an area, we work with local sewage treatment companies to try to improve treatment plants, and with communities to raise awareness of what should and shouldn’t be flushed down the toilet.
© Natasha Ewins © Holtography

Marine Litter Fact File
Litter collected at a beach clean. © Natasha Ewins
Recycling
Even if we reduce the number of items we use, we will still need to throw some away. This is where efficient recycling is key. Download a guide from your local council to help students understand what can be recycled at home and at school. Many items can be recycled, but if your local council has limited recycling options check out Terracycle’s website for local drop off points.
Plastics can only be recycled at best 2-3 times before they lose their strength, so we still need to move away from plastics to materials that can be recycled time and time again. We need to change how products are recycled, and how we incentivise best practice to ensure materials and resources are valued. This can include redesigning products or calling for economic incentives like Deposit Return Schemes (DRS), where a small deposit is paid when people buy a single-use drinks container and is refunded when they return it to a store or dedicated recycling point.
Single-use plastic straws. © Natasha Ewins
Circular Economy
We currently have an economy which is linear, which means we make, use and dispose of products using up finite resources. It’s estimated that only 9% of all plastic ever made has been recycled, (4) so we know that recycling alone isn't the solution. Instead we need to move towards a circular economy, where products are designed to be used time and again, repairable, or re-designed into new products. The whole life cycle of the product has been considered so very little ends up in landfill.
4. Geyer et al 2017

The litter you record on your local clean-up will help us identify and create a snapshot of the litter that is still plaguing our environment, including new single-use items such as PPE.
Total participants:
Weight of litter:
Number of bags:
Weirdest item found?
kg
School group? Age range:
First half of your postcode:
Where did you clean? (please circle)Town | Countryside | Park | Street | River
Playground | Grounds of the office | Other
Youth group?
80% of the litter we find in our ocean comes from inland, help us stop ocean pollution in its tracks! Spot the litter, tick what you found, then pick it up.
Tally:
Tally:Tally:
Tally:Tally:
Tally:Tally:
Tally:
Tally:Tally:
Tally:Tally:
Tally:Tally:
Glass bottles
Single-use plastic bag
Plastic drink cupsPlastic drink bottles
BalloonsSingle-use plastic gloves
Metal drink can
Polystyrene fast food container
Plastic bag for life
Polystyrene cupsLoose plastic bottle caps/lids
Wet wipesSingle-use face mask
Paper cups
Source to Sea: Litter Quest

Source to Sea: Litter Quest

Source to Sea Fact File
Take part in Source to Sea: Litter Quest as part of the Great British Beach Clean. This September, there’s something for everyone, everywhere. No matter where you live across the UK, you can help keep our seas clean.
Why your help matters
We know that litter from towns, parks and even the remotest country lanes often make their way down to our ocean. Every item dropped in the street has the potential to pollute our seas by travelling down rivers and streams, being washed down drains or by being blown onto our beaches.
As part of our litter cleans we collect data to track rubbish back to its source - our survey results are then used to find solutions to ocean pollution, and to campaign for measures to bring positive change.
We’ve used data collected in previous years to make the case for the 5p carrier bag charges across the UK, and are campaigning for Deposit Return Schemes for all types of drinks containers.

Source to Sea Fact File
What we’re looking for – Food & drink containers:
1. Polystyrene fast food container -these break up easily into small pieces. Did you know polystyrene is a type of plastic?
2. Glass bottles - these can easily get broken and become pieces which can hurt us and wildlife
3. Metal drink can - Scotland will introduce a deposit return scheme in 2022 on glass, metal and plastic (PET) bottles – but we want all the UK governments to take urgent action and bring in their own schemes
4. Plastic drink bottles - 9 billion drink containers are wasted each year by not being recycled
5. Loose plastic cases/lids - In the UK there is currently no legislation for lids to be tethered to bottles. We believe this small change could help reduce litter from lids. How many can you spot?
The Litter Quest items
This year we’ve chose 14 items for you to record and report back to us –these items have been chose carefully, and by taking part in our inland cleans, you can help us, keep our seas safe and healthy – for us all to enjoy.

Source to Sea Fact File
6. Plastic drink cups – what happens to plastic cups from places like takeaways? Help us hunt down the offenders so we can see where they end up
7. Polystyrene cups – are made from a type of plastic and break down really easily into smaller pieces. We think these tiny pieces of plastic might be spreading far and wide – how many can you spot?
8. Paper cups - did you know that lots of paper cups have plastic lining them on the inside. Does that make them paper, or plastic –what do you think?
We want to see Deposit Return Schemesintroduced across the UK, where consumers pay a small deposit on these items when they buy them, and receive their money back when they return them. Scotland will introduce a Deposit Return Scheme in July 2022, but England, Wales and Northern Ireland have yet to create the legislation.
During last year’s Great British Beach Clean we found an average of 30 drinks-related litter items for every 100m of beach, and all these items were also found on 99% of inland cleans.

Source to Sea Fact File
9. Single-use plastic bags – we know that when shops started charging people for bags for their shopping, around half the number of bags were found on our beaches. But can you see any in the park or on a street near you?
10. Plastic bags for life – these bags are made from thicker plastic and are meant to be used many, many times. But we think some may have been used just once, and could find their way into the sea.
What we’re looking for – Plastic bags:
Since charges were introduced across the UK, we’ve seen an over 50% drop in single-use plastic carrier bags on our beaches. (1) We want to know if this drop can also be seen inland. Although there’s been a charge on single-use plastic carrier bags for at least 5 years (Wales introduced it in 2011, Northern Ireland 2013, Scotland in 2014, England in 2015), 'bags for life' have been encouraged as a reusable alternative. But we suspect that these may still be used as a single-use item, and so still harming our environment.
1. Comparing 2015 litter data with 2020
What we’re looking for – Wet wipes:
11. Wet wipes – often found on beaches from being flushed down the toilet, but they’re also used around towns and cities.
Last year we found 18 wet wipes per 100m of beach during GBBC. By tracking them back through the sewage system and their journey from our streets and parks, we can put a stop to pollution.
Source to Sea Fact File
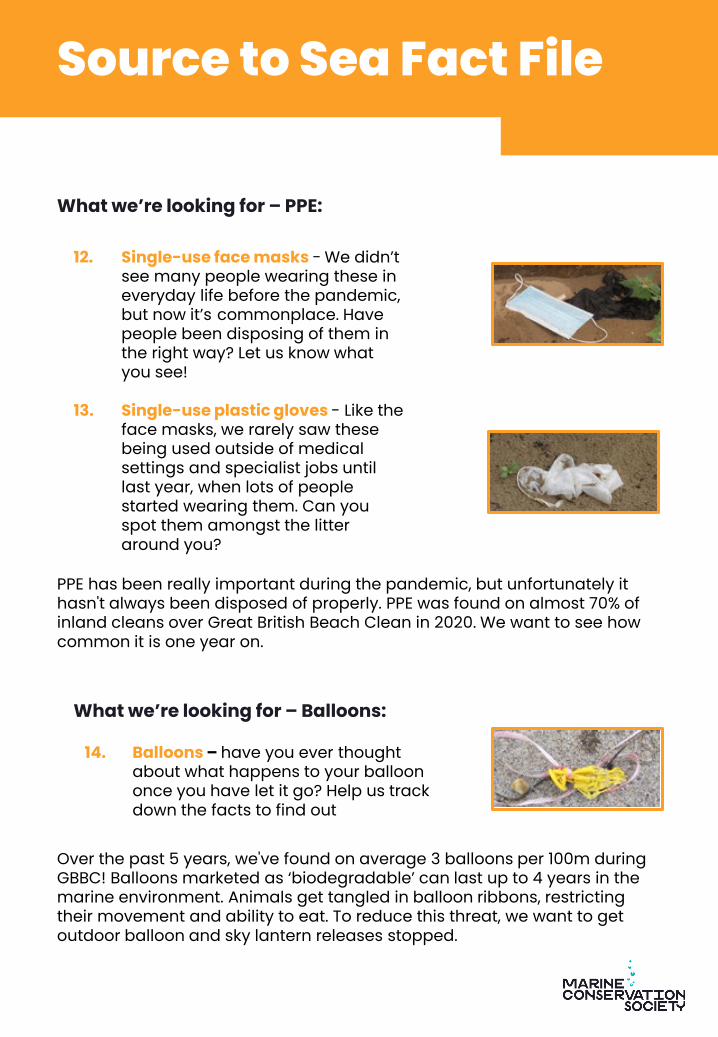
12. Single-use face masks - We didn’t see many people wearing these in everyday life before the pandemic, but now it’s commonplace. Have people been disposing of them in the right way? Let us know what you see!
13. Single-use plastic gloves - Like the face masks, we rarely saw these being used outside of medical settings and specialist jobs until last year, when lots of people started wearing them. Can you spot them amongst the litter around you?
What we’re looking for – PPE:
PPE has been really important during the pandemic, but unfortunately it hasn't always been disposed of properly. PPE was found on almost 70% of inland cleans over Great British Beach Clean in 2020. We want to see how common it is one year on.
What we’re looking for – Balloons:
14. Balloons – have you ever thought about what happens to your balloon once you have let it go? Help us track down the facts to find out
Over the past 5 years, we've found on average 3 balloons per 100m during GBBC! Balloons marketed as ‘biodegradable’ can last up to 4 years in the marine environment. Animals get tangled in balloon ribbons, restricting their movement and ability to eat. To reduce this threat, we want to get outdoor balloon and sky lantern releases stopped.

Average number of items by 100m
How much litter did we find?
497
England Scotland Wales NorthernIreland
ChannelIslands
298238
1219
163
How many volunteers took part?
1153 396 143 14 59
How many beaches were cleaned?
249 98 32 2 4
Where did it come from?
Hard to know where it’s from – mainly because it’s too tiny to identify
51.9% Non-sourced
Litter that the public has not disposed of correctly – usually left on beaches, blown in o� the street, or carried by waterways
27.7% Public
All the things from lobster pots to �shing nets, that help anglers and commercial �shermen catch seafood
8.9% Fishing
Illegally dumped items like TVs, mattresses and tyres
0.6% Fly-tipped
Pill packets to syringes.
0.3% Medical
Objects lost, or thrown overboard from small craft or massive ships
2% Shipping
8.6% SRDSanitary products and other household items that are �ushed down the loo but should go in the bin
167.2 /100m
19.7 /100m
17.7 /100m
16.2 /100m
15.8 /100m
Plastic/polystyrene (0-50cm)
Caps/lids
Wet wipes
Cigarette stubs
String
15.4 /100m
14.7 /100m
10.1 /100m
7.9 /100m
7.1 /100m
Glass
Cotton bud sticks
Fishing net
Fishing line
Plastic/polystyrene (other)
What did we find?
2020 Report
73.7% Plastic/polystyrene
8.6% Sanitary items
5.1% Paper/cardboard
3.9% Glass
2.8% Metal
1.6% Cloth
1% Wood
0.9% Rubber
0.8% Pollutant items
0.7% Pottery/ceramic
0.4% Dog faeces
0.3% Medical items
What were the materials?

Source to Sea: Litter Quest Results 2020
0% 10% 20% 30% 40% 50% 60% 70% 80%
Paper Coffee Cups
Metal drink cans and tops
Drinks cups for cold drinks
Glass bottles
Polystyrene fast-food containers
Single-use face mask
Balloons
Plastic bag for life
Single-use Plastic gloves
Polystyrene cups
Single-use plastic bag
Plastic drinks bottles and tops
Percent of surveys litter item found in
99%of inland cleans found drinks containers
of inland cleans found PPE equipment
359 volunteers took part
239 bags of litter were removed from streets, parks and playground