gravity model specification and the effects of the - st. louis fed
TRANSCRIPT

WORKING PAPER SERIES
Gravity Model Specification and the Effects of the Canada-U.S.Border
Howard J. Wall
Working Paper 2000-024Ahttp://research.stlouisfed.org/wp/2000/2000-024.pdf
September 2000
FEDERAL RESERVE BANK OF ST. LOUISResearch Division411 Locust Street
St. Louis, MO 63102
______________________________________________________________________________________
The views expressed are those of the individual authors and do not necessarily reflect official positions ofthe Federal Reserve Bank of St. Louis, the Federal Reserve System, or the Board of Governors.
Federal Reserve Bank of St. Louis Working Papers are preliminary materials circulated to stimulatediscussion and critical comment. References in publications to Federal Reserve Bank of St. Louis WorkingPapers (other than an acknowledgment that the writer has had access to unpublished material) should becleared with the author or authors.
Photo courtesy of The Gateway Arch, St. Louis, MO. www.gatewayarch.com

Gravity Model Specification and the Effectsof the Canada-U.S. Border
Howard J. WallFederal Reserve Bank of St. Louis
July 2000
There is a well-established literature finding that the Canada-U.S. border has a large dampeningeffect on trade, is asymmetric, and differs across provinces. In this paper, I demonstrate that thestandard gravity model used to obtain these results provides biased estimates of the volume oftrade. I attribute this to heterogeneity bias and reestimate the effects of the border using a gravitymodel that allows for heterogeneous gravity equations. Doing so does not alter the generalresults of existing studies, although it does yield a border effect that is 40 percent larger, reversesthe border�s asymmetry, and indicates very different provincial effects. (JEL F14, F15, R10)
The views expressed are those of the author and do not necessarily represent official positions ofthe Federal Reserve Bank of St. Louis, or of the Federal Reserve System.
Corresponding address: Howard J. Wall, Research Division, Federal Reserve Bank of St.Louis, P.O. Box 442, St. Louis, MO 63166-0442, United StatesE-mail: [email protected]; Phone: (314)444-8533; Fax: (314)444-8731

1
Gravity Model Specification and the Effects of the Canada-U.S. Border
Howard J. WallFederal Reserve Bank of St. Louis
The United States and Canada are each others� largest trading partners, and the volume of
trade between them is the greatest between any two countries in the world. In 1999, Canada
imported C$215 billion of merchandise from the U.S., which accounted for more than 2/3 of
total Canadian merchandise imports, and 23% of total U.S. merchandise exports. In the same
year, Canada exported C$286 billion of merchandise to the U.S., which accounted for 87% of
total Canadian merchandise exports, and 19% of total U.S. merchandise imports. Typically, the
U.S. trades about as much with Canada as it does with all 15 countries of the European Union
combined, and its trade with Ontario alone exceeds its trade with Japan.
This volume of trade is perhaps not surprising when one considers that the two countries
share many economic and cultural similarities, that nearly 90% of the Canadian population lives
within 100 miles (161 km) of the U.S. border, and that the border between Canada and the 48
contiguous states stretches for almost 4000 miles (over 6400 km). Also, starting with the 1965
Auto Pact, there has been an almost uninterrupted trend towards freer bilateral trade, culminating
in the 1988 Canada-U.S. Free Trade Agreement, subsequently deepened and broadened by the
North American Free Trade Agreement (NAFTA).
What is surprising about Canada-U.S. trade is not how large it is compared to trade
between other international trading partners, but how small it is compared with the level of trade
within the two countries. As an illustration of this, refer to table 1, which summarizes the
volume of trade between British Columbia and other Canadian provinces relative to its trade with

2
comparable U.S. states. The left side of the table provides for six provinces their total trade with
British Columbia as a share of their GDP. The right side of the table provides the same
information for a state that is a comparable distance from British Columbia. If the two countries
were truly integrated, and the international border between them did not matter, then these two
numbers would be roughly the same. However, in all cases the province is a far more important
a trading partner than is the corresponding state, usually by an order of magnitude. Because this
arises despite the amount of trade between the two countries, it provides a nearly ideal real-world
laboratory for estimating the extent of �home bias�, a measure of the degree to which markets are
segmented by international borders.
In an influential paper, John McCallum (1995) used a gravity model to estimate that in
1988, trade between provinces within Canada was 22 times the expected amount of trade
between the provinces and the states of the U.S..1 McCallum�s model has been subsequently
refined and extended, with the border found to be: (i) asymmetric, with its trade-reducing effect
greater for U.S. exports to Canada than for Canadian exports to the U.S. (Anderson and Smith,
1999a); (ii) heterogeneous across the provinces (Helliwell, 1996 and 1998; and Anderson and
Smith, 1999b); and (iii) asymmetric and heterogeneous (Anderson and Smith, 1999b). In the
lone study using post-NAFTA data, Helliwell (1998) finds that the home bias ratio had declined
to about 12 for the period 1994-96.
Evidence of home bias has not been restricted to Canada-U.S. trade, as it has been found
to be significant at the level of U.S. states by Wolf (2000), and OECD countries by Wei (1996). 1 Further evidence of the extent to which the U.S. and Canadian markets are segmented was found by Engel andRogers (1995). They estimate that the effect of the Canada-U.S. border on price dispersion is the same as adding1780 miles (2870 km) to the distance between two cities within the same country.

3
Helliwell (1998) examines Intra- and Inter-OECD trade, finding significant home biases for
capital mobility, migration, and knowledge diffusion. Also, Anderson and Smith (1999a and b)
estimate Canadian and provincial border effects for trade with countries other than the U.S..
These widespread findings of large border effects have led Maurice Obstfeld and Kenneth
Rogoff to label the home bias in trade as one of the �six major puzzles in international
macroeconomics�.
With the existence of large home biases firmly established, the search for explanations
has begun. Evans (2000) finds little support for the hypothesis that the home bias is not due to
the border itself but instead to inherent differences in domestic and foreign goods; Obstfeld and
Rogoff (2000) argue that empirically reasonable trade costs can explain much of the home bias;
and Anderson (2000) points to information costs and imperfect contract enforcement as
worthwhile avenues of inquiry.
As the search for explanations proceeds apace, there is still some significant empirical
work that needs to be done to obtain accurate estimates of the sizes and orderings of the various
home bias ratios. The most important reason for this is that the standard gravity model, on which
all existing estimates are based, tends to provide biased estimates (Mátyás, 1997; Bayoumi and
Eichengreen, 1997; and Cheng and Wall, 1999). In particular, Cheng and Wall (1999) show that
the gravity model as usually specified suffers from heterogeneity bias, tending to overpredict
trade between low-volume traders, and to underpredict it between high-volume traders. This has
clear implications in the present context because the Canada-U.S. home bias is a measure of
predicted intra-provincial trade relative to predicted international trade. Because actual trade
4
between provinces tends to exceed actual trade between states, a standard gravity model should,
on average, underestimate the home bias ratios.
As I demonstrate below, all existing results are affected a great deal when home bias
ratios are obtained with a model that controls for heterogeneity bias. Specifically, the home bias
ratios are generally higher, and many of the relative comparisons are reversed: (i) the analogue to
the McCallum home bias ratio increases by over 40 percent; (ii) the home bias on flows from the
U.S. to Canada becomes smaller than that on flows from Canada to the U.S.; and (iii) the largest
province-specific home biases are for Ontario and Quebec, rather than for the Maritimes, as
previous work finds.
In section 1 I use post-NAFTA data for 1994-96 to estimate home bias ratios for four
different versions of the border, obtaining results that are more or less consistent with the
existing literature. I then demonstrate that the residuals of even the most general of these
estimates are positively related to the volume of exports, which I attribute to heterogeneity bias.
I reestimate the home bias ratios in section 2 using the same four versions of the border, but with
a gravity model that does not have the same cross-trading-pair restrictions as the standard gravity
model. Section 3 concludes.
1. A standard gravity model
Gravity models were first applied to international trade by Tinbergen (1962) and
Pöyhönen (1963), who proposed that the volume of trade could be estimated as an increasing
function of the national incomes of the trading partners, and a decreasing function of the distance

5
between them. Although the gravity model became popular because of its perceived empirical
success, it was also criticized because it lacked theoretical foundations. These foundations were
subsequently developed by, among others, Anderson (1979) and Bergstrand (1985), who derived
gravity models from models of monopolistic competition, and Deardorff (1998), who
demonstrated that the gravity model can be derived within Ricardian and Heckscher-Ohlin
frameworks.
1.1. The empirical model
Existing estimates of the effect of the Canada-U.S. border have been obtained using the
simplest form of the gravity model:
;lnlnln)1ln( 21 ijtijjtitijt DYYx ε+′+δ+β+β+α=+ ijBγ (1)
where xijt is the volume of exports from location i to location j in year t, Yit is the income of i in
year t, Yjt is the income of j in year t, Dij is the distance between i and j, and ijB′ is a vector of
dummy variables specifying the Canada-U.S. border.2
As with the previous literature, my data set is based on a unique series collected by
Statistics Canada of trade between Canadian provinces and between Canadian provinces and
U.S. states. It is supplemented with Gross Provincial Product data from Statistics Canada, and
Gross State Product data from the U.S. Bureau for Economic Analysis. All values are in real
Canadian dollars. The distance measure is the great circle distance between the largest cities in
each of the trading partners, although for some cases (such as California and Alberta) I use the
2 I use ln(1+xijt) as my dependent variable, rather than ln xijt, allowing me to include observations of zero measurabletrade, which others simply exclude from the data set. Note also that Helliwell (1998) includes a remoteness measurein addition to the distance measure.

6
midpoint between two large cities. I use data from all 10 provinces and all 50 states plus the
District of Columbia, including cases where measured trade was zero. With three years of data
(1994-96) I have 3330 observations.
Other than the years covered, this data set differs somewhat to those used previously.
McCallum (1995) limited his 1988 data set to the 30 states that bordered Canada or had the
largest populations, and, for comparability, Anderson and Smith (1999a and b) used McCallum�s
data set. Helliwell (1996, 1997, and 1998) also included only 30 states, but with slightly
different selection criteria. Also, all of these studies deleted observations of zero measured trade.
To avoid the possibility of sample selection bias I use the entire sample of states and
observations. The results using McCallum�s 30 states differ somewhat from the results below,
and are available on request.
I estimate four versions of (1) using four different models of the Canada-U.S. border:
Border I: ijBγ≡′ijBγ , (symmetric and homogeneous)
Border II: PSij
PSSPij
SP BB γ+γ≡′ijBγ , (asymmetric and homogeneous)
Border III: � =γ≡′ 10
1kkijk BijBγ , (symmetric and heterogeneous)
Border IV: � =γ+γ≡′ 10
1)(
kPSkij
PSk
SPkij
SPk BBijBγ . (asymmetric and heterogeneous)
Border I is the original border as modeled by McCallum (1995) where Bij equals 1 for all
observations of trade between a province and a state, and zero for all observations of trade
between provinces. The coefficient γ is then effect of the Canada-U.S. border on trade, relative
to the effect of provincial borders. Border II allows the border effect to be different for trade

7
from a state to a province and trade from a province to a state. SPijB therefore is equal to one
when i is a state and j is a province, and PSijB is equal to one when i is a province and j is a state.
Border III assumes the same border effect for the two directions of international trade, but allows
it to differ across provinces. Thus, kijB is equal to 1 when the observation is of province k
trading with a state. Border IV combines the elements of borders II and III, allowing the border
effect to differ across provinces and to depend on the direction of international trade.
1.2. Empirical results
The regression results for the pooled cross-section estimation of (1) are presented in
table 2. The corresponding home bias ratios are provided by table 3. As these tables indicate,
my results are largely consistent with the previous literature: On average, the home bias ratios
are smaller than in the pre-NAFTA period, although they are still quite large. Border I yields a
home bias ratio of 15, which is roughly the average of the heterogeneous home bias ratios under
each of the other borders. As with Helliwell (1998) this indicates that NAFTA has increased the
volume of Canada-U.S. trade relative to Canadian interprovincial trade, although this is larger
than Helliwell�s home bias ratio of 12. However, as noted above, the results are not directly
comparable as the data and model specifications differ somewhat.
Under border II, the home bias for trade from the U.S. to Canada is larger than that for
trade from Canada to the U.S.. This is consistent with Anderson and Smith (1999a), although
they found that the U.S.-to-Canada home bias exceeded the Canada-to-U.S. home bias by about
26 percent, whereas I find a difference of 40 percent. Under border III, I find that Ontario and
British Columbia have the smallest home biases, while the Maritime Provinces tend to have the

8
largest. Also, the home bias ratios are quite diverse, with Nova Scotia�s being nearly three times
that of Ontario�s. The dispersion of provincial home biases is not as large as found by Anderson
and Smith (1999b) or Helliwell (1998), but this is partly due to the fact that their data sets
include only 30 states. For example, reducing the data set to McCallum�s 30 states yields more
diverse provincial home biases.
The most general specification of the border is border IV, which combines the elements
of borders II and III. Unsurprisingly, then, the home biases found under border IV have
elements of the other two: (i) the provincial home biases tended to be higher for trade from the
U.S. to the province than from the province to the U.S., although the opposite holds for Ontario
and Manitoba; and (ii) the home biases tended to be higher for the Maritime Provinces and lower
for British Columbia and Ontario. As with border III, it is difficult to compare these results to
the previous literature because the more disaggregated the border effects are the more likely it is
that differences in the data sets lead to differences in results.
As with the previous literature, the gravity model appears to fit the data pretty well, with
s2R higher than 0.80 for all four specifications of the border. Also, the coefficients on the
incomes and distance are typical for gravity models. However, a closer look at the predictive
power of the model reveals that the high s2R do not tell the complete story. Figure 1 plots the
residuals�actual minus predicted log of exports�of the standard gravity model with border IV,
the most general specification. It is clear from the figure that the model provides biased
estimates, underpredicting high levels of trade, and overpredicting low levels of trade. Because
the home bias compares predicted interprovincial trade�which is relatively high�to predicted

9
international trade, the home bias ratios reported above are, on average, biased downward.
2. A heterogeneous gravity model
The standard gravity model above is a restricted version of a general gravity model in
that it assumes that the gravity equation is the same for all trading pairs, i.e. that the intercept and
slope coefficients are homogeneous across all province-province and province-state
combinations. However, there is certainly no reason to believe a priori that the relationship
between trade volume and income levels should be the same for, say, trade between California
and Saskatchewan and trade between Alabama and Prince Edward Island. If there are fixed
factors that are correlated with the volume of trade and with the border dummies, then the
standard gravity model will mistakenly attribute the effects of these factors to the international
border. Because of this type of problem with the standard gravity model, Mátyás (1997),
Bayoumi and Eichengreen (1997), and Cheng and Wall (1999) offer heterogeneous gravity
models to control for such fixed effects.3
2.1. The empirical model
The simplest way to allow for heterogeneity is to remove the restriction that there is a
single intercept that applies to all trading pairs. Specifically, I use least squares to estimate the
following version of the gravity equation:
;lnlnln)1ln( 21 ijtijjtitijijt DYYx ε+′+δ+β+β+α=+ ijBγ (2)
3 Because Helliwell (1998) and Anderson and Smith (1999b) estimate separate standard gravity equations for eachof the provinces, they allow for some heterogeneity. However, because these provincial gravity equations restrictthe intercepts to equality, they nevertheless suffer from the same sort of heterogeneity bias illustrated by figure 1.

10
where ijα is the trading-pair intercept, which is allowed to differ according the direction of trade,
i.e. ijα is allowed to differ from jiα . If the trading-pair effects are correlated with the right-
hand-side variables, then the coefficients on these variables will be biased when these trading-
pair effects are not accounted for, as in (1).
Trading-pair specific intercepts allow for a province to trade different amounts with two
states even if the two states have the same incomes and are equidistant from the province. This
can be due to economic, historical, cultural, ethnic, political, or geographic factors that affect the
level of trade. For example, some trading pairs may be better matched in terms of the goods that
consumers in one location prefer and the goods in which the other has a comparative
advantage―residents of Ontario may have a greater affinity for South Carolina peaches than do
the residents of Nova Scotia. Or, perhaps because of Quebec�s cultural differences, its volume of
trade with, say Arizona, will differ from the volume of trade between Arizona and other
provinces, all else equal.
Trading-pair heterogeneity may also manifest itself in the volumes of trade in
intermediate goods. One obvious example is that because the North American auto industry is
centered around the Great Lakes, the volume of trade between Michigan and Ontario may be out
of proportion to their incomes and distance. This is further strengthened by the fact that there
has been free trade in the auto industry since the 1965 Auto Pact. A second example is that the
volume of trade between Washington and British Columbia may be out of proportion to their
sizes because they both have large lumber and wood industries, meaning that the flow of
intermediate products between them would be quite high.

11
Because the argument above is essentially that equation (1) does not include all of the
things that account for the differences in trade volumes across trading-pairs, the problem of
heterogeneity bias can be view simply as a problem of missing variables. If the relevant
historical, cultural, and political variables themselves can be included in the regression equation,
the problem would be resolved. However, cultural, historical, and political factors are often
difficult to observe, let alone quantify, which is why they are instead controlled for by assuming
that they are fixed over the sample period, allowing them to be captured by a dummy variable for
each trading pair.
Notice that because they are fixed over time, the distance variable and the border
dummies cannot at this stage be separated separately from trading-pair effect. This is because
they are subsumed into a single fixed-effect that captures all variables that differ cross-
sectionally but not serially: .ln ijBγ ′+δ+α≡λ ijijij D The effects of distance and the border are
estimated in a second stage in which the estimated fixed effects are regressed on them.
Specifically, in a second stage I use ordinary least squares to estimate
;ln�ijijij Dda µ+′++≡λ ijBc (3)
where the ijλ� s are the 1110 estimated fixed effects from the least squares estimation of (2).
2.2. Empirical results
The results for both stages of the estimation are summarized by table 4, which illustrates
the significant differences between the heterogeneous and standard gravity models. First, a
likelihood-ratio test easily rejects the restriction imposed in the standard model that the trading-

12
pair intercepts are all equal.4,5 Second, figure 2, which plots the residuals of the heterogeneous
model, reveals a tighter fit and the disappearance of the bias illustrated by figure 1. And third,
the estimated effects of the Canada-U.S. border are significantly different from what the standard
model yields. The fact that these changes occur indicates that there are fixed factors other than
the border which affect the volume of Canada-U.S. trade, and that these factors are also
correlated with the border dummies. Because of this, standard gravity models mistakenly
attribute the effects of these factors to the international border.
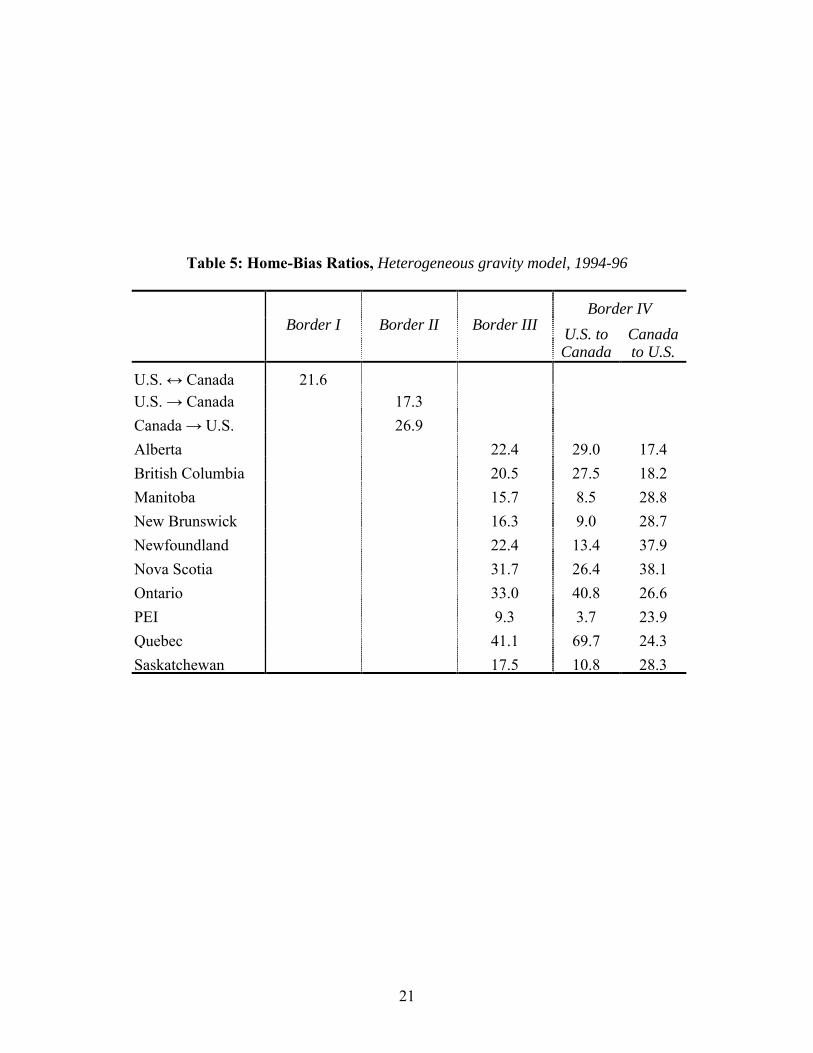
The differences in the estimated border effects are best illustrated by table 5, which
provides the various home bias ratios. Consistent with expectations, the home bias ratios from
the heterogeneous model are, on average, higher than those from the standard model. Under
border I, the heterogeneous model yields a home bias ratio of 21.6, which is about 43 percent
larger than yielded by the standard model. The differences in the average home biases under the
other three borders are of the same order of magnitude.
Another important difference is that results from the heterogeneous model demonstrate
that the effect of the border is greater for trade from Canada to the U.S. than on trade from the
U.S. to Canada. Specifically, under border II, the home bias ratio on Canadian exports to the
U.S. is about 55 percent larger than the home bias ratio on Canadian imports from the U.S.. This
is in contrast with the 40 percent difference in the opposite direction that the standard model
yields. 4 This is with χ2(1110) = 2(4363.74 - 212.28) = 8302.92 comparing the heterogeneous model to the standard modelwith border IV.5 As a test of whether the heterogeneity is in the error term rather than in the intercepts, a Hausman test rejects thenull hypothesis that the error terms from GLS estimation are uncorrelated with the right hand side variables [χ2(4) =5.83]. Thus, the trading-pair effects are not random, and fixed effects, rather than random effects, estimation is theappropriate method for handling the trading-pair heterogeneity.

13
The ordering of the provincial home bias ratios is also different when the heterogeneous
model is used. Under border III, it yields Quebec, Ontario, and Nova Scotia as the three
provinces with the largest home bias ratios, whereas the standard model yields Nova Scotia,
Newfoundland, and Prince Edward Island. Also, the heterogeneous model gives the provinces
with the smallest home bias ratios as Prince Edward Island, Manitoba, and New Brunswick,
whereas the standard model has British Columbia, Ontario, and Alberta. The heterogeneous
model also has much more disperse provincial home bias ratios, with the largest being about 4.4
times the smallest, whereas the analogous number for the standard model is 2.8.
Under border IV, which has heterogeneous and asymmetric border effects, the results are
richer than suggested by the results for borders II and III. The home bias ratios of only six of the
provinces are consistent with border II. For the other four provinces�Alberta, British
Columbia, Ontario, and Quebec�the border has much larger dampening effects on imports from
the U.S. than on exports to the U.S..
Comparisons with the standard model once again demonstrate stark differences. In
particular, for U.S.-to-Canada trade the heterogeneous and standard models have virtually
nothing in common. The three largest home bias ratios from the heterogeneous model are for
Quebec (69.7), Ontario (40.8), and Alberta (29.0); whereas from the standard model they are for
Nova Scotia (41.5), Newfoundland (32.7), and Prince Edward Island (24.0). The three smallest
are for Prince Edward Island (3.7), Manitoba (8.5) and New Brunswick (9.0); whereas from the
standard model they are Ontario (8.3), Manitoba (10.4), and British Columbia (10.7).
Interestingly, the ranking of the Canada-to-U.S. home bias ratios are very similar for the

14
two versions of the gravity model, although those from the heterogeneous model are in every
case more than twice as large. In fact, for the five smallest home bias ratios, the ranking is
identical in the two models, with the three smallest being for Alberta (17.4), British Columbia
(18.2), and Prince Edward Island (23.9). Of course, the provinces with the five largest home bias
ratios are also the same from the heterogeneous as from the standard model, although the third
and fifth positions are reversed. The top three from the heterogeneous model are Nova Scotia
(38.1), Newfoundland (37.9), and Manitoba (28.8).
3. Concluding remarks
Using a standard gravity model, previous studies have established that the Canada-U.S.
border has a very large dampening effect on the volume of Canada-U.S. trade, and that its effect
is asymmetric and differs significantly across provinces. My results using a heterogeneous
gravity model do not alter these general results, although they do indicate that many of the
detailed results of the previous literature should be reconsidered. Specifically, I found that when
the standard gravity model is replaced with a heterogeneous gravity model: the home bias is 40
percent larger; the asymmetry of the border is reversed; and all of the provincial differences are
altered significantly. The differences between these results and those from the previous literature
should be important to anyone trying to explain the sources of the border effects.

15
References
Anderson, J.E., 2000, �Why Do Nations Trade (So Little)?� Pacific Economic Review 5, 115-
134.
����, 1979, �A Theoretical Foundation for the Gravity Equation,� American Economic
Review 69, 106-116.
Anderson, M.A. and S.L.S. Smith, 1999a, �Do National Borders Really Matter? A
Reconsideration of Canada-U.S. Regional Trade,� Review of International Economics 7,
219-227.
����, 1999b, �Canadian Provinces in World Trade: Engagement and Detachment,�
Canadian Journal of Economics 32, 22-38.
Bayoumi, T. and B. Eichengreen, 1997, �Is Regionalism Simply a Diversion? Evidence from the
Evolution of the EC and EFTA,� in T. Ito and A. O. Krueger, Eds., Regionalism versusMultilateral Trade Arrangements, University of Chicago Press.
Bergstrand, J. H., 1985, �The Gravity Equation in International Trade: Some Microeconomic
Foundations and Empirical Evidence,� Review of Economics and Statistics 67, 474-481.
Cheng, I.H. and H.J. Wall, 1999, "Controlling for Heterogeneity in Gravity Models of Trade,"
Federal Reserve Bank of St. Louis Working Paper 99-010.
Deardorff, A. V., 1998, �Determinants of Bilateral Trade: Does Gravity Work in a Neoclassical
World?� in J. A. Frankel, ed., The Regionalization of the World Economy, University of
Chicago Press.
Engel, C. and J.H. Rogers, 1995, �How Wide is the Border?� American Economic Review 86,
1112-1125.
Evans, C.L., 2000, �The Sources for the Border Effects: Nationality or Location,� Manuscript,
Federal Reserve Bank of New York.
Helliwell, J.F., 1996, �Do National Borders Matter for Quebec�s Trade?� Canadian Journal ofEconomics 29, S324-330.
����, 1998, How Much Do National Borders Matter?, Brookings Institutional Press.

16
Mátyás, L, 1997, �Proper Econometric Specification of the Gravity Model,� The World Economy20, 363-368.
McCallum, J., 1995, �National Borders Matter: Canada-U.S. Regional Trade Patterns,�
American Economic Review 85, 615-623.
Obstfeld, M. and K. Rogoff, 2000, �The Six Major Puzzles in International Economics: Is There
a Common Cause?� in B.S. Bernanke and J. Rotemberg, eds., NBER MacroeconomicsAnnual 2000, MIT Press.
Pöyhönen, P., 1963, �A Tentative Model for the Volume of Trade Between Countries,�
Weltwirtschaftliches Archive 90, 93-100.
Tinbergen, J., 1962, Shaping the World Economy - Suggestions for an International EconomicPolicy, The Twentieth Century Fund.
Wei, S.-J., 1996, �Intra-National versus International Trade: How Stubborn are Nations in
Global Integration,� NBER Working Paper 5531.
Wolf, H.C., 2000, �(Why) Do Borders Matter for Trade,� in G. Hess and E. van Wincoop, eds.,
Intranational Macroeconomics, Cambridge University Press, forthcoming.

17
Table 1: British Columbia�s Trade;provinces vs. states, 1996
total trade with BCas % of GDP
Alberta 6.9 2.6 Washington
Manitoba 2.0 0.3 California
New Brunswick 2.3 0.2 Maine
Ontario 1.9 0.2 Ohio
Quebec 1.4 0.1 New York
Saskatchewan 2.4 1.0 Montana

18
Table 2: Regression Results; Standard gravity model, 1994-96
Border I Border II Border III Border IV
constant -6.238 (0.304) -6.238 (0.301) -4.899 (0.355) -4.899 (0.344)
log of origin GDP 0.933 (0.013) 0.977 (0.014) 0.855 (0.017) 0.934 (0.020)
log of destination GDP 1.007 (0.013) 0.964 (0.014) 0.928 (0.017) 0.849 (0.020)
1995 dummy 0.019 (0.041) 0.019 (0.041) 0.023 (0.039) 0.023 (0.038)
1996 dummy 0.021 (0.041) 0.021 (0.041) 0.028 (0.039) 0.028 (0.038)
log of distance -1.155 (0.026) -1.155 (0.026) -1.121 (0.027) -1.122 (0.026)
U.S. ↔ Canada border -2.715 (0.063)
U.S. → Canada border -2.885 (0.066)
Canada → U.S. border -2.546 (0.066)
U.S. → AlbertaAlberta → U.S. -2.359 (0.084)
-2.716 (0.096)-2.002 (0.096)
U.S. → British ColumbiaBritish Columbia → U.S. -2.210 (0.085)
-2.370 (0.097)-2.049 (0.097)
U.S. → ManitobaManitoba → U.S. -2.420 (0.078)
-2.344 (0.094)-2.495 (0.094)
U.S. → New BrunswickNew Brunswick → U.S. -2.642 (0.078)
-2.763 (0.094)-2.521 (0.095)
U.S. → NewfoundlandNewfoundland → U.S. -3.129 (0.079)
-3.488 (0.098)-2.769 (0.098)
U.S. → Nova ScotiaNova Scotia → U.S. -3.253 (0.078)
-3.725 (0.095)-2.780 (0.095)
U.S. → OntarioOntario → U.S. -2.267 (0.092)
-2.114 (0.104)-2.419 (0.104)
U.S. → PEIPEI → U.S. -2.742 (0.071)
-3.177 (0.107)-2.307 (0.107)
U.S. → QuebecQuebec → U.S. -2.708 (0.088)
-3.087 (0.100)-2.329 (0.100)
U.S. → SaskatchewanSaskatchewan → U.S. -2.553 (0.079)
-2.624 (0.094)-2.482 (0.094)
2R 0.807 0.811 0.823 0.834log-likelihood -4621.69 -4588.66 -4472.88 -4363.74Standard errors are in parentheses.

19
Table 3: Home-Bias Ratios, Standard gravity model, 1994-96
Border IVBorder I Border II Border III U.S. to
CanadaCanadato U.S.
U.S. ↔ Canada 15.1U.S. → Canada 17.9Canada → U.S. 12.8Alberta 10.6 15.1 7.4British Columbia 9.1 10.7 7.8Manitoba 11.2 10.4 12.1New Brunswick 14.0 15.8 12.4Newfoundland 22.9 32.7 15.9Nova Scotia 25.9 41.5 16.1Ontario 9.7 8.3 11.2PEI 15.5 24.0 10.0Quebec 15.0 21.9 10.3Saskatchewan 12.8 13.8 12.0

20
Table 4: Two-Stage Regression Results; Heterogeneous gravity model, 1994-96
Stage 1: Gravity equation with trading-pair interceptslog of origin GDP 0.931 (0.301)log of destination GDP 1.575 (0.301)1995 dummy 0.004 (0.017)1996 dummy 0.005 (0.024)
2R 0.984log-likelihood 212.28
Stage 2: Fixed effects regressed on distance and border specificationsBorder I Border II Border III Border IV
constant -12.719 (0.431) -12.719 (0.425) -12.038 (0.442) -12.038 (0.403)log of distance -1.048 (0.056) -1.048 (0.055) -1.140 (0.057) -1.140 (0.052)U.S. ↔ Canada border -3.072 (0.134)U.S. → Canada border -2.852 (0.137)Canada → U.S. border -3.293 (0.137)U.S. → AlbertaAlberta → U.S. -3.111 (0.168)
-3.367 (0.185)-2.856 (0.185)
U.S. → British ColumbiaBritish Columbia → U.S. -3.018 (0.169)
-3.315 (0.186)-2.901 (0.186)
U.S. → ManitobaManitoba → U.S. -2.751 (0.167)
-2.142 (0.184)-3.359 (0.184)
U.S. → New BrunswickNew Brunswick → U.S. -2.789 (0.167)
-2.194 (0.184)-3.356 (0.184)
U.S. → NewfoundlandNewfoundland → U.S. -3.108 (0.171)
-2.593 (0.187)-3.634 (0.187)
U.S. → Nova ScotiaNova Scotia → U.S. -3.457 (0.167)
-3.273 (0.185)-3.640 (0.185)
U.S. → OntarioOntario → U.S. -3.495 (0.168)
-3.708 (0.185)-3.282 (0.185)
U.S. → PEIPEI → U.S. -2.235 (0.167)
-1.300 (0.185)-3.172 (0.185)
U.S. → QuebecQuebec → U.S. -3.717 (0.167)
-4.244 (0.184)-3.191 (0.184)
U.S. → SaskatchewanSaskatchewan → U.S. -2.863 (0.167)
-2.384 (0.185)-3.342 (0.185)
2R 0.463 0.479 0.515 0.597log-likelihood -1787.01 -1769.81 -1726.96 -1618.84
Standard errors are in parentheses. For space considerations, the 1110 estimated fixed effects are suppressed.
21
Table 5: Home-Bias Ratios, Heterogeneous gravity model, 1994-96
Border IVBorder I Border II Border III U.S. to
CanadaCanadato U.S.
U.S. ↔ Canada 21.6U.S. → Canada 17.3Canada → U.S. 26.9Alberta 22.4 29.0 17.4British Columbia 20.5 27.5 18.2Manitoba 15.7 8.5 28.8New Brunswick 16.3 9.0 28.7Newfoundland 22.4 13.4 37.9Nova Scotia 31.7 26.4 38.1Ontario 33.0 40.8 26.6PEI 9.3 3.7 23.9Quebec 41.1 69.7 24.3Saskatchewan 17.5 10.8 28.3

22
Figure 1
Figure 2
Residuals from HeterogeneousGravity Model
-5-4-3-2-101234
0 2 4 6 8 10
log of exports
Residuals from the Standard GravityModel with Border IV
-5-4-3-2-101234
0 2 4 6 8 10
log of exports