graphic organizers - heartland area education agency organizers mind mapping or visual...
TRANSCRIPT

Graphic Organizers
Mind Mapping or Visual Representations: This process involves a minimum of words to share your ideas. Instead, individuals use images, pictures, diagrams, graphs, etc. to summarize and share information. Venn Diagram: The Venn Diagram is a graphic organizer used to compare and contrast information. In one “ring” of the Venn, list the unique characteristics of a subject; in the other “ring” list the unique characteristics of another subject. The common characteristics are placed in the intersecting center. Sample: Use the Venn Diagram to do a gap analysis of current practices and school improvement planning. This could help to determine what to abandon (ring #1 only), what plans to develop (ring #2 only), and what to celebrate (intersection.) PCI: Keeping your innovation, study topic, or plan in mind, complete the three sections of the PCI chart using individual reflection or pair/team interviews. P—Positives—What is working? What do you want to continue? What do you like? Etc. C—Concerns—What is not working? What are problems you are having? What are your concerns? I—Interesting insights— AHAs, things to think about, realizations, etc. The “P” you celebrate; the “I” gives you food for thought, and the “C” you develop into action plans. (Items in the other two columns might give you possible strategies for your plan.) KWL: Keeping your innovation, study topic, or plan in mind, complete the three sections of the KWL chart using individual reflection or pair/team interviews. K—Know—What do you know about the issue/topic? W—Want to Know— What do you want to know about the issue/topic? L—Learned— What have you learned about the issue/topic? Variation: Add an “H” to the chart and answer the question, “How will I find out?” What? So What? Now What? Keeping your innovation, study topic, or plan in mind, complete the three sections of the KWL chart using individual reflection or pair/team interviews. What?—What have you learned? So What?—What difference does it make? Now What?—What can you do with this information?
Current Practices
School Improvement Plan T
hing
s to
C
eleb
rate

PCI
P Positives
C Concerns
I Interesting Insights

K-W-L Strategy Sheet
K Know
W Want to know
L Learned

K-W-H-L Strategy Sheet
K Know
W Want to know
H How will I find out
L Learned
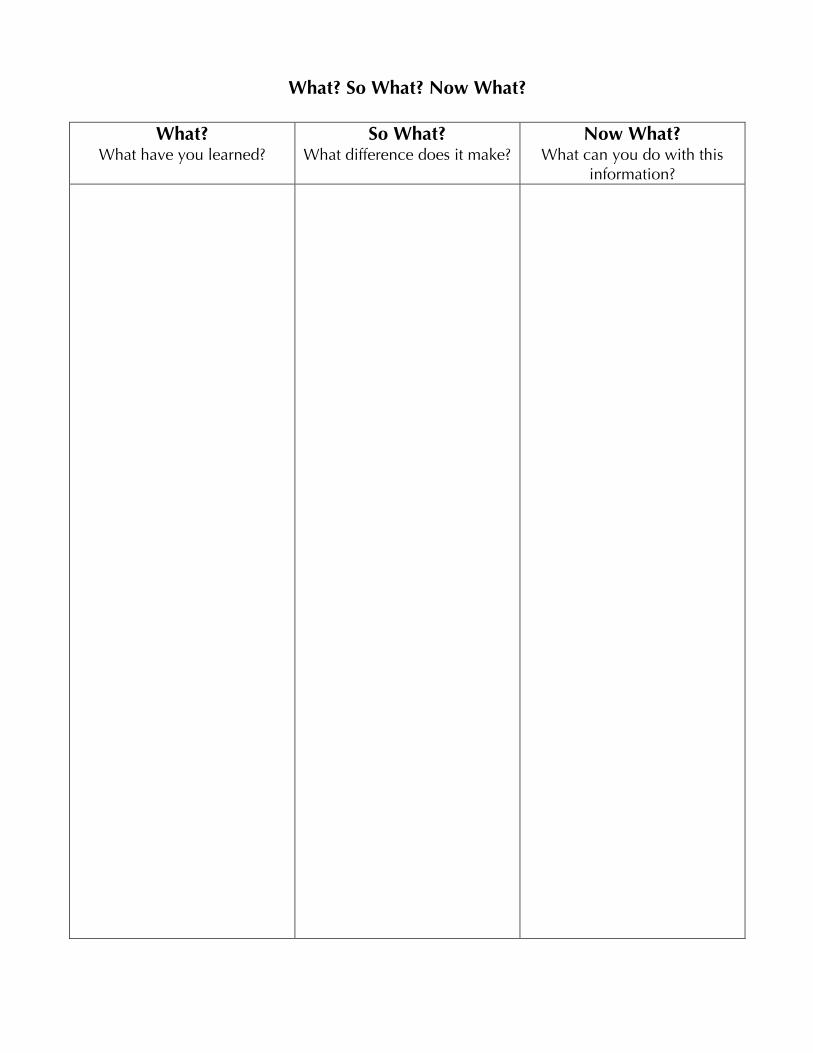
What? So What? Now What?
What? What have you learned?
So What? What difference does it make?
Now What? What can you do with this
information?
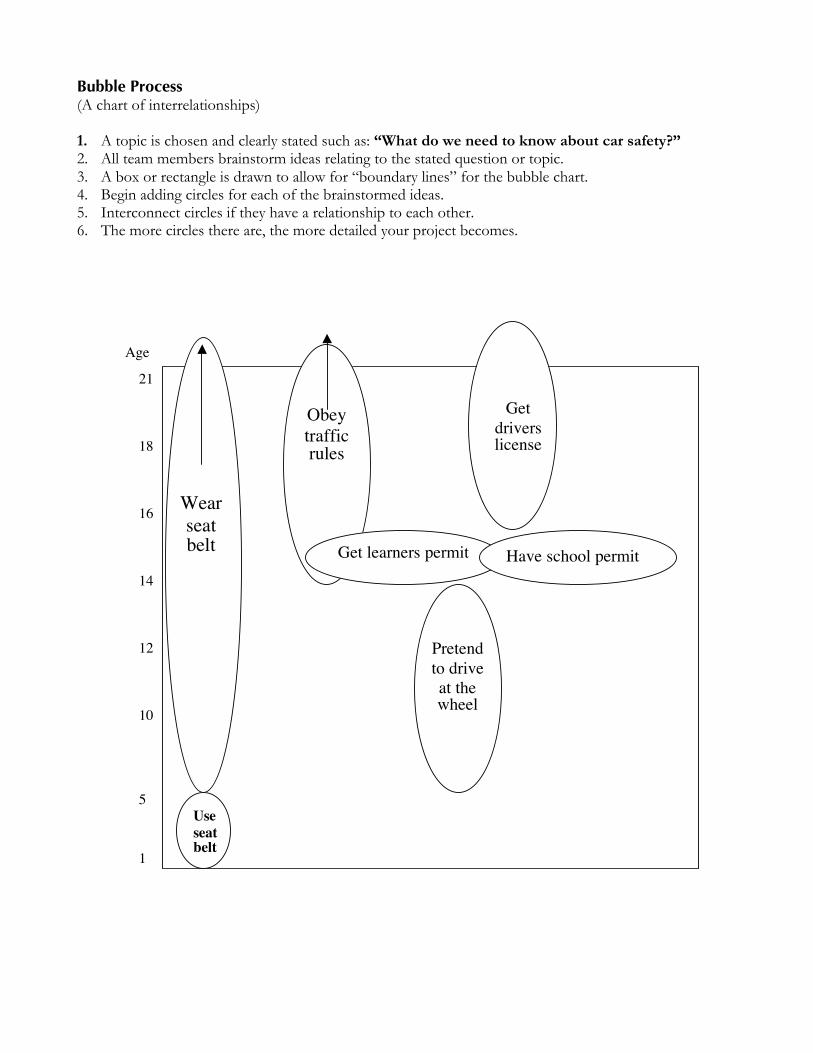
Bubble Process (A chart of interrelationships) 1. A topic is chosen and clearly stated such as: “What do we need to know about car safety?” 2. All team members brainstorm ideas relating to the stated question or topic. 3. A box or rectangle is drawn to allow for “boundary lines” for the bubble chart. 4. Begin adding circles for each of the brainstormed ideas. 5. Interconnect circles if they have a relationship to each other. 6. The more circles there are, the more detailed your project becomes.
Age
21
18
16
14
12
10
5
1
Wear
seat belt
Use
seat belt
Obey
traffic rules
Get learners permit Have school permit
Pretend
to drive
at the wheel
Get
drivers license

Right Angle
1. Topic Select topic. Individuals can bring information/ideas to session or read an article in session for information. TOPIC:_______________________________
2. Facts
If using an article, either use Roundrobin or Jigsaw as strategies to share with the group the necessary facts. Think about the main ideas. What are the facts that we need to remember or think about as most important? If using a handout, complete the facts individually as you are reflecting or reading the article. If using chart paper, recorder records the facts as verbally shared with the group.
3. Implication
What meaning do we get from these facts? The groups needs to come to consensus and state in one or two sentences the meaning gained from sharing the facts.
4. Application
What will we do with this information? This is really a first step in action planning. What do we want to do with the information that we have just read and shared?
Use Roundrobin as the strategy to get input from each team member. Try to get at least one idea from each team member of an action to take based on the information and meaning gained from the article, video, or ideas.
Bellanca, James. (1990) The cooperative think tank: Graphic organizers to teach thinking in the cooperative classroom. Palatine, IL: Skylight Publishing.
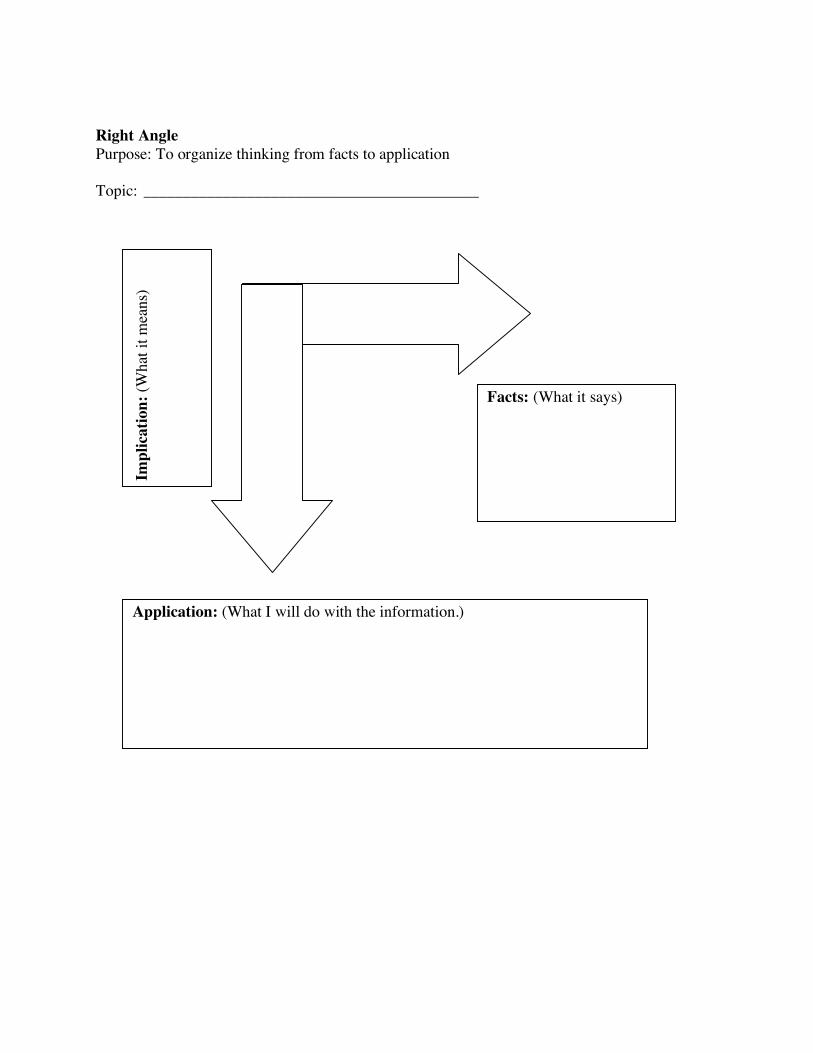
Right Angle Purpose: To organize thinking from facts to application Topic: __________________________________________
Impl
icat
ion:
(Wha
t it m
eans
)
Facts: (What it says)
Application: (What I will do with the information.)
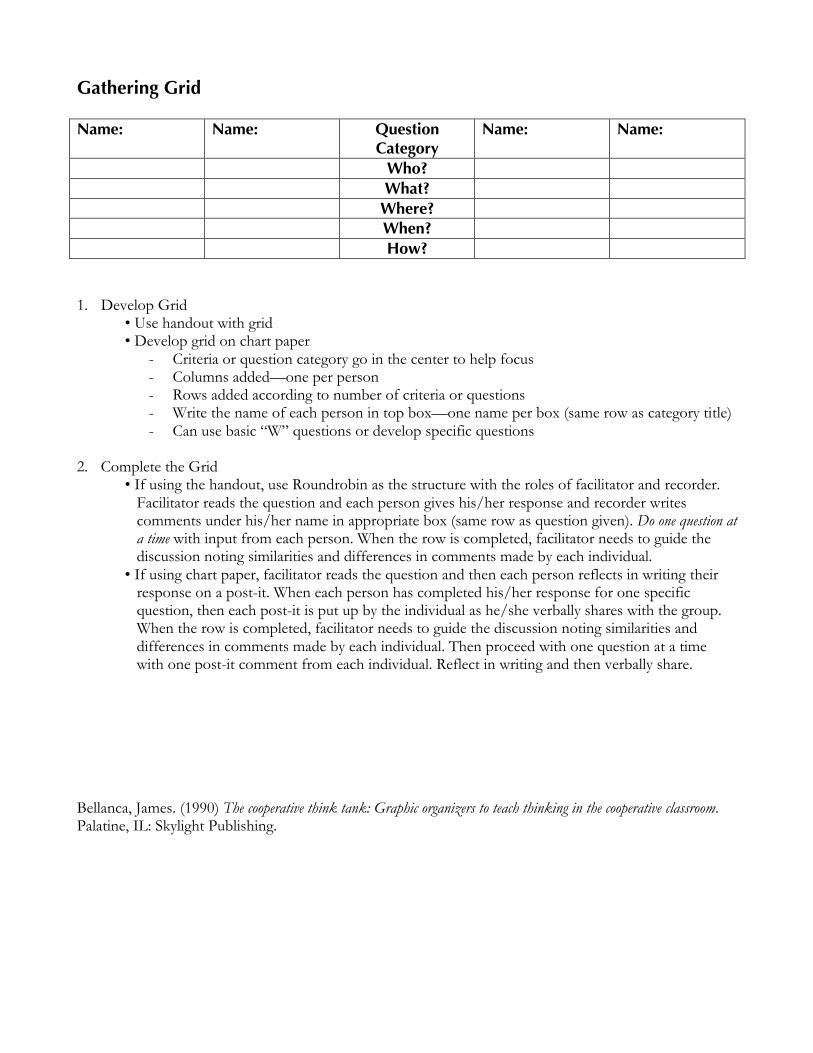
Gathering Grid Name: Name: Question
Category Name: Name:
Who? What? Where? When? How? 1. Develop Grid
• Use handout with grid • Develop grid on chart paper
- Criteria or question category go in the center to help focus - Columns added—one per person - Rows added according to number of criteria or questions - Write the name of each person in top box—one name per box (same row as category title) - Can use basic “W” questions or develop specific questions
2. Complete the Grid
• If using the handout, use Roundrobin as the structure with the roles of facilitator and recorder. Facilitator reads the question and each person gives his/her response and recorder writes comments under his/her name in appropriate box (same row as question given). Do one question at a time with input from each person. When the row is completed, facilitator needs to guide the discussion noting similarities and differences in comments made by each individual.
• If using chart paper, facilitator reads the question and then each person reflects in writing their response on a post-it. When each person has completed his/her response for one specific question, then each post-it is put up by the individual as he/she verbally shares with the group. When the row is completed, facilitator needs to guide the discussion noting similarities and differences in comments made by each individual. Then proceed with one question at a time with one post-it comment from each individual. Reflect in writing and then verbally share.
Bellanca, James. (1990) The cooperative think tank: Graphic organizers to teach thinking in the cooperative classroom. Palatine, IL: Skylight Publishing.

Nam
e
Nam
e
Que
stio
n C
ateg
ory
Nam
e
Gat
heri
ng G
rid
Top
ic:
Nam
e

How Do I Learn To Do It? Experts who study how people teach and learn effectively identify six steps that make learning to do something new, clear and easy. You will have the benefit of learning more efficiently if you know what to look for, why you might be confused, and what kind of help to ask for. Directions: Complete the flowchart to record why each of the steps in learning a new skill is important. 1. Identify when you have learned something like this before. Connecting new learning to something you
already know makes it easier and less confusing to learn the new skill. You are more confident that you will be able to do the new activity because you remember how well you can already do something similar.
2. Listen for the “objective” that describes what you are about to learn. By understanding at the
beginning what the lesson is about, you keep the purpose of the lesson in mind and connect the rest of the lesson to it. If you miss hearing the objective, you may almost follow the steps that the teacher is explaining, but not really understand what the process if for.
3. Be sure that you follow carefully the explanation or demonstration that the teacher shows you. If you
misunderstand any step, you may not be able to do the process. Check yourself to be sure you understand why, as well as how, each step in the process is done.
4. Did you practice the process enough while the teacher could help you? Although you think you
understand how to do something at the time, you may later find out that you misunderstood or cannot remember how to do one of the steps.
5. Can you do the process accurately and quickly? Teachers assign the number of practice problems
necessary for most students to do the task fast and well. Only you know whether you do the process quickly and accurately enough.
6. When will you use the process again? Expecting to use it helps you realize how well you understand it
now and reminds you of the process when you are asked to use it again.
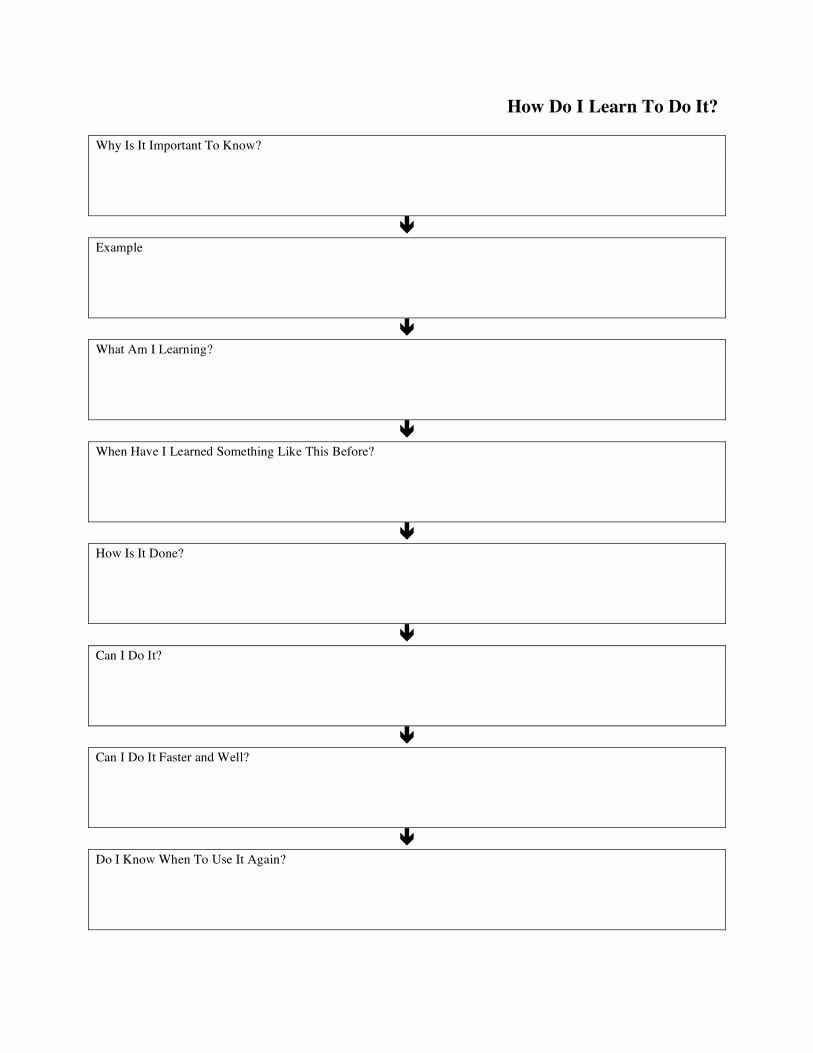
How Do I Learn To Do It?
Why Is It Important To Know?
Example
What Am I Learning?
When Have I Learned Something Like This Before?
How Is It Done?
Can I Do It?
Can I Do It Faster and Well?
Do I Know When To Use It Again?