graph alignment and biological networks
TRANSCRIPT

Graph Alignment and Biological Networks
Johannes Berg
http://www.uni-koeln.de/˜berg
Institute for Theoretical Physics
University of Cologne
Germany
– p.1/12

Networks in molecular biology
New large-scale experimental data in the form of networks:
transcription networks
protein interaction networks
co-regulation networks
signal transduction networks, metabolic networks, etc.
– p.2/12

Networks in molecular biology
New large-scale experimental data in the form of networks:
transcription networkstranscription factors bind to regulatory DNA
polymerase molecule begins transcription of the gene
– p.2/12

Networks in molecular biology
New large-scale experimental data in the form of networks:
transcription networkstranscription factors bind to regulatory DNA
polymerase molecule begins transcription of the gene
– p.2/12

Networks in molecular biology
New large-scale experimental data in the form of networks:
transcription networkstranscription factors bind to regulatory DNA
polymerase molecule begins transcription of the gene
sea urchinBolouri &Davidson (2001)
– p.2/12

Networks in molecular biology
New large-scale experimental data in the form of networks:
protein interaction networksproteins interact to form larger units
protein aggregates may catalyze reactions etc.
– p.2/12

Networks in molecular biology
New large-scale experimental data in the form of networks:
protein interaction networksproteins interact to form larger units
protein aggregates may catalyze reactions etc.
protein interactions in yeastUetz et al. (2000)
– p.2/12

Sequence alignment in molecular biology
more than 100 organisms are fully sequenced
genome sizes range from 3 × 10⁷ to 7 × 10¹¹ basepairs
– p.3/12

Sequence alignment in molecular biology
more than 100 organisms are fully sequenced
genome sizes range from 3 × 10⁷ to 7 × 10¹¹ basepairs
Global alignment: search for related sequences across species
evolutionary relationships
hints at common functionality
– p.3/12

Sequence alignment in molecular biology
more than 100 organisms are fully sequenced
genome sizes range from 3 × 10⁷ to 7 × 10¹¹ basepairs
Motif search: search for short repeated subsequences
binding sites in transcription control
– p.3/12

Sequence alignment in molecular biology
more than 100 organisms are fully sequenced
genome sizes range from 3 × 10⁷ to 7 × 10¹¹ basepairs
Tools
statistical models are used infer non-random correlations against abackground
build score function from statistical models
design efficient algorithms to maximize score
evaluate statistical significance of a given score
organism number of genes
worm C. elegans 19 000fruit fly drosophila 17 000
human homo sapiens . 25 000
– p.3/12

Graph alignment
What can be learned from network data?Can we distinguish functional patterns from a random background?
1. Search for network motifs [Alon lab]
patterns occurring repeatedly within a given network
2. Alignment of networks across species
identify conserved regions
pinpoint functional innovations
– p.4/12

Graph alignment
What can be learned from network data?Can we distinguish functional patterns from a random background?
1. Search for network motifs [Alon lab]
patterns occurring repeatedly within a given network
2. Alignment of networks across species
identify conserved regions
pinpoint functional innovations
Tools
scoring function based on statistical models
heuristic algorithms: algorithmic complexity
– p.4/12

Graph alignment I: The search for network motifs
patterns occurring repeatedly in the network
building blocks of information processing [Alon lab]
– p.5/12

Graph alignment I: The search for network motifs
patterns occurring repeatedly in the network
building blocks of information processing [Alon lab]
counting of identical patterns: Subgraph census
alignment of topologically similar regions of a network
allow for mismatches
construct a scoring function comparing the aligned subgraphs to abackground model
α=1
Alignment
α=3
α=2
– p.5/12

Statistical properties of alignments
consensus motif c = cij
Alignment
α=3
α=2
α=1
i=1 i=2
Σ α
αij
– p.6/12

Statistical properties of alignments
consensus motif c = cij
Alignment
α=3
α=2
α=1
i=1 i=2
Σ α
αij
consensus motif c = 1
p
∑p
α=1c
α
number of internal links
average correlation between two subgraphs fuzziness of motif
– p.6/12

Statistics of network motifs
null model:
ensemble of uncorrelated networks with the same connectivities asthe data
– p.7/12
Statistics of network motifs
null model:
ensemble of uncorrelated networks with the same connectivities asthe data
model describing network motifs
ensemble with enhanced number of links
enhanced correlation of subgraphs divergent vs convergent evolution?
– p.7/12

Statistics of network motifs
null model:
ensemble of uncorrelated networks with the same connectivities asthe data
model describing network motifs
ensemble with enhanced number of links
enhanced correlation of subgraphs divergent vs convergent evolution?
Log likelihood score
S(c1, . . . , cp) = log
(
Q(c1, . . . , cp)∏p
α=1Pσ(cα)
)
= (σ − σ0)
p∑
α=1
L(cα) −µ
2p
p∑
α,β=1
M(cα, cβ) − log Z
Algorithm: Mapping onto a model from statistical mechanics (Potts model)
– p.7/12
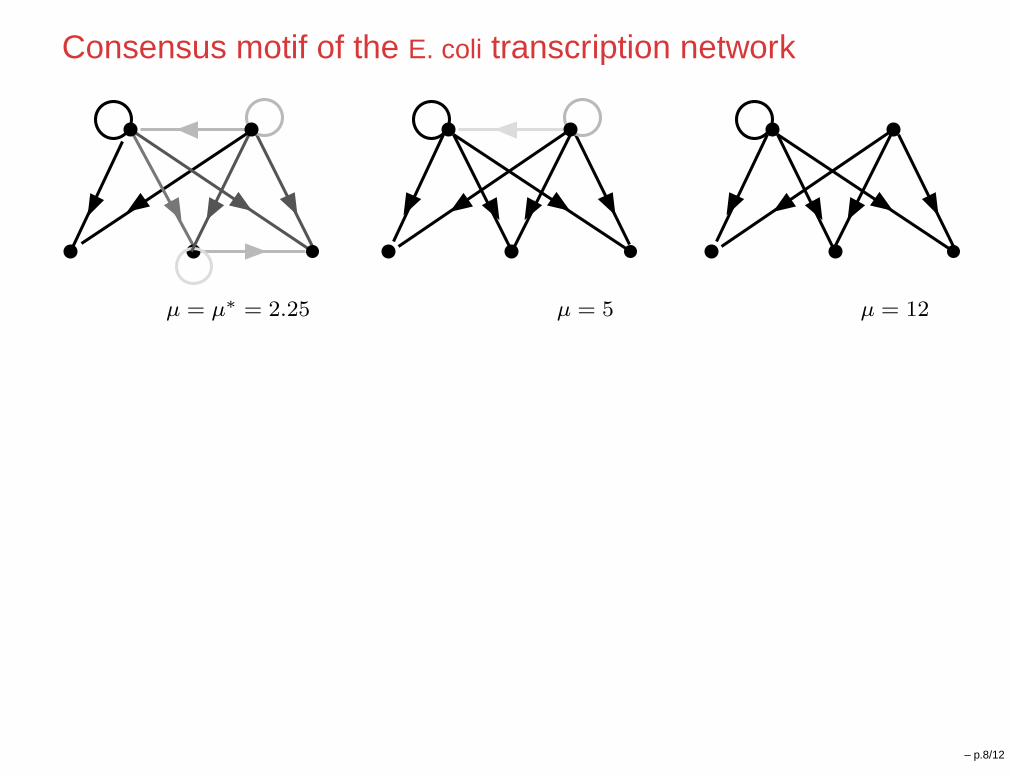
Consensus motif of the E. coli transcription network
µ = µ∗
= 2.25 µ = 5 µ = 12
– p.8/12

Consensus motif of the E. coli transcription network
µ = µ∗
= 2.25 µ = 5 µ = 12
0 0.2 0.4 0.6 0.8 1<c α >
0
0.2
0.4
0.6
0.8
1
c
0 0.2 0.4 0.6 0.8 1<c
αc
β>
0
0.2
0.4
0.6
0.8
1
c c
α
α β
– p.8/12

Graph alignment II: Comparing networks across species
– p.9/12

Graph alignment II: Comparing networks across species
Alignment: Pairwise association of nodes across species
– p.9/12

Graph alignment II: Comparing networks across species
Last common ancestor
– p.9/12

Graph alignment II: Comparing networks across species
Evolutionary dynamics: Link attachment and deletion
– p.9/12

Graph alignment II: Comparing networks across species
Evolutionary dynamics: Link attachment and deletion
– p.9/12

Graph alignment II: Comparing networks across species
Representation of the alignment in a single network. Conserved links areshown in green.
– p.9/12
Scoring graph alignments across species
null model P :
ensemble of uncorrelated networks with the same connectivities asthe data
Q-model
correlated networks (due to functional constraints or common ancestry)
statistical assessment of orthologs: interplay between sequence similarityand network topology
Scoring alignments
log-likelihood score S = log(Q/P ) is used to search for conservedparts of the networks
– p.10/12

Application to Co-Expression networks
alignment of H. sapiens and M. musculus
– p.11/12

Application to Co-Expression networks
ribosomal proteins
mitochondrial precursorsmyelin proteolipid protein
skeletal muscle proteins
alignment of H. sapiens and M. musculus
– p.11/12

Genomic systems biology and network analysis
New concept and tools are needed to fully utilize high-throughput data
functional design versus noise: statistical analysis
evolutionary conservation indicates function
Topological conservation versus sequence conservation
genes may change functional role in network with smallcorresponding change in sequence
the role of a gene in one species may be taken on by an entirelyunrelated gene in another species
References:
J. Berg and M. Lässig, "Local graph alignment and motif search in biologicalnetworks”, Proc. Natl. Acad. Sci. USA, 101 (41) 14689-14694 (2004)
J. Berg, M. Lässig, and A. Wagner, “Structure and Evolution of Protein InteractionNetworks: A Statistical Model for Link Dynamics and Gene Duplications”, BMC
Evolutionary Biology 4:51 (2004)
J. Berg, S. Willmann und M. Lässig, “Adaptive evolution of transcription factor bindingsites”, BMC Evolutionary Biology 4(1):42 (2004)
J. Berg and M. Lässig, "Correlated random networks", Phys. Rev. Lett. 89(22), 228701(2002)
– p.12/12