grapevine vein clearing virus: epidemiological patterns
TRANSCRIPT

BearWorks BearWorks
MSU Graduate Theses
Summer 2018
Grapevine Vein Clearing Virus: Epidemiological Patterns and Grapevine Vein Clearing Virus: Epidemiological Patterns and
Construction of a Clone Construction of a Clone
Cory Von Keith Missouri State University, [email protected]
As with any intellectual project, the content and views expressed in this thesis may be
considered objectionable by some readers. However, this student-scholar’s work has been
judged to have academic value by the student’s thesis committee members trained in the
discipline. The content and views expressed in this thesis are those of the student-scholar and
are not endorsed by Missouri State University, its Graduate College, or its employees.
Follow this and additional works at: https://bearworks.missouristate.edu/theses
Part of the Cellular and Molecular Physiology Commons, Molecular Genetics Commons,
Plant Pathology Commons, Population Biology Commons, Virology Commons, and the
Viticulture and Oenology Commons
Recommended Citation Recommended Citation Keith, Cory Von, "Grapevine Vein Clearing Virus: Epidemiological Patterns and Construction of a Clone" (2018). MSU Graduate Theses. 3300. https://bearworks.missouristate.edu/theses/3300
This article or document was made available through BearWorks, the institutional repository of Missouri State University. The work contained in it may be protected by copyright and require permission of the copyright holder for reuse or redistribution. For more information, please contact [email protected].

GRAPEVINE VEIN CLEARING VIRUS: EPIDEMIOLOGICAL
PATTERNS AND CONSTRUCTION OF A CLONE
A Master’s Thesis
Presented to
The Graduate College of
Missouri State University
TEMPLATE
In Partial Fulfillment
Of the Requirements for the Degree
Master of Science, Plant Science
By
Cory Von Keith
August 2018

ii
Copyright 2018 by Cory Von Keith

iii
GRAPEVINE VEIN CLEARING VIRUS: EPIDEMIOLOGICAL PATTERNS
AND CONSTRUCTION OF A CLONE
College of Agriculture
Missouri State University, August 2018
Master of Science
Cory Von Keith
ABSTRACT
Grapevine vein clearing virus (GVCV) is a recently discovered virus belonging to the
Badnavirus genus. Characteristic to its name, the virus is associated with a disease where
symptoms manifest as pronounced vein-clearing, resulting in severe berry deformation
and vine decline in susceptible grape varieties. Sustainable production of wine is
dependent on healthy plants. The associated disease is mainly found in Midwest
vineyards. Attempts were made in this thesis to provide evidence of causality of the virus
to the associated disease and to infer the historical path and migration pattern of GVCV.
Conclusions and discussions will provide grape producers with the latest information in
designing management strategies to prevent the disease. The results support that GVCV
is likely a native endemic virus, which has recently cultivated grapevines. This evidence
is crucial in establishing quarantine protocols to prevent the spread of GVCV into new
territories and to avoid pandemic in grape-growing regions worldwide.
KEYWORDS: Grapevine vein clearing virus, epidemiology, phylogeography, endemic,
infectious clone, Koch’s postulates, emergent, virus
This abstract is approved as to form and content
_______________________________
Dr. Wenping Qiu
Chairperson, Advisory Committee
Missouri State University

iv
GRAPEVINE VEIN CLEARING VIRUS: EPIDEMIOLOGICAL PATTERNS
AND CONSTRUCTION OF A CLONE
By
Cory Von Keith
A Master’s Thesis
Submitted to the Graduate College
Of Missouri State University
In Partial Fulfillment of the Requirements
For the Degree of Master of Science, Plant Science
August 2018
Approved:
_______________________________________
Dr. Wenping Qiu
_______________________________________
Dr. William McClain
_______________________________________
Dr. John Heywood
_______________________________________
Dr. Julie Masterson: Dean, Graduate College
In the interest of academic freedom and the principle of free speech, approval of this thesis indicates the
format is acceptable and meets the academic criteria for the discipline as determined by the faculty that
constitute the thesis committee. The content and views expressed in this thesis are those of the student-
scholar and are not endorsed by Missouri State University, its Graduate College, or its employees.
v
ACKNOWLEDGEMENTS
First, and foremost, I would like to thank my family. I have put them through a
significant amount of hell in their life, but they never gave up. They always pushed me to
be better, and would not allow me to live beneath my potential. I love all of you.
I am incredibly thankful for the opportunity that the Darr College of Agriculture has
provided me. Dr. Qiu, especially took a risk on a student who did not have the best
undergraduate records and provided me with an opportunity to make up for past
mistakes. His patience and wisdom will not be forgotten, and he has been a powerful role
model in helping me to refine my academic pursuits.
Su Li and Sylvia, you have both been like sisters to me and I will cherish all the
memories that we have made. Sylvia, I’m sure that you are expecting me to write some
emotional nonsense about how we are the same person and I am glad that we found each
other in life, but I won’t do it.
I owe a significant amount of debt to undergraduate researchers that I tricked into
helping me complete DNA extractions. You are not forgotten.
Rory, you have taught me that you can forget anything with enough liquid
degeneracy.
I dedicate this thesis to Paul “Muad’Dib” Atreides.

vi
TABLE OF CONTENTS
Literature Review.................................................................................................................1
Wine industry ...........................................................................................................1
Epidemiology ...........................................................................................................4
Plant immunity .........................................................................................................7
Viral taxonomy and classification .........................................................................10
Viral lifecycle and cellular remodeling ..................................................................13
Evolution of viruses ...............................................................................................15
Endemic, emergence, epidemic, and pandemic .....................................................19
Badnaviruses ..........................................................................................................22
Grapevine vein clearing virus ................................................................................24
Rationale ................................................................................................................28
Chapter 1: Epidemiological patterns of GVCV .................................................................30
Introduction ............................................................................................................30
Materials and Methods ...........................................................................................36
Synopsis ........................................................................................................36
Collection of samples ....................................................................................38
DNA extraction and PCR detection of GVCV .............................................38
ORF II amplification and Sanger sequencing ...............................................39
Sequence alignment and recombination detection ........................................39
Neighbor joining tree and molecular clock estimation .................................40
Test of selection ............................................................................................40
Test of suitability of ORF II as a candidate for phylogenetic reconstruction 40
BEAUti and the BEAST ...............................................................................41
SPREAD .......................................................................................................42
Results ...................................................................................................................42
Viral detection and clock rate estimation .......................................................42
Test of selection .............................................................................................43
Test of phylogeny ..........................................................................................43
Phylogeographic analysis...............................................................................43
Discussion .............................................................................................................44
Sampling and incidence suggest endemic nature...........................................44
Implications of the 9bp-Indel .........................................................................45
Molecular clock .............................................................................................46
Purifying selection .........................................................................................47
Maximum Likelihood phylogenetic analysis .................................................47
Phylogenetic problems ...................................................................................48
Genetic diversity, host diversity, geographic diversity ..................................50
Summary ...............................................................................................................50
Chapter 2: Construction of a Grapevine vein clearing virus clone ....................................53
Introduction ............................................................................................................53

vii
Materials and Methods ...........................................................................................55
Synopsis ........................................................................................................55
Design ...........................................................................................................55
Construction ..................................................................................................56
Transfer to binary vector and Agrobacterium transformation ......................59
Transfection of Nicotiana benthamiana .......................................................60
Sequencing of pGWB/GVCV .......................................................................61
Results ...................................................................................................................61
Summary ........................................................................................................61
Construction ...................................................................................................61
Transfer to binary vector and Agrobacterium transformation .......................62
Sequencing .....................................................................................................63
Second attempt ...............................................................................................63
Discussion .............................................................................................................63
References ..........................................................................................................................65
Appendices ......................................................................................................................113
Appendix A. 2016 and 2017 Positive Samples and Locations ............................113
Appendix B. Codon Test of Positive Selection ...................................................116

viii
LIST OF TABLES
Table 1. Number of samples collected over the previous years. .......................................80
Table 2. Primer list……………………………………………………………………….80
Table 3. Molecular clock rates of sequences and R2 values………………………….......80
Table 4. Restriction enzyme list used in construction of clone………………………….81
Table 5. Table of plasmids and restriction enzymes used in the first step of clone
construction………………………………………………………………………………81

ix
LIST OF FIGURES
Figure 1. Native range of Vitis rupestris. …………………………...……………….…..82
Figure 2. Native range of Vitis riparia...............................................................................83
Figure 3. Native range of Ampelopsis cordata……………………………………………….. 84
Figure 4. Native range of Vitis cinerea ..............................................................................85
Figure 5. Native range of Vitis vulpina. .............................................................................86
Figure 6. Native range of Vitis Spp. ...................................................................................87
Figure 7: Example of triplex PCR diagnostic to test for Grapevine vein clearing virus
……………………………………………………………………………………………………….88
Figure 8: Locations of Grapevine vein clearing virus-infected samples in from 2016 and
2017……………………………………………………………………………………....89
Figure 9: Neighbor-joining tree of GVCV ORF II sequences. ..........................................90
Figure 10: Neighbor-joining tree of Grapevine vein clearing virus genomes. ..................91
Figure 11: Neighbor-joining tree of Badnavirus genomes, that is used for estimation of
molecular clock………………………………………………………………………….. 92
Figure 12: Linear regression of evolutionary distance and time of GVCV based on ORF
II sequences……….………………………………………..…………………………….93
Figure 13: Linear regression of evolutionary distance and time of Grapevine vein
clearing virus based on the genome sequences.. ...............................................................94
Figure 14: Linear regression of evolutionary distance and time of Badnaviruses based on
the genome sequences.. ......................................................................................................95
Figure 15: Maximum Likelihood tree of GVCV based on ORF II sequences that
collapsed to a 70% bootstrap cutoff value.. .......................................................................96
Figure 16: Screenshot from Tracer of ESS values and 95% HPD interval. ......................97
Figure 17: Screenshot from Tracer showing ESS values for the GTR gamma distribution
for rates at each codon position are highlighted. ...............................................................98

x
Figure 18: Divergence time and relative effective population size of Grapevine vein
clearing virus estimated using ORF II sequence data…………………………………...99
Figure 19: Maximum clade credibility tree of GVCV isolates, based on ORF II
sequences, evolution through time.. .................................................................................100
Figure 20: Maximum clade credibility tree of GVCV isolates, based on ORF II
sequences, evolution through time. ..................................................................................101
Figure 21: Maximum clade credibility tree of GVCV isolates, based on ORF II
sequences, evolution through time. ..................................................................................102
Figure 22: Maximum clade credibility tree of GVCV isolates, based on ORF II
sequences, evolution through time. ..................................................................................103
Figure 23: Genome arrangement of GVCV-CHA reference. ..........................................104
Figure 24: GVCV genome with overlapping PCR fragments. ........................................105
Figure 25: Restriction enzyme digested fragments from PCR products………………..106
Figure 26: Fragments from Figure 3 ligated in correct orientation………………….…106
Figure 27: pCR8/GVCV. .................................................................................................107
Figure 28: pGWB/GVCV. ...............................................................................................108
Figure 29: Ligation of fragments “RsrII-SalI” and “SalI-AvrII” to make fragment “RsrII-
AvrII” consisting of 7,286 bps. ........................................................................................109
Figure 30: Ligation of “1.4 genome” into pGWB 401 to make pGWB/GVCV. .............110
Figure 31: Restriction digest of pCR8/1179 and pCR8/4804. .........................................111
Figure 32: Gel image of multiple pCR8/GVCV plasmids to check for contamination. ..112

1
LITERATURE REVIEW
Wine industry
Wine has had a profound impact on the cultural development of the world.
Evidence from archaeological findings suggest civilizations began producing wine at
least 8,000 years ago (1, 2). “As a medicine, social lubricant, mind-altering substance,
and highly valued commodity, wine became the focus of religious cults, pharmacopoeias,
cuisines, economies, and society in the ancient Near East” (3). It is difficult to determine
the influence wine has had on society, but it has left an impact that reverberates through
many western cultures exemplified by the incorporation of wine into religious rituals
such as the cults of Dionysus of ancient Greece and the eucharist of the Christian
tradition. Today Vitis vinifera, or grapevine, is still a globally important crop. The fruit of
the plant is consumed in the form of fresh fruit, dried fruit, juice, and wine. In 2016, the
total global production of grapes was75.8 million tons, of which over 47% was used to
make wine. Wine alone had a global economic import value of $32.85 billion and an
export value of $34.02 billion. The United States exports $1.64 billion worth of wine
while importing $5.87 billion and consumes the most per capita of any other nation(4).
The economic and cultural significance of wine will likely continue into the future due to
the increase in global wine consumption.
Historically, Missouri has played an important role in the global wine and grape
industry. In 2011 the total economic value of grapes grown in Missouri totaled $2.88
billion (5). Wine contributes a large share to the economic value of Missouri-grown

2
grapes, with $1.76 billion coming from the wine industry (6). While Missouri does not
currently produce as much wine as many other states, the historical impact Missouri has
had on the wine industry is significant. Before prohibition, Missouri commanded the
largest market share of wine produced in the United States. Stone Hill Winery in Herman,
MO, was the third largest winery in the world, producing world-renowned wines. While
the economic impact of grapes and wine were and are significant, the contribution of
Missouri to this industry goes beyond production. During the Great French Wine Blight,
which destroyed over 40% of France’s vines, Missouri’s state entomologist, Charles
Valentine Riley, proposed European vinifera varieties be grafted onto American
varieties’ rootstock (7). The American varieties were resistant to Grape Phylloxera, an
insect which feeds on the roots and leaves of grapevines and causes serious economic
damage. Missouri institutions continue to provide global support to the development of
grapes, developing cultivars that are economically practical for a variety of reasons.
Missouri State University is one of five national universities that are part of the National
Clean Plant Network of Grapes. Alongside Cornell University, University of California-
Davis, Washington State University, and Florida A&M, Missouri State University
provides producers with certified disease free grape plants that can be used in vineyards
(8).
Protecting the sustainability of the grape and wine industry is one goal of research
institutions that focus on understanding horticulturally relevant traits in Vitis spp. Cold
hardiness, root and branch architecture, and disease resistance are some of the primary
traits under investigation to enhance the efficiency of vineyards. Grapevines are a
perennial species that can live over 100 years, so understanding the genetic mechanisms

3
of these traits is necessary to help develop breeding programs that increase the efficiency
of vineyards and reduce the amount of input costs required to return a profit. Disease
resistance is communicated by vineyard owners to be of great importance as disease can
have serious implications on the production of grapes and on the quality of wines.
Disease causing organisms are divided into fungal pathogens, bacterial pathogens, and
viral pathogens. Diseases resulting from fungal and bacterial pathogens are responsible
for most loss of yield in grapevines annually, but these diseases can be treated with
chemical inhibitors. Viral symptoms may be slow onset, but as there are no cures for
viruses in plants the economic impacts can be quite severe to vineyards that may become
infected with a virus.
Currently there are 64 known grapevine viruses that can infect Vitis spp. (9).
Since virus-infected plants cannot be treated they are typically removed from a vineyard;
prevention of viral spread into vineyards is the primary management strategy. Growers
are advised to plant both resistant varieties and varieties that have been tested to be free
of viral pathogens. These testing services can be provided by the National Clean Plant
Network; positive economic impacts have been predicted to be $50 million annually in
the North Coast region of California (10) and could be in excess of $16,014 per acre over
a 25 year period in the Finger Lake region of New York (11). Viruses that escape
detection in a vineyard become a reservoir of viral particles that can then infect other
vines in a vineyard. The proximity of vines to one another can quickly cause an epidemic
in a region where the only treatment is removal of infected individuals at a substantial
economic cost.

4
Emerging viruses pose a unique threat to the sustainability of perennial crops. The
long-lived nature of perennial plants allows for the potential accumulation of many
viruses. Plants native to regions have natural immunities to endemic pathogens due to the
historical co-evolution between the two organisms, but may still host these organisms.
These endemic viral repositories act as a source of viral particles to infect agriculturally
relevant crops that lack the resistance conferred by shared evolutionary history (12, 13).
Emergent viruses are usually endemic to areas that escape detection until they jump into
agriculturally important crops that the virus can use as an alternative host. Grapevine
Vein Clearing Virus (GVCV) is an emergent virus that was first discovered in a vineyard
of Missouri. The native Vitaceae vines act as a source of viral infection to the introduced
Vitis vinifera vines which presumably lack a natural immunity.
Epidemiology
The disease triangle is an often-described model for the determinants of disease.
There are three points to the triangle: the right host, the right pathogen, and the right
environment. When all three conditions are met, a disease will flourish (14).
Epidemiologists study a variety of methods using these three points. Methods can include
disease causality, disease monitoring, disease transmission, and disease outbreak
determinants. The primary goal of the epidemiologist is to study the spatial and temporal
aspects of a disease moving through a population (15). These goals are shared by those
who study plant epidemics (16). The eradication of disease is not a goal easily obtained
when applied to plants. For humans, antibiotics, anti-fungals, and vaccines have led to a
world where the leading cause of death in developed countries is heart disease. Viral

5
pathogens, such as small pox, have all but been eradicated from human populations
through the use of vaccines and the concept of herd immunity. Plant diseases pose
drastically different scenarios with the diversity of plant life that humans are reliant on
for civilization. From the basics of food, to more abstract concepts of ecological carrying
capacity, human civilization is dependent upon plants. Viral diseases in plants have no
vaccines and there are not broad range antibiotics for plants, so tracking of disease and
finding ways to limit spread are of major concern to agricultural producers. Once a plant
contracts a virus, it has the virus until the death of the plant.
Plant epidemiology takes many of the tools used by those human disease
researchers and applies them to plants. J. E. Vanderplanck is credited as a huge influence
on the application of epidemiology towards plant diseases and outlined the foundations of
the subject in his work, Plant Diseases: Epidemics and Control. Main concepts in his
book include mathematical models of how outbreaks increase with time, how a rate of
infection can be determined, definition and determination of a disease latency period, and
how to properly control for disease (17).
The physiology is drastically different between plants and mammals, but the
diseases are often similar bacteria, fungi, and viruses all attack both plants and mammals.
The severity of diseases of plants are often a human concern. Agricultural commodities
are often described in monetary value, but historically diseases can have a much higher
value. Phytopthera infestans is the causative fungi of late potato blight. This disease
caused the Irish Potato Famine and led to the starvation of over a million people.
Cryphonectria parasitica, the causative agent of chestnut blight, ravaged the northeastern
landscape of the United States by nearly driving the American Chestnut to extinction.

6
The disease saw over 8.8 million acres of canopy trees disappear in less than 50 years
after the disease’s emergence (18). The disease had a huge impact on not only local
economies, but on the ecological community of a wide range of Appalachia. The loss of
the American Chestnut led to the extinction of at least seven species of moth (19). Viral
diseases have a range of symptoms and severity. While some viral pathogens slightly
decrease yields, others can lead to total crop loss (20). Cassava mosaic virus is a
Begomovirus that infects the cassava plant and is transmitted by whiteflies. Cassava is an
important staple crop in the developing world and the disease has led to famine (21).The
disease was relatively harmless until recently, when two of the dominant strains infected
a single plant and recombined their genomes to produce a hyper virulent strain (21). The
quick mutation rate of viruses and their ability to recombine, alter host genomes, transfer
genes horizontally, and lack of treatment provide epidemiologists with a significant
hurdle to overcome.
Bacteria and fungi were relatively well understood in their role of plant disease
before viruses were discovered. Bacterial and fungal molds can be seen with the naked
eye and their complex structures can be observed with an optical lens. The idea of
infectious agents being responsible for disease has been around since at least 1546, but it
did not take off until the late 1800’s with pioneers like Robert Koch and Louis Pasteur
taking the lead. Viruses escaped detection because of their small size; only the largest of
the viruses can be detected with an optical lens, and then usually only when they are
grouped together. It wasn’t until it was shown that the tobacco mosaic disease could be
transmitted after bacteria were filtered out, that the idea of the existence of smaller
infectious agents was proposed. Soon after, the discovery of the electron microscope in

7
1931 led to the imaging of the first viral particles and the burgeoning field of virology
took off. Virology was furthered with the boom of molecular biology in the 1980’s.
Plant immunity
Pathogenic organisms are ubiquitous. The majority of life on the planet is in the
form of viral, bacterial, and fungal organisms, most of which are microscopic. The close
ecological history of these organisms with their host species has led to the evolution of
defense mechanisms by plants (13, 22). While plants lack an adaptive immune system
such as ours, their immune systems are innate and coded within their genetic makeup.
The most widely accepted model is a system of plant immunity that has two basic levels.
The first level is called pathogen associated molecular pattern (PAMP) triggered
immunity (PTI). The second level of defense is termed effector triggered immunity (ETI).
The zig zag imagery is used to explain the struggle between plants and their pathogenic
organisms as they fight for survival. As PTI is overcome by pathogen effectors, the
plant’s second line of defense, ETI, kicks in until the pathogen overcomes the new
immune response or is able to escape detection (22).
Pattern recognition receptors (PRRs) on the extracellular surface of plant walls
recognize PAMPs structures or motifs. These structures are non-specific to pathogen
species, but act as a basal defense against recognized pathogens. Common PAMPs
include structures such as bacterial flagella and fungal haustoria. On recognition of
PAMPs, PRRs send a signal cascade to express genes that confer broad range resistance
to most invading pathogens. However, certain pathogens can overcome PTI, by using
pathogen encoded components. Effectors are pathogen components that can provide

8
escape from PTI in a number of functional ways, but most contribute to the suppression
of one or more components of PTI, named type III effectors. Type III effectors are gene
products which allow the pathogen to overcome PTI and establish an infection (23).
Plants that share a common evolutionary history with pathogens that can
overcome PTI have adapted a means of detecting effectors. Plants encode resistance
genes (R-genes) which are able to recognize pathogen effectors, many of which encode
nucleotide-binding leucine rich repeat (NB-LRR) proteins (22–24). Recognized effectors
are called avirulence (Avr) proteins, and once detected send a signal cascade like that of
PTI. The NB-LRR proteins can also indirectly recognize effectors by recognizing a
change in the host protein that effectors target: ‘pathogen-induced modified self’
molecular pattern. This new response, ETI, often leads to cell death of the infected cell(s)
by providing a hypersensitivity response (HR). ETI also induces production of signaling
hormones, such as salicylic acid (SA) and jasmonic acid (JA), to signal neighbor cells of
invasion to provide a systemic acquired resistance (SAR). This signaling also affects
gene expression through transcription factors of the WRKY and TGA families to confer a
more aggressive resistance to the invading foreign pathogen (22–24). Small RNA
(sRNA) have been shown to also act as signaling molecules to control transcription in
distant parts of the plant (25, 26). Continual selection pressure placed on pathogenic
organisms by ETI eventually leads to the evolution of pathogens who are able to escape
detection by ETI, or produce yet another set of effectors to limit the ETI response. The
proximity of the pathogens and hosts in an area over time give rise to these complex co-
evolutionary forces in a struggle for survival.

9
The PTI/ETI model of plant defense is not easily applied to viral pathogens. Few
viral proteins or structures have been identified as PAMPs, instead plant immunity to
viruses uses a different pathway. Plant RNA silencing pathways use small interfering
RNA (siRNA) and micro RNA (miRNA) to confer resistance to viral pathogens. The
siRNA pathway is triggered upon viral infection of a cell, and has been equated to PTI
(27, 28). Most viruses in some stage of their lifecycle have a dsRNA component, and are
recognized by the host cell machinery. This recognition of viral dsRNA is why the plant
response it is equated to PTI. The dsRNA is recognized and cleaved by a host
ribonuclease, Dicer (27, 28). Dicer like proteins (DCL) cut the RNA into siRNA
consisting of between 20-25 nucleotides, and these siRNA are subsequently used to target
other viral molecules by complementation with loading proteins called ARGONAUTEs
(AGOs). The AGO, siRNA, and DICER form a complex called the RNA induced
silencing complex (RISC). RISC recognizes any template for which the siRNA binds to
with perfect matching of base pairs, and results in cleavage into more siRNAs creating a
feedback loop (27–30). siRNA can also be used in a transcriptional gene silencing
pathway, the RNA induced transcriptional silencing (RITS). RITS loads siRNA onto
complementary RNAs, but instead of cleavage, it methylates DNA and prevents
transcription (31). While siRNA mediated RISC is a response to invading nucleic acids
and the template for RISC is exogenous, miRNA are endogenous to the host and encoded
in the genome. Similar in size, ~22 nt, miRNA have a different mechanism of silencing.
miRNA can bind with incomplete complementarity and once bound, can either cleave the
RNA, or prevent translation (31–33).miRNAs have a functional role outside of viral

10
suppression and immunity; they are complex transcriptional and translational control
agents and can drastically alter the expression of genes within a cell (34, 35).
As bacteria and fungi have adapted effectors, viruses have adapted ways to
mitigate the RISC. Viral silencing suppressors (VSRs) have adopted a variety of
mechanisms to escape cleavage by DICER. Identified VSR’s are numerous. with
functions ranging from binding AGO proteins, sequestering siRNA, blocking DICER
proteins, preventing methylation of DNA, or using RNA decoys to prevent maturation of
siRNA (31). As efficient cellular parasites, viruses hijack cellular machinery to undergo
their life cycle; they have demonstrated the production of their own miRNAs to alter
host gene expression (32) and have demonstrated the hijacking of host miRNA to alter
viral gene expression and replicative efficiency in a beneficial way (33).
Viral taxonomy and classification
Viruses are small organisms that are obligate parasites. They require a host cell to
undergo replication and do not metabolize energy on their own and therefore contain
genetic elements to remodel a host cell and genome (36). An individual viral unit is
called a virion, and the structures of all virions have similarities. They all contain a capsid
of a crystalline protein that encapisdates the genome and other necessary proteins and can
conform into a variety of different shapes. Viruses can either be surrounded by a lipid
membrane (enveloped) or can have a naked capsid shell (naked). The genome can either
be RNA or DNA. Viral genomes range from 1000 bps to over 2,000,000 bps (37), so
viruses employ a diverse range of efficient strategies to contain the necessary elements
for host cell remodeling, genome replication, and virion assembly. Strategies include

11
polycistronic genes, genes in overlapping reading frames, ribosomal shunting and leaky
scanning, and RNA modification. These strategies help ensure that the virus has all the
necessary elements to infect and reprogram the host cell.
While viruses are undeniably similar, viral lineages are difficult to establish and
their place on the evolutionary tree of life is debated (38).There are many hypotheses on
the origin of viruses, resulting in an unclear understanding of where they belong on the
tree of life (37, 38). Three dominant hypotheses persist: the virus-first hypothesis, the
reduction hypothesis, and the escape hypothesis. As the name suggests, the virus first
hypothesis proposes that viruses appeared before cells and the organism that became the
Last Universal Common Ancestor (LUCA) (38, 39). The reduction hypothesis posits that
early viruses were proto cells which were parasites of larger cells (38, 39), while the
escape hypothesis states that viruses evolved from DNA or RNA that came from the
genome of an organism (38, 39). All three hypotheses have problems that have not been
resolved. Considering viruses are obligate parasites that need a plant cell to survive, the
Virus-first hypothesis has doubters. If viruses were proto-cells, some scientists believe
that we would find evidence of similar cells today and no such example exists. Viruses
have capsids and other structures that are not found in any other domain of life, and the
escape hypothesis cannot explain why these do not exist in any form in the three
domains.
Historically, viruses have been classified by way of Baltimore classification. The
Baltimore system groups viruses based on the arrangement of their genomes. There are
seven groups: group I are dsDNA viruses, II include ssDNA viruses, III are dsRNA
viruses, IV are (+)ssRNA viruses, V are (-)ssRNA viruses, VI contain ssRNA-RT

12
viruses, and group seven are the dsRNA-RT viruses. Recently, the International
Committee on Taxonomy of Viruses (ICTV) has made an attempt to use the
accumulation of molecular sequence data to group viruses into phylogenetically related
families (40). Difficulty in resolving all of the relationships arises from the differing
mutation rates of viruses from the same lineage (41, 42), the high rate of recombination
(43, 44), genome reorganization and shuffling (45–47), and large, highly genetically
variable population sizes (48–50). These problems in resolving phylogenomic relatedness
of viral species have led to the use of protein folding analysis to place the viruses on the
tree of life. This analysis is uniquely equipped to relate species of all domains of life, as it
uses the similarities in the folding structures of proteins without needing amino acid or
nucleic acid similarity. It posits that these proteins with similar folding structures are
grouped into fold families (FF) and that these families can be placed into fold super
families (FSF) (51). Grouping the genes of viruses into families and comparing them with
other domains of life (archaea, prokaryote, eukaryote) has led to the discovery of
common homology of some of these proteins and suggests viruses be placed on the tree
of life into a fourth domain (51). This analysis has led researchers to view viruses as
entities that branched off from the other three domains before ancient cells developed the
machinery for metabolism (ribosomes) and became parasites of the other domains of life.
This reasoning furthers that viruses branched off before the three domains of life because
of their ubiquity in infecting all domains of life (38, 51).
Three further delineations exist in viruses from the traditional taxonomic
nomenclature. Strain further separates viruses into a category segregating recognizably
different phenotypic characteristics that remain stable in the population (52). A viral

13
variant is a virus of the same strain that has similar genetic sequences but no observed
phenotypic variation (52, 53), and it has been proposed that a sequence that is <10%
divergent be considered a new variant (54). At the base level, isolate is used to describe
any particular viral genome that has been isolated from a host (54).
Viral lifecycle and cellular remodeling
Viruses lack the ability to penetrate the cell wall of a plant on their own and need
a way of entering a plant cell. This can be biotic or abiotic. Biotic vectors include insects,
bacteria, fungi, and nematodes. Abiotic vectors include human cultural practices such as
graft transmission and unsterile equipment for maintenance. All viruses, plant or other,
behave similarly once inside the cell, but the mode of transmission can differ greatly.
Once inside the cell, the virus un-coats from its protein capsid. Some viruses are
packaged with proteins that help in the beginning stages of viral infection, such as
nuclear import of viral genomes (55). Once the viral nucleic acid is free of the protein
coat, import into the host nucleus is achieved by a variety of strategies (56, 57), or the
genome is localized to an area to begin its lifecycle. Inside the nucleus, the genome is
processed by host machinery in the case of some RNA viruses (58), or begins its
replicative and transcriptional lifecycle (59).
Viral proteins are transcribed by host ribosomes and the immediate remodeling of
the cell begins to favor the assembly and maturation of virions. Systemic remodeling is
achieved by mechanisms including viral and host protein interactions for formation of
inclusion bodies (36, 60–62), expressional control of viral encoded miRNA (32), and
hijacking of host miRNA for expressional control (33). Many of the remodeling

14
processes target host cell membranes and organelles to form miniature “virus factories”
(36, 61, 62). Altered host organelles include golgi apparatus, mitochondria, endoplasmic
reticulum, and chloroplasts (36). It is believed that these inclusion bodies or cellular
localizations are strategies to bring the components of viral replication, assembly, and
maturation into proximity. It is also believed that the localization and
compartmentalization are a way to escape the host cell’s innate defenses (36).
Movement from cell to cell does not require an insect vector. Many viruses
encode movement proteins (MP) that allow for efficient movement into adjacent cells to
eventually establish a systemic infection. Most MP’s form complexes with plant
plasmodesmata to widen the channel to allow for viral passage (63, 64). While some
viruses pass as individual virions, others pass as “mobile viral factories”, transporting
remodeled organelles with many virions to the next cell (62, 65).
Transport to other plants requires a vector; the majority of plant viruses are
vectored by insects, including aphids and whiteflies which represent the transmission of
the highest percentage (66). Many of these insect-vectored viruses have structural motifs
which allow for efficient transmission by the associated vector, usually part of the viral
coat protein (CP) (66). Insects can acquire and transmit viruses in four methods,
circulative-persistent, circulative-propagative, non-circulative semi-persistent, and non-
persistent (66). Insects vary in their uptake of viral particles based on the method of
acquisition. Once transmitted to a new plant, the virus goes through the same cycle as
above. This is how viruses spread through a region and establish epidemics.

15
Evolution of viruses
Viruses exist as quasispecies in their obligate host. Quasispecies are closely
related viral genomes that oscillate around a consensus genome and continually undergo
processes involved with genetic variation, competition between generated variants, and
selection for the most fit variants in the host environment (67, 68). The quick molecular
evolution rate of viral genomes and the short generation cycle lead to diverse populations
where individuals compete to establish themselves in their host (69). Mechanisms of viral
evolution that lead to high genetic variability include two main types: mutation and
recombination (48, 49). Other processes include acquisition of host genetic elements (70)
and re-assortment of genomes (48, 49). These processes give rise to a highly
heterogenous population of viruses both within the host and geographically.
Viral mutation is a result of polymerase error. Viral genomes can either be RNA
or DNA, as previously detailed, and are replicated by three classes of polymerase. The
three polymerases introduce errors at different rates. RNA polymerases (RNAP) lack
proofreading ability and introduce errors at the highest rate. DNA polymerases (DNAP)
have proofreading ability to correct introduced errors, and have the lowest mutation rate.
Reverse Transcriptase (RT) replicates by using an RNA template to synthesize a DNA
strand, and introduces error rates like that of RNAPs due to the lack of proofreading
machinery. RNA viruses mutate on the order of 10-3-10-5 changes per base per
replication cycle, or about one error per round of replication (48, 49, 71–73). DNA
viruses mutate on the order of 10-8 changes per base per replication cycle, or about 0.003

16
errors per round of replication (49, 74). Retroviruses and pararetroviruses which replicate
by RT have similar rates to RNA viruses (49, 75).
Recombination results when segments of genomes from different genomes are
switched during replication, and it can occur between variants from a quasispecies, or can
occur from mixed infections of viral populations from different hosts meeting in a new
host plant. The number of viral genomes that infect a cell is called the multiplicity of
infection (MOI) (76), and the MOI of mixed infections can lead to recombination of
evolutionarily distant variants. Current estimates place the MOI of viruses as a dynamic
quantity that eventually reaches equilibrium, with values ranging from 2-13 genomes per
cell (76). Rates of recombination also vary, depending on the family of virus. RNA virus
recombination rates have been shown to be on the order of 10-5 recombination events per
site per generation (77). Cauliflower mosaic virus (CaMV) is a pararetrovirus that
replicates through RT, and it has been shown to have 10-4 to 10-5 recombination events
per site per generation (78). It was also noted that all parts of the genome are equally
likely to undergo a recombination event (78, 79).
Changes that occur to a viral genome eventually become distributed in a
population through evolutionary processes that determine genetic structure. Two main
processes drive the distribution of viral variants into the population, genetic drift and
selection (80, 81). Genetic drift are the stochastic changes that determine the frequency of
genetic alleles in a population. Selection is the process that some virologists argue is the
driving factor behind genetic structure of viral populations. Selection can be broken down
into two main types: positive and negative selection. Positive selection is when a
mutation gives an organism an increase in fitness and the organism has a greater chance

17
of reproduction, therefore the frequency of the mutation is greater in the next generation.
Negative selection, or purifying selection, results when a mutation decreases the fitness
of an organism and the frequency of the mutation is less in the next generation. There is
much evidence that viral pathogens have a surprising amount of purifying selection
driving the population structure. As viral genomes are relatively small and condensed
(73), it is reasonable to assume that mutational changes could be detrimental to fitness,
even lethal. Coat proteins (CP) are highly conserved regions in most viruses (48, 49, 82–
84), suggesting that changes severely impact viral fitness. Other gene products are also
highly conserved (48, 49), and even non-coding regions in viruses remain conserved (85,
86), further validating the efficiency in packaging of genetic elements that are only
necessary for the viral lifecycle.
The non-random nature of selection allows for the environment, the host, the
vector, and other viral isolates to put evolutionary pressure on new replicated variants.
The host can influence viral genomes through the interaction of the innate immunity and
the RISC. Viruses that adapt to evade the plant defense will obviously have a higher
number of progeny in the next generations. Adaptation of VSR’s will be passed on to the
next generation. The host range of the virus also directs the evolutionary flow of viral
populations. Mutations that allow for an increase in host range will increase the viral
population into a new host population. A vector’s influence on the population structure
comes from selecting only variants that have the necessary motifs, or gene products for
successful acquisition and transition by the vector. The vector also stochastically acquires
viral particles depending on their feeding pattern, and the population spreads into new
plants from the few viral particles that were acquired (87).

18
It is worth mentioning that even variants that have lethal mutations can survive in
mixed populations within a single host. Complementation occurs in a viral population
when a variant that is evolutionarily fit provides a necessary gene product to the lethal
mutant in trans. This allows for a larger population and population diversity in the host
plant (88, 89). However, the large population size within a host is not representative of
the allelic frequency in subsequent generations. The population will only have a small
subgroup that determines the frequency of mutations in the future generations and this
small number is termed the effective population size (Ne). The Ne of viruses is often
many magnitudes smaller than the actual population size. HIV is a well-studied virus, and
the actual population size in a host is predicted at 107-108, while the Ne is estimated to be
between 103-105 (90–92). These small sub-populations are the main determinants of
population structure in the proceeding generations.
The high mutation and recombination rate, coupled with the processes of genetic
drift and selection results in the quasispecies nature of viruses within a host. The host is a
microcosm of geographic regions that each shape the population of the virus within. The
population of viruses within a single plant can be highly variable from branch to branch
in a large perennial plant. A single inoculation of Plum pox virus (PPV) into a Prunus
spp. was observed over 13 years, and it was found that the viral populations segregated
into distinct populations in different branches on the plant (93). Each sub-population
evolved independently as they infected new tissues and organs (93). Population
variability increases at each instance of infection with different viral genomes, and the
junctions of where viral populations meet are areas of recombination between variants
from different populations (48, 49, 76, 78, 79, 93).

19
Population bottlenecks occur quite frequently as a result of the random acquisition
and transmission of viral isolates, selective sweeps in a host, mutation leading to a new
species becoming a host, and the introduction into a new geographic region (12, 13, 48,
49). The resulting diminishment of populations leads to ‘founder effects’ and increases
the population variability within the new host or region (94–97).
Populations within regions can be highly variable because of the aforementioned
processes. Examples of high diversity with no geographic segregation are numerous,
especially in Badnavirus (98–103). Other examples of high genetic diversity between
populations where populations segregate based on geographic location also exist (104,
105). Host specificity of viruses also leads to diversity and divergence. Certain viral
strains may prefer one host over another which will lead to further segregation of
populations. This may eventually result in speciation. Examples in the literature suggest
that viral populations are highly variable, but the genetic stability of the population does
not change from year to year (106, 107). In summary, the distribution of allelic
frequency, or haplotypes, of viruses tend to remain stable over many years, even though
the variability of genomes is high. Populations can segregate based on geographic
proximity or host specificity, or be well mixed with no host specificity.
Endemic, emergence, epidemic, and pandemic
Endemic viruses are the viral populations naturalized to a given region, where
reservoirs of viral populations exist in indigenous plants. The ancient ecological
relationship between endemic viruses and native plant populations has lead to the
evolution of reduced disease severity and little harm to indigenous plant communities

20
(12). Reduced disease severity is thought to be attributed to three main mechanisms.
First, isolation of a host plant that is intermixed with other non-host plants in an
ecosystem prevents a rapid spread of viral pathogens. Second, the interaction of vector
insects with their predators in naturalized ecosystems leads to reduced transmission of
viral pathogens. Lastly, the ancient relationship of viral pathogen with indigenous host
plants lead to the evolution of a naturalized resistance as part of the innate immunity (13,
108).
Emergence of a virus occurs when an endemic virus increases host range,
increases pathogenesis, and/or increases geographic distribution (13, 109). Emergence is
usually noted when a new disease is observed on an agriculturally relevant crop. It has
been calculated that 47% of emergent diseases are attributed to viral pathogens (13, 109).
Epidemics of emerging diseases can result from changing agricultural practices or from
altered viral biology. Agricultural practices that enhance the probability of emergence of
indigenous viruses include agricultural intensification into native ecosystems, habitat
fragmentation of indigenous ecosystems, loss of genetic diversity of crops (13, 110), and
introduction of susceptible crop species to new regions (12, 13, 108–111). Biological
changes that enhance the probability of emergence include expansion of natural host
range (13, 112), founder events (13, 110, 113), new mutations (113, 114), and
recombination or re-assortment (110, 113, 114).
Epidemics can quickly establish in crops that have little to no innate resistance
due to lack of evolutionary history with the virus, and loss of resistance due to breeding
programs focused on commercial qualities. As a result, viral populations can explode due
to little selective constraint (13). The spread of a virus in susceptible crops is enhanced

21
due to the genetic uniformity of monoculture-style agriculture. Proximity of crops, lack
of evolutionary history of resistance, and genetic uniformity can cause viral diseases to
spread quickly amongst cropping systems. The economic impacts of viral diseases have
varying effects from minor yield loss to total crop loss (20). For particularly severe viral
diseases, epidemics can cause huge crop losses in a region (21).
Pandemics occur mostly from human spread of pathogen-infected vegetative
material to other parts of the world (13, 115). Once a viral pathogen makes the jump into
a new host, the quick evolution of the virus allows it to adapt to the new host, and the
lack of innate immunity of the new host to the pathogen results in severe economic
impacts. Bi-directional spread of viruses from infected crops to the indigenous plants of
the new region can have profound impacts on ecology, as well as serving as a reservoir of
viral pathogens to spread into other cropping systems (13). An example of quick spread
of an indigenous virus into introduced crops, eventually leading to pandemic, can be seen
in Tomato yellow leaf curl (TYLCV). TYLCV is an indigenous virus of the
Mediterranean region and jumped into introduced tomatoes. A severe epidemic spread
into the region causing serious losses to the countries of the Mediterranean. After
vegetative material was spread internationally, TYLCV became a pandemic on the world
stage (13, 116–118).
Studying the emergence of viral pathogens into agricultural systems is important
to prevent crops losses, stop the establishment of epidemics, and prevent a global
pandemic. Careful monitoring of agricultural systems of introduced crops to new areas of
agricultural intensification can prevent the spread of unknown viruses into the global
cropping system.

22
Badnaviruses
Grapevine vein clearing virus (GVCV) is a plant pararetrovirus belonging to the
genus Badnavirus in the family Caulimoviridae. To date, 32 badnaviruses have been
characterized across all continents excluding Antartica (115). Most badnaviruses have a
narrow host range, but overall badnaviruses can infect both monocots and dicots, with a
majority infecting perennial plant species of temperate and tropic regions (119, 120).
Symptoms in a plant can include but are not limited to: chlorotic spots, chlorotic streaks,
yellow mosaic, deformed leaves, and vein clearing of the leaves (100). Tissues infected
include parts from the entire plant. Transmissions of the viruses are primarily human and
insect mediated, while a few species can transmit through seeds. Insects in the families
Aleyrodidae, Aphididae, Cicadellidae, and Pseudococcidae are known Badnavirus
vectors, with the majority borne by Pseudococcidae (mealybugs) (115). Humans are by
far the most prolific vector of these viruses through agricultural practices, such as
vegetative propagation and grafting (100).
Badnaviruses contain a circular double stranded DNA (dsDNA) genome that
varies between 7200-9200 base pairs (bps). They replicate using an RNA intermediate
from a viral encoded reverse transcriptase (RT), and in this way, resemble retroviruses.
The genome is organized with as few as three open reading frames (ORFs) and as many
as seven. The majority contain three (I-III) and are arranged without intergenic regions
between them. ORF I is in a different frame as ORF II and III. ORF I ranges from 399 to
927 bps, ORF II ranges from 312 to 561 bps, and ORF III is much larger as it is a
polyprotein, ranging from 5100 to 6000 bps. Upstream of the weak ORF I AUG start
codon are multiple short ORFs (sORFs) (115, 121, 122). These sORFs are used in
23
formation of RNA secondary structures which brings a stronger AUG start codon within
10 nts of ORF I and drive translation through ribosomal shunting (123, 124). Several of
the viruses with additional ORFs include ORFs on the minus (-) strand (115, 125, 126).
Many of the functions of the ORFs remain elusive. ORF I is associated with the virion in
ComYMV (127), ORF II has been shown to be nucleic acid binding in CSSV (128) and
capsid binding in ComYMV (127, 129), and ORF III cleaves into four or five products
including: a capsid protein, reverse transcriptase, aspartate protease, RNase H, and a
protein thought to help in cell to cell movement. (115, 126, 129–131).
The lifecycle of badnaviruses is considered similar to Cauliflower mosaic virus
(CaMV), the type virus of Caulimoviridae. From an active infection, a minichromosome
of viral DNA is used for transcription of a polycistronic longer than full genome length
terminally redundant RNA inside the host nucleus (132). This RNA is then exported into
the cytoplasm where it is translated into the associated gene products of the ORFs
through ribosomal shunting and leaky scanning (121, 123, 124). An inclusion body is
formed inside the cytoplasm of the cell where the gene products are gathered. Assembly
of the viral capsid occurs in this inclusion body where gene products are packaged into
the capsid along with the longer than full length RNA (133). Reverse transcription
produces a relaxed dsDNA circular genome of three discontinuous regions (132).
Because of these gaps there is a propensity for recombination by template switching at
this stage (134–136), adding to a higher virus population diversity (134, 137, 138). From
here, the dsDNA is unencapsidated and imported into the nucleus of the host cell where
the host’s DNA polymerases close the nicks in the relaxed circular dsDNA genome and a
minichromosome forms with host proteins to begin the cycle anew (132). While within

24
the nucleus of the host, the genome of the Caulimoviruses can become endogenized into
the host genome without the machinery for active placement, thought to be due to the
dsDNA genome (99, 139). It is believed that endogenization events for Caulimoviridae
occur once every one million years (139). Badnaviruses include many examples of
species becoming endogenized into host genomes that can escape detection until abiotic
stressors allow for a badnavirus to become episomal, increasing the rate of infections (99,
140–142). This poses a significant problem for agriculturally relevant crops.
Grapevine vein clearing virus
Grapevine vein clearing virus (GVCV) was discovered by Dr. Wenping Qiu
while working for the Center for Grapevine Biotechnology at the Missouri State Fruit
Experiment Station in Mountain Grove. In 2004, a vineyard manager contacted Dr. Qiu
when he was experiencing a severe disease on many of his ‘Chardonel’ grapevines. Dr.
Qiu recognized the symptoms as virus-like and brought samples from diseased
‘Chardonel’ vines to his lab to test for pathogens. After initial tests showed negative for
known viruses, his lab group extracted total RNA from the plant. The RNA was isolated
to include only small RNAs (sRNA), and adapters were ligated to the RNA to form a
library for next generation sequencing (NGS). The sequences of all sRNAs were
compiled into a database and assembled into contigs, or short overlapping regions. These
assembled contigs were then subjected to a viral BLAST search to look for any similar
sequences that belonged to the NCBI GENBANK database. The BLAST search brought
up numerous matches to viruses that belonged to the Badnavirus genus of the
Caulimoviridae family and it was believed to be a new virus that was associated with the

25
disease in the vineyard (143, 144). In 2009, after the unknown sequence was discovered
to belong to the Badnavirus genus, Dr. Qiu’s lab group began designing degenerate
primers that would work on conserved regions of the putative virus’s genome. Through
trial and error, primers were discovered to work and an entire genome was assembled
through primer walking and Sanger sequencing (143). This genome was published in
2011 as the reference genome (NCBI Reference Sequence: NC_015784.2), named
GVCV-CHA. At this point, the disease associated with the virus had only been reported
in vineyards in Illinois, Indiana, and Missouri (143). Phenotypic characterization of the
virus-associated symptoms include: translucent chlorotic veins, shoots that develop with
shortened zig-zagging internodes, maturation of symptomatic leaves results in
deformation and stunting, mosaic patterns on older leaves, and in later stages the vines
become dwarfed with a reduced fruit yield and berry deformation (143).
The idea of a new virus emerging into the vineyards of the Midwest led
researchers to look for a reservoir of the virus in native Vitaceae spp (Figures 1-6). In
2013 the virus was detected in two Vitis rupestris. Figure 2 shows the county distribution
of this native plant. A year later, the second GVCV isolate genome was published in
GENBANK (NCBI Accession: KJ725346.1), named GVCV-VRU 1 (103, 145).
Concurrently in 2014, the relative amounts of GVCV particles in host tissue was
determined through quantitative polymerase chain reaction (qPCR), and the host
specificity was examined through graft transmission assays. It was found that GVCV
accumulates in the petioles and that the cultivars ‘Chambourcin’ and ‘Norton’ could not
acquire GVCV from grafting, whereas the native V. riparia could (146). In the same
study it was shown that a phylogy based on conserved regions of the RT and zinc finger

26
(ZF) domains of ORF III of 13 isolates was not concordant with either geography or host
species (146). The following year, 2015, a second GVCV genome was published from V.
rupestris (NCBI Accession: KT907478.1), named GVCV-VRU 2. This same year,
researchers at the University of Missouri characterized the promoter region that would
drive transcription of a pre-genomic RNA for GVCV and delineated it somewhere
between nucleotides (nts) 7332 and 7672 of the GVCV-CHA reference genome, with
transcription starting at nt position 7571 (147). In 2016 they used this knowledge to
design a clone of GVCV-CHA to attempt to provide evidence of causality of the virus to
the associated disease and for use in downstream applications (121). Back at Missouri
State, the analysis of phenotypic and genetic variation from isolates GVCV-VRU 1 and
GVCV-VRU 2 showed that symptoms can progress to necrosis in V. rupestris, isolates
GVCV VRU 1 and 2 can produce mild mottle and leaf distortion when infecting
‘Chardonnel’, and that ORF II is the most divergent region of the genome with the
presence or absence of an indel (103). The variation of ORF II was proposed to be used
as a marker for distinguishing isolates due to the variability between 12-17% difference
(103). While investigating native V. spp. in 2016, Qiu’s group noticed an unknown
symptomatic vine growing in close proximity to native vines. A sample was taken and
analyzed for the presence of GVCV and it was found to test positive. The plant was
identified as Ampelopsis cordata of the Vitaceae family, and the new phenotypic
symptoms of slight vein clearing and asymptomatic tissues were observed (148). Focus
was shifted from sampling V. rupestris to A. cordata due to the low incidence rate of
sampled Vitis. Collection and sequencing of four more genomes occurred in 2017.
GVCV-AMP 1 and GVCV-AMP 2 (NCBI Accession: KX610316.1 and NCBI

27
Accession: KX610317.1) were isolated and sequenced from two wild A. cordata (148),
while GVCV-AMP 3 and GVCV-CHA-2 were isolated and sequenced from a wild A.
cordata and a cultivated V. vinifera ‘Chardonel’(Awaiting submission) that were within
10 feet of one another (122). Analysis of the 7 genomes, thus far sequenced, provided
information on the secondary structure of the 5’ region of the pre-genomic RNA, and the
highly conserved secondary structure of the intergenic region (IGR) between the seven
isolates. The analysis indicates that a sORF is indeed in proximity to the start codon of
ORF I, as is with other Badnavirus (121, 122). In the same study, a phylogenomic
analysis of the seven genomes indicates that isolates GVCV-VRU 1 and 2 branch off
from the other isolates to form a distinct clade (122). To determine in-host viral
population variation and differences between viral populations of same host species from
different spatial regions, three genomes were assembled using viral small RNAs
(vsRNAs) in 2017. The results show that variation in a host is within 2% at the nucleotide
level, and that populations between hosts more closely resemble each other based on
spatial proximity, rather than host species (149).
Summarizing the information currently available, we see that GVCV exists as a
diverse population that has a broad host range with the ability to infect V. vinifera, V.
rupestris, V. riparia, and A. cordata. Phenotypic characteristics of disease symptoms vary
among the hosts, and variation of isolates within a plant can be up to 2%. The isolates
that have been phylogenetically analyzed do not seem to suggest common ancestry either
within host species or within a spatial region, further indicating a diverse population.
Phylogenomic analysis separates isolates in two distinct groups: those infecting A.
cordata and V. vinifera, and those infecting V. rupestris. Attempts at providing

28
information for causality of the associated disease have been partially successful, and a
pattern of population structure has not been observed.
Rationale
The following chapters contain two research projects that attempt to resolve some
unanswered epidemiological questions for GVCV. First, is GVCV the sole causative
agent for the progression of the disease complex? Does GVCV alone cause the disease
noticed in vineyards, or is there a second pathogen that is required for the disease to
progress? Second, do isolates of GVCV cluster in a geographic pattern, and what is the
route of transmission into vineyards? Is the virus historically endemic to the region,
recently jumping into vineyards where it is causing serious economic loss, or has the
virus been introduced into our region and spread into the wild plants from the vineyards?
Both questions, when answered, will provide invaluable knowledge to grape producers in
the region.
Looking back at the disease triangle of epidemiology, one cornerstone is the
pathogen. Correct identification of the pathogen is paramount in developing strategies to
mitigate damage in a vineyard. Successful treatment and prevention are not possible if the
pathogen is miss-identified. To answer this question, Koch’s postulates are used to
determine a link of causality between the disease and the virus. Infectious clone
construction of GVCV and inoculation of clean plants using Agrobacterium mediated
transfection into disease-free grapevines was the method used to provide evidence of
causality. Construction of this clone will also allow future researchers the ability to

29
answer further questions dealing with the virus’s phenotype, genome structure, and
pathology.
Determining the contemporary distribution of GVCV in the region will help
provide insight into the historical movement of GVCV. This can help answer questions
relating to the origin of the epidemic in the region, prediction of the rate of spread into
other regions, and establishing the predicted Ne population size. This information will
allow growers to reduce the incidence and spread of GVCV into their vineyards.
Furthermore, if GVCV is found to be endemic in the region, quarantine of plants from
this region into other regions will prevent economic losses in more intensive wine
producing regions, such as California or France. Clean vine testing services such as the
National Clean Plant Network should be utilized to prevent the spread of infected plant
tissues to other regions.

30
CHAPTER 1: EPIDEMIOLOGICAL PATTERNS OF GVCV
Introduction
Molecular evolutionary analyses rely on mathematical models to predict the
probability that two given nucleotide sequences are related. Simply enough, it uses the
proportion of different nucleotides to the number of nucleotides that are the same to
determine the number of differences between two related nucleotide sequences, known as
the Hamming distance (150–152). The inferences that can be made using molecular
sequence data are numerous, including estimation of effective population sizes,
prediction of emerging disease epidemics, inferring past migration events, and most
notably, resolving ancestry between two organisms.
The Wright- Fisher model assumes an idealized population that allows for a
number of methods to be applied to population genetics and phylogenetic inference (80,
81, 150–154). The idealized population of the Wright-Fisher model can be summed into
three simplified assumptions: the population in question has a constant population size,
there are discrete generations between ancestors and progeny, and there is a random and
complete mixing of alleles (80, 81, 152, 153). The model traditionally deals with the
frequency of allelic genes in a diploid population, but it can be adapted for use of haploid
organisms, such as viruses (92, 152, 153). From hence forward, alleles will refer to the
alternative copies of nucleotides: adenine, thymine, cytosine, and guanine (A,T,C,G).
Allelic frequencies can be determined in a population by sampling individuals in a
population and the inferences of population structure can be estimated by applying
models of sequence evolution. Sequences evolution is caused by mutational change to

31
genes (such as point mutations, recombination, indels, and gene duplication) combined
with migration, natural selection, and genetic drift (80, 81, 150–152). Current theories of
sequence evolution attribute a stronger affect to genetic drift as the driving factor in
evolution than selection (92, 150–153), but selection does play a role, especially in
determining fit variants of viral population (48, 49).
Genetic drift is the stochastic changes in allele frequencies in a population over
time (80, 81, 150, 151, 153). The strength of genetic drift is inversely proportional to the
effective size of the population (Ne). Ne is the population size equivalent to the
mathematical quantity that works in an idealized model which predicts the same value of
a particular trait as the observed natural population (92, 150, 154), more simply it can be
thought of as the number of individuals that attribute genetic diversity to the overall
population. Ne is often much smaller than an actual population size as the number of
individuals that contribute to offspring for the next generation is a subset of the whole
population. As Ne increases, the strength of genetic drift decreases, and it takes longer for
an allele to become fixed in the population, increasing allelic diversity (155, 156).
Some processes of evolution behave in a regular pattern that can be observed in a
population of the same species. Mutational changes in viruses, such as nucleotide
substitutions, occur as a result of the error of polymerases during genome replication. The
changes are observable and can be estimated as changes to a genome per generation.
Applying discrete generations to calendar times, we can get a molecular clock which is
the change of nucleotides per site per year(151, 157). This task is easier for haploid
organisms such as viruses, when it is likely that the generations are discrete and it can
satisfy more appropriately the assumption of the Wright-Fisher model.

32
Adding the mutational rate to the process of genetic drift, we constantly have
additions of new alleles to the population. Small Ne sizes with a slow mutation rate have
a low allelic diversity, whereas large Ne with a high mutation rate have a high allelic
diversity. Due to the mutation rate constantly substituting nucleotides, the allelic diversity
is always changing. As a consequence of genetic drift fixing alleles over time, large
populations with a high mutation rate are adding alleles to the population before drift can
fix them. This results in high allelic diversity, or genetic variation within a population.
Evolutionary nucleotide substitutions do not occur with the same frequency at
every nucleotide position. DNA sequences are not all coding and can include non-coding
regions, repetitive elements, exons, or introns. Functional constraint is placed more
heavily on coding regions, as these regions are the instructions for the amino acid
sequence in proteins. A change to this region has the potential to be fatal to an organism
if the mutation causes an amino acid change. Furthermore, the position of the nucleotide
in a coding region has different rates of evolution. The first and second position of a
codon add more functional constraint to the codon than the third codon because of the
degeneracy in the DNA code, and because of this degeneracy a mutation may be silent or
non-silent. A silent mutation is a change to a nucleic acid, but the change results in the
same amino acid. Non-silent mutations are changes to the nucleic acid results in a
different amino acid. Purifying selection results in the survival of organisms who have
not changed the function of their proteins by changes to their amino acids. Further
complicating the situation, a change to an amino acid may not change the function of the
protein as some amino acids have similar function. Selection only purifies those changes

33
which are lethal or result in significantly diminished fitness to an organism (150–152,
157)
Neutral mutation, combined with genetic drift, has been shown to have a stronger
effect on sequence diversity than selection (150, 151, 157–159). However, pure neutral
mutation is rarely the case. Instead, mutations lead to a slight decrease in fitness of an
organism. Genetic drift and the accumulation of mutational alleles that add a slightly
deleterious effect to the population leads to a process known as Muller’s Ratchet.
Muller’s Ratchet is the accumulation of deleterious mutations in a population as the result
of drift and it leads to extinction or less fit populations over time (160). The concept was
initially introduced as a way to explain the evolution of sex as a means to introduce
recombination and have the re-assortment of alleles introduced back into the population
(160). Muller’s ratchet has been observed for viruses in vitro where serial transmissions
in a laboratory lead to loss of fitness (161–163).
Molecular phylogenetics attempts to resolve the ancestry or relatedness of
observed sequences. There are multiple models that deal with sequence evolution and
distance between two related species, but most evolutionary models are a modification of
the neutral theory and mutational changes of two related sequences (150–153, 157).
These substitution models utilize transitional rate matrices to determine the probability
that a nucleotide will change from one state to another (i.e. A to T), and are a
sophistication from a simple proportion of nucleotide sites that are different. Some
models apply a uniform probability to substitution rates (159), others consider the
transition/transversion bias (164), and more complex models account for the
transition/transversion bias and the GC content bias (158). Further complexity is added
34
when one considers that the evolutionary rate from site to site is not the same, as is the
case in the first and second nucleotide of a codon. This can be modelled by changing the
shape parameter of the probability distribution to the gamma distribution (150, 151, 165).
The phylogenetic tree is a fundamental graph for the imaging and study of
evolutionary relationships. Trees can either be rooted, or unrooted. Rooted trees show a
direction of evolution between the related sequences while unrooted trees only show the
relationship between sequences. Methods used to build trees include distance methods,
maximum parsimony methods, and maximum likliehood methods. Distance methods
draw trees based on the genetic distance between related sequences, maximum parsimony
methods compare four or more sequences and the topology of the tree is picked for the
minimum amount of evolutionary changes to the sequences, and maximum likelihood
methods maximize the likelihood of observing a given set of sequences for specific
substitution models for each possible topology of the tree and the most likely topology is
selected (150).
Rooted trees made by any of the methods can be used to infer time trees, or trees
where branch lengths correspond to units of calendar time (152). For large population
sizes (N), the Wright-Fisher model gives rise to a distribution of time trees, called the
coalescent tree distribution (152–154). Coalescent theory attempts to resolve past
evolutionary processes that affect a population from contemporary sequence data (153,
154). The coalescent distribution is the distribution of probabilities that two random
members of a current generation from a population share a common ancestor (152–154).
The probability can then be determined for the number of discrete generations it took for
the sequences to diverge from their common ancestor common ancestor (153, 154).

35
Establishment of the time to most recent common ancestor (TMRCA) is a powerful tool
that coalescent theory can infer from contemporaneous sequence data.
Phylogeography is an approach that merges phylogenetics and biogeography
(166), and has become more popular with advances in the models of coalescent theory
and computation (167). Phylogeography can address questions of geographical origins
and expansions and the effect of complex factors such as climate change and human
involvement on geographic dispersal (152). For fast-evolving pathogens, such as viruses,
a ‘mugration’ model of Phylogeography can be adopted. Mugration is the modeling of
the migration processes using a substitution model of analyzed sequences (168, 169).
Locations of where the sequences were collected are used to estimate the migration rates
between pairs of locations (152). This approach has been used on a variety of quickly
evolving viruses, such as influenze A H5N1, to determine the origin and paths of global
spread (170). It has also been implemented for dog rabies (171), Rice ellow mottle virus
(RYMV) (172), and Potato Virus Y (PVY) (173). While the majority of examples of
phylogeographic methods are used in studying human or mammalian viruses, the
adoption into the study of plant viruses is burgeoning.
Grapevine vein clearing virus (GVCV) is thought to be a recently emerging virus
in the Badnavirus genus of the Caulimoviridae family which severely impacts the
sustainability of grape production in the Midwest (122, 143, 145, 146, 148). Previous
studies have found alternative hosts for GVCV in the native Vitaceae of the Midwest
(145, 148). Phylogeographic models were implemented to address the question of the
effective population size, if GVCV is endemic to the region, and the historical pattern of
spread of GVCV. Taken together, we can predict the Ne of GVCV by estimating the

36
mutation rate, resolving the phylogenetic relationship of organisms, and working
backward to determine how many generations it would take to find a common ancestor
for the sampled isolates. In essence, the allelic diversity of the sequences analyzed will be
used to predict the Ne by determining the discrete generations that took place to get the
observed sequence variation. Applying the estimated molecular clock will convert
generations to calendar time, the discrete geographic coordinates of the sampled isolates
will be fixed points in a continuous landscape, the resolution of phylogenetic relationship
between the isolates sampled from the discrete positions will give the likely route and
rate of spread through the region. A diffusion model based on a modified Brownian
motion will predict the areas, where it is likely the virus can be found. If the TMRCA is
sufficiently old, it is likely the virus is endemic to the region. This information is crucial
for stakeholders, as it will allow them to predict patterns of spread into their vineyards
from the wild populations of Vitaceae, and can potentially help prevent a pandemic
scenario into other wine producing regions where GVCV has not been detected.
Materials and Methods
Brief synopsis. Inference of the historical spread of Grapevine vein clearing virus
(GVCV) from the wine producing regions of Missouri and Arkansas was attempted using
a tip-dated Bayesian phylogeographic approach. ORF II was proposed to be used for
phylogenetic analysis because of the high sequence divergence for providing higher
resolution between isolates (103, 122). The summary of methods used were to sample
from wild Vitaceae populations, test for GVCV, build a dataset of non-recombining
sequences, determine the best substitution model for phylogenetic analysis, set up tip-

37
dating analysis by testing evolutionary change and determining the molecular clock,
perform Bayesian evolutionary analysis, determine effective population size (Ne) and
time to MRCA, and finally overlay evolutionary changes onto a continuous landscape to
infer historical spread of GVCV through the region.
Samples were collected from native Vitaceae plants for two years, and previous
samples collected by former researchers were also incorporated into the data set. Samples
were collected without regard to symptoms from pre-designated regions in proximity to
wine producing regions, and in regions remote from wine production. Plants were
identified visually in the field, samples were collected, and discrete geographic
coordinates were recorded on mapping software. Tissue samples were brought back to
the lab where a portion was used for DNA extraction, and the remainder frozen for long
term storage. An Excel file containing all samples with geographic coordinates was
created. Polymerase chain reaction (PCR) detection of GVCV nucleic acids was
performed on all samples. Positive samples were selected to PCR amplify the open
reading frame (ORF) II region. Amplified products were extracted and sequenced.
Sequences were aligned to the reference genome GVCV-CHA’s ORF II and compiled
into a FASTA file. All sequences were aligned in MEGA 7 and an alignment file was
exported to RDP4 to test for recombination. Recombinant sequences were removed from
the FASTA file. The new FASTA file was aligned in MEGA 7 and a neighbor joining
tree without bootstrap values was inferred. The tree was uploaded to TEMPEST to
determine if sequences fit a clocklike behavior to calculate a molecular clock rate. The
FASTA file containing all sequences was compiled and uploaded with the molecular
clock rate to the program BEAUti to set evolutionary model parameters. The generated

38
file was uploaded to the program BEAST to perform a Bayesian evolutionary analysis
using a continuous time Markov Chain Monte Carlo (MCMC) method. The generated file
was uploaded into TreeAnnotator and DensiTree, and a maximum clade credibility
(MCC) tree was visualized and trimmed. The tree was uploaded into the program
SPREAD along with geographic coordinates of each sample. The diffusion of GVCV
through the region was imaged on Google Earth using the SPREAD algorithm.
Collection of samples. Sampling from Ampelopsis cordata was preferentially
chosen due to the previously sampled incidence rate (148). County maps for native
Vitaceae plants were consultated for sampling from appropriate locations (Figures 1-5).
Young shoots were collected from observed plants and placed in pre-labeled plastic bags
containing a moist paper towel to prevent desiccation of leaves. Naming convention
started with year sampled, followed by genus, and ending with a four-digit numerical
code (i.e. 16AMP0001). A discrete geographic coordinate point using Decimal Degrees
was marked and stored on the iPhone app, GaiaGPS. Samples were stored on ice in the
field until they were brought back to the lab for long term storage. Three replicates of
samples were weighed in amounts of ~45mg of fresh tissue, flash frozen in liquid
nitrogen, and stored in -80°C until extraction.
DNA extraction and PCR detection of GVCV. DNA was extracted from the
samples by using the Synergy™ 2.0 disruption tubes, BeadBug™, and silica columns
according to the Synergy™ manufacturer protocol. DNA concentration and quality were
analyzed on the Thermofisher 2100 Nanodrop. DNA concentration was diluted to 10
ng/µl and all samples were stored at -20°C.

39
PCR was performed using a triplex primer set containing two GVCV primer sets
and one plant specific primer set for a DNA positive internal control. Primer sets used
were 1101 F and 1935 R, 4363F and 4804 R, and 16s F and 16s R; a list of primer
sequences is located in Table 2. Samples showing a band for either GVCV primer set
were determined to have the virus.
ORF II amplification and Sanger sequencing. GVCV primers flanking the
ORF II region, 963 F and 1634 R (Table 2), were used to amplify the gene sequence of
all positive samples. PCR amplicons were extracted from 1% agarose gel using the
MinElute™ DNA Purification kit supplied by Qiagen. DNA quality and quantity were
analyzed on the Thermofisher 2100 Nanodrop.
DNA samples were prepared with primers 963 F and 1634 R and sent to Nevada
Genomics for Sanger sequencing. Sequences were provided by Nevada Genomics in the
form of a chromatograph that includes the nucleotide sequence and a phred quality score
of the likelihood the correct base was called. The chromat file was imported to the
CodonCode Aligner software package and the sequences were aligned to the GVCV-
CHA genome (GenBank Accession: KX610317.1). Only sequences where phred scores
were above 20 were kept, corresponding to a 99% accuracy of base-calling. All gene
sequences were compiled into a FASTA file.
Sequence alignment and recombination detection. The FASTA file of all
compiled sequences was imported to MEGA 7 (174). Alignment of all the sequences was
performed using the default parameters of the CLUSTAL W algorithm (175). Manual
inspection of the alignment output was performed to correct any discrepancies from the
reference genome. The alignment file was saved as a Nexus file.

40
The alignment file was imported to RDP4, a recombination detection program
(176). Recombination algorithms were used to detect potential recombination events.
Sequences were considered recombinant if five of the algorithms detected a
recombination event. Recombination sequences were removed from the positive
sequence file, due to the confounding effects of recombinant sequences on accurate
phylogenetic analysis (177).
Neighbor joining tree and molecular clock estimation. The new FASTA file
was uploaded to MEGA 7 and the alignment was performed as previously described. A
phylogenetic analysis of the aligned sequences was performed by using a neighbor-
joining distance tree under the prior assumptions of a Timura-Nei substitution model
using a gamma distributed rate variation with a five-shape parameter. The tree was
exported as a Newick tree and saved to a file. This process was repeated for all GVCV
genomes currently sequenced and for 56 Badnavirus genomes acquired from Genbank.
The Newick tree files were imported into TempEst to estimate the molecular
clock rate. The program estimates the clock rate by regressing the branch lengths of the
Newick tree on the dates of the collection of the sampled sequences (178). The mutation
rate is the number of mutations per nucleotide site, per year for the given sequence data.
Test of selection. The aligned ORF II sequences were tested for evidence of
purifying or positive selection at each codon by using the adaptive Branch-Site Random
Effects Likelihood (aBSREL) method in MEGA 7 (179).
Test of suitability of ORF II as a candidate for phylogenetic reconstruction.
The aligned ORF II sequences with the removed recombination sequences were used to
construct a Maximum Likelihood tree with 1000 bootstrap replicates to test for
41
phylogenetic signal form the ORF II region. The Tamura-Nei substitution model and a
uniform rate between sites were the parameters used to reconstruct phylogeny.
BEAUti and the BEAST. The Nexus files of all alignments (ORF II, GVCV,
Badnavirus) were imported into BEAUti (180). The years of collection were set as the tip
dates. A trait partition was imported to use discrete geographic coordinates in a
continuous landscape and linked to each sample for the ORF II sequence data. The
substitution model used a general time reversible (GTR) transition rate matrix (181) using
rate heterogeneity set to a five-parameter gamma probability distribution for each site
(1+2+3) with unlinked substitution rates. The location traits were set to determine routes
of historical transmission using a Brownian random walk model for the ORF II sequence
data. The clock model used was an uncorrelated relaxed lognormal clock, using the
estimated clock rate from Tempest. A coalescent constant population size was used to
determine the tree shape parameters. Ancestral states were reconstructed for the location
partitions to simulate the geographic spread of GVCV. The Markov Chain Monte Carlo
(MCMC) tree construction was set to 10 million itterations and tree samples were taken
every 10,000 iterations. A BEAST file was generated using these parameters. BEAST
performed the Bayesian evolutionary analysis through sampling trees (BEAST) from the
generated file, and built two files for analysis (180).
The data were analyzed on Tracer to determine the 95% highest posterior density
(HPD) interval and the effective sample size (ESS) values for each dataset. The tree data
were uploaded to FigTree and used to find the tree with the highest posterior probability
and build a Maximum clade credibility (MCC) tree. The MCC was imaged on DensiTree
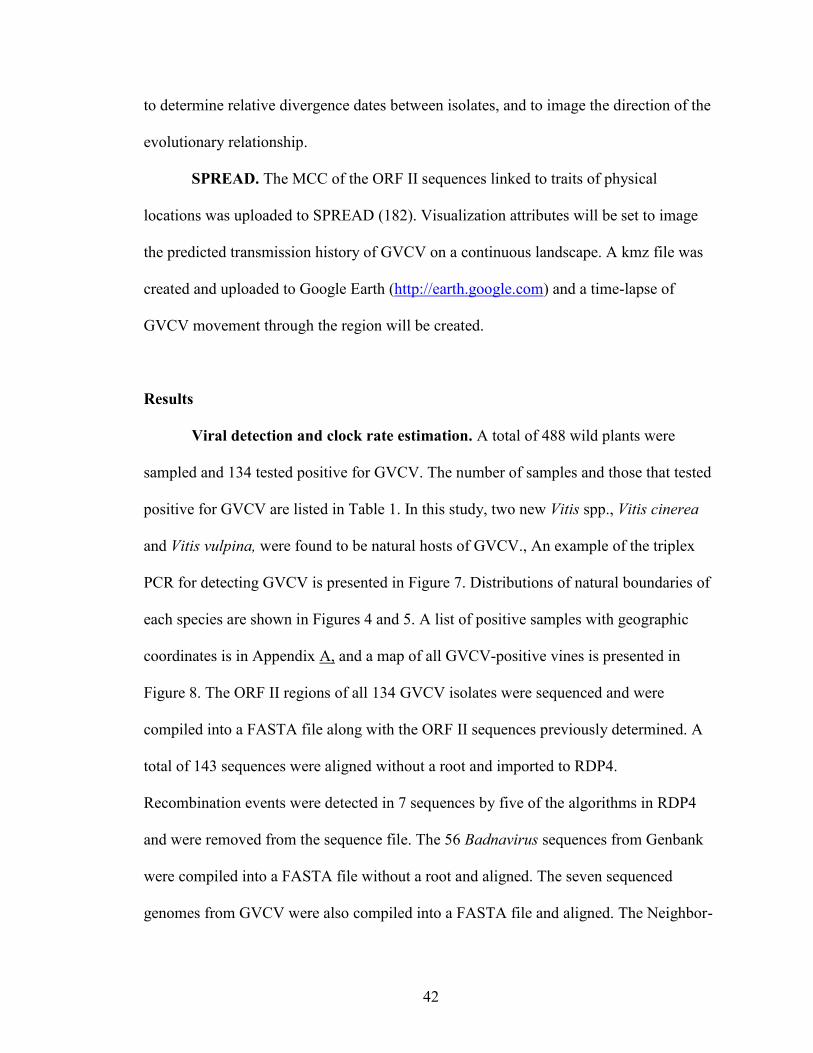
42
to determine relative divergence dates between isolates, and to image the direction of the
evolutionary relationship.
SPREAD. The MCC of the ORF II sequences linked to traits of physical
locations was uploaded to SPREAD (182). Visualization attributes will be set to image
the predicted transmission history of GVCV on a continuous landscape. A kmz file was
created and uploaded to Google Earth (http://earth.google.com) and a time-lapse of
GVCV movement through the region will be created.
Results
Viral detection and clock rate estimation. A total of 488 wild plants were
sampled and 134 tested positive for GVCV. The number of samples and those that tested
positive for GVCV are listed in Table 1. In this study, two new Vitis spp., Vitis cinerea
and Vitis vulpina, were found to be natural hosts of GVCV., An example of the triplex
PCR for detecting GVCV is presented in Figure 7. Distributions of natural boundaries of
each species are shown in Figures 4 and 5. A list of positive samples with geographic
coordinates is in Appendix A, and a map of all GVCV-positive vines is presented in
Figure 8. The ORF II regions of all 134 GVCV isolates were sequenced and were
compiled into a FASTA file along with the ORF II sequences previously determined. A
total of 143 sequences were aligned without a root and imported to RDP4.
Recombination events were detected in 7 sequences by five of the algorithms in RDP4
and were removed from the sequence file. The 56 Badnavirus sequences from Genbank
were compiled into a FASTA file without a root and aligned. The seven sequenced
genomes from GVCV were also compiled into a FASTA file and aligned. The Neighbor-

43
Joining trees are presented in Figures 9-11. The Neighbor-Joining trees of each dataset
were imported to TEMPEST and the molecular clock rate was estimated by regressing tip
dates to genetic distance. Screenshots of the linear regression of samples evolutionary
distance to sampling dates can be found in Figures 12-14. The clock rates and R2 values
are listed in Table 3. The slope of the line is the molecular clock rate that was used in
subsequent analysis.
Test of selection. The analysis of selection for each codon of ORF II showed that
18 codons out of 114 went through purifying selection with the majority being under no
selective constraint. This suggests that ORF II is not a conserved region, as the literature
suggests, and that it’s structure and function can be widely adaptable. A table of the
dN/dS ratio with P-values can be found in Appendix B.
Test of phylogeny. Gooseberry vein banding associated virus (GVBaV)
(GenBank Accession: NC_018105.1) was added to the non-recombinant ORF II
sequences and used as a root to provide a direction of evolution. Phylogenetic analysis
using a Maximum Likelihood tree showed evidence of an unresolved tree with many
polytomies coming from the central branch. Figure 15 shows the lack of resolution of the
phylogenetic relationship. Phylogeographic analysis was pursued even though there was
a lack of supported phylogenetic relationship to provide future researchers with a look
into the methods used for a more suited molecular sequence.
Phylogeographic analysis. The sequence file was further trimmed to include the
125 non-recombinant sequences from 2016 and 2017 for the phylogeographic analysis.
Highest posterior density (HPD) ranges and effective sample size values (ESS) were low
for phylogenetic reconstruction and the uncorrelated-relaxed clock rate, and high for the

44
substitution model used. An example can be seen in Figures 16 and 17. Continuation of
the analysis was conducted to provide a method for future researchers to follow with a
better suited molecular sequence dataset. All results from here will be statistically
unsupported but are relevant for future researchers.
The estimated time to the most recent common ancestor (TMRCA) of GVCV and
GBVBaV based on ORF II sequences is approximately 270 years ago. The TMRCA of
GVCV isolates occurs at a population explosion event occurring between 15-30 years
ago, where the relative effective population size (Ne) jumped by order of a magnitude. A
graph showing the estimated historical Ne changing through time is shown in Figure 18.
The Maximum clade credibility tree of GVCV and ORF II is shown in Figure 19.
A common haplotype in GVCV is the presence or absence of a 9-bp indel in ORF II, a
common genomic feature of GVCV; 35 out of 125 sequences contained the indel. Figure
20 highlights the isolates with the indel and shows the relative geographic positions and
placement on the tree. Figure 21 highlights the isolates from Vitis spp. on the MCC tree.
Augusta and Herman, MO were two of the most heavily sampled areas. Figure 22 shows
their relative positions on the MCC. All highlighted samples show their relative
geographic locations in their real world. Inference of the transmission history of GVCV
was unsuccessful, but future attempts will be made to resolve some key issues.
Discussion
Sampling and incidence suggest endemic nature. The sampling of native plants
in the Vitaceae family revealed two new hosts for GVCV, V. cinerea and V. vulpina.
There are now five known wild hosts to GVCV. A. cordata has a higher incidence rate of

45
GVCV than Vitis spp. Approximately 33% of sampled A. cordata test positive for
GVCV, whereas 14% of sampled Vitis spp. were infected with GVCV (Table 1). As
mentioned in the literature review, it is common for a naturalized wild host of a virus to
have mild or absent symptoms due to the co-evolutionary relationship of the pathogen
with the plant (12, 13, 112–114). We rarely observe distinct GVCV-associated symptoms
on A. cordata, they are usually very mild. Conversely, the GVCV associated disease
progresses from vein clearing to necrotic spots in the leaves of V. rupestris (103, 145). It
is likely that GVCV is endemic to the region and has evolved to infect Vitis spp. as a new
host, first in wild plants, and then into cultivated Vitis spp. The distribution of A. cordata
overlaps with many Vitis spp. in the Midwest (Figures 1 to 5). If GVCV is endemic to the
region and is recently emergent, it is imperative to establish the borders of the virus in
wild populations, and to investigate potential alternative hosts. Figure 6 shows the range
of all Vitis spp. in North America. There is a logical route of migration for GVCV to
spread into alternative hosts, and discovery of the insect vector will help predict the rate
of spread, as sequence data could not resolve issues of past demographics.
Implications of the 9bp-Indel. The 9bp-indel in ORF II at nt position 262 is
likely a deletion. It is interesting to note that isolates from both V. spp. and A. cordata
have the 9bp-indel, further suggesting that GVCV is not host specific in the Vitaceae
family. Viral genetic diversity is known to be large, but generally stable from year to year
if looking at number of haplotypes in the population (48, 49, 117). If the indel is used as a
haplotype, then we can see that 19 out of 40 sequences (47.5%) sampled from 2016
contain the indel, while 19 out of 86 sequences (22%) from 2017 contain the indel. This

46
does not fit the haplotype population stability from year to year as is suggested (48, 49,
117). Perhaps this could be due to the difference in sampling regions from the two years.
2016 had the majority of samples from Arkansas and southern Missouri, while 2017
primarily focused on central and northern Missouri. This could provide evidence of a
historical movement of the virus from the south, as the indel seems to be a deletion. This
is, however, speculation. Further sampling from the boundaries of the A. cordata range
could provide insight into the segregation of isolates based on geography.
Molecular clock. The molecular clock rates were estimated for ORF II, GVCV
genomes, and Badnavirus genomes by linear regression of tip-dates (sample dates) to
evolutionary distance between sequences. This is a simplistic method to estimate a rate,
but it proves to be fairly accurate (183). It is worth noting the clock rates determined that
the older sequences were more divergent from the root, suggesting that the virus is de-
evolving over time. This is shown by the negative slope of the line generated in
TEMPEST. The clock rates are shown in Table 3. GVCV and Badnavirus genomes were
used to determine if the magnitude of the clock was correct, as the evolutionary
relationship between whole genomes can be resolved easily. All clock rates were of the
same magnitude, so the clock rate used for the analysis was ORF II. The R2 values were
low for the Badnavirus and ORF II clock estimate, but were the same magnitude as the
GVCV genome rate (47, 71, 72). Interestingly, the rates predicted fit more closely with
the mutation rate of RNA viruses, rather than DNA viruses. This is not surprising as
Badnaviruses replicate through the RNA intermediate using reverse transcriptase (RT).

47
Purifying selection. Purifying selection was found to act on only 18 out of 114
codons of ORF II, starting at codon 63 and increasing in density. The test of positive
selection showed no signal. It is likely that the putative protein has great adaptability in
function as little constraint is placed on this gene sequence, not surprising considering it
is the most variable region. As discussed earlier, the ORF II of Badnaviruses has been
shown to be nucleic acid binding and capsid binding in two species (128, 129). The
function of GVCV’s ORF II is unknown, but it is likely multi-functional, as viral proteins
usually serve multiple purposes (73).
Maximum Likelihood phylogenetic analysis. Before a phylogeographic
approach could be attempted, it was necessary to test if the sequence data could
accurately resolve the phylogenetic relationship between isolates. A maximum likelihood
(ML) tree was constructed with 1000 bootstrap sampling. The tree could not be
satisfactorily resolved. When the bootstrap cutoff value was set to 70, there were very
few resolved clades and the tree had many polytomies. The tree took a characteristic star
shape, and is indicative of a population explosion in coalescent theory, or suggests low
phylogenetic information in the data set (152–154). Population explosion would make
sense, if the endemic virus recently evolved to broaden its host range and increased its
reproductive fitness (12, 13, 109, 110, 118).
Unfortunately, this lack of phylogenetic reconstruction prevents the accurate
inferences that the analysis was attempted to address. However, the analysis still provided
researchers with a method if more data were collected, and perhaps find a path through a
complicated task.

48
Phylogenetic problems. The only clear conclusion from this data set is that ORF
II is an unsuitable gene candidate to determine phylogenetic relationships of the sampled
isolates. The test of selection showed that the majority of the mutations to the dataset
occurred from neutral mutations and that there was minimal selective constraint on the
gene region, suggesting that the use of substitution models should resolve the phylogeny.
The gene sequence contains 384-393 nts and is the most highly variable region in the
GVCV genome (103, 122, 145). It is generally accepted that 200 nts is the lowest value
for giving confidence values that can completely resolve the phylogenetic relationship
between isolates (184). It is likely that the high variability in the gene sequence and the
low amount of genetic characters, prevent the current models from resolving the
relationship between the isolates. There are a number of explanations beyond this
rationale that could hinder accurate analysis in the future and that will also be discussed.
Recombination events have a drastic detriment to the inference of phylogenies
and can make the phylogeny difficult to resolve even with a few sequences in a large
dataset (177, 185). Caulimovirus as a family are known to be highly recombinant, as is
described in the literature review, which is why the program RDP4 was used to remove
recombinant sequences. The software could have missed detection of recombinant
sequences and could cause problems.
Badnavirus species have been shown to endogenize in their hosts genome (99,
140–142). Endogenized viral elements (EVE) will have the potential to have the same or
similar sequences as episomal forms, but will mutate at a much slower rate (139, 186,
187). The magnitude of Badnaviruses molecular clock was estimated to be in the

49
magnitude of 10-3, while the host plant can range from 10-8-10-12, depending on the where
the EVE is located (150, 151). If GVCV is endogenized, it could be an extinct variant
that is an ancestor to the extant species. This would cause many problems in phylogenetic
reconstruction.
Time tree imbalances can come from incomplete sampling and oversampling
from one year when using heterochronous data. When using a tip-dated phylogenetic
analysis, imbalances in sampling areas and lack of significant heterochronous separation
can lead to biases in the estimation of past timescales (188, 189). This is likely a problem
that occurred for the Bayesian tip-dated analysis. The speciation event of 300 years that
was predicted between GVBaV and GVCV is likely grossly underestimated, as GVBaV
is considered endemic to Europe (190). Further evidence imbalances causing problems
for this analysis is the estimated time to the population explosion of GVCV between 15-
30 years ago. The area covered in sampling is large and the sequence diversity is high, so
this is likely also grossly underestimated as a time of origin for the diversity we see
today.
The sequence likely lacks the length of characters that models need to resolve the
phylogeny, especially considering the observed variability in the region. Whole genome
sequences, more discerning sampling times (days, month, year), and continued sampling
from other regions would likely resolve any issues with the analysis. If whole genome
sequences were not used, then it would benefit to use a less diverse region of the genome
along with ORF II for phylogenetic analysis, most likely a region that undergoes
significant purifying selection and is therefore conserved between isolates. The RT region
would be an excellent candidate of this as it has been shown to undergo selective

50
constraint (146), and is used by the ICTV for taxonomic purposes of new Badnavirus
species (40). Further confounding the temporal analysis is the use of years, and not more
discerning sampling times. More complete sampling using days, months, years may help
more accurately resolve the timescales of ancestor states at nodes. A more thorough
sampling of regions, extending to the boundaries of the known distribution of A. cordata
could provide a better picture of geographic division between haplotypes.
Genetic diversity, host diversity, geographic diversity. From the analysis so
far, it seems that GVCV isolates are not segregated by preference of host. There are six
examples where isolates from Vitis spp. are closely related to isolates from A. cordata;
five of the isolates have complete identity between their ORF II sequences. Figure 15
shows the ML tree with related isolates. Two complete sequences were isolated from a V.
vinifera ‘Chardonel’ and an A. cordata that were 6 meters away from each other and their
genomes were 99.8% similar (122), suggesting that the isolates came from the same
ancestor. If one were to look at the phylogeographic analysis (that is not statistically
supported), it seems that the population is highly mixed in the regions sampled and there
are no discernible delineations of populations segregating into distinct geographic
regions. Figures 19-21 show a few noteworthy categories of viral isolates related to the
geographic landscape: 9-bp indel, Vitis spp., and the regions of Herman and Augusta.
Summary
The discovery of the disease in vineyards in 2009 was prompted by the unique
and severe symptoms on a hybrid grape ’Chardonel’. It is unlikely that the disease was

51
unnoticed in vineyards in Missouri before, as Midwest has a 150-year history of
viticulture. It is also unlikely that the disease was unnoticed if it came from another
region such as California or France, where the viticulture is well developed. The fact that
there is no evidence of these symptoms appearing in the literature before the recent
emergence further suggests this is a newly emergent disease. The incidence of GVCV in
A. cordata and the asymptomatic nature of the disease makes it likely that the virus is
endemic to the Midwest. Wild isolates were found in Missouri, Oklahoma, and Arkansas
for this sampling period, and cultivated isolates were found in the vineyards of Illinois
and Indiana by previous researchers (143, 146). The broad-range of GVCV indicates that
the virus has been established in the region for some time, and the presence of GVCV in
vineyards of Illinois and Indiana suggests spreading of the virus. Unfortunately, the
accurate inference of the historical rate of spread was unsuccessful. If stakeholders
believe it to be of importance, future researchers should address the problems with the
current analysis and use more robust sampling techniques, longer and more conserved
molecular sequences, and a more specific date for tip-date phylogenies.
Surprisingly, GVCV has been found in Brazil, likely arriving in the country from
rootstocks from the Midwest region (191). It is known that humans are a notorious vector
of viral diseases and can establish pandemics by transporting infected plants globally (12,
13, 109, 116, 117). It would be a sound management practice to understand the natural
boundaries of GVCV to establish an effective quarantine protocol in afflicted regions.
This would prevent the virus from spreading into more intensive grape producing regions
and could mitigate future outbreaks. Vitis vinifera is the preferred grape for wine
production in most of the world for its superior berry flavor. The virus induces a strong
52
response and the disease progression is severe in this species. Death of a vine can occur
within seven years (143). Regions such as California and France overwhelmingly
produce wine made from V. vinifera could potentially be devastated by the virus.
Identification of the vector or potential vectors of GVCV is important in
understanding how it spreads into vineyards without the aid of humans. The rate of
spread of GVCV is dependent on the migration pattern of the vector. Vector transmission
is likely as the virus spreads naturally in the wild without human interference. There have
been five identified Vitaceae species that have been found to host GVCV in the wild. The
range of all Vitis spp. can be seen in Figure 6. It is also important to determine the
potential alternative hosts of GVCV to see if the virus can migrate into other regions
without human involvement. Inference of the historical spread would be important for
stakeholders in other regions to predict how the virus may spread across the continent.
Unfortunately, the phylogeographic analysis of historical transmission was unsuccessful,
so it is unknown how the virus has spread through the region naturally, although it is
likely that human involvement has mixed the populations as GVCV was only detected in
2009.

53
CHAPTER 2: CONSTRUCTION OF A GRAPEVINE VEIN CLEARING
VIRUS CLONE
Introduction
Grapevine vein clearing virus (GVCV) was isolated from a grapevine that was
affected by an associated disease of vein clearing and vine decline. Transmission studies
using vegetative grafting of infected vines onto clean vines, and sRNA sequencing and
genome reconstruction provide evidence that GVCV is associated with the disease (149,
192). However, evidence of definitive causality of GVCV as the sole infectious agent of
the associated disease is lacking. To provide evidence of causality of infectious agents to
associated diseases, pathologists employ Koch’s postulates.
Koch’s Postulates are four criteria that must be met before an organism can be
declared as the causative agent of a disease. These criteria are: the organism is observed
in all cases of the disease, the organism can be isolated from a diseased host and a pure
culture can be obtained, a pure culture of the organism introduced to a healthy host will
produce disease symptoms, and the isolation of the organism from the inoculated host
must be the same organism as the original inoculum (193). This task is relatively simple
when studying diseases caused by fungi or bacteria, as the cultures can be isolated on
growth media. Viruses are considerably more difficult, as they are obligate parasites and
need a host cell to undergo a full life cycle. The small size of viruses adds to this
difficulty. Molecular techniques have made isolation of pure viral particles easier and has
facilitated the explosion in research on viral pathogens.

54
Viral genomes must be reconstructed at the molecular level to construct a clone of
a virus that satisfies the requirement of a pure culture. This is done in a variety of ways.
Polymerase chain reaction (PCR) is used to amplify entire viral genomes and these are
inserted directly into transfection vectors (194), viral genomes fragments are amplified by
PCR and assembled into transfection vectors (195), and viral genomes are assembled
piecewise and blasted into cells using particle bombardment (196). These are three of the
most common ways to introduce pure viral cultures into healthy hosts.
Viral clones are said to be infectious if the clone undergoes a full replication life
cycle and virions can be observed in infected tissues. The clone must contain all
necessary components of the genome to undergo successful replication, independent of
components from sources not found in the wild-type virus. If the clone is infectious, the
disease symptoms appear on healthy plants which have been transfected, virions are
observed, and then Koch’s postulates are said to be fulfilled for a viral organism.
GVCV is a double stranded DNA virus that replicates through a terminally
redundant, longer than full length genome RNA intermediate (121, 147). The DNA is
thought to begin replication from the RNA intermediate at the first tRNAmet binding site
and then the reverse transcriptase (RT) switches template to the second tRNAmet to make
the DNA molecule (130, 132). Once the DNA template strand is synthesized, host DNA
polymerase replicates the second strand (123, 132). As a member of the Badnavirus
genus, there are numerous examples of successful cloning techniques. Many techniques
utilize a terminally redundant longer than full length DNA construct introduced by
Agrobacterium spp. (197–199). These protocols use 1.4 genome lengths of viral DNA to
construct their clone to provide terminally redundant ends for the switching of the RT to

55
the redundant tRNAmet binding site. The promoter region of GVCV was shown to be
between nts 7332 and 7672 (147). Design of the clone took into consideration that
previous attempts of the clone with 1.2 genome lengths was insufficient to provide
evidence of causality or replication (121). Identification of the promoter, knowledge of
the replication strategy of Badnaviruses, and successful attempts in the literature were
considered for construction.
Materials and methods
Synopsis. Construction of the clone utilizes a design of 1.4 genome length
terminally redundant GVCV fragment introduced into the shuttle vector
pCR8/GW/TOPO. The 1.4 genome length is assembled from two PCR amplicons that
were cut with unique type IIb restriction enzymes for directional cloning. Three
fragments were digested from the two amplicons and assembled into the correct
conformation for a longer than full length genome that is in the correct reading frame.
Once assembled into pCR8/GW/TOPO, the clone was introduced into the destination
vector pGWB401 to be transformed into Agrobacterium tumefaciens strain ‘GV3101’.
Agrobacterium mediated transfection of healthy susceptible plants was monitored to test
for the presence of GVCV’s associated disease symptoms and molecular tests will
provide evidence for successful replication of the clone construct.
Design. The GVCV-CHA reference genome (Figure 23) (NCBI Reference
Sequence: NC_015784.2), the entry vector pCR8/GW/TOPO, and the destination vector
pGWB401 sequences were downloaded from Addgene (https://www.addgene.org).

56
FASTA files were uploaded into the program SerialCloner 2.6
(http://serialbasics.free.fr/Serial_Cloner.html). The program identified all unique single
cut restriction sites in all genomes. Manual inspection of restriction sites revealed three
restriction enzyme (RE) recognition sequences that were unique to GVCV, contained
overhangs for directional cloning, used the same reaction buffers, and had similar
reaction conditions. Figures 23 and 24 show the genome arrangement of GVCV and the
RE sites used, respectively. The three unique restriction sites were Sal I (GTCGAC), Rsr
II (CGGWCCG), and Avr II (CCTAGG) are listed in Table 4. A list of all RE used is
located in Table 4. A multiple cloning site (MCS) was designed to contain all three
restriction sites in the order Sal I, Rsr II, and Avr II with an overhang of an A at the 3’
end of each strand (GTCGACCGGWCCGCCTAGGA). To construct the MCS, two
oligonucleotides were ordered from Eurofins. The oligonucleotides were reverse-
complimentary and annealed together by adding 25µl of 100µM of each into a 1.5
microcentrifuge tube, heated to 94° C, and then slowly cooled to room temperature. The
MCS was labeled, “MCS/SalI-AvrII”, and stored at -20°C until ready for use.
Construction. PCR Primers were designed to amplify two overlapping fragments
of the GVCV genome that contained the chosen RE sites (Figure 2). Two sets of primers
were identified with similar Tm. Primer sequences of 4363 F and 1179 R, and 697F and
4804R are listed in Table 1. PCR amplified two fragments of 4,570 bp, and 4,187 bp,
respectively. The fragments were directly inserted into pCR8/GW/TOPO and the new
plasmids were labelled pCR8/4808 and pCR8/1179. The two plasmids were transformed
into One Shot™ Top 10 Chemically Competent Escherichia coli using the standard

57
protocol included with the pCR8/GW/TOPO vector. A 90 µl solution of transformed
bacteria was plated on Lysogeny Broth (LB) agar plates mixed with 100µM
spectinomycin and incubated at 37°C overnight to isolate single colonies. Successful
plasmid transformation was confirmed by colony PCR using the GVCV specific primers
listed above. Positive colonies were grown in 5 ml LB broth with 5µl of 100µM
spectinomycin added to prevent contamination from ubiquitous bacteria. Liquid cultures
were incubated at 37°C for 16 hours. 700 µl of liquid culture solution was prepared for
long term storage at -80° C by adding 300 µl of 50% glycerol. Plasmids were isolated
using the Qiagen QIAprep Spin Miniprep kit following the manufacturer protocol. DNA
quality and concentration was determined using the ThermoFisher Nanodrop 2000.
Three RE digests using the overlapping PCR fragments were performed with two
sets of REs in each reaction. An image of fragments produced is presented in Figure 25.
RE digests were performed according to the NEB protocols. Reaction one used
pCR8/1179 as a template and was digested with Sal I and Rsr II to produce two
fragments of sizes 3,893 bps and 3,439 bps. Reaction two also used pCR8/1179 as a
template and was digested with Sal I and Avr II to produce two fragments of sizes 3,429
bps and 3,903 bps. Reaction three used pCR8/4804 as a template and was digested with
Rsr II and Sal I to produce two fragments of sizes 3,853 bps and 3,072 bps. The three
reactions were terminated by adding 10 µl of 6x Purple Loading dye, supplied by NEB.
Reactions were loaded into a 1% agarose gel and fragment sizes were determined by
electropheretically separating fragments and comparing to a DNA ladder of known
fragment sizes (1Kb plus NEB). The fragment of 3,893 bps, corresponding to GVCV
DNA from position 4,643 to 786, was isolated from reaction one and labelled “SalI-

58
RsrII”. The fragment of 3,429 bps, corresponding to GVCV DNA from position 4643 to
323, was isolated from reaction two and labelled “SalI- AvrII”. The fragment of 3,853
bps, corresponding to GVCV DNA from position 786 to 4,643, was isolated from
reaction three and labelled “RsrII- SalI”. All fragments were isolated using the Qiagen
MinElute Gel Extraction Kit by following the manufacturer’s protocol, analyzed on the
Nanodrop, and stored in 1.5 microcentrifuge tubes at -20°C.
MCS/SalI-AvrII was removed from cold storage and inserted into
pCR8/GW/TOPO following the manufacturer’s protocol; the new plasmid construct was
named “pCR8/MCS”. One Shot™ Top 10 Chemically Competent E. coli were
transformed with pCR8/MCS and incubated as previously described. RE digest of
pCR8/MCS with SalI and HpaI were used to confirm successful transformation.
Successful transformations were added to liquid cultures and incubated as previously
described. pCR8/MCS in E. coli was stored in -80°C as previously described. pCR8/MCS
was isolated from liquid culture, analyzed on the Nanodrop, and stored as previously
described.
Fragments RsrII-SalI and SalI-AvrII were ligated using alkaline bovine T4 ligase.
The reaction was set up using 500ng of each fragment, 2µl of T4 ligase buffer, and 1 µl
of T4 ligase. The reaction was incubated at 16°C overnight. The fragment was confirmed
to be 7,286 bp, corresponding to nucleotide positions 786 and 323 of the GVCV-CHA
genome. The fragment was excised from a 1% agarose gel and labeled, “RsrII-AvrII”.
pCR8/MCS was digested with Rsr II and Avr II as previously described and the new
fragment was ligated into the digested pCR8/MCS to make a new plasmid named,
“pCR8/RsrII-AvrII”. The reaction used 1000ng pCR8/MCS and 500ng of fragment RsrII-

59
AvrII, while using the same amounts of other reagents as previously described. The new
plasmid was transformed into Top 10 E. coli, incubated, confirmed positive by colony
PCR, isolated, and stored as previously described.
pCR8/RsrII-AvrII was subjected to a RE digest using Rsr II and Avr II, as
previously described. The fragment was separated on a gel, excised, purified, and
analyzed on the Nanodrop. Fragment SalI-RsrII was removed from storage and ligated to
the purified RsrII-AvrII fragment using reaction conditions similarly described and
named, “1.4 GVCV”. The orientation of each fragment from Figure 25 is shown as the
final construct in Figure 26. Concurrently, pCR8/MCS was digested with Sal I and Avr II
and the 1.4 GVCV fragment was ligated into pCR8/MCS to become pCR8/GVCV and is
shown in Figure 27. pCR8/GVCV was transformed into competent E. coli, incubated,
confirmed positive by colony PCR, isolated, and stored as previously described. Further
confirmation of the construct was performed by RE digest with a double cutter RE BsrGI.
This RE flanks the region of the 1.4 length GVCV insert and provides a fragment of
11,245 bps. The fragment was viewed on a 0.5% agarose gel, excised, purified, and
analyzed on the Nanodrop. The fragment was labeled, “BsrGI GVCV”.
Transfer to binary vector and Agrobacterium transformation. An LR
recombination reaction using Gateway™ technology was used to transfer the 1.4 genome
insert from pCR8/GW/TOPO into pGWB 401. Reaction conditions were according to the
manufacturer protocol. Concurrently, the pGWB 401 plasmid was digested with a double
cutter, BsrGI that was previously used to excise the 1.4 genome length from the
pCR8/GW/TOPO backbone. The BsrGI GVCV fragment was ligated into the pGWB 401
backbone using reaction conditions as previously describe. The 1.4 genome length of

60
GVCV in the gateway binary vector 401 is named pGWB/GVCV. Aliquots of 1µl of
each reaction were transformed into competent E. coli and successful recombinant
plasmids were selected for on a LB agar with 50µM Kanamycin. Colony PCR using M13
F and GVCV specific primer 1179 R (Table 1) was used to test for successful
transformations. Liquid cultures were taken of positive colonies and a sample was stored
at -80°C. Plasmid pGWB/GVCV, shown in Figure 28, was then transformed into
competent Agrobacterium ‘GV3101’, plated on rifampicin and kanamycin selective LB
agar plates, and incubated in the dark at 28°C for 48 hours. Colony PCR using GVCV
internal primers was used to select against false positive transformations. Agrobacterium
that tested positive for pGWB/GVCV were grown in LB broth in the same conditions and
a sample was stored at -80°C.
Transfection of Nicotiana benthamiana. Nicotiana benthamiana were grown
from seed and tested for the presence of GVCV while pGWB/GVCV transformed
Agrobacterium were grown to OD600. Transfections of 20 N. benthamiana plants were
done by syringe infiltration. The transfected plants were placed in insect-proof tents to
prevent the potential for recombinant GVCV DNA to escape, and the plants were grown
in standard greenhouse conditions. Control plants that were not inoculated were also
placed in insect-proof tents and grown in the same conditions. Progression of any disease
symptoms was monitored for a month. At the end of the month, standard PCR detection
using a triplex PCR was used to test for replication of GVCV.
Transfections into susceptible grapevine ‘Chardonel’ will proceed only in when
there is successful replication in the N. benthamiana alternative host. Syringe infiltration

61
and vacuum infiltration are used to test if pGWB/GVCV can successfully lead to a
persistent infection in grapevines while also producing the associated disease symptoms.
Sequencing of pGWB/GVCV. Sequencing of the construct was done at Nevada
Genomics, using M13 primers, and GVCV specific primers in a primer walking strategy.
Samples were prepared using 500ng of pGWB/GVCV with the desired primers and
shipped. Sequences were provided by Nevada Genomics in the form of a chromatograph
that includes the nucleotide sequence and a phred quality score of the likelihood the
correct base was called. The chromat file was imported to the CodonCode Aligner
software package and the sequences were aligned to the theoretical sequence of the 1.4
genome length clone built on Serial Cloner. Only sequences where phred scores were
above 20 were kept, corresponding to a 99% accuracy of base-calling.
Results
Summary. The first attempt at construction of the pGWB/GVCV fragment
proved unsuccessful. There was evidence at each stage that the construction was
successful, but upon sequencing of pGWB/GVCV, it became clear that there were false
positives along the way. The process was attempted again, but a detailed look at each step
for the first attempt provides evidence for possible error.
Construction. PCR fragments 1179 and 4804 were amplified using a high-
fidelity polymerase. The respective bands were purified and inserted into
pCR8/GW/TOPO, and transformed into E. coli. The plasmids were isolated from liquid
E. coli and digested with the aforementioned REs, and these digested fragments were
purified from an agarose gel to produce fragments for ligation. The ligation of the

62
fragments RsrII-SalI and SalI-AvrII to make fragment RsrII-AvrII at 7,286 bps is shown
in Figure 29. The ligated fragments were excised from the gel, purified, and transformed
into RE digested pCR8/MCS.
pCR8/ RsrII-AvrII was digested with the corresponding REs, the band was
purified from the gel to isolate fragment “RsrII-AvrII”, and it was ligated to fragment
“SalI-RsrII” to make the fragment “1.4 GVCV”. pCR8/MCS was digested with REs Sal I
and Avr II, and the fragment “1.4 GVCV” was ligated to the pCR8/GW/TOPO backbone
to create plasmid pCR8/GVCV.
Transfer to binary vector and Agrobacterium transformation. An LR clonase
reaction was attempted using the manufacturer’s protocol, but was unsuccessful,
producing strange banding patterns when imaged on a gel. The traditional method of
cloning was pursued. BsrG I restriction sites were placed in the Gateway plasmids by the
manufacturers to provide an avenue of traditional cloning. These sites flank the TOPO
site where the LR reaction would insert the “1.4 GVCV”, so the BsrG I enzyme was used
to digest pCR8/GVCV and pGWB 401 to transfer the GVCV insert into the binary vector
for Agrobacterium mediated transfection. Bands were purified from the gel, and ligated
to form pGWB/GVCV as shown in Figure 30.
pGWB/GVCV was transformed into competent A. tumefaciens ‘GV 3101’ and
selection of successfully transformed bacteria utilized antibiotic selection plates. Colony
PCR provided evidence that two of five tested colonies had the correct plasmid. Liquid
cultures of A. tumefaciens ‘GV 3101’ were grown to an OD of 600 and used to infiltrate
leaves of N. benthamiana by syringe, while a sample of pGWB/GVCV was sent for

63
sequencing. GVCV like symptoms were noticed, but PCR assays never detected viral
nucleic acids after 2 months of incubation.
Sequencing. Nevada Genomics sequencing did not show GVCV DNA between
the M13 primers that flanked the insert site. The sequence that was recovered was
uploaded to BLAST and a BLASTN search was queried against the GenBank database.
The hits all corresponded to Gateway cloning vectors, suggesting that the ligations were
backbone within backbone.
Second Attempt. A second attempt was made at construction of the clone, since
it is unclear where error was introduced. The process was started from scratch, beginning
with the PCR amplification of the overlapping fragments 1179 and 4804. The PCR
amplification was successful and the fragments were gel purified and introduced to
pCR8/GW/TOPO to make pCR8/1179 and pCR8/4804. Figure 31 shows a successful RE
digest of both plasmids. The gel was switched to a 0.5% agarose solution and ran for two
hours to separate bands that were similar in fragment length. This is believed to be the
step that introduced error, and will be discussed further in the discussion section.
Continuation of the construction of the clone follows the methods previously described is
currently under way.
Discussion
The failure of the first attempt at construction was likely researcher’s error. The
band sizes of the first RE digest are similar for each of the three fragments used to
construct the clone, and the backbone of the pCR8/GW/TOPO vector from where they
were excised. Table 5 lists the REs used and the expected band sizes that would be

64
imaged on a gel. It is likely that the similar sizes of the fragments, the 1% agarose gel,
and the inadequate time for separation all contributed to the failure to separate the bands
in the initial attempt at construction. Figure 31 shows the separation of the bands of the
digested pCR8/1179 and pCR8/4804 plasmids on a 0.5% agarose gel run at 2 hours. It is
obvious that the bands were too similar in size to fully separate on the first attempt, so a
test for contamination of the pCR8/GVCV plasmid was performed. Figure 32 shows the
plasmids used for construction loaded into a 0.5% gel with no RE. There should be only
one band, whereas there are two. It is possible that the first attempt made a chimeric
plasmid of backbone and GVCV inserts. Considering they have similar sizes and the
same restriction sites, if the bands of the pCR8/GW/TOPO backbone and GVCV
fragments were purified together, then there could be ligation of backbone to GVCV and
tests using restriction enzymes and GVCV specific primers would provide false positives.
The insert’s 5’ and 3’ ends were pCR8/GW/TOPO sequences, so the colony PCR assays
must have detected a GVCV sequence that was flanked by backbone sequences. This
unique failure provided positive results until the construct was fully built into
pGWB/GVCV.
The construction of the second attempt will proceed with much more care. Gel
times will be longer to allow full separation of bands, especially of similar lengths, and
sequencing will be done at regular intervals instead of at the end, as it is a definitive
method for confirmation of construct makeup. Greater care will also be taken in making
sure the resolution of the ladder is good enough for determining the size of detailed
bands, instead of looking at relative regions. The methods and designs are sound and
should provide the correct construct if proper care is taken in each step.

65
REFERENCES
1. Cavalieri D, McGovern PE, Hartl DL, Mortimer R, Polsinelli M. 2003.
Evidence for S. cerevisiae fermentation in ancient wine. J Mol Evol 57:S226–
S232.
2. McGovern PE, Fleming SJ, Katz SH. 2003. The origins and ancient history of
wine: food and nutrition in history and antropology. Routledge.
3. McGovern P, Jalabadze M, Batiuk S, Callahan MP, Smith KE, Hall GR,
Kvavadze E, Maghradze D, Rusishvili N, Bouby L. 2017. Early Neolithic wine
of Georgia in the South Caucasus. Proc Natl Acad Sci 114:E10309–E10318.
4. (OIV) IO of V and W. 2012. Statistical Report on World Vitiviniculture 2012.
5. NASS U. 2011. USDA National Agricultural Statistics Service. Acreage Report.
6. 2015. Missouri Wines. Industry.
7. Simms C. 2017. The grape depression. New Sci 236:60–62.
8. 2015. National Clean Plant Network. Natl Clean Plant Centers.
9. Meng B, Martelli GP, Golino DA, Fuchs M. 2017. Grapevine Viruses:
Molecular Biology, Diagnostics and Management. Springer.
10. Fuller KB, Alston JM, Golino DA. 2015. The economic benefits from virus-
screening: A case study of grapevine leafroll in the North Coast of California. Am
J Enol Vitic ajev-2014.
11. Gómez MI, Atallah SS, Martinson TE, Fuchs MF, White GB. 2010. Economic
analysis of the financial impact of the grape leafroll virus (GLRV) in the Finger
Lakes region of New York. Charles H. Dyson School of Applied Economics and
Management, College of Agriculture and Life Sciences, Cornell University.
12. Cooper I, Jones RAC. 2006. Wild plants and viruses: under‐investigated
ecosystems. Adv Virus Res 67:1–47.
13. Jones RAC. 2009. Plant virus emergence and evolution: origins, new encounter
scenarios, factors driving emergence, effects of changing world conditions, and
prospects for control. Virus Res 141:113–130.
14. Scholthof K-BG. 2007. The disease triangle: pathogens, the environment and
society. Nat Rev Microbiol 5:152.
15. Rothman KJ, Greenland S, Lash TL. 2008. Modern epidemiology.

66
16. Madden L V, Hughes G, Bosch F. 2007. The study of plant disease epidemics.
American Phytopathological Society (APS Press).
17. Van der Plank JE. 2013. Plant diseases: epidemics and control. Elsevier.
18. Holmes TP, Aukema JE, Von Holle B, Liebhold A, Sills E. 2009. Economic
impacts of invasive species in forests: past, present, and future. Ann N Y Acad Sci
1162:18–38.
19. Paillet FL. 1982. The ecological significance of American chestnut (Castanea
dentata (Marsh.) Borkh.) in the Holocene forests of Connecticut. Bull Torrey Bot
Club 457–473.
20. Bos L. 1982. Crop losses caused by viruses. Crop Prot 1:263–282.
21. Legg JP, Fauquet CM. 2004. Cassava mosaic geminiviruses in Africa. Plant Mol
Biol 56:585–599.
22. Jones JDG, Dangl JL. 2006. The plant immune system. Nature 444:323.
23. Chisholm ST, Coaker G, Day B, Staskawicz BJ. 2006. Host-microbe
interactions: shaping the evolution of the plant immune response. Cell 124:803–
814.
24. Baker B, Zambryski P, Staskawicz B, Dinesh-Kumar SP. 1997. Signaling in
plant-microbe interactions. Science (80- ) 276:726–733.
25. Lu S, Sun Y, Amerson H, Chiang VL. 2007. MicroRNAs in loblolly pine (Pinus
taeda L.) and their association with fusiform rust gall development. Plant J
51:1077–1098.
26. Xin M, Wang Y, Yao Y, Xie C, Peng H, Ni Z, Sun Q. 2010. Diverse set of
microRNAs are responsive to powdery mildew infection and heat stress in wheat
(Triticum aestivum L.). BMC Plant Biol 10:123.
27. Ding S-W, Li H, Lu R, Li F, Li W-X. 2004. RNA silencing: a conserved antiviral
immunity of plants and animals. Virus Res 102:109–115.
28. Ding S-W. 2010. RNA-based antiviral immunity. Nat Rev Immunol 10:632.
29. Lewsey MG, Murphy AM, MacLean D, Dalchau N, Westwood JH, Macaulay
K, Bennett MH, Moulin M, Hanke DE, Powell G. 2010. Disruption of two
defensive signaling pathways by a viral RNA silencing suppressor. Mol plant-
microbe Interact 23:835–845.

67
30. Zvereva AS, Pooggin MM. 2012. Silencing and innate immunity in plant defense
against viral and non-viral pathogens. Viruses 4:2578–2597.
31. Csorba T, Kontra L, Burgyán J. 2015. Viral silencing suppressors: tools forged
to fine-tune host-pathogen coexistence. Virology 479:85–103.
32. Skalsky RL, Cullen BR. 2010. Viruses, microRNAs, and host interactions. Annu
Rev Microbiol 64:123–141.
33. Guo YE, Steitz JA. 2014. Virus meets host microRNA: the destroyer, the booster,
the hijacker. Mol Cell Biol MCB-00871.
34. Ambros V. 2004. The functions of animal microRNAs. Nature 431:350.
35. Bartel DP. 2004. MicroRNAs: genomics, biogenesis, mechanism, and function.
Cell 116:281–297.
36. Laliberté J-F, Sanfaçon H. 2010. Cellular remodeling during plant virus
infection. Annu Rev Phytopathol 48:69–91.
37. Campillo-Balderas JA, Lazcano A, Becerra A. 2015. Viral genome size
distribution does not correlate with the antiquity of the host lineages. Front Ecol
Evol 3:143.
38. Nasir A, Kim KM, Caetano-Anollés G. 2012. Viral evolution: primordial cellular
origins and late adaptation to parasitism. Mob Genet Elements 2:247–252.
39. Villarreal LP. 2005. Viruses and the evolution of life. ASM press.
40. Carstens EB. 2012. Introduction to virus taxonomy. Virus Taxon Ninth Rep Int
Comm Taxon Viruses,(eds King, AMQ, Adams, MJ, Carstens, EB, Lefkowitz, EJ)
3–20.
41. Felsenstein J. 1978. Cases in which parsimony or compatibility methods will be
positively misleading. Syst Zool 27:401–410.
42. Huelsenbeck JP, Ronquist F, Nielsen R, Bollback JP. 2001. Bayesian inference
of phylogeny and its impact on evolutionary biology. Science (80- ) 294:2310–
2314.
43. Padidam M, Sawyer S, Fauquet CM. 1999. Possible emergence of new
geminiviruses by frequent recombination. Virology 265:218–225.
44. Jetzt AE, Yu H, Klarmann GJ, Ron Y, Preston BD, Dougherty JP. 2000. High
rate of recombination throughout the human immunodeficiency virus type 1

68
genome. J Virol 74:1234–1240.
45. Burke GR, Walden KKO, Whitfield JB, Robertson HM, Strand MR. 2014.
Widespread genome reorganization of an obligate virus mutualist. PLoS Genet
10:e1004660.
46. Fraile A, Alonso-Prados JL, Aranda MA, Bernal JJ, Malpica JM, Garcia-
Arenal F. 1997. Genetic exchange by recombination or reassortment is infrequent
in natural populations of a tripartite RNA plant virus. J Virol 71:934–940.
47. Steinhauer DA, Holland JJ. 1987. Rapid evolution of RNA viruses. Annu Rev
Microbiol 41:409–431.
48. García-Arenal F, Fraile A, Malpica JM. 2001. Variability and genetic structure
of plant virus populations. Annu Rev Phytopathol 39:157–186.
49. García-Arenal F, Fraile A, Malpica JM. 2003. Variation and evolution of plant
virus populations. Int Microbiol 6:225–232.
50. Roossinck MJ. 1997. Mechanisms of plant virus evolution. Annu Rev
Phytopathol 35:191–209.
51. Nasir A, Caetano-Anollés G. 2015. A phylogenomic data-driven exploration of
viral origins and evolution. Sci Adv 1:e1500527.
52. Van Regenmortel MH V. 2007. Virus species and virus identification: past and
current controversies. Infect Genet Evol 7:133–144.
53. Fauquet CM, Stanley J. 2005. Revising the way we conceive and name viruses
below the species level: a review of geminivirus taxonomy calls for new
standardized isolate descriptors. Arch Virol 150:2151–2179.
54. Kuhn JH, Bao Y, Bavari S, Becker S, Bradfute S, Brister JR, Bukreyev AA,
Chandran K, Davey RA, Dolnik O. 2013. Virus nomenclature below the species
level: a standardized nomenclature for natural variants of viruses assigned to the
family Filoviridae. Arch Virol 158:301–311.
55. Sherman MP, Greene WC. 2002. Slipping through the door: HIV entry into the
nucleus. Microbes Infect 4:67–73.
56. Krichevsky A, Kozlovsky S V, Gafni Y, Citovsky V. 2006. Nuclear import and
export of plant virus proteins and genomes. Mol Plant Pathol 7:131–146.
57. Whittaker GR, Helenius A. 1998. Nuclear import and export of viruses and virus
genomes. Virology 246:1–23.

69
58. Goodin M, Yelton S, Ghosh D, Mathews S, Lesnaw J. 2005. Live-cell imaging
of rhabdovirus-induced morphological changes in plant nuclear membranes. Mol
plant-microbe Interact 18:703–709.
59. Menissier J, De Murcia G, Lebeurier G, Hirth L. 1983. Electron microscopic
studies of the different topological forms of the cauliflower mosaic virus DNA:
knotted encapsidated DNA and nuclear minichromosome. EMBO J 2:1067–1071.
60. Kawakami S, Watanabe Y, Beachy RN. 2004. Tobacco mosaic virus infection
spreads cell to cell as intact replication complexes. Proc Natl Acad Sci 101:6291–
6296.
61. Bak A, Gargani D, Macia J-L, Malouvet E, Vernerey M-S, Blanc S, Drucker
M. 2013. Virus factories of Cauliflower mosaic virus are virion reservoirs that
engage actively in vector-transmission. J Virol JVI-01883.
62. Beauchemin C, Boutet N, Laliberté J-F. 2007. Visualization of the interaction
between the precursors of VPg, the viral protein linked to the genome of turnip
mosaic virus, and the translation eukaryotic initiation factor iso 4E in planta. J
Virol 81:775–782.
63. Cheng C-P, Tzafrir I, Lockhart BE, Olszewski NE. 1998. Tubules containing
virions are present in plant tissues infected with Commelina yellow mottle
badnavirus. J Gen Virol 79:925–929.
64. Niehl A, Heinlein M. 2011. Cellular pathways for viral transport through
plasmodesmata. Protoplasma 248:75–99.
65. Schoelz JE, Angel CA, Nelson RS, Leisner SM. 2015. A model for intracellular
movement of Cauliflower mosaic virus: the concept of the mobile virion factory. J
Exp Bot 67:2039–2048.
66. Fereres A, Raccah B. 2015. Plant virus transmission by insects.
67. Eigen M. 1993. Viral quasispecies. Sci Am 269:42–49.
68. Domingo E, Sheldon J, Perales C. 2012. Viral quasispecies evolution. Microbiol
Mol Biol Rev 76:159–216.
69. Schneider WL, Roossinck MJ. 2001. Genetic diversity in RNA virus
quasispecies is controlled by host-virus interactions. J Virol 75:6566–6571.
70. Becker Y. 2000. Evolution of viruses by acquisition of cellular RNA or DNA
nucleotide sequences and genes: an introduction. Virus Genes 21:7–12.
71. Drake JW, Holland JJ. 1999. Mutation rates among RNA viruses. Proc Natl

70
Acad Sci 96:13910–13913.
72. Drake JW. 1993. Rates of spontaneous mutation among RNA viruses. Proc Natl
Acad Sci 90:4171–4175.
73. Belshaw R, Pybus OG, Rambaut A. 2007. The evolution of genome compression
and genomic novelty in RNA viruses. Genome Res 17:0.
74. Drake JW. 1991. A constant rate of spontaneous mutation in DNA-based
microbes. Proc Natl Acad Sci 88:7160–7164.
75. Guimarães KMC, Silva SJC, Melo AM, Ramos-Sobrinho R, Lima JS, Zerbini
FM, Assunção IP, Lima GSA. 2015. Genetic variability of badnaviruses infecting
yam (Dioscorea spp.) in northeastern Brazil. Trop Plant Pathol 40:111–118.
76. González-Jara P, Fraile A, Canto T, García-Arenal F. 2009. The multiplicity of
infection of a plant virus varies during colonization of its eukaryotic host. J Virol
83:7487–7494.
77. Tromas N, Zwart MP, Poulain M, Elena SF. 2014. Estimation of the in vivo
recombination rate for a plant RNA virus. J Gen Virol 95:724–732.
78. Froissart R, Roze D, Uzest M, Galibert L, Blanc S, Michalakis Y. 2005.
Recombination every day: abundant recombination in a virus during a single
multi-cellular host infection. PLoS Biol 3:e89.
79. Chenault KD, Melcher U. 1994. Phylogenetic relationships reveal recombination
among isolates of cauliflower mosaic virus. J Mol Evol 39:496–505.
80. Wright S. 1931. Evolution in Mendelian populations. Genetics 16:97.
81. Fisher RA. 1999. The genetical theory of natural selection: a complete variorum
edition. Oxford University Press.
82. Altschuh D, Lesk AM, Bloomer AC, Klug A. 1987. Correlation of co-ordinated
amino acid substitutions with function in viruses related to tobacco mosaic virus. J
Mol Biol 193:693–707.
83. Rajamäki M, Merits A, Rabenstein F, Andrejeva J, Paulin L, Kekarainen T,
Kreuze JF, Forster RLS, Valkonen JPT. 1998. Biological, serological, and
molecular differences among isolates of potato A potyvirus. Phytopathology
88:311–321.
84. Deom CM, Naidu RA, Chiyembekeza AJ, Ntare BR, Subrahmanyam P. 2000.
Sequence diversity within the three agents of groundnut rosette disease.
Phytopathology 90:214–219.

71
85. Sanz AI, Fraile A, Gallego JM, Malpica JM, García-Arenal F. 1999. Genetic
variability of natural populations of cotton leaf curl geminivirus, a single-stranded
DNA virus. J Mol Evol 49:672–681.
86. Kurath G, Heick JA, Dodds JA. 1993. RNase protection analyses show high
genetic diversity among field isolates of satellite tobacco mosaic virus. Virology
194:414–418.
87. Moury B, Fabre F, Senoussi R. 2007. Estimation of the number of virus particles
transmitted by an insect vector. Proc Natl Acad Sci 104:17891–17896.
88. SYu M, Fedorkin ON, Schiemann J, Baulcombe DC, Atabekov JG. 1997.
Complementation of a potato virus X mutant mediated by bombardment of plant
tissues with cloned viral movement protein genes. J Gen Virol 78:2077–2083.
89. Malyshenko SI, Kondakova OA, Taliansky ME, Atabekov JG. 1989. Plant
virus transport function: complementation by helper viruses is non-specific. J Gen
Virol 70:2751–2757.
90. Brown AJL. 1997. Analysis of HIV-1 env gene sequences reveals evidence for a
low effective number in the viral population. Proc Natl Acad Sci 94:1862–1865.
91. Rouzine IM, Coffin JM. 1999. Linkage disequilibrium test implies a large
effective population number for HIV in vivo. Proc Natl Acad Sci 96:10758–10763.
92. Kouyos RD, Althaus CL, Bonhoeffer S. 2006. Stochastic or deterministic: what
is the effective population size of HIV-1? Trends Microbiol 14:507–511.
93. Jridi C, Martin J-F, Marie-Jeanne V, Labonne G, Blanc S. 2006. Distinct viral
populations differentiate and evolve independently in a single perennial host plant.
J Virol 80:2349–2357.
94. Mayr E. 1999. Systematics and the origin of species, from the viewpoint of a
zoologist. Harvard University Press.
95. Kurath G, Dodds JA. 1995. Mutation analyses of molecularly cloned satellite
tobacco mosaic virus during serial passage in plants: evidence for hotspots of
genetic change. RNA 1:491–500.
96. Kurath G, Palukaitis P. 1989. RNA sequence heterogeneity in natural
populations of three satellite RNAs of cucumber mosaic virus. Virology 173:231–
240.
97. Provine WB. 1989. Founder effects and genetic revolutions in microevolution and
speciation: an historical perspective. Genet Speciat Found Princ 43–76.

72
98. Eni AO, Hughes J d’A, Asiedu R, Rey MEC. 2008. Sequence diversity among
badnavirus isolates infecting yam (Dioscorea spp.) in Ghana, Togo, Benin and
Nigeria. Arch Virol 153:2263–2272.
99. Umber M, Filloux D, Muller E, Laboureau N, Galzi S, Roumagnac P, Iskra‐
Caruana M, Pavis C, Teycheney P, Seal SE. 2014. The genome of A frican yam
(D ioscorea cayenensis‐rotundata complex) hosts endogenous sequences from four
distinct badnavirus species. Mol Plant Pathol 15:790–801.
100. Bhat AI, Sasi S, Revathy KA, Deeshma KP, Saji K V. 2014. Sequence diversity
among badnavirus isolates infecting black pepper and related species in India.
VirusDisease 25:402–407.
101. Yang IC, Hafner GJ, Revill PA, Dale JL, Harding RM. 2003. Sequence
diversity of South Pacific isolates of Taro bacilliform virus and the development of
a PCR-based diagnostic test. Arch Virol 148:1957–1968.
102. Geering ADW, McMichael LA, Dietzgen RG, Thomas JE. 2000. Genetic
diversity among Banana streak virus isolates from Australia. Phytopathology
90:921–927.
103. Beach SJ. 2015. Genetic Diversity of Grapevine Vein Clearing Virus Orf Ii and
Characterization of a New Isolate.
104. Rocha CS, Castillo-Urquiza GP, Lima ATM, Silva FN, Xavier CAD, Hora-
Júnior BT, Beserra-Júnior JEA, Malta AWO, Martin DP, Varsani A. 2013.
Brazilian begomovirus populations are highly recombinant, rapidly evolving, and
segregated based on geographical location. J Virol JVI-00155.
105. Tsompana M, Abad J, Purugganan M, Moyer JW. 2005. The molecular
population genetics of the Tomato spotted wilt virus (TSWV) genome. Mol Ecol
14:53–66.
106. Hillman BI, ANZoLA J V, Halpern BT, Cavileer TD, Nuss DL. 1991. First
field isolation of wound tumor virus from a plant host: minimal sequence
divergence from the type strain isolated from an insect vector. Virology 185:896–
900.
107. Blok J, Mackenzie A, Guy P, Gibbs A. 1987. Nucleotide sequence comparisons
of turnip yellow mosaic virus isolates from Australia and Europe. Arch Virol
97:283–295.
108. Jones RAC. 2006. Control of plant virus diseases. Adv Virus Res 67:205–244.
109. Anderson PK, Cunningham AA, Patel NG, Morales FJ, Epstein PR, Daszak

73
P. 2004. Emerging infectious diseases of plants: pathogen pollution, climate
change and agrotechnology drivers. Trends Ecol Evol 19:535–544.
110. Fargette D, Konate G, Fauquet C, Muller E, Peterschmitt M, Thresh JM.
2006. Molecular ecology and emergence of tropical plant viruses. Annu Rev
Phytopathol 44:235–260.
111. Morales FJ, Anderson PK. 2001. The emergence and dissemination of whitefly-
transmitted geminiviruses in Latin America. Arch Virol 146:415–441.
112. Seal SE, Jeger MJ, Van den Bosch F. 2006. Begomovirus evolution and disease
management. Adv Virus Res 67:297–316.
113. Gibbs A, Gibbs M, Ohshima K, García-Arenal F. 2008. More about plant virus
evolution: past, present, and future, p. 229–250. In Origin and Evolution of
Viruses (Second Edition). Elsevier.
114. Jeger MJ, Seal SE, Van den Bosch F. 2006. Evolutionary epidemiology of plant
virus disease. Adv Virus Res 67:163–203.
115. Bhat AI, Hohn T, Selvarajan R. 2016. Badnaviruses: the current global scenario.
Viruses 8:177.
116. Polston JE, Anderson PK. 1997. The emergence of whitefly-transmitted
geminiviruses in tomato in the western hemisphere. Plant Dis 81:1358–1369.
117. Moriones E, Navas-Castillo J. 2000. Tomato yellow leaf curl virus, an emerging
virus complex causing epidemics worldwide. Virus Res 71:123–134.
118. Morales FJ. 2006. History and current distribution of begomoviruses in Latin
America. Adv Virus Res 67:127–162.
119. Borah BK, Sharma S, Kant R, Johnson AMA, Saigopal DVR, Dasgupta I.
2013. Bacilliform DNA‐containing plant viruses in the tropics: commonalities
within a genetically diverse group. Mol Plant Pathol 14:759–771.
120. Mahy BWJ, Van Regenmortel MH V. 2008. Encyclopedia of virology.
Academic Press.
121. Zhang Y. 2016. Characterization of grapevine vein clearing virus expression
strategy and development of caulimovirus infectious clones. University of
Missouri--Columbia.
122. Su L. 2018. Assessment of Resistance to Botrytis Cinerea in Arabidopsis
Expressing Grapevine STS Genes and Analysis of New Grapevine Vein Clearing
Virus Isolates.

74
123. Ryabova LA, Hohn T. 2000. Ribosome shunting in the cauliflower mosaic virus
35S RNA leader is a special case of reinitiation of translation functioning in plant
and animal systems. Genes Dev 14:817–829.
124. Fütterer J, Kiss-László Z, Hohn T. 1993. Nonlinear ribosome migration on
cauliflower mosaic virus 35S RNA. Cell 73:789–802.
125. Su L, Gao S, Huang Y, Ji C, Wang D, Ma Y, Fang R, Chen X. 2007. Complete
genomic sequence of Dracaena mottle virus, a distinct badnavirus. Virus Genes
35:423–429.
126. Kalischuk ML, Fusaro AF, Waterhouse PM, Pappu HR, Kawchuk LM. 2013.
Complete genomic sequence of a Rubus yellow net virus isolate and detection of
genome-wide pararetrovirus-derived small RNAs. Virus Res 178:306–313.
127. Cheng C-P, Lockhart BEL, Olszewski NE. 1996. The ORF I and II Proteins
ofCommelinaYellow Mottle Virus Are Virion-Associated. Virology 223:263–271.
128. Jacquot E, Hagen LS, Jacquemond M, Yot P. 1996. The open reading frame 2
product of cacao swollen shoot badnavirus is a nucleic acid-binding protein.
Virology 225:191–195.
129. Medberry SL, Lockhart BEL, Olszewski NE. 1990. Properties of Commelina
yellow mottle virus’s complete DNA sequence, genomic discontinuities and
transcript suggest that it is a pararetrovirus. Nucleic Acids Res 18:5505–5513.
130. Hohn T, Fütterer J, Hull R. 1997. The proteins and functions of plant
pararetroviruses: knowns and unknowns. CRC Crit Rev Plant Sci 16:133–161.
131. Hagen LS, Jacquemond M, Lepingle A, Lot H, Tepfer M. 1993. Nucleotide
sequence and genomic organization of cacao swollen shoot virus. Virology
196:619–628.
132. Hohn T, Rothnie H. 2013. Plant pararetroviruses: replication and expression. Curr
Opin Virol 3:621–628.
133. Pfeiffer P, Hohn T. 1983. Involvement of reverse transcription in the replication
of cauliflower mosaic virus: a detailed model and test of some aspects. Cell
33:781–789.
134. Schoelz JE, Wintermantel WM. 1993. Expansion of viral host range through
complementation and recombination in transgenic plants. Plant Cell 5:1669–1679.
135. Luo GX, Taylor J. 1990. Template switching by reverse transcriptase during
DNA synthesis. J Virol 64:4321–4328.

75
136. Dixon L, Nyffenegger T, Delley G, Martinez-Izquierdo J, Hohn T. 1986.
Evidence for replicative recombination in cauliflower mosaic virus. Virology
150:463–468.
137. Bell SM, Bedford T. 2017. Modern-day SIV viral diversity generated by
extensive recombination and cross-species transmission. PLoS Pathog
13:e1006466.
138. Poirier EZ, Vignuzzi M. 2017. Virus population dynamics during infection. Curr
Opin Virol 23:82–87.
139. Geering ADW, Maumus F, Copetti D, Choisne N, Zwickl DJ, Zytnicki M,
McTaggart AR, Scalabrin S, Vezzulli S, Wing RA. 2014. Endogenous
florendoviruses are major components of plant genomes and hallmarks of virus
evolution. Nat Commun 5:5269.
140. Chabannes M, Iskra-Caruana M-L. 2013. Endogenous pararetroviruses—a
reservoir of virus infection in plants. Curr Opin Virol 3:615–620.
141. Chen S, Liu R, Koyanagi KO, Kishima Y. 2014. Rice genomes recorded ancient
pararetrovirus activities: Virus genealogy and multiple origins of endogenization
during rice speciation. Virology 471:141–152.
142. Gayral P, Iskra-Caruana M-L. 2009. Phylogeny of Banana streak virus reveals
recent and repetitive endogenization in the genome of its banana host (Musa sp.). J
Mol Evol 69:65–80.
143. Zhang Y, Singh K, Kaur R, Qiu W. 2011. Association of a novel DNA virus
with the grapevine vein-clearing and vine decline syndrome. Phytopathology
101:1081–1090.
144. Singh K, Kaur R, Qiu W. 2012. New virus discovery by deep sequencing of
small RNAs, p. 177–191. In RNA Abundance Analysis. Springer.
145. Beach S, Kovens M, Hubbert L, Honesty S, Guo Q, Pap D, Dai R, Kovacs L,
Qiu W. 2016. Genetic and Phenotypic Characterization of Grapevine vein clearing
virus from Wild Vitis rupestris. Phytopathology 107:138–144.
146. Guo Q, Honesty S, Xu ML, Zhang Y, Schoelz J, Qiu W. 2014. Genetic diversity
and tissue and host specificity of Grapevine vein clearing virus. Phytopathology
104:539–547.
147. Zhang Y, Angel CA, Valdes S, Qiu W, Schoelz JE. 2015. Characterization of the
promoter of Grapevine vein clearing virus. J Gen Virol 96:165–169.

76
148. Petersen SM. 2016. Discover And Analysis Of Grapevine Vein-Clearing Virus In
Ampelopsis Cordata.
149. Howard S, Qiu W. 2017. Viral small RNAs reveal the genomic variations of three
grapevine vein clearing virus quasispecies populations. Virus Res 229:24–27.
150. Kumar S, Nei M. 2000. Molecular evolution and phylogenetics. Oxford
University Press New York.
151. Nei M. 1987. Molecular evolutionary genetics. Columbia university press.
152. Drummond AJ, Bouckaert RR. 2015. Bayesian evolutionary analysis with
BEAST. Cambridge University Press.
153. Hein J, Schierup M, Wiuf C. 2004. Gene genealogies, variation and evolution: a
primer in coalescent theory. Oxford University Press, USA.
154. Kingman JFC. 1982. The coalescent. Stoch Process their Appl 13:235–248.
155. Nei M, Tajima F. 1981. Genetic drift and estimation of effective population size.
Genetics 98:625–640.
156. Hartl DL, Clark AG, Clark AG. 1997. Principles of population genetics. Sinauer
associates Sunderland.
157. Kimura M. 1983. The neutral theory of molecular evolution. Cambridge
University Press.
158. Hasegawa M, Kishino H, Yano T. 1985. Dating of the human-ape splitting by a
molecular clock of mitochondrial DNA. J Mol Evol 22:160–174.
159. Jukes TH, Cantor CR. 1969. Evolution of protein molecules. Mamm protein
Metab 3:132.
160. Muller HJ. 1932. Some genetic aspects of sex. Am Nat 66:118–138.
161. Fraile A, Pagán I, Anastasio G, Sáez E, García-Arenal F. 2010. Rapid genetic
diversification and high fitness penalties associated with pathogenicity evolution in
a plant virus. Mol Biol Evol 28:1425–1437.
162. de la Iglesia F, Elena SF. 2007. Fitness declines in tobacco etch virus upon serial
bottleneck transfers. J Virol 81:4941–4947.
163. Domingo E, Holland JJ. 1997. RNA virus mutations and fitness for survival.
Annu Rev Microbiol 51:151–178.

77
164. Kimura M. 1980. A simple method for estimating evolutionary rates of base
substitutions through comparative studies of nucleotide sequences. J Mol Evol
16:111–120.
165. Uzzell T, Corbin KW. 1971. Fitting discrete probability distributions to
evolutionary events. Science (80- ) 172:1089–1096.
166. Arbogast BS. 2001. Phylogeography: the history and formation of species. Am
Zool 41:134–135.
167. Hickerson MJ, Carstens BC, Cavender-Bares J, Crandall KA, Graham CH,
Johnson JB, Rissler L, Victoriano PF, Yoder AD. 2010. Phylogeography’s past,
present, and future: 10 years after Avise, 2000. Mol Phylogenet Evol 54:291–301.
168. De Maio N, Wu C-H, O’Reilly KM, Wilson D. 2015. New routes to
phylogeography: a Bayesian structured coalescent approximation. PLoS Genet
11:e1005421.
169. Kühnert D, Wu C-H, Drummond AJ. 2011. Phylogenetic and epidemic
modeling of rapidly evolving infectious diseases. Infect Genet Evol 11:1825–1841.
170. Lemey P, Suchard M, Rambaut A. 2009. Reconstructing the initial global spread
of a human influenza pandemic: a Bayesian spatial-temporal model for the global
spread of H1N1pdm. PLoS Curr 1.
171. Bourhy H, Reynes J-M, Dunham EJ, Dacheux L, Larrous F, Huong VTQ, Xu
G, Yan J, Miranda MEG, Holmes EC. 2008. The origin and phylogeography of
dog rabies virus. J Gen Virol 89:2673–2681.
172. Abubakar Z, Ali F, Pinel A, Traore O, N’Guessan P, Notteghem J-L,
Kimmins F, Konate G, Fargette D. 2003. Phylogeography of Rice yellow mottle
virus in Africa. J Gen Virol 84:733–743.
173. Cuevas JM, Delaunay A, Visser JC, Bellstedt DU, Jacquot E, Elena SF. 2012.
Phylogeography and molecular evolution of Potato virus Y. PLoS One 7:e37853.
174. Kumar S, Stecher G, Tamura K. 2016. MEGA7: molecular evolutionary
genetics analysis version 7.0 for bigger datasets. Mol Biol Evol 33:1870–1874.
175. Thompson JD, Higgins DG, Gibson TJ. 1994. CLUSTAL W: improving the
sensitivity of progressive multiple sequence alignment through sequence
weighting, position-specific gap penalties and weight matrix choice. Nucleic Acids
Res 22:4673–4680.
176. Martin DP, Murrell B, Golden M, Khoosal A, Muhire B. 2015. RDP4:
Detection and analysis of recombination patterns in virus genomes. Virus Evol 1.

78
177. Schierup MH, Hein J. 2000. Consequences of recombination on traditional
phylogenetic analysis. Genetics 156:879–891.
178. Rambaut A, Lam TT, Max Carvalho L, Pybus OG. 2016. Exploring the
temporal structure of heterochronous sequences using TempEst (formerly Path-O-
Gen). Virus Evol 2:vew007.
179. Smith MD, Wertheim JO, Weaver S, Murrell B, Scheffler K, Kosakovsky
Pond SL. 2015. Less is more: an adaptive branch-site random effects model for
efficient detection of episodic diversifying selection. Mol Biol Evol 32:1342–
1353.
180. Drummond AJ, Rambaut A. 2007. BEAST: Bayesian evolutionary analysis by
sampling trees. BMC Evol Biol 7:214.
181. Tavaré S. 1986. Some probabilistic and statistical problems in the analysis of
DNA sequences. Lect Math life Sci 17:57–86.
182. Bielejec F, Rambaut A, Suchard MA, Lemey P. 2011. SPREAD: spatial
phylogenetic reconstruction of evolutionary dynamics. Bioinformatics 27:2910–
2912.
183. Drummond AJ, Nicholls GK, Rodrigo AG, Solomon W. 2002. Estimating
mutation parameters, population history and genealogy simultaneously from
temporally spaced sequence data. Genetics 161:1307–1320.
184. Hillis DM. 1995. Approaches for assessing phylogenetic accuracy. Syst Biol 44:3–
16.
185. Posada D, Crandall KA. 2002. The effect of recombination on the accuracy of
phylogeny estimation. J Mol Evol 54:396–402.
186. Holmes EC. 2011. The evolution of endogenous viral elements. Cell Host
Microbe 10:368–377.
187. Feschotte C, Gilbert C. 2012. Endogenous viruses: insights into viral evolution
and impact on host biology. Nat Rev Genet 13:283.
188. Murray GGR, Wang F, Harrison EM, Paterson GK, Mather AE, Harris SR,
Holmes MA, Rambaut A, Welch JJ. 2016. The effect of genetic structure on
molecular dating and tests for temporal signal. Methods Ecol Evol 7:80–89.
189. Duchêne D, Duchêne S, Ho SYW. 2015. Tree imbalance causes a bias in
phylogenetic estimation of evolutionary timescales using heterochronous
sequences. Mol Ecol Resour 15:785–794.
79
190. Jones AT, McGavin WJ, Geering ADW, Lockhart BEL. 2001. A new
badnavirus in Ribes species, its detection by PCR, and its close association with
gooseberry vein banding disease. Plant Dis 85:417–422.
191. BaSSO MF, FAJARDO TV, SalDaRellI P. 2017. Grapevine virus diseases:
economic impact and current advances in viral prospection and management. Rev
Bras Frutic 39.
192. Hubbert LC. 2014. New Isolate of Grapevine Vein Clearing Virus Found in
Grapevine in Native Habitat and Commercial Vineyard.
193. Koch R. 1884. An address on cholera and its bacillus. Br Med J 2:453.
194. Yanagi M, Purcell RH, Emerson SU, Bukh J. 1997. Transcripts from a single
full-length cDNA clone of hepatitis C virus are infectious when directly
transfected into the liver of a chimpanzee. Proc Natl Acad Sci 94:8738–8743.
195. Rizzo TM, Palukaitis P. 1990. Construction of full-length cDNA clones of
cucumber mosaic virus RNAs 1, 2 and 3: generation of infectious RNA transcripts.
Mol Gen Genet MGG 222:249–256.
196. López-Moya JJ, Garcı́a JA. 2000. Construction of a stable and highly infectious
intron-containing cDNA clone of plum pox potyvirus and its use to infect plants by
particle bombardment. Virus Res 68:99–107.
197. Huang Q, Hartung JS. 2001. Cloning and sequence analysis of an infectious
clone of Citrus yellow mosaic virus that can infect sweet orange via
Agrobacterium-mediated inoculation. J Gen Virol 82:2549–2558.
198. Huang Q, Hartung JS. 2008. Construction of infectious clones of double-
stranded DNA viruses of plants using citrus yellow mosaic virus as an example, p.
525–533. In Plant Virology Protocols. Springer.
199. Hay JM, Jones MC, Blakebrough ML, Dasgupta I, Davies JW, Hull R. 1991.
An analysis of the sequence of an infectious clone of rice tungro bacilliform virus,
a plant pararetrovirus. Nucleic Acids Res 19:2615–2621.
200. NRCS U. Plant Database.

80
Table 1: Number of samples collected over the previous years. “W” denotes wild and “C”
denotes cultivated.
Year Species Total sampled Positive
sampled
Percent
(%)
Before 2016 A. cordata 2 2 100
Before 2016 V. spp. W-35
C*-42
W-2
C*- 35
W- 5.7
C- 83
2016 A. cordata 111 35 31.5
2016 V. spp. W-14
C-19
W-0
C-4
W-0.0
C- 21.1
2017 A. cordata 257 85 33.1
2017 V. spp. W-69 W-10 W-13.8
Total A. cordata 370 122 33
Total V. spp. W-118
C-61
W-12
C-39
W-10.2
C-63.9
*: Samples were collected from only symptomatic vines.
Table 2: Primer list. Used in Grapevine vein clearing detection, ORF II amplification,
sequencing, and construction of infectious clone.
Primer Name Sequence (5’-3’)
16s F tgcttaacacatgcaagtcgga
16s R agccgtttccagctgttgttc
M13 F gttttcccagtcacgac
M13 R caggaaacagctatgac
697 F gctgctgaatacactgtacg
963 F tccatcacagatctaacggca
1101 F ctgaaaggtagatgtccacg
1179 R gccacgtggacatctacctt
1634 R caaggtagcgggcacgag
1935 R tcggtgtagcacttgtattct
4363 F atctgctcaatttctgaaggagaag
4804 R ggaatgcattgtgctcgtag
Table 3: Molecular clock rates of sequences and R2 values.
ID Rate (changes per site, per
year)
R2
Badnavirus 4.8 E-3 7.49 E-2
GVCV 1.0 E-3 0.682
GVCV -ORF II 4.6 E-3 7.43 E-2

81
Table 4: Restriction enzyme list used in construction of clone.
Restriction Enzyme Recognition Sequence (5’-3’)
Sal I GTCGAC
Rsr II CGGWCCG
Avr II CCTAGG
BsrG I TGTACA
Hpa I GTTAAC
Dra I TTTAAA
Table 5: Table of plasmids and restriction enzymes used in the first step of clone
construction. Note the similar sizes of the produced fragments of GVCV DNA and the
pCR8/GW/TOPO backbone.
Plasmid Restriction
Enzymes
GVCV Fragment
size
Plasmid Backbone
size
pCR8/1179 Sal I and Avr II 3,429 3,903
pCR8/1179 Sal I and Rsr II 3,893 3,439
pCR8/4804 Rsr II and Sal I 3,853 3,072

82
Figure 1: Native range of Vitis rupestris. Courtesy of USDA-NRCS (200).
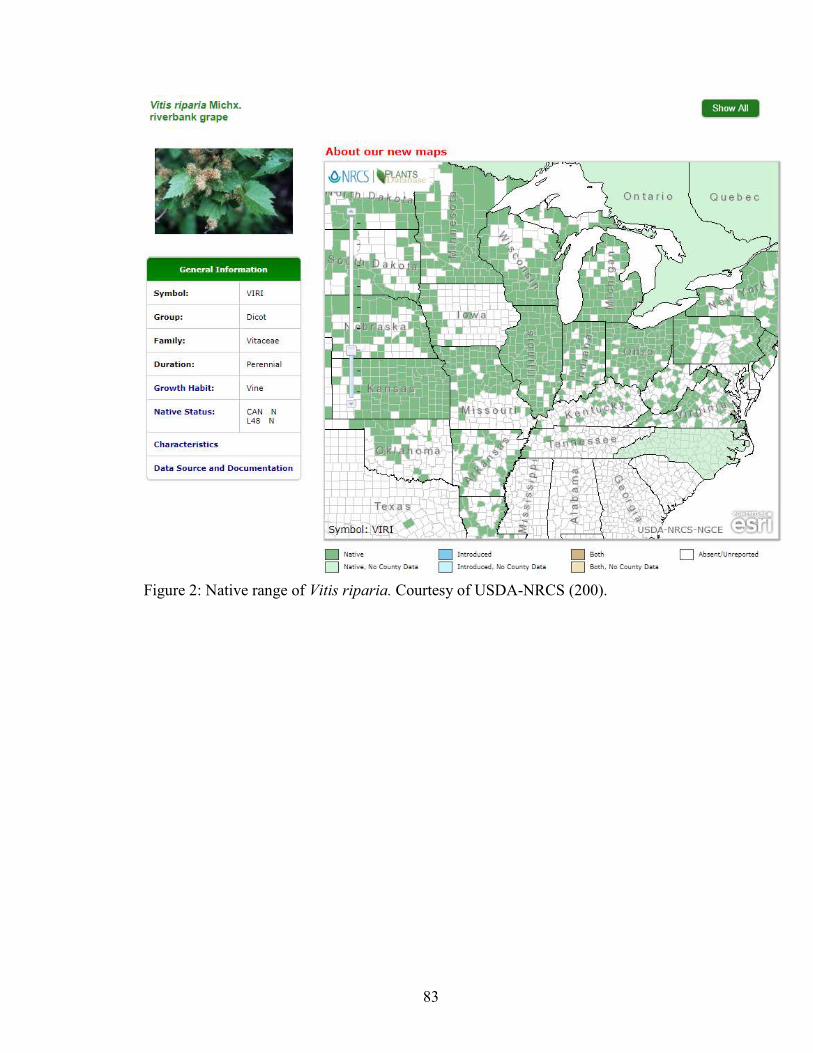
83
Figure 2: Native range of Vitis riparia. Courtesy of USDA-NRCS (200).

84
Figure 3: Native range of Ampelopsis cordata. Courtesy of USDA-NRCS (200).

85
Figure 4: Native range of Vitis cinerea. Courtesy of USDA-NRCS (200).

86
Figure 5: Native range of Vitis vulpina. Courtesy of USDA-NRCS (200).

87
Figure 6: Native range of Vitis Spp. Courtesy of USDA-NRCS. Insets are the county
distribution of the east and west coasts (200).

88
Figure 7: Example of triplex PCR diagnostic to test for Grapevine vein clearing virus.

89
Figure 8: Locations of Grapevine vein clearing virus-infected samples in from 2016 and
2017.

90
Figure 9: Neighbor-joining tree of GVCV ORF II sequences. Used for estimation of
molecular clock.

91
Figure 10: Neighbor-joining tree of Grapevine vein clearing virus genomes. It is used for
estimation of molecular clock.

92
Figure 11: Neighbor-joining tree of Badnavirus genomes, that is used for estimation of
molecular clock.

93
Figure 12: Linear regression of evolutionary distance and time of GVCV based on ORF
II sequences. Statistics are in the table at the upper left-hand corner.

94
Figure 13: Linear regression of evolutionary distance and time of Grapevine vein
clearing virus based on the genome sequences. Statistics are in the table at the upper left-
hand corner.

95
Figure 14: Linear regression of evolutionary distance and time of Badnaviruses based on
the genome sequences. Statistics are in the table at the upper left-hand corner.

96
Figure 15: Maximum Likelihood tree of GVCV based on ORF II sequences that
collapsed to a 70% bootstrap cutoff value. Gooseberry vein banding associated virus is
used as the outgroup.

97
Figure 16: Screenshot from Tracer of ESS values and 95% HPD interval. Relative
constant population size range and frequency distribution is graphed.

98
Figure 17: Screenshot from Tracer showing ESS values for the GTR gamma distribution
for rates. Each codon position is highlighted. The gamma distribution of the substitution
density and frequency of changes is graphed.

99
Figure 18: Divergence time and relative effective population size of Grapevine vein
clearing virus estimated using ORF II sequence data.

100
Figure 19: Maximum clade credibility tree of ORF II isolates evolution through time.
Gooseberry vein banding associated virus is used as a root at the top. Times are in years
before present.

101
Figure 20: Maximum clade credibility tree of GVCV isolates based on ORF II sequences
evolution through time. The red lines highlight ORF II sequences that contain the 9-bp
indel and are traced back to relative geographic points.

102
Figure 21: Maximum clade credibility tree of ORF II isolates evolution through time. The
red lines highlight ORF II sequences that were isolated from Vitis spp. and are traced
back to relative geographic points with the top point being the most northerly.

103
Figure 22: Maximum clade credibility tree of GVCV isolates based on ORF II sequences
through time. The red lines highlight GVCV isolates from samples collected from the
Herman and Augusta wine producing regions and are traced back to relative geographic
points.

104
Figure 23: Genome arrangement of GVCV-CHA reference. The tRNA binding site, and
three open reading frames (ORF) are highlighted and nucleotide positions are listed.

105
Figure 24: GVCV genome with overlapping PCR fragments. Overlapping fragments are
highlighted and GVCV unique restriction sites are shown.

106
Figure 25: Restriction enzyme digested fragments from PCR products.
Figure 26: Fragments from Figure 3 ligated in correct orientation
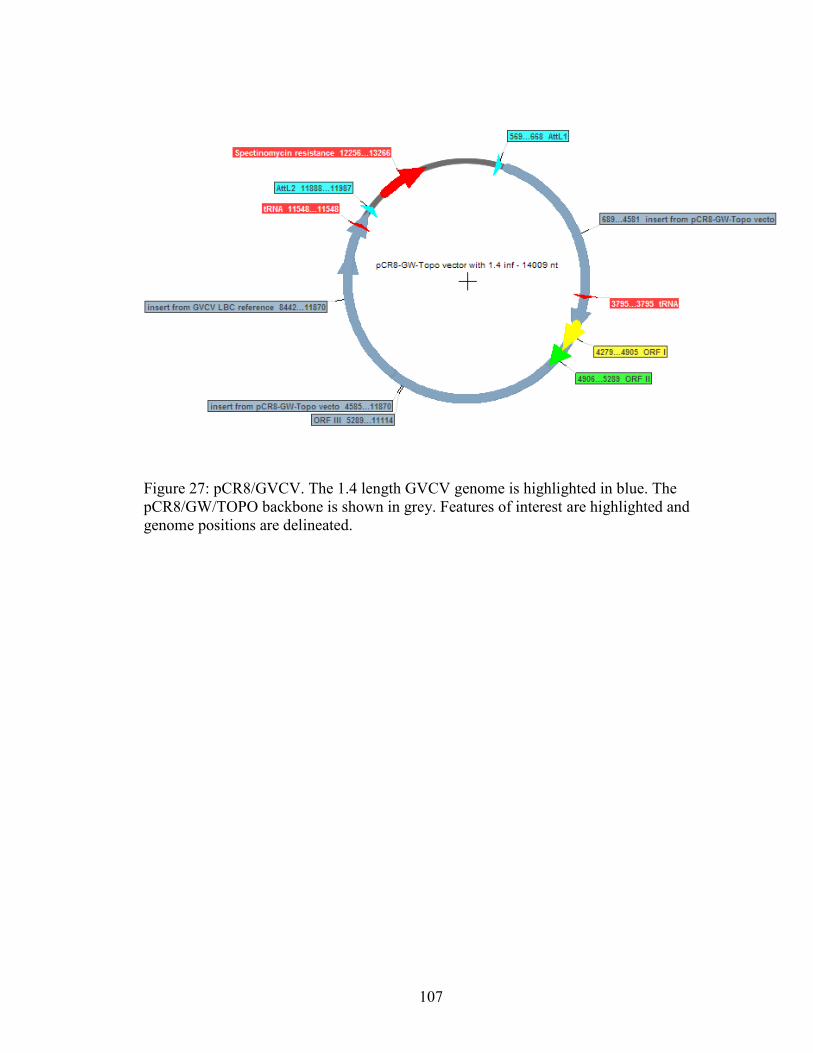
107
Figure 27: pCR8/GVCV. The 1.4 length GVCV genome is highlighted in blue. The
pCR8/GW/TOPO backbone is shown in grey. Features of interest are highlighted and
genome positions are delineated.

108
Figure 28: pGWB/GVCV. The 1.4 length GVCV genome is highlighted in blue. The
pGWB 401 backbone is shown in grey. Features of interest are highlighted and genome
positions are delineated.
1 2 3 4 5 6 7 8
9
Ladder

109
Figure 29: Ligation of fragments “RsrII-SalI” and “SalI-AvrII” to make fragment “RsrII-
AvrII” consisting of 7,286 bps. All lanes contain the ligated fragment.
Ladder 1 2 3

110
Figure 30: Ligation of “1.4 genome” into pGWB 401 to make pGWB/GVCV. Lanes 2
and 3 have an expected band size at 20,396 bps. The top bar on the ladder corresponds to
20,000 bps.
Ladder 1 2 3 4 5 +
Ladder 1 2 3

111
Figure 31: Restriction digest of pCR8/1179 and pCR8/4804. Gel ran for two hours. Lanes
1 and 2 have pCR8/1179 digested with Sal I and Avr II to produce two fragments at sizes
3,429 bps and 3,903 bps. Lanes 3 and 4 have pCR8/4804 digested with Rsr II and Sal I to
produce two fragments at sizes 3,853 bps and 3,072 bps. The top arrow on the ladder
corresponds to 4,000 bps and the bottom corresponds to 3,000 bps.
Ladder 1 2 Ladder 3 4

112
Figure 32: Gel image of multiple pCR8/GVCV plasmids to check for contamination. No
restriction enzyme was used, so only one band should be present, the upper band,
corresponding to 14,009 bps. The lower band is at position 5,000 bps, and is an unknown
contaminant.
Ladder 1 2 3 4 5 6 7
8

113
Appendix
Appendix A
17Vitis0009 37.15 -93.05
17Vitis0021 37.15 -93.05
17Vitis0022 37.15 -93.05
17Vitis0025 37.15 -93.05
17Vitis0027 37.15 -93.05
17Vitis0030 37.15 -93.05
17Vitis0045 37.15 -93.05
17Vitis0047 37.15 -93.05
17Vitis0051 37.6093 -93.4191
17Vitis0052 37.6092 -93.4189
17Amp0003 37.1948 -93.6479
17Amp0009 38.5429 -90.9954
17Amp0014 38.5408 -90.9854
17Amp0019 38.5445 -90.9752
17Amp0022 38.5618 -91.0173
17Amp0024 38.5643 -91.0257
17Amp0025 38.564 -91.0256
17Amp0029 38.5637 -91.0264
17Amp0030 38.5631 -91.0279
17Amp0032 38.5623 -91.0277
17Amp0034 38.562 -91.0278
17Amp0035 38.5619 -91.0279
17Amp0040 38.6044 -91.0011
17Amp0042 38.6053 -91.0026
17Amp0045 38.6061 -91.0038
17Amp0049 38.5938 -90.9838
17Amp0051 38.5864 -90.968
17Amp0052 38.5829 -90.9644
17Amp0067 38.594 -90.8873
17Amp0070 38.5865 -90.8947
17Amp0077 38.6163 -91.0406
17Amp0078 38.6164 -91.0409
17Amp0083 38.6312 -91.0646
17Amp0084 38.631 -91.0643
17Amp0086 38.6299 -91.0635
17Amp0087 38.6348 -91.0494
17Amp0088 38.6273 -91.0516
17Amp0091 38.6272 -91.0515
17Amp0096 38.6293 -91.1074
17Amp0097 38.6444 -91.1833
17Amp0098 38.6443 -91.1836
17Amp0101 38.6444 -91.1851
17Amp0102 38.6967 -91.44
17Amp0103 38.6969 -91.4397
17Amp0104 38.7018 -91.4378
17Amp0105 38.7018 -91.4379
17Amp0108 38.7492 -91.4512
17Amp0119 37.0667 -93.0167
17Amp0125 37.0667 -93.0167
17Amp0133 37.0667 -93.0167
17Amp0140 37.0833 -93.0333

114
17Amp0141 37.0833 -93.0333
17Amp0142 37.0667 -93.05
17Amp0144 37.0833 -93.0333
17Amp0146 37.0672 -93.05
17Amp0148 37.0667 -93.0333
17Amp0156 37.0833 -93.0333
17Amp0154 37.0833 -93.0333
17Amp0156 37.0833 -93.0333
17Amp0158 37.15 -93.05
17Amp0159 37.15 -93.05
17Amp0160 37.15 -93.05
17Amp0162 37.15 -93.05
17Amp0164 37.1 -93.05
17Amp0166 37.1 -93.05
17Amp0167 37.1 -93.05
17Amp0172 37.1 -93.05
17Amp0174 37.1 -93.05
17Amp0175 37.1 -93.0667
17Amp0177 37.1 -93.05
17Amp0180 37.1 -93.05
17Amp0182 37.1 -93.05
17Amp0184 37.1 -93.05
17Amp0190 37.0833 -93.05
17Amp0192 37.0833 -93.05
17Amp0194 37.0833 -93.05
17Amp0195 37.0833 -93.05
17Amp0201 37.0833 -93.05
17Amp0202 37.0833 -93.05
17Amp0203 37.0833 -93.05
17Amp0207 37.6094 -93.4191
17Amp0208 37.6093 -93.4191
17Amp0209 37.6092 -93.4191
17Amp0210 37.6091 -93.4192
17Amp0213 37.6082 -93.419
17Amp0214 37.608 -93.419
17Amp0215 37.6071 -93.4187
17Amp0218 37.605 -93.4185
17Amp0221 37.6051 -93.4184
17Amp0241 39 94.0167
17Amp0242 39 94.0167
17Amp0246 36.9505 -90.9922
17Amp0251 36.9959 -91.013
17Amp0254 36.0167 -93.05
17Amp0256 38.6312 -91.0646
17Amp0257 38.6312 -91.0646
Vit16-15III 37.0356 -93.1516
Vit16-24III 37.1014 -90.0192
Vit16-25III 37.0836 -90
Vit16-26III 37.1019 -90.0019
Vit16-29III 37.0017 -92.0833
Vit16-30III 37.0017 -92
Vit16-31III 37.0017 -92.0833
Vit16-32III 37.0017 -92.0833
Amp16-7I 38.0022 -91.0333
Amp16-9I 38.0017 -91.1333
Amp16-11I 38.0172 -91.1017

115
Amp16-3IIIa 37.0836 -90
Amp16-5IIIa 37.0836 -90.0019
Amp16-6IIIa 37.1019 -90.0019
Amp16-7IIIa 37.1019 -90.0019
Amp16-8IIIa 37.1019 -90.0019
Amp16-13IIIb 36.0692 -93.0524
Amp16-17IIIb 36.1357 -93.1336
Amp16-18IIIb 36.1357 -93.1336
Amp16-21IIIb 36.4231 -93.8422
Amp16-23IIIc 37.0354 -93.1513
Amp16-24IIIc 37.0384 -93.1516
Amp16-25IIIc 37.0355 -93.1515
Amp16-33IIIc 37.0345 -93.0023
Amp16-36IIIe 37 -93.15
Amp16-42IIIe 37.0014 -93.15
Amp16-45IIIe 37.0019 -93.0344
Amp16-51IIIe 37.0006 -93.0839
Amp16-52IIIe 37.0356 -93.1516
AMP2IIIe 37.0008 -93.1503
AMP1IIIf 38.0432 -92.7142
Amp16-17IVc 36.0204 -93.3567
Amp16-18IVc 36.0204 -93.3567
Amp16-8V 35.4712 -93.8109
Amp16-9V 35.4703 -93.8103
Amp16-1VI 34.8516 -92.4832
Amp16-2VI 34.8513 -92.4835
Amp16-3VI 34.8512 -92.4836
Amp16-4VI 34.9041 -92.4481
Amp16-7VI 34.9053 -92.4477
Amp16-1VII 35.1019 -98.0183
Amp16-3VII 35.1019 -98.0183

116
Appendix B
Codon dS dN dN-dS P-value 1 0 0 0 N/A 2 1 4.001384818 3.001384818 0.142959599 3 1 0 -1 1 4 0 0 0 N/A 5 0 0 0 N/A 6 5.348465017 0 -5.348465017 1 7 4 0 -4 1 8 2 0 -2 1 9 3 0 -3 1 10 1 0.5 -0.5 0.888888889 11 10.33560478 0 -10.33560478 1 12 1.337070414 0 -1.337070414 1 13 10.52619562 0 -10.52619562 1 14 15.45176937 1.70357158 -13.74819779 0.999994144 15 4.750799062 2.854810645 -1.895988417 0.872656224 16 3 0 -3 1 17 3.885740644 0 -3.885740644 1 18 10.632716 3.566783559 -7.065932438 0.990899824 19 17 0 -17 1 20 5 0 -5 1 21 1.048671897 1.978949592 0.930277695 0.486392159 22 8 0 -8 1 23 7 0 -7 1 24 10 0 -10 1 25 24.02168734 0 -24.02168734 1 26 0 0 0 N/A 27 7.972544882 0 -7.972544882 1 28 5.690498738 0 -5.690498738 1 29 11 0.500215677 -10.49978432 0.999998112 30 1 0 -1 1 31 16 0 -16 1 32 19.54454151 0 -19.54454151 1 33 22 0 -22 1 34 5.477592218 0 -5.477592218 1 35 10 0 -10 1 36 0 0 0 N/A 37 5.436934154 0 -5.436934154 1 38 12.58332593 0 -12.58332593 1 39 19.18857439 0 -19.18857439 1 40 1 0 -1 1 41 26.83346937 0 -26.83346937 1 42 5.637952591 3.388986506 -2.248966086 0.881539136 43 5.148672983 0 -5.148672983 1 44 0 0 0 N/A 45 5 0 -5 1 46 10.18901587 0 -10.18901587 1 47 12.35013488 0 -12.35013488 1 48 8.852121258 0 -8.852121258 1 49 12.68454686 0 -12.68454686 1 50 5.34139973 0 -5.34139973 1

117
51 10.25704497 0 -10.25704497 1 52 1.28921662 0 -1.28921662 1 53 16 0 -16 1 54 5.783427403 0 -5.783427403 1 55 4.015387781 0 -4.015387781 1 56 9.06450081 0 -9.06450081 1 57 7.024176796 0 -7.024176796 1 58 8.200218651 0 -8.200218651 1 59 5.080021403 0.496092729 -4.583928673 0.998752906 60 2.548371665 4.233757008 1.685385343 0.396101734 61 0 2.5 2.5 0.131687243 62 0 1.038503643 1.038503643 0.433588707 63 0 4.533723679 4.533723679 0.046156937 64 0 0.500053562 0.500053562 0.698743294 65 0 1 1 0.444444444 66 0 7.070505927 7.070505927 0.003268459 67 0 0.999532627 0.999532627 0.444860179 68 1.960925031 5.103525034 3.142600003 0.164533324 69 0 5.79976085 5.79976085 0.011582408 70 0 7.400456182 7.400456182 0.005661323 71 0 0 0 N/A 72 0 0 0 N/A 73 0 1.998025677 1.998025677 0.198312772 74 1.004884804 1.995150727 0.990265923 0.464109918 75 0 3.999550372 3.999550372 0.039438971 76 1.185074634 1.731123111 0.546048477 0.535788729 77 8.014866335 5.494903903 -2.519962432 0.855199913 78 0 1.892883087 1.892883087 0.297297905 79 0 9.689675583 9.689675583 0.000335811 80 0 9.27349736 9.27349736 0.001146213 81 1.119524055 9.600655299 8.481131244 0.005570597 82 1.181475219 14.43103572 13.2495605 1.34844E-05 83 0 2.130001694 2.130001694 0.179152257 84 0 4 4 0.039018442 85 1.125078402 0.473670312 -0.651408089 0.91222074 86 0 1.794757095 1.794757095 0.137976818 87 0 7.767242901 7.767242901 0.047080068 88 0 0 0 N/A 89 0 3.315004304 3.315004304 0.085595084 90 0 5.221639798 5.221639798 0.034389266 91 0 1.99857173 1.99857173 0.198738599 92 0 3.552828148 3.552828148 0.053123924 93 0 6.994244109 6.994244109 0.003465165 94 12.49380507 1.887180873 -10.60662419 0.999927827 95 0 0.509590012 0.509590012 0.654291191 96 1.084022115 0.515441379 -0.568580737 0.896149188 97 0 8.718463919 8.718463919 0.000905455 98 0 2.697845482 2.697845482 0.165988325 99 0 12.13710937 12.13710937 9.94129E-06 100 0 6.556923415 6.556923415 0.010564957 101 0 3.423506631 3.423506631 0.068391576 102 0.606275831 2.584429094 1.978153263 0.314276423 103 0 8.738959838 8.738959838 0.001142327 104 0 2.0609688 2.0609688 0.209539858 105 7 5 -2 0.828143294 106 0 0 0 N/A
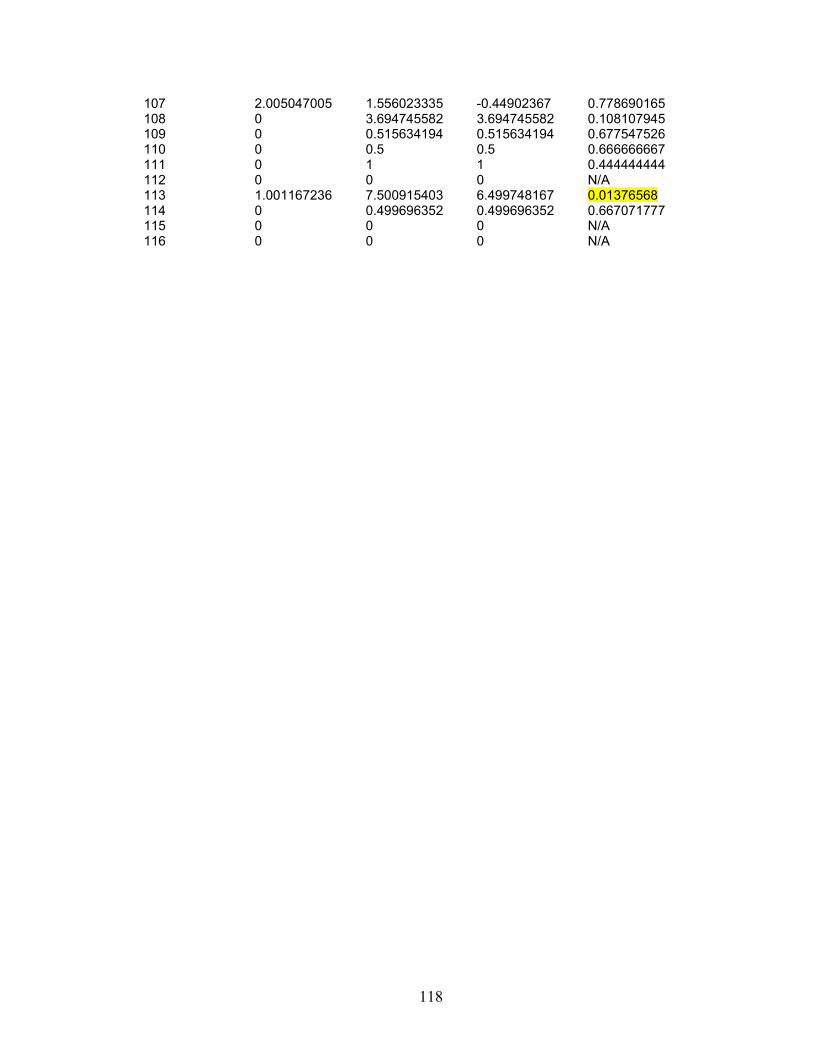
118
107 2.005047005 1.556023335 -0.44902367 0.778690165 108 0 3.694745582 3.694745582 0.108107945 109 0 0.515634194 0.515634194 0.677547526 110 0 0.5 0.5 0.666666667 111 0 1 1 0.444444444 112 0 0 0 N/A 113 1.001167236 7.500915403 6.499748167 0.01376568 114 0 0.499696352 0.499696352 0.667071777 115 0 0 0 N/A 116 0 0 0 N/A