grand gulf, unit 1, annual radiological environmental
TRANSCRIPT

•~EntergyGNRO-2017/00029
April 27, 2017
U.S. Nuclear Regulatory CommissionAttn: Document Control DeskWashington, DC 20555-0001
Entergy Operations, Inc.P.o. Box 756Port Gibson, MS 39150
James NadeauManager, Regulatory AssuranceGrand Gulf Nuclear StationTel. (601) 437-2103
SUBJECT: Grand Gulf Nuclear Station Annual Radiological Environmental Operating Report(AREOR)Grand Gulf Nuclear Station, Unit 1Docket No. 50-416License No. NPF-29
Dear Sir or Madam:
In accordance with the Grand Gulf Nuclear Station (GGNS) Unit 1 Technical Specification 5.6.2,attached is the Annual Radiological Environmental Operating Report (AREOR) for the timeperiod of January 1, 2016 through December 31, 2016.
There are no new commitments contained in this submittal. If you have any questions or requireany additional information, please contact Richard Sumrall at 601-437-2115.
JJN/sas
Attachment: Grand Gulf Nuclear Station 2016 Annual Radioactive Release Report (AREOR)
cc: (see next page)
GNRO-2017/00029Page 2 of 2
cc: U.S. Nuclear Regulatory Commission_ATTN: Mr. Siva Lingham
Mail Stop OWFN 8 B1Rockville, MD 20852-2738
U.S. Nuclear Regulatory CommissionATTN: Mr. Kriss M. Kennedy (w/2)Regional Administrator, Region IV1600 East Lamar BoulevardArlington, TX 76011-4511
Mr. B. J. Smith (w/2)Director, Division of Radiological HealthMississippi State Department of HealthDivision of Radiological Health3150 Lawson StreetJackson, MS 39213
NRC Senior Resident InspectorGrand Gulf Nuclear StationPort Gibson, MS 39150

Attachment to GNRO-2017/00029
Grand Gulf Nuclear Station 2016 Annual Radiological Environmental Operating Report(AREOR)

ENTERGY OPERATIONS, INC.GRAND GULF NUCLEAR STATION
ANNUALRADIOLOGICAL ENVIRONMENTAL
OPERATING REPORT
January 1, 2016 - December 31, 2016
~d.JL-,-=oPrepared By
1ic;&~t/r,r~ '1/"'410
Reviewed By
Approved By
.. . .- $' - .. ·%-&2..£1'"& _.- g. Sh *4 . -.
TABLE OF CONTENTS
SUMMARY
1.0 INTRODUCTION
1.1 Radiological Environmental Monitoring Program
1.2 Pathways Monitored
1.3 Land Use Census
2.0 INTERPRETATION AND TRENDS OF RESULTS
2.1 Air Particulate and Radioiodine Sample Results
2.2 Thermoluminescent Dosimetry (TLD) Sample Results
2.3 Water Sample Results
2.4 Sediment Sample Results
2.5 Milk Sample Results
2.6 Fish Sample Results
2.7 Food Product Sample Results
2.8 Land Use Census Results
2.9 Interlaboratory Comparison Results
3.0 RADIOLOGICAL ENVIRONMENTAL MONITORING PROGRAM SUMMARY
3.1 Program Results Summary
2
6
10
10
10
10
23
23
23
24
25
25
25
25
25
32
33
33
i-hii# ~. &- aa
TABLE 1.1
TABLE 1.2
TABLE 2.1
TABLE 3.1
LIST OF TABLES
AIR SAMPLING DEVIATIONS IN 2016
RADIOLOGICAL ENVIRONMENTAL SAMPLING PROGRAM
LAND USE CENSUS RESULTS
RADIOLOGICAL ENVIRONMENTAL MONITORINGPROGRAM SUMMARY
3
8
12
27
34

FIGURE 1-1
FIGURE 1-2
FIGURE 1-3
FIGURE 2-1
LIST OF FIGURES
EXPOSURE PATHWAYS
SAMPLE COllECTION SITES - NEAR FIELD
SAMPLE COllECTION SITES - FAR FIELD
TlD READINGS
4
20
21
22
24

ATTACHMENT 1
LIST OF ATTACHMENTS
RADIOLOGICAL MONITORING REPORTSUMMARY OF MONITORING RESULTS
5
40
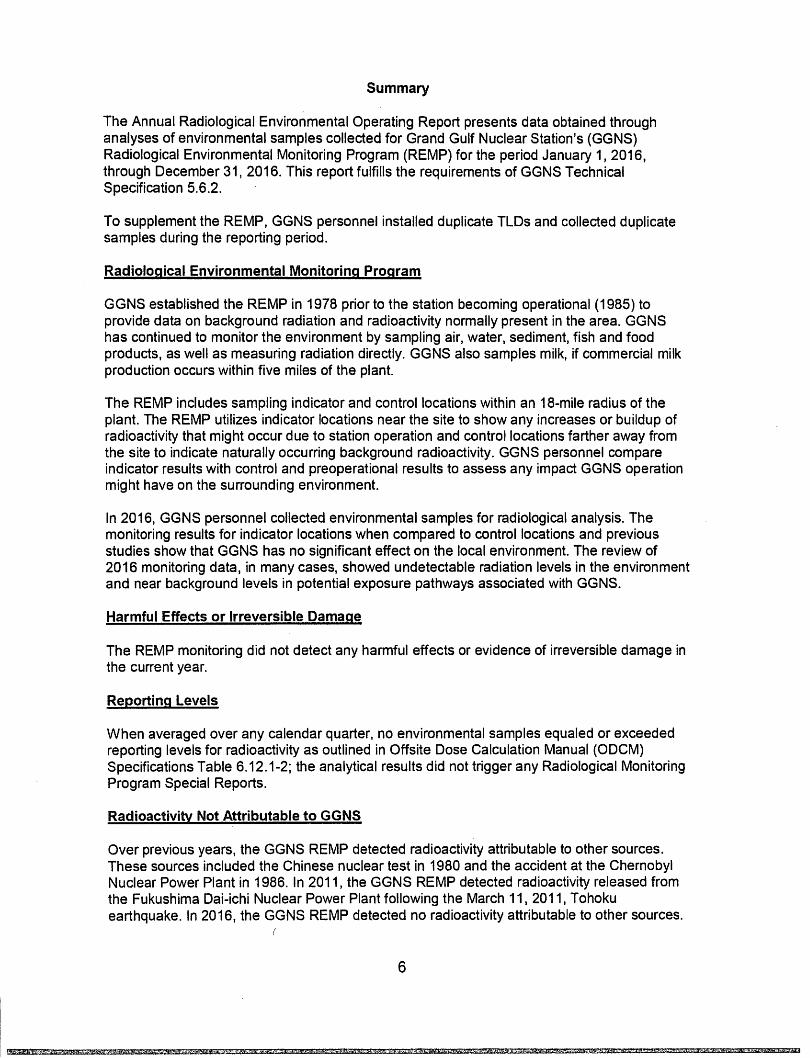
Summary
The Annual Radiological Environmental Operating Report presents data obtained throughanalyses of environmental samples collected for Grand Gulf Nuclear Station's (GGNS)Radiological Environmental Monitoring Program (REMP) for the period January 1, 2016,through December 31, 2016. This report fulfills the requirements of GGNS TechnicalSpecification 5.6.2.
To supplement the REMP, GGNS personnel installed duplicate TLDs and collected duplicatesamples during the reporting period.
Radiological Environmental Monitoring Program
GGNS established the REMP in 1978 prior to the station becoming operational (1985) toprovide data on background radiation and radioactivity normally present in the area. GGNShas continued to monitor the environment by sampling air, water, sediment, fish and foodproducts, as well as measuring radiation directly. GGNS also samples milk, if commercial milkproduction occurs within five miles of the plant.
The REMP includes sampling indicator and control locations within an 18-mile radius of theplant. The REMP utilizes indicator locations near the site to show any increases or buildup ofradioactivity that might occur due to station operation and control locations farther away fromthe site to indicate naturally occurring background radioactivity. GGNS personnel compareindicator results with control and preoperational results to assess any impact GGNS operationmight have on the surrounding environment.
In 2016, GGNS personnel collected environmental samples for radiological analysis. Themonitoring results for indicator locations when compared to control locations and previousstudies show that GGNS has no significant effect on the local environment. The review of2016 monitoring data, in many cases, showed undetectable radiation levels in the environmentand near background levels in potential exposure pathways associated with GGNS.
Harmful Effects or Irreversible Damage
The REMP monitoring did not detect any harmful effects or evidence of irreversible damage inthe current year.
Reporting Levels
When averaged over any calendar quarter, no environmental samples equaled or exceededreporting levels for radioactivity as outlined in Offsite Dose Calculation Manual (ODCM)Specifications Table 6.12.1-2; the analytical results did not trigger any Radiological MonitoringProgram Special Reports.
Radioactivitv Not Attributable to GGNS
Over previous years, the GGNS REMP detected radioactivity attributable to other sources.These sources included the Chinese nuclear test in 1980 and the accident at the ChernobylNuclear Power Plant in 1986. In 2011, the GGNS REMP detected radioactivity released fromthe Fukushima Dai-ichi Nuclear Power Plant following the March 11,2011, Tohokuearthquake. In 2016, the GGNS REMP detected no radioactivity attributable to other sources.
(
6

Comparison to Federal and State Programs
GGNS personnel compare REMP data to federal and state monitoring programs. Historically,the programs used for comparison included the U.S. Nuclear Regulatory Commission (NRC)Thermoluminescent Dosimeter (TLD) Direct Radiation Monitoring Network and the MississippiState Department of Health (MSDH), Division of Radiological Health monitoring program.
Although the NRC TLD Network Program was discontinued in 1998, these results comparedfavorably to those from the GGNS REMP.
The MSDH and the GGNS REMP have similar monitoring requirements. These programsinclude co-located air sampling and sharing sample media such as water, sediment, fish andfood products. Both programs have obtained similar results. The 2016 results of the MSDHmonitoring program compared favorably with the GGNS REMP results.
Sample Deviations
• Milk
The GGNS aDCM requires collection of milk samples if there is a commerciallyavailable source within 5 miles (8 km) of the plant. In 2016·, the REMP did not includemilk sampling because no commercial milk production occurred within 5 miles ofGGNS. GGNS personnel instead collected vegetation samples to monitor the ingestionpathway, as specified in aDCM Specifications Table 6.12.1-1.
• Required Lower Limit of Detection (LLD) Values
Analytical lower limit of detection (LLD) values required by the aDCM specificationsachieved in 2016 were within the limits for all samples with the following exception:
Sample TypeLocation I Analysis NuclidesDate
Air ParticulateAS-3 VA 11-131 & Gross Beta lodine-13105/10/16 - 05/17/17 Gross Beta
Cause was attributed to unavoidable small sample size due to failure of the samplingequipment. All remaining LLDs were achieved and no plant related nuclides weredetected in the 2016 samples. As described in aDCM Specification Table 6.12.1-3,footnote (b), LLDs may be unachievable due to unavoidable small sample size andother legitimate reasons.
Air particulate samples are collected weekly at indicator [AS-1 PG, AS-7 UH] andcontrol [AS-3 VA] locations. In addition, a quarterly composite sample for each locationis analyzed for gamma isotopic. For all remaining 2016 air particulate samples, LLDswere achieved and no plant related nuclides were detected.
7
-" ~ b

• Thermoluminescent Dosimeters
TLD M-36 (Sector P, Radius 5.0 Miles), was unavailable during 2nd quarter, 2016, dueto the TLD was missing during sample collection. As described in aDCM SpecificationTable 6.12.1-1, footnote (a), deviations from the required sampling schedule arepermitted due to malfunction of sampling equipment and other legitimate reasons.
• Air Samples
The following air sample locations had reduced run times due to weather-related poweroutages or mechanical problems. As described in aDCM Specification Table 6.12.1-1,footnote (a), deviations from the required sampling schedule are permitted due tomalfunction of sampling equipment and other legitimate reasons.
Table 1.1 Air Sampling Deviations in 2016
Run Time Out-of-ServiceSample Location Date In Date Out (Hours) (Hours) Comments
AS-7 UH 03/08/2016 03/15/2016 165.02 3.69 Power outage
AS-7 UH 03/29/2016 04/05/2016 158.75 9.16 Power outaue
AS-7 UH 04/12/2016 04/19/2016 165.90 1.86 Power outage
AS-7 UH 04/19/2016 04/26/2016 167.98 0.82 Power outaoe
AS-361VA 05/10/2016 05/17/2016 16.30 157.41 Equipment Failure
AS-20 GR 07/1212016 07/19/2016 159.70 7.83 Power outage
AS-7 UH 08/09/2016 08/16/2016 163.18 5.03,- Power outaoe
AS-20 GR 08/09/2016 08/16/2016 162.37 5.84 Power outage
AS-20 GR 09/13/2016 09/20/2016 90.42 77.68 Equipment Failure
AS-7 UH 09/20/2016 09/27/2016 162.67 4.91 Power outage
AS-20 GR 09/20/2016 09/27/2016 167.17 0.49 Power outage
AS-20 GR 10/11/2016 10/18/2016 128.72 36.41 Equipment Failure
AS-7 UH 10/18/2016 10/25/2016 166.95 3.03 Power outage
AS-20 GR 10/18/2016 10/25/2016 166.55 3.10 Power outage
AS-20 GR 11/08/2016 11/15/2016 167.21 0.74 Power outage
AS-7 UH 11/15/2016 11/2212016 165.72 1.66 Power outage
AS-20 GR 11/15/2016 11/22/2016 165.72 1.64 Power outage
AS-7 UH 11/2212016 11/29/2016 160.38 7.92 Power outage
AS-20 GR 11/2212016 11/29/2016 166.46 1.87 Power outage
AS-7 UH 11/29/2016 12/06/2016 168.62 0.63 Power outage
AS-20 GR 11/29/2016 12/06/2016 168.99 0.24 Power outace
AS-20 GR 12106/2016 12113/2016 160.86 7.79 Power outage
AS-7 UH 12127/2016 01/03/2017 162.00 5.61 Power outage
Sample location AS-20 GR was placed in service on 06/14/16. Based on the samplecollection period reductions, air samples were collected the following percentages of theavailable time:
AS-1 PGAS-361VAAS-7 UHAS-20 GR
8
100.0%98.2%99.5%97.0%
• Missed Samples
All required samples were collected in accordance with REMP requirements. Therewere no missed samples.
• Unavailable Results
GGNS received analytical results in adequate time for inclusion in this report.
Program Modifications
During 2016, one additional air monitoring station was installed in the vicinity of the nearestcommunity located within Sector L. Meteorological data indicates that Sector L has the highestcalculated X/Q at the site boundary. The new air sampling location was placed in service on06/14/16. The additional monitoring location will enhance the site's radiological environmentalmonitoring program, and will demonstrate robust compliance with the Offsite Dose CalculationManual requirements. Laboratory analytical data indicates 1-131 and Gross Beta activity levelsare similar for samples collected from AS-20 and the existing control location AS-3.
Attachments
Attachment 1 contains results of TLD, air, water, sediment, fish, food products and specialsamples collected in the reporting period. TLDs were analyzed by Stanford Dosimetry ofSterling, MA. Other samples were analyzed by Teledyne Brown Engineering of Knoxville, TN.Tables A 9.1 and A 9.2 includes results from Stanford Dosimetry's and Teledyne BrownEngineering's participation in interlaboratory comparison programs.
9
JAR - ;'!i~a . "' %.; ..

1.0 Introduction
1.1 Radiological Environmental Monitoring Program
GGNS established the REMP to ensure that plant operating controls properlyfunction to minimize any radiation that could endanger human health or theenvironment. The REMP is designed to:
• Analyze important pathways for anticipated types and quantities ofradionuclides released into the environment,
• Consider the possibility of a buildup of long-lived radionuclides in theenvironment and identify any physical and biological accumulations that maycontribute to human exposures,
• Consider the potential radiation exposure to plant and animal life in theenvironment surrounding GGNS,
• Correlate levels of radiation and radioactivity in the environment withradioactive releases from the operation of GGNS.
1.2 Pathways Monitored
The airborne, direct radiation, waterborne and ingestion pathways, as seen inFigure 1-1 are monitored as required by the GGNS aDCM Table 6.12.1-1. Adescription of the GGNS REMP utilized to monitor the exposure pathways isprovided in Table 1.2 and shown in Figures 1-2 and 1-3. GGNS may supplementthis program with additional sampling in order to provide a comprehensive andwell-balanced program.
Section 2.0 of this report provides a discussion of sampling results, with Section 3.0providing a summary of results for the monitored exposure pathways.
1.3 Land Use Census
GGNS personnel conduct a biennial land use census, as required by aDCMSpecification 6.12.2. The most recent land use census data are included inTable 2.1. The purpose of this census is to identify land use changes within each ofthe 16 meteorological sectors and within a 5-mile radius of GGNS that wouldrequire modifications to the REMP or the aDCM.
GGNS personnel conduct the land use census by:
• Conducting field surveys.
• Identifying locations on maps and aerial photographs and measuringdistances to GGNS
• Comparing current land use census results to results from the previouscensus
• Contacting the Claiborne County Agent for verification of nearest dairyanimals
10
2·

No significant changes were identified between the biennial land use censusperformed in 2014 and the most recent census performed in 2016 that wouldrequire modifications to the REMP or the ODeM.
11
b·~fi·· rii&i· ¥-- jl • - &lid'
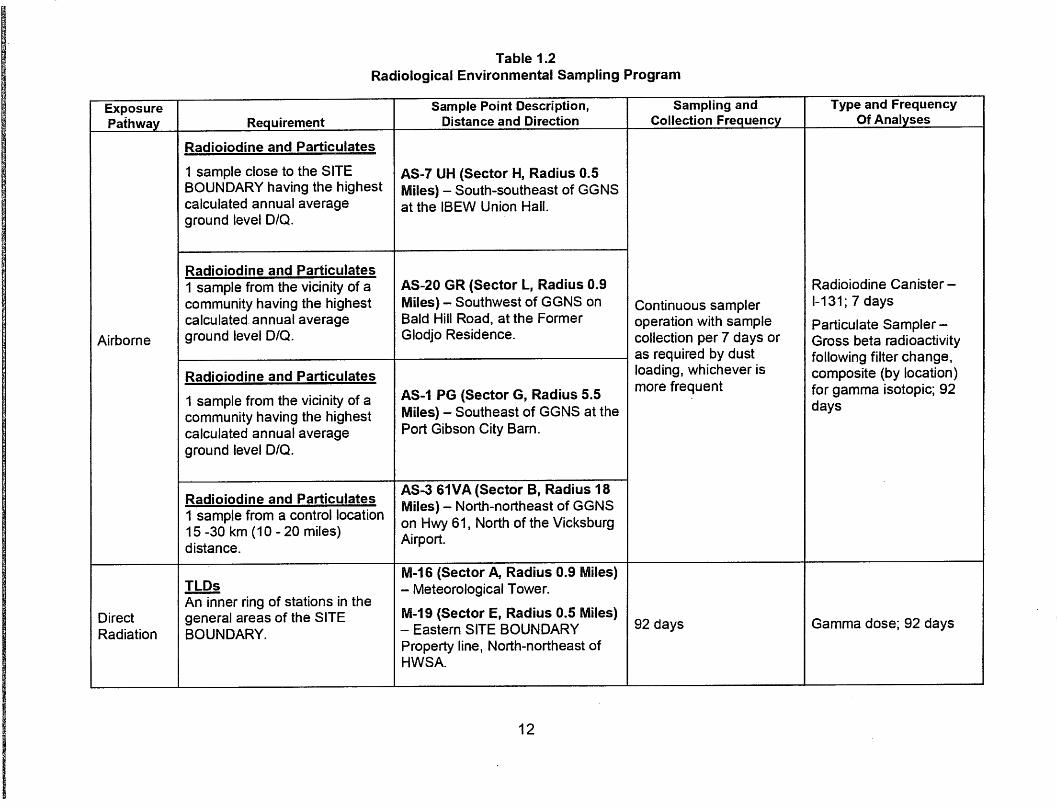
Table 1.2Radiological Environmental Sampling Program
Exposure Sample Point Description, Sampling and Type and Frequency
Pathway Requirement Distance and Direction Collection Frequency Of Analyses
Radioiodine and Particulates
1 sample close to the SITE AS-7 UH (Sector H, Radius 0.5BOUNDARY having the highest Miles) - South-southeast of GGNScalculated annual average at the IBEW Union Hall.ground level D/Q.
Radioiodine and Particulates1 sample from the vicinity of a AS-20 GR (Sector l, Radius 0.9 Radioiodine Canister-community having the highest Miles) - Southwest of GGNS on Continuous sampler 1-131; 7 dayscalculated. annual average Bald Hill Road, at the Former operation with sample Particulate Sampler-
Airborne ground level D/Q. Glodjo Residence. collection per 7 days or Gross beta radioactivityas required by dust following filter change,
Radioiodine and Particulates loading, whichever is composite (by location)
1 sample from the vicinity of a AS-1 PG (Sector G, Radius 5.5more frequent for gamma isotopic; 92
community having the highest Miles) - Southeast of GGNS at the days
calculated annual average Port Gibson City Bam.
ground level D/Q.
Radioiodine and ParticulatesAS-3 61VA (Sector B, Radius 18
1 sample from a control locationMiles) - North-northeast of GGNS
15 -30 km (10 - 20 miles)on Hwy 61, North of the Vicksburg
distance.Airport.
TlDsM-16 (Sector A, Radius 0.9 Miles)- Meteorological Tower.
An inner ring of stations in theDirect general areas of the SITE M-19 (Sector E, Radius 0.5 Miles)
92 days Gamma dose; 92 daysRadiation BOUNDARY. - Eastern SITE BOUNDARY
Property line, North-northeast ofHWSA.
12

Table 1.2Radiological Environmental Sampling Program
Exposure Sample Point Description, Sampling and Type and FrequencyPathway Requirement Distance and Direction Collection Frequency Of Analyses
M-21 (Sector J, Radius 0.4 Miles) -~,_
Near Former Training Center Buildingon Bald Hill Road.
M-22 (Sector G, Radius 0.5 Miles) -Former RR Entrance Crossing On BaldHill Road.
TLDs M-23 (Sector Q, Radius 0.5 Miles)-Direct
An inner ring of stations in the Gin Lake Road 50 Yards North ofRadiation
general areas of the SITE Heavy Haul Road on Power Pole.92 days Gamma dose; 92 days
BOUNDARY.M-25 (Sector N, Radius 1.6 Mfles) -Radial Well Number 1.
M-28 (Sector L, Radius 0.9 Miles) -Bald Hill Road.
M-94 (Sector R, Radius 0.8 Miles)-Sector R Near Meteorological Tower.
13

Table 1.2Radiological Environmental Sampling Program
Sampling and
Exposure Sample Point Description, Collection Type and Frequency
Pathway Requirement Distance and Direction Frequency Of Analvses
M-95 (Sector F, Radius 0.5 mil - SpoilsArea, fence of old storage area, nearentrance gate
M-96 (Sector S, Radius 0.7 mi.) - NorthGate Fence
TlOs M-97 (Sector 0, Radius 0.8 mi.) - Grand
DirectAn inner ring of stations in the Gulf Road entrance gate to spoils area
Radiationgeneral areas of the SITE M-98 (Sector H, Radius 0.5 mi.) - Ba1d
92 days Gamma dose; 92 days
BOUNDARY. Hill Road, across from Union Hall, incurve
M-99 (Sector K, Radius 0.4 mi.) - NorthFence of old Ball Field near utility pole
M-100 (Sector C, Radius 0.6 mi.)-Grand Gulf Road
TlOs M-36 (Sector P, Radius 5.0 Miles) -
An outer ring approximately 3 toCurve on HW 608. Point Nearest GGNS
5 miles from the site.at Power Pole.
M-40 (Sector M, Radius 2.3 Miles)-Headly Drive. Near River Port Entrance.
14

~i
Table 1.2Radiological Environmental Sampling Program
Exposure Sample Point Description, Sampling and Type and Frequency
Pathway Requirement Distance and Direction Collection Frequency Of Analyses
TLDs M-48 (Sector K, Radius 4.8 Miles)-
An outer ring approximately 30.4 Miles South on Mont Gomer Road
to 5 miles from the site.on West Side.
M-49 (Sector H, Radius 4.5 Miles) -Fork in Bessie Weathers Road/ShaiferRoad.
M-50 (Sector B, Radius 5.3 Miles)-Panola Hunting Club Entrance.
M-55 (Sector 0, Radius 5.0 Miles)-Near Ingelside Kamac FerryRoad/Ashland Road Intersection.
M-57 (Sector F, Radius 4.5 Miles)-
Direct Hwy 61,Behind the Welcome to Port
Radiation Gibson Sign at Glensdale Subdivision. 92 days Gamma dose; 92 days
TLDs M-01 (Sector E, Radius 3.5 Miles)-
8 stations in special interestAcross the road from Lake Claibome
areas such as populationEntry Gate. (Special Interest)
centers, nearby residences, M-07 (Sector G, Radius 5.5 Miles) -schools, and in 1 or 2 areas to AS-1 PG. Port Gibson City Bam.serve as control stations. (Special Interest)
M-09 (Sector 0, Radius 3.5 Miles) -Warner Tully V-Camp. (Special Interest)
M-10 (Sector A, Radius 1.5 Miles)-Grand Gulf Military Park. (SpecialInterest)
15

Table 1.2Radiological Environmental Sampling Program
Exposure Sample Point Description, Sampling and Type and FrequencyPathway Requirement Distance and Direction Collection Frequency Of Analyses
M-14 (Sector B, Radius 18.0 Miles)- AS-3-61 VA, Hwy 61, North ofVicksburg Airport. (Control)
TLDsM-33 (Sector P, Radius 12.5 Miles)- Newellton, Louisiana Water Tower.
8 stations in special interest (Special Interest)Direct areas such as population M-38 (Sector M, Radius 9.5 Miles)- 92 days Gamma dose; 92 daysRadiation centers, nearby residences, Lake Bruin State Park, Entrance
schools, and in 1 or 2 areas to Road. (Special Interest)serve as control stations
M-39 (Sector M, Radius 13.0 Miles)- S1. Joseph, Louisiana, AuxiliaryWater Tank. (Special Interest)
16

Table 1.2Radiological Environmental Sampling Program
Sampling andExposure Sample Point Description, Collection Type and FrequencyPathway Requirement Distance and Direction frequency Of Analyses
Surface Water MRUP (Sector R, Radius 1.8 Miles) - At 92 days Gamma isotopic and
1 sample upstream. least 4500 ft upstream of the GGNS tritium analyses; 92discharge point into the Mississippi River to days
1 sample downstream. allow adequate mixing of the Mississippiand Big Black Rivers.
MRDOWN (Sector -N, Radiusf B Miles) -At least 5000 ft downstream of the GGNSdischarge point in the Mississippi River nearRadial Well NO.1.
Waterborne
MRDOWN (Sector P, Radius 1.3 Miles)- 366 days Gamma isotopic and1 sample downstream during a Downstream of the GGNS discharge point tritium analyses; 366Liquid Radwaste Discharge. in the Mississippi River near Radial Well No. days
1 sample from Outfall 007 5.
OUTfALL 007 (Sector N, Radius 0.2 31 days Tritium; 31 daysMiles) - Storm Drain System
17

Table 1.2Radiological Environmental Sampling Program
Exposure Sample Point Description, Sampling and Type and FrequencyPathway Requirement Distance and Direction Collection Frequency Of Analyses
PGWELL (Sector G, Radius 5.0Miles) - Port Gibson Wells - Takenfrom distribution system or one of
Groundwater the five wells.
Samples from 2 sources. CONSTWELL (Sector Q, Radius 366 daysGamma isotopic andtritium analyses; 366 days
0.4 Miles) - GGNS ConstructionWater Well- Taken from distributionsystem or the wel/.
WaterborneSEDHAM (Sector N, Radius 1.6
Sediment From Shoreline Miles) - Downstream of the GGNS
1 sample from downstream discharqe point in the Mississippi
area. River near Hamilton Lake outlet.
1 sample from upstream area. SEDCONT (Minimum of 100 yds) -366 days Gamma isotopic; 366 days
Upstream of the GGNS dischargepoint in the Mississippi River.
Milk1 sample from milkinganimals within 8 km (5 miles)if milk is available
Ingestion commercial/y. Currently, no available milking92 days when required Gamma isotopic and 1-
animals within 8 km of GGNS. 131; 92 days1 control sample (only ifindicator exists) >8 km if milkis available.
18

Table 1.2Radiological Environmental Sampling Program
Exposure Sample Point Description, Sampling and Type and FrequencyPathway Requirement Distance and Direction Collection Frequency Of Analyses
FISHDOWN - Downstream of theFish GGNS discharge point into the1 sample in vicinity of GGNS Mississippi Riverdischarge point. FISHUP - Upstream of the GGNS
366 daysGamma isotopic on edible
1 sample uninfluenced by discharge point into the Mississippi portion; 366 days
GGNS discharge. River uninfluenced by plantoperations.
Food Products _c
Ingestion 1 sample of broad leaf VEG-J (Sector J, Radius 0.4 Miles)vegetation grown in one of two - South of GGNS near formerdifferent offsite locations with Training Center on Bald Hill Road.highest anticipated annual VEG-CONT (Sector K, Radius 10.5 Gamma isotopic and 1-average ground level D/Q if
Miles) - Alcorn State University 92 days when availablemilk sampling is not performed.
south-southwest of GGNS when131; 92 days
1 sample of similar vegetation available, otherwise a location 15-30grown 15 - 30 km distant if km distant.milk sampling is not performed.
19

Figure 1·1
Exposure Pathways
20

C..JWu:~WZI
tJ)NWII-~-WtJ)C::Z::::JOC)_I-LL(,)
W..J..JooW..Ja.::ltn
~
ji i I), :I
~
tJJ1 j~ I
C])i II ~s:
c:r)
~JG~ a;
~;....
i l~ljJI~I~ sit ~
I~it2
.,..
1;1 !
\.00<1800*$ I
.~ 2£SJ
'" ....
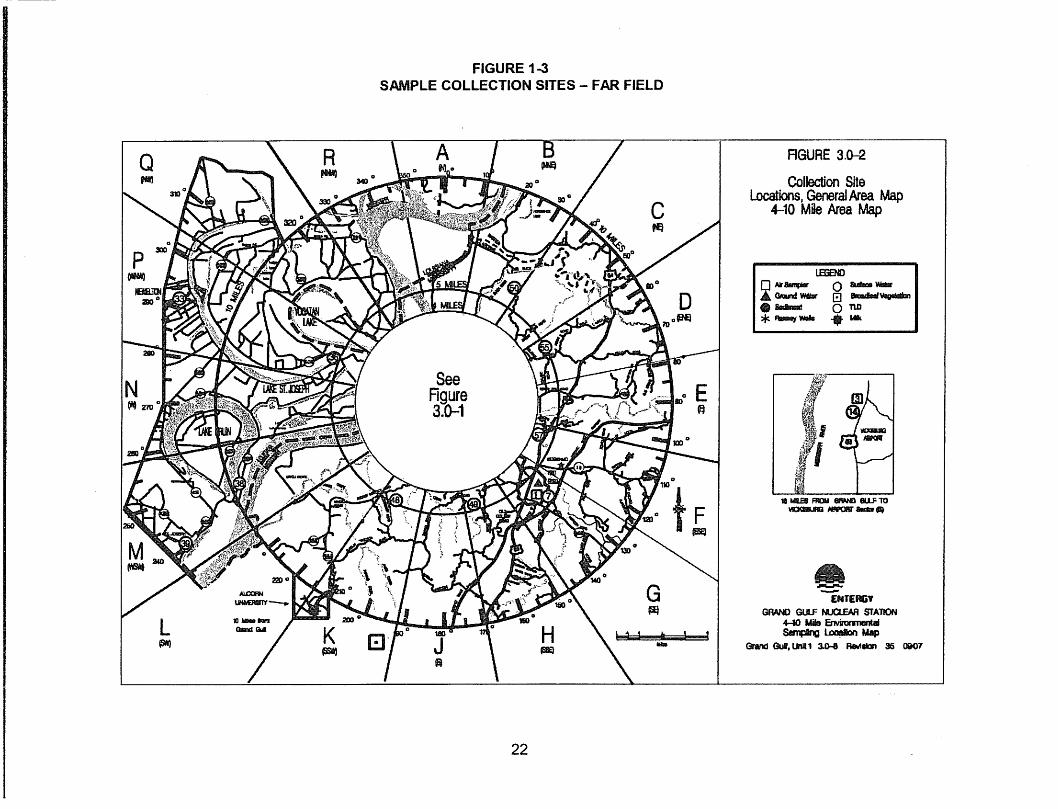
FIGURE 1-3SAMPLE COLLECTION SITES - FAR FIELD
11MIBS FROM EIfWIl ew:10~H!JfI'OIlfla.:a",*
LmENOo ,..8In;i8r 0 &dial WIIlIrA ClIlIrd WiI8r El 8mdlelllVIgI6Idbl
• 8IIflI..t 0 no*"-'t WlIII ....
RGURE 3.D-2
Collection SheLocations, General Area Map
4-10 Mile Area Map
E~
D
G-..-EHTERGY
(lit GRMlD GUlF WQ.EAR STAlION
L m~~naAI - gfD 'II!,- llIU \111 4-10 UiIe ErMrormentaI
O8IdW K t, 1 ~ l.OlllIdIon Map180
Q H~ .1 ~ .. Gnnl GuI.UnIt 1 3.G-8 RtwIIion 35 (»()7
Q".,
N
22

2.0 Interpretation and Trends of Results
2.1 Air Particulate and Radioiodine Sample Results
GGNS did not detect any plant related gamma emitting radionuclides in the quarterly airparticulate composites.
. The REMP had previously detected airborne radioactivity attributable to other sourcesin this pathway. These sources include the Chinese nuclear test in 1980 and theaccident at the Chemobyl Nuclear Power Plant in 1986. The GGNS REMP detectedradioactivity released from the Fukushima Dai-ichi Nuclear Power Plant following theMarch 11, 2011, Tohoku earthquake. No radioiodine was detected in 2016.
Table 3.1, which also includes gross beta activity, provides a comparison of theindicator and control means and ranges, further emphasizing that the airborne pathwayremains at background levels. In the absence of plant-related gamma radionuclides,gross beta activity is attributed to naturally occurring radionuclides. Similar trends arepresent for control and indicator locations, which support the presence of naturallyoccurring radioactivity.
2.2 Thermoluminescent Dosimetry Sample Results
GGNS calculates dose by subtracting shield readings from control and indicatorlocation readings and reports measured dose as net exposure, normalized to 92 days.GGNS relies on the comparison of the indicator locations to the control location as anindication of plant impact. Gamma radiation dose in the reporting period is compared tocontrol location readings for previous years as shown in Figure 2~1.
The comparison of the indicator results to the control, and to previous indicator results,as seen in Figure 2-1 and Table 3.1, indicates that plant operation has had nosignificant impact on ambient radiation levels during the reporting period.
In previous years, TLD locations M-21 (Sector J, 0.4 miles), M-98 (Sector H, 0.5 miles),and M-99 (Sector K, 0.4 miles) were above background. The dose rates at these threelocations were the result of Nitrogen-16 (N-16) associated with the injection ofhydrogen and subsequent N-16 production. Hydrogen injection into the feedwatersystem provides protection against Intergranular Stress Corrosion of plant components.Since November 2010, the hydrogen injection rate has been reduced and the doserates at TLD locations M-21, M-98, and M-99 have returned to near background levels.
23
LIiIZl&t2&. k .• ~~ * : . SH

Figure 2-1
2011·2015ControlLocationMinimum(-2 Stdev)
2011-2015ControlLoCationMaximum(+2 Stdev)
x
x4Q16
x x
x X Ii.
/1PJ/10
~ ~
C:l.3Q16
2016 TLO Readings
xX Ax
o
••
X
A
~[J
•ti x xo C Ii...
.1Q16 o2Q16
xA X X /1 lS
Ii. XA X X I:][J • A
~. ~[J [J A.. 0a ~.
I
II mRlqtr
120.0 ~------------------------....,
1
ii\16.0
Iii
!12.0jI
\8.0III
[4.0iiI
10
.0
iL __
2.3 Water Sample Results
Surface water samples were collected from three indicator locations (Outfall 007,MRDOWN, and MRDOWN During Discharge) and one control location (MRUP) andanalyzed for gamma emitting radionuclides and tritium. Plant related gamma emittingradionuclides and tritium remained undetectable in the upstream and downstreamMississippi River locations, which is consistent with preoperational and previousoperational years. Storm waters contribute to Outfall 007 and can include tritium as aresult of washout and entrainment of normal, previously monitored gaseous effluents.As a result, tritium is occasionally observed. Tritium was measured during January(2100 ± 537 pCi/L) and August (698 ± 195 pCi/L) at the Outfall 007 (indicator) location.Tritium was not observed in the remaining Outfall 007 samples collected during 2016.
In addition to the tritium samples required by the REMP, four special surface watersamples for gamma emitting radionuclides were collected at the Outfall 007 location(Table A 8.1). Plant related gamma emitting radionuclides remained undetectable inthese samples.
Based on review of results and historical data, plant operations had no significantimpact on this pathway during the reporting period.
Groundwater samples were collected from two locations (indicator and control) andanalyzed for gamma emitting radionuclides and tritium (Tables A 4.1 and A 4.2). Inaddition to the samples required by the REMP, an extra sample from the locations wasanalyzed for lodine-131 (Table A 4.3). GGNS did not detect any plant related gammaemitting radionuclides or tritium in groundwater samples during the reporting period.
24
M"W
Based on review of results and historical data, plant operations had no significantimpact on this pathway during the reporting period.
2.4 Sediment Sample Results
Sediment samples were collected from two locations (indicator and control) andanalyzed for gamma emitting radionuclides. GGNS did not detect any plant relatedgamma emitting radionuclides in sediment samples during the reporting period.
Based on review of results and historical data, plant operations had no significantimpact on this pathway during the reporting period.
2.5 Milk Sample ResuIts
Milk samples were not collected within five miles of the site in the reporting period dueto the absence of milking animals. Since there are no dairies within five miles of GGNS,and based on non-detectable radioiodine and gamma radionuclides in air andvegetation samples, plant operations had no impact on this pathway during thereporting period.
2.6 Fish Sample Results
Fish samples were collected from two locations (indicator and control) and analyzed forgamma emitting radionuclides. GGNS did not detect any plant related gamma emittingradionuclides in fish samples (edible portions) during the reporting period, as has beenthe case in preoperational and previous operational years. These results indicate thatthis pathway has not been affected by plant operations.
2.7 Food Product (Vegetation) Sample Results
Food product samples were collected from two locations (indicator and control) andanalyzed for lodine-131 and gamma emitting radionuclides. GGNS did not detect anyplant related lodine-131 or gamma emitting radionuclides in vegetation samples duringthe reporting period. These results indicate that this pathway has not been affected byplant operations. .
2.8 Land Use Census Results
Results from the most recent Land Use Census performed in 2016 are included in thisreport. Methods utilized to perform the Land Use Census include: visual surveys, doorto door surveys, telephone interviews, Global Positioning System (GPS), AerialPhotography, and consultation with the local county agent concerning dairy productionin Claiborne County.
During the survey the following information was obtained:
1) nearest location of occupied and unoccupied residences2) nearest location of dairy production3) nearest location of gardens
25
.. :&Hft4&·Aitg¥

Changes from the previous Land Use Census were evaluated in accordance withGGNS surveillance "Land Use Census", 06-EN-5000-0-0002. The differences werecompared to the locations and assumptions used in calculations for compliance withthe ODCM Limiting Condition for Operation 6.11.6 and 6.12.2. The locations andassumptions currently used in the ODCM were determined to be more conservativethan any of the changes. Determinations from the most recent Land Use Censusresults are:
• Because of downwind location and/or distance from the site, in no case will theoccupancy of an existing unoccupied residence cause any existing ODCMcritical receptor calculation results to be less conservative.
• No additional sampling locations are required as the onsite vegetation samplinglocation (Sector J, 0.4 miles) is more conservative than changes identified in theland use census.
• Cattle are raised for human consumption (most notably in Sectors F, H, J, andK). GGNS uses the Grass/Cow/Meat pathway.
• The milk pathway does not need to be activated because no commercial dairyproduction is occurring within 5 miles, as referenced by ODCM Table 6.12.1-1.
• Sectors M, N, P, and Q are remote areas in which the primary use is hunting.Areas were surveyed by vehicle, aerial photographs, and interviews.
• Gardens, regardless of size, were included in the census data
26

Table 2.12016 Land Use Census
Parameter Sector A* Sector B Sector C* Sector D*
I. Nearest Occupied a. Distance (mile) 1.02 1.51 0.70 2.60Residence b. Degrees from true north 355.4 23.7 42.3 60.8
.II. Nearest Unoccupied a. Distance (mile) 0.94 0.83 None None
Residence (closer b. Degrees from true north 8.0 15.1than occupiedresidence)
III. Nearest Milk Animal a. Distance None None None None
IV. Nearest Broadleaf a. Distance (mile) 1.02 1.52 4.14 4.50Garden b. Garden size (ft2) ~ 400 :::::4050 ::::: 100 ::::: 2000
c. Degrees from true north 355.4 21.9 47.6 64.8
V. Census Comparison a. Is nearest occupied No Yes Yes Yesresidence in samelocation as last census?
b. Is nearest milk animal in N/A N/A N/A N/Asame location as lastcensus?
c. Is nearest broadleaf Yes' Yes' No Nogarden in same location aslast census?
1 Retained previous garden location. Located no other gardens in the sector.
* Change from tast census. See table of Land Use Census Changes
27

Table 2.12016 Land Use Census, continued.
Parameter Sector E* Sector F* Sector G Sector H*
I. Nearest Occupied a. Distance (miles) 0.83 2.25 3.72 1.10Residence b. Degrees from true north 94.5 101.3 134.1 151.4
II. Nearest Unoccupied a. Distance (miles) None None 3.71 1.07Residence (closer b. Degrees from true north 131.8 151.0than occupiedresidence)
III. Nearest Milk Animal a. Distance None None None None
IV. Nearest Broadleaf a. Distance (miles) 0.89 4.49 4.20 4.31Garden b. Garden size (ft2) ;::: 1000 :::::400 ;::: 1600 ;:::200
c. Degrees from true north 86.9 113.5 130.1 146.6
V. Census Comparison a. Is nearest occupied No Yes Yes Yesresidence in samelocation as last census?
b. Is nearest milk animal in N/A N/A N/A N/Asame location as lastcensus?
c. Is nearest broadleaf garden Yes No Yes Noin same location as lastcensus?
* - Change from last census. See table of Land Use Census Changes
28
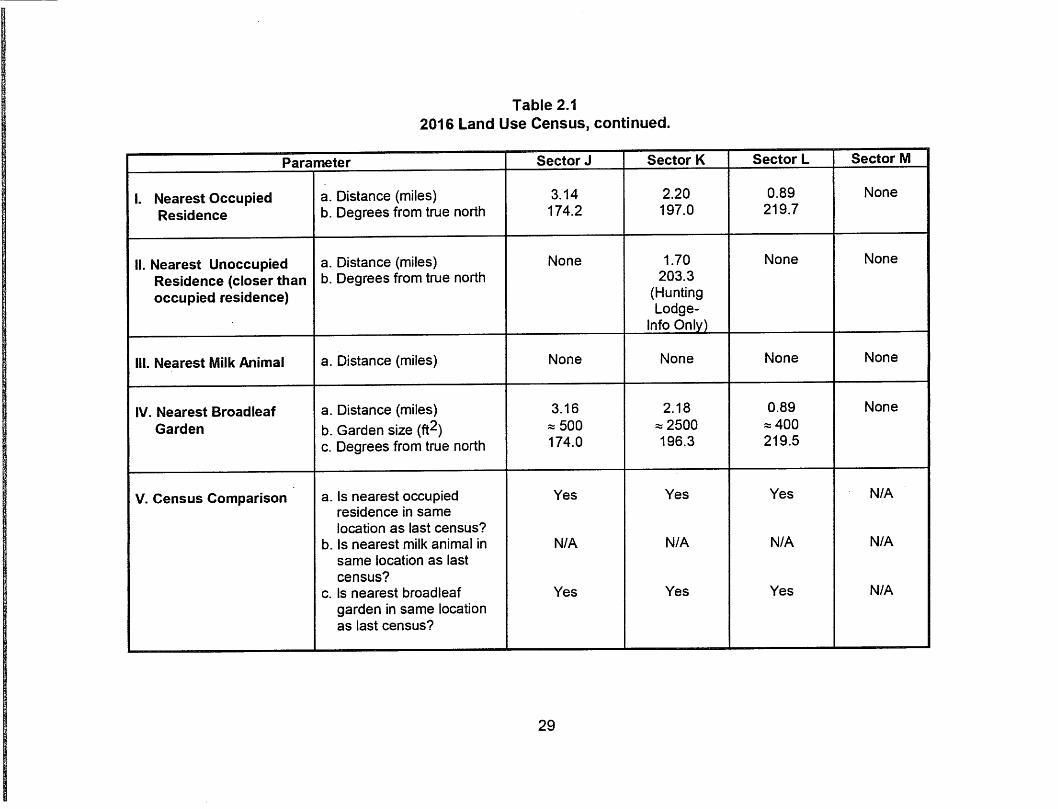
Table 2.12016 Land Use Census, continued.
Parameter Sector J Sector K Sector L Sector M
I. Nearest Occupied a. Distance (miles) 3.14 2.20 0.89 NoneResidence b. Degrees from true north 174.2 197.0 219.7
II. Nearest Unoccupied a. Distance (miles) None 1.70 None NoneResidence (closer than b. Degrees from true north 203.3occupied residence) (Hunting
Lodge-Info Only)
III. Nearest Milk Animal a. Distance (miles) None None None None
IV. Nearest Broadleaf a. Distance (miles) 3.16 2.18 0.89 NoneGarden b. Garden size (ft2) ~ 500 ~ 2500 ~400
c. Degrees from true north 174.0 196.3 219.5
V. Census Comparison a. Is nearest occupied Yes Yes Yes N/Aresidence in samelocation as last census?
b. Is nearest milk animal in N/A N/A N/A N/Asame location as lastcensus?
c. Is nearest broadleaf Yes Yes Yes N/Agarden in same locationas last census?
29

Table 2.12016 Land Use Census, continued.
Parameter Sector N Sector P Sector Q Sector R*
I. Nearest Occupied a. Distance (miles) None None None 1.44Residence b. Degrees from true north 348.4
II. Nearest Unoccupied a. Distance (miles) None None None 1.11Residence (closer b. Degrees from true north 346.1than occupiedresidence)
III. Nearest Milk Animal a. Distance (miles) None None None None
IV. Nearest Broadleaf a. Distance (miles) None None None NoneGarden b. Garden size (ft2)
c. Degrees from true north
V. Census Comparison a. Is nearest occupied N/A N/A N/A Noresidence in samelocation as last census?
b. Is nearest milk animal in N/A N/A N/A N/Asame location as lastcensus?
c. Is nearest broadleaf N/A N/A N/A N/Agarden in same location aslast census?
* - Change from last census. See table of Land Use Census Changes
30

2016 land Use Census Changes
SECTOR PARAMETER Reason for Change
A Nearest Occupied Residence New nearest occupied residence identified in 2016.
C Nearest Broadleaf Garden New nearest garden location identified in 2016.
D Nearest Broadleaf GardenGarden location identified in 2014 census no longer active. New
nearest garden location identified in 2016.
E Nearest Occupied Residence New nearest occupied residence identified in 2016.
F Nearest Broadleaf Garden New nearest garden location identified in 2016.
H Nearest Broadleaf Garden New nearest garden location identified in 2016.
R Nearest Occupied Residence Nearest occupied residence from 2014 census no longer occupied.New nearest occupied residence identified in 2016.
31

2.9 Interlaboratory Comparison Results
Stanford Dosimetry Company analyzed interlaboratory comparisonthermoluminescent dosimeters to fulfill the requirements of aDCM Specification6.12.1. The results are shown in Table A.9.1.
GEL Laboratories analyzed interlaboratory comparison samples to fulfill therequirements of aDCM Specification 6.12.1. The results are shown in Table A.9.2.
32
k$'IO@¥iiA·· €#B¥Wi-$-¥··46·++iHi%#-'¥§-- ¥ij -- '7'"' ffii&4H¥d- .$$ Pb4##-···,ffi - 49 . ¥ M *"~ ·w .,. d -4 '". ·P.·EJ(..·:· "JoWit
3.0 Radiological Environmental Monitoring Program Summary
3.1 Program Results Summary
Table 3.1 summarizes the REMP results. Values reported as less than the lowerlimit of detection «LLD) were not used when determining ranges and means forindicator and control locations.
I
ie§?¥¥i§!i4f¥-¥"k -¥¥A -- ih-f,,!,U ... ¥i¥#&¥#·;i¥·bP¥%#: dt§iM-¥€ ¥§ ~.. ,#; -f· &¥§
33

TABLE 3.1
Radiological Environmental Monitoring Program Summary
Name of Facility: Grand Gulf Nuclear Station Docket No: 50-416Location of Facility: Claiborne County, Mississippi Reporting Period: January - December 2016
Sample Type Type & Number LLD b Indicator Locations Location with Highest Annual Control Number of( Units) of Analyses a Mean ( F) c Mean Locations Nonroutine
[ Range] Mean (F) c Results e[Range]
Location dMean (F) c[Range]
Air Particulates GB 184 0.01 0.01742 (132/132) AS-20 GR 0.01839 (28/28) 0.01850 (52/52) 0
(pCi/m3 ) [0.00505 - 0.03690] (Sector L, 0.9 mi) [0.00674-0.03580] [0.00818-0.03530]
GS 15Cs-134 0.05 <LLD N/A N/A <LLD 0Cs-137 0.06 <LLD N/A N/A <LLD 0
Airborne Iodine 1-131 156 0.07 <LLD N/A N/A <LLD 0
(pCi/m3 )
Inner Ring TLDs Gamma 56 f 9.3 (56/56) M-99 11.5 (4/4) NlA 0(mRlQtr) [2.2 -12.6] (Sector J, 0.4 mi.) [10.2 - 12.5]
Outer Ring TLDs Gamma 27 f 9.3 (27/27) M-57 11.4 ( 4/4) N/A 0(mRlQtr) [3.5 -13.0] (Sector F, 4.5 mi.) [9.9 -12.5]
Special Interest Gamma 28 f 9.4 (28/28) M-01 11.3 (4/4) N/A 0TLDs [7.1 - 13.2] (Sector E, 3.5 [9.6 -13.2]
( mRlQtr) mi.)
Control TLDs Gamma 4 f N/A N/A N/A 10.7 (4/4) 0(mRlQtr) [9.0 -12.3]
34

TABLE 3.1
Radiological Environmental Monitoring Program Summary
Name of Facility: Grand Gulf Nuclear Station Docket No: 50-416location of Facility: Claiborne County, Mississippi Reporting Period: January - December 2016
Sample Type Type & Number LLOb Indicator Location Location with Highest Annual Mean Control Number of( Units) of Analyses a Mean ( F) c Locations Nonroutine
[Range] Mean (F) c Results e[Range]
Location dMean (F) c[RanQe]
Surface Water H-3 32 3000 1399(2/26) Outfall 007 1399 (2126) <LLD 0( pCill ) [698 - 2100] (SectorN, Radius 0.2 mi.) [698 - 2100]
GS 14Mn-54 15 <LLD N/A N/A <LLD 0Co-58 15 <LLD N/A N/A <LLD 0Fe-59 30 <LLD N/A N/A <LLD 0Co-60 15 <LLD N/A N/A <LLD 0Zn-65 30 <LLD NJA N/A <LLD 0Nb-95 15 <LLD N/A N/A <LLD 0Zr-95 30 <LLD N/A N/A <LLD 01-131 15 <LLD NJA N/A <LLD 0
Cs-134 15 <LLD N/A N/A <LLD 0Cs-137 18 <LLD N/A N/A <LLD 08a-140 60 <LLD N/A N/A <LLD 0La-140 15 I <LLD NJA N/A <LLD 0
35

TABLE 3.1
Radiological Environmental Monitoring Program Summary
Name of Facility: Grand Gulf Nuclear Station Docket No: 50-416Location of Facility: Claiborne County, Mississippi Reporting Period: January - December 2016
Sample Type Type & LLOb Indicator Locations Location with Highest Annual Mean Control Number of( Units) Number Mean (F) c Locations Nonroutine
of Analyses a [Range] Mean ( F) c Results e[Range]
Location dMean (F) c[Range]
Groundwater H-3 6 2000 <LLD N/A N/A <LLD 0( pCi/1 )
1-131 3 1 <LLD N/A N/A <LLD 0
GS 3Mn-54 15 <LLD N/A N/A <LLD 0Co-58 15 <LLD N/A N/A <LLD 0Fe-59 30 <LLD N/A N/A <LLD 0Co-60 15 <LLD N/A N/A <LLD 0Zn-65 30 <LLD N/A N/A <LLD 0Nb-95 15 <LLD N/A N/A <LLD 0Zr-95 30 <LLD N/A N/A. <LLD 0
Cs-134 15 <LLD N/A N/A <LLD 0Cs-137 18 <LLD N/A N/A <LLD 08a-140 60 <LLD N/A N/A <LLD 0La-140 15 <LLD N/A N/A <LLD 0
Sediment GS 4(pCi/kg) Cs-134 150 <LLD N/A N/A <LLD 0
Cs-137 180 <LLD N/A N/A <LLD 0
36
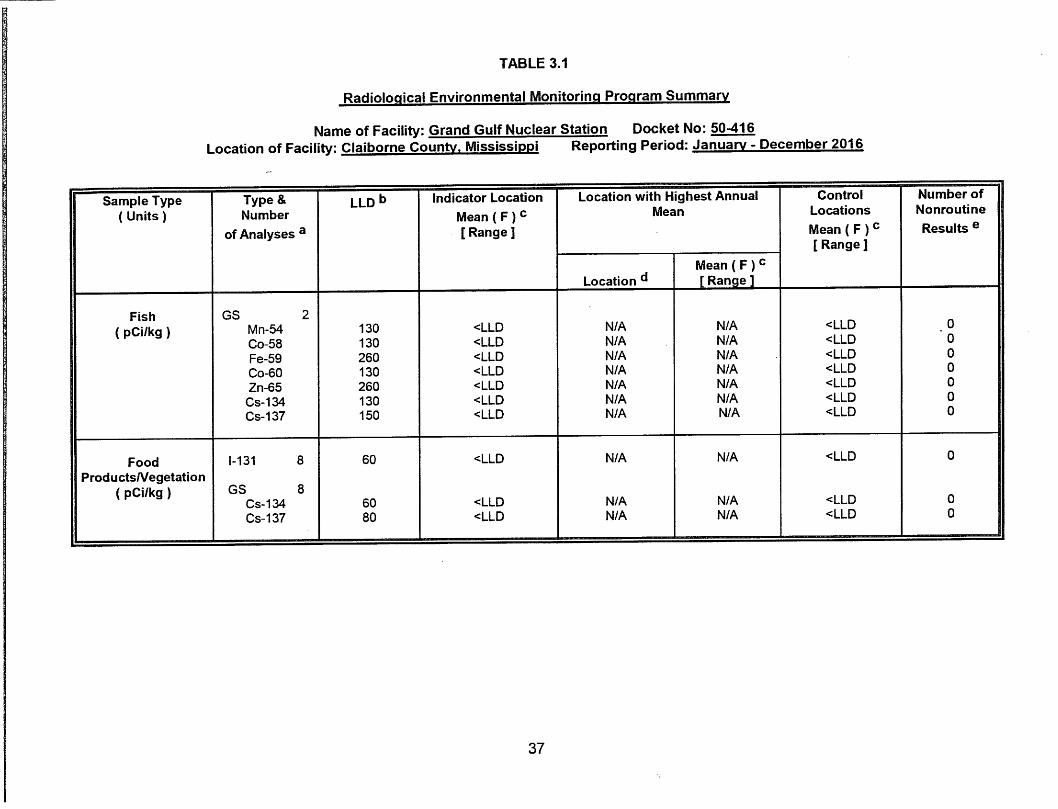
TABLE 3.1
Radiological Environmental Monitoring Program Summary
Name of Facility: Grand Gulf Nuclear Station Docket No: 50-416Location of Facility: Claiborne County, Mississippi Reporting Period: January - December 2016
Sample Type Type & LLD b Indicator Location Location with Highest Annual Control Number of( Units) Number Mean (F) c Mean Locations Nonroutine
of Analyses a [Range] Mean ( F) c Results e[Range]
Location dMean (F) c[Range]
Fish GS 2( pCi/kg ) Mn-54 130 <LLD N/A N/A <LLD 0
Co-58 130 <LLD N/A N/A <LLD 0Fe-59 260 <LLD N/A N/A <LLD 0Co-60 130 <LLD N/A N/A <LLD 0Zn-65 260 <LLD N/A N/A <LLD 0
Cs-134 130 <LLD N/A N/A <LLD 0Cs-137 150 <LLD N/A NJA <LLD 0
Food 1-131 8 60 <LLD N/A N/A <LLD 0ProductsNegetation
( pCi/kg ) GS 8Cs-134 60 <LLD N/A N/A <LLD aCs-137 80 <LLD N/A N/A <LLD 0
37

TABLE 3.1
Radiological Environmental Monitoring Program Summary
Name of Facility: Grand Gulf Nuclear Station Docket No: 50-416Location of Facility: Claiborne County. Mississippi Reporting Period: January - December 2016
Sample Type Type & Number LLDb Indicator Location Location with Highest Annual Control Number of( Units) of Analyses a Mean (F) C Mean Locations Nonroutine
[Range] Mean (F) c Results e
Mean (F) c [ Range 1Location d [Range]
Surface Water GS 5(Special) Mn-54 15 <LLD N/A N/A <LLD 0( pCi/1 ) Co-58 15 <LLD N/A N/A <LLD 0
Fe-59 30 <LLD N/A N/A <LLD 0Co-60 15 <LLD N/A N/A <LLD 0Zn-65 30 <LLD N/A N/A <LLD 0Nb-95 15 <LLD N/A N/A <LLD 0Zr-95 30 <LLD N/A N/A <LLD 01-131 15 <LLD N/A N/A <LLD 0
Cs-134 15 <LLD N/A N/A <LLD 0Cs-137 18 <LLD N/A N/A <LLD a8a-140 60 <LLD N/A N/A <LLD 0La-140 15 <LLD N/A N/A <LLD a
Meat GS 2(Special) Mn-54 130 <LLD N/A N/A <LLD 0( pCi/kg ) Co-58 130 <LLD N/A N/A <LLD a
Fe-59 260 <LLD N/A N/A <LLD aCo-60 130 <LLD N/A N/A <LLD 0Zn-65 260 <LLD N/A N/A <LLD 0Cs-134 130 <LLD N/A N/A <LLD 0Cs-137 150 <LLD N/A N/A <LLD 0
38

a GB =Gross beta; 1-131 =lodine-131; H-3 =Tritium; GS =Gamma scan.
b LLD =Required lower limit of detection based on aDeM Table 6.12.1-3.c Mean and range based upon detectable measurements only. Fraction of detectable measurements at specified locations is indicated in parenthesis (F).
d Where applicable, locations are specified by name, distance from reactor site and meteorological sector.e Non-routine results are those which exceed ten times the control station value. If no control station value is available, the result is considered non-routineif it exceeds ten times the preoperational value for the location.
f LLD is not defined in oocu Table 6.12.1-3.
39
.~·-·*¥#?+··-¥¥§ft4$~h4¥,..J.t··¥'·¥b·%¥-&#·--F g. ·k *AA-i§-~
Attachment 1
Radiological Monitoring Report
Summary of Monitoring Results
40

,··f· -·H···W . "#'@ & •
TABLE OF CONTENTS
TABLE A1.1 AIR PARTICULATE FILTER GROSS BETA ANDCHARCOAL CARTRIDGE AS-1 PG 42
TABLEA1.2 AIR PARTICULATE FILTER GROSS BETA ANDCHARCOAL CARTRIDGE AS-3 61VA 44
TABLEA1.3 AIR PARTICULATE FILTER GROSS BETA ANDCHARCOAL CARTRIDGE AS-7 UH 46
TABLEA1.4 AIR PARTICULATE FILTER GROSS BETA ANDCHARCOAL CARTRIDGE AS-20 GR 48
TABLEA1.5 AIR PARTICULATE FILTER GAMMA 49
TABLEA2.1 THERMOLUMINESCENT DOSIMETERS 50
TABLEA2.2 THERMOLUMINESCENT DOSIMETERS 51
TABLEA2.3 THERMOLUMINESCENT DOSIMETERS 51
TABLEA3.1 SURFACE WATER GAMMA 52
TABLE A3.2 SURFACE WATER TRITIUM 53
TABLEA4.1 GROUNDWATER GAMMA 54
TABLEA4.2 GROUNDWATER TRITIUM 55
TABLE A4.3 GROUNDWATER IODINE-131 56
TABLEA5.1 SEDIMENT 57
TABLEA6.1 FISH 58
TABLEA7.1 FOOD PRODUCTS 59
TABLEA8.1 SPECIAL SAMPLES 60
TABLEA9.1 INTERLABORATORY PROGRAM - TLDS (14 PAGES)
TABLEA9.2 INTERLABORATORY PROGRAMS - SAMPLES (7 PAGES)
41
-" $ -. . ~. # iii-, $-

#..
Table A1.1
Sample Type: Air Particulate Filter and Radioiodine Cartridge
Analysis: Gross Beta and 1-131
Units: pCi/m3
AIR SAMPLE AS-1 PG
LLD (pCi/m3) 0.07 0.01
LAB 10 START DATE END DATE 1-131 GROSS BETA
L66432-1/4 12129/15 01105/16 <0.04632 0.02550 ±0.00396
L66463-1/4 01/05/16 01112116 <0.04171 0.01340 +0.00307
L66587-1/4 01/12116 01/19/16 <0.05486 0.03120 ±0.00440
L66635-1/4 01/19/16 01/26/16 <0.03432 0.01510 ±0.00326
L66726-1/4 01/26/16 02102116 <0.04757 0.02080 ±0.00364
L66829-1/4 02/02116 02109/16 <0.04666 0.01240 ±0.00317
L66915-1/4 02/09/16 02116116 <0.04686 0.01720 ±0.00335
L66990-1/4 02116/16 02/23/16 <0.02744 0.01290 ±0.00315
L67081-1/4 02123/16 03/01/16 <0.06706 0.01420 +0.00322
L67163-1/4 03/01/16 03108/16 <0.04461 0.01700 ±0.00336
L67243-114 03/08/16 03/15/16 <0.03015 0.00639 ±0.00248
L67320-1/4 03/15/16 03/22116 <0.05916 0.01140 ±0.00313
L67366-1/4 03/22116 03/29/16 <0.05953 0.01290 ±0.00314
L6748Q-1/4 03/29/16 04/05/16 <0.05518 0.01790 ±0.00348
L67589-1/4 04/05/16 04/12116 <0.06881 0.01370 ±0.00305
L67683-1/4 04/12116 04/19/16 <0.04587 0.00975 ±0.00277
L67804-1/4 04/19/16 04/26/16 <0.04239 0.01200 ±0.00310
L67933-1/4 04/26/16 05103/16 <0.03376 0.01430 ±0.00330
L68039-1/4 05103/16 05/10/16 <0.05523 0.01460 ±0.00322
L68137-1/4 05/10/16 05/17/16 <0.01381 0.01820 ±0.00325
L68240-1/4 05/17/16 OS/24/16 <0.05851 0.02030 ±0.00360
L68307-1/4 OS/24/16 05/31/16 <0.06813 0.01500 ±0.00324
L68396-1/4 05/31/16 06/07/16 <0.06309 0.01170 ±0.00312
L68496-1/5 06/07/16 06/14/16 <0.04911 0.01270 ±0.00313
L68572-1/5 06/14/16 06/21/16 <0.03603 0.01800 ±0.00331
L68711-1/5 06/21/16 06/28/16 <0.04312 0.01610 ±0.00339
L68749-1/5 06/28/16 07/05/16 <0.06806 0.01770 ±0.00352
L68844-1/5 07/05/16 07/12116 <0.05053 0.01200 ±0.00285
L68942-1/5 07/12116 07/19/16 <0.05381 0.01460 ±0.00317
L69076-1/5 07/19/16 07/26/16 <0.05179 0.01280 ±0.00307
L69194-1/5 07/26/16 08/02116 <0.04554 0.01030 ±0.00292
L69272-1/5 08/02116 08/09/16 <0.04339 0.01420 ±0.00319
L69363-1/5 08/09/16 08/16/16 <0.04136 0.00826 ±0.00276
L69443-1/5 08/16/16 08/23/16 <0.04012 0.00902 ±0.00268
L69544-1/5 08/23/16 08/30/16 <0.06753 0.01610 ±0.00333
42
mi&biJ §

Table A1.1
Sample Type: Air Particulate Filter and Radioiodine Cartridge
Analysis: Gross Beta and 1-131
Units: pCi/m3
AIR SAMPLE AS-1 PO
LLD (pCi/m3) 0.07 0.01
LABID STARTDATE END DATE 1-131 GROSS BETA
L69615-1/5 08/30/16 09/06/16 <0.01821 0.02030 ±0.00364
L69726-1/5 09/06/16 09/13/16 <0.05677 0.01080 ±0.00285
L69883-1/5 09/13/16 09/20/16 <0.03610 0.00793 ±0.00268
L69934-1/5 09/20/16 09/27/16 <0.04949 0.02190 ±0.00387
L70048-1/5 09/27/16 10/04/16 <0.03904 0.02180 ±0.00360
L70178-1/5 10/04/16 10/11116 <0.04483 0.02030 ±0.00348
L70282-1/5 10/11/16 10/18/16 <0.03147 0.02000 ±0.00369
L70393-1/5 10/18/16 10/25/16 <0.06442 0.01380 ±0.00319
L70536-1/5 10/25/16 11/01/16 <0.05197 0.03690 ±0.00456
L70560-1/5 11/01/16 11/08/16 <0.03599 0.02740 ±0.00403
L70676-1/5 11/08/16 11/15/16 <0.05512 0.03570 ±0.00467
L70742-1/5 11115/16 11/22116 <0.02909 0.03500 ±0.00464
L70806-1/5 11/22116 11/29/16 <0.05501 0.02810 ±0.00403
L70869-1/6 11/29/16 12106/16 <0.03559 0.01950 ±0.00370
L70951-1/5 12106/16 12/13/16 <0.02608 0.02160 ±0.00355
L71048-1/5 12113/16 12120/16 <0.06460 0.02210 ±0.00358
L71091-1/5 12/20/16 12/27/16 <0.05707 0.01810 ±0.00348
Average:
Maximum:
Minimum:
43
0.01732
0.03690
0.00639
; ...$--# -.-.: '. ill %';11-

Table A1.2
Sample Type: Air Particulate Filter and Radioiodine Cartridge
Analysis: Gross Beta and 1-131
Units: pCi/m3
AIR SAMPLE AS-3 61VA
LLD (pCi/m3) 0.07 0.01
LAB 10 START DATE END DATE 1-131 GROSS BETA
L66432-2/5 12129/15 01/05/16 <0.04636 0.02960 ±0.00420
L66463-2/5 01/05/16 01/12116 <0.04176 0.01450 ±0.00316
L66587-215 01/12116 01/19/16 <0.05500 0.03110 ±0.00439
L66635-215 01/19/16 01/26/16 <0.01334 0.01800 ±0.00346
L66726-2/5 01/26/16 02102116 <0.04763 0.01970 ±0.00357
L66829-2/5 02/02116 02109/16 <0.04679 0.01330 ±0.00324
L66915-2/5 02/09/16 02116116 <0.04699 0.01660 ±0.00330
L66990-215 02/16/16 02/23/16 <0.03123 0.01480 ±0.00330
L67081-2/5 02/23/16 03/01/16 <0.06796 0.01630 ±0.00339
L67163-2/5 03/01/16 03/08/16 <0.04460 0.01550 ±0.00324
L67243-215 03/08/16 03/15/16 <0.03079 0.01050 ±0.00287
L67320-215 03/15/16 03/22/16 <0.02468 0.01480 ±0.00336
L67366-2/5 03/22116 03/29/16 <0.05954 0.01310 ±0.00315
L67480-2/5 03/29/16 04/05/16 <0.05523 0.01760 ±0.00346
L67589-2/5 04/05/16 04/12116 <0.06889 0.01580 ±0.00322
L67683:..2/5 04/12116 04/19/16 <0.04597 0.00987 ±0.00278
L67804-2/5 04/19/16 04/26/16 <0.04244 0.01760 ±0.00350
L67933-2/5 04/26/16 05/03/16 <0.03383 0.01530 ±0.00337
L68039-2/5 05/03/16 05/10/16 <0.05534 0.01840 ±0.00350
L68137-2/5 05/10/16 05/17/16 <0.146* 0.04820· ±0.02170
L68240-215 05/17/16 05/24/16 <0.05899 0.02140 ±0.00369
L68307-215 OS/24/16 05/31/16 <0.06829 0.01950 ±0.00355
L68396-215 05/31/16 06/07/16 <0.06313 0.01460 ±0.00335
L68496-2/5 06/07/16 06/14/16 <0.05114 0.01160 ±0.00312
L68572-2/6 06/14/16 06/21116 <0.03546 '0.01720 ±0.00320
L68711-216 06/21/16 06/28/16 <0.01809 0.01760 ±0.00349
L68749-2/6 06/28/16 07/05/16 <0.06456 0.02050 ±0.00361
L68844-2/6 07/05/16 07/12116 <0.05222 0.01680 ±0.00331
L68942-2/6 07/12116 07/19/16 <0.05391 0.01470 ±0.00318
L69076-2/6 07/19/16 07/26/16 <0.05191 0.01180 ±0.00300
L69194-2/6 07/26/16 08102116 <0.04559 0.01020 ±0.00290
L69272-216 08/02116 08/09/16 <0.01822 0.01590 ±0.00332
L69363-216 08/09/16 08/16/16 <0.04151 0.00922 ±0.00284
L69443-216 08/16/16 08/23/16 <0.04014 0.00818 ±0.00261
44

Table A1.2Sample Type: Air Particulate Filter and Radioiodine Cartridge
Analysis: Gross Beta and 1-131
Units: pCi/m3
AIR SAMPLE AS-3 61VA
LLD (pCi/m3) 0.07 0.01
LAB 10 START DATE END DATE 1-131 GROSS BETA
L69544-2/6 08/23116 08/30/16 <0.06764 0.01250 ±0.00305
L69615-2/6 08/30/16 09/06/16 <0.04350 0.02000 ±0.00362
L69726-2/6 09/06/16 09/13/16 <0.05686 0.00879 ±0.00267
L69883-216 09/13/16 09/20/16 <0.03618 0.00913 ±0.00278
L69934-2/6 09/20/16 09/27/16 <0.02078 0.02540 ±0.00408
L70048·2/6 09/27/16 10/04/16 <0.03910 0.03030 ±0.00412
L70178-2/6 10/04/16 10/11/16 <0.04661 0.02280 ±0.00371
L70282-216 10/11116 10/18/16 <0.03089 0.01790 ±0.00347
L70393-2/6 10/18/16 10/25/16 <0.06474 0.01660 ±0.00341
L70536-216 10/25/16 11/01/16 <0.05198 0.03390 ±0.00440
L70560-216 11/01/16 11/08/16 <0.03641 0.02810 ±0.00409
L70676·216 11/08/16 11/15/16 <0.05490 0.03530 ±0.00463
L70742-2/6 11/15/16 11/22116 <0.06568 0.03130 ±0.00444
L70806-2/6 11/22116 11/29/16 <0.05510 0.03020 ±0.00416
L70869-216 11/29/16 12106/16 <0.03564 0.02180 ±0.00385
L70951-217 12106/16 12113/16 <0.02613 0.01890 ±0.00335
L71048·216 12113/16 12120/16 <0.06470 0.02790 ±0.00395
L71091-2/6 12120/16 12/27/16 <0.05720 0.02110 ±0.00368
Average:
Maximum:
Minimum:
0.01850
0.03530
0.00818
* LLD not met due to small sample size. Data not included in avg/maxlmin calculations.
45

Table A1.3
Sample Type: Air Particulate Filter and Radioiodine Cartridge
Analysis: Gross Beta and 1-131
Units: pCi/m3
AIR SAMPLE AS-7 UH
LLD (pCi/m3) 0.07 0.01
LAB 10 START DATE END DATE 1-131 GROSS BETA
L66432-3/6 12129/15 01/05/16 <0.04628 0.02830 ±0.00412
L66463-3/6 01/05/16 01/12116 <0.04169 0.00966 ±0.00276
L66587-3/6 01/12116 01/19/16 <0.05480 0.02880 ±0.00426
L66635-3/6 01/19/16 01/26/16 <0.03429 0.01430 ±0.00319
L66726-3/6 01/26/16 02/02116 <0.04753 0.01990 ±0.00359
L66829-3/6 02102116 02/09/16 <0.04661 0.01040 ±0.00301
L66915-3/6 02/09/16 02/16/16 <0.02074 0.01560 ±0.00323
L66990-3/6 02116/16 02123/16 <0.03110 0.01320 ±0.00318
L67081-3/6 02/23/16 03/01/16 <0.06688 0.01540 ±0.00331
L67163-3/6 03/01/16 03/08/16 <0.04462 0.01710 ±0.00337
L67243-3/6 03/08/16 03/15/16 <0.03080 0.00724 ±0.00260
L67320-3/6 03/15/16 03/22116 <0.05944 0.01260 ±0.00323
L67366-3/6 03/22116 03/29/16 <0.02490 0.01150 ±0.00303
L67480-3/6 03/29/16 04/05/16 <0.05832 0.01860 ±0.00366
L67589-3/6 04/05/16 04/12/16 <0.06874 0.01340 ±O.00303
L67683-3/6 04/12116 04/19/16 <0.04635 0.01220 ±0.00300
L67804-3/6 04/19/16 04/26/16 <0.04255 0.01570 ±0.00339
L67933-3/6 04/26/16 05/03/16 <0.01414 0.01570 ±0.00340
L68039-3/6 05/03/16 05/10/16 <0.05517 0.01650 ±0.00337
L68137-3/6 05/10/16 05/17/16 <0.01381 0.01470 ±0.00299
L68240-3/6 05/17/16 OS/24/16 <0.05847 0.01870 ±0.00348
L68307-3/6 OS/24/16 05/31/16 <0.06811 0.01580 ±0.00330
L68396-3/6 05/31/16 06/07/16 <0.06303 0.01230 ±0.00317
L68496-3/6 06/07/16 06/14/16 <0.05111 0.01430 ±0.00332
L68572-3/7 06/14/16 06/21/16 <0.03444 0.01750 ±0.00318
L68711-3/7 06/21/16 06/28/16 <0.04354 0.01530 ±0.00337
L68749-3/7 06/28/16 07/05/16 <0.06804 0.01990 ±0.00366
L68844-3/7 07/05/16 07/12/16 <0.05047 0.01350 ±0.00297_
L68942-3/7 07/12116 07/19/16 <0.05373 0.00956 ±0.00275
L69076-3/7 07/19/16 07/26/16 <0.05165 0.01360 ±0.00313
L69194-3/7 07/26/16 08/02/16 <0.04548 0.01090 ±0.00297
L69272-3/7 08/02116 08/09/16 <0.04336 0.01480 ±0.00324
L69363-3/7 08/09/16 08/16/16 <0.04259 0.00899 ±0.00288
L69443-3/7 08/16/16 08/23/16 <0.04007 0.01010 ±0.00278
L69544-3/7 08/23/16 08/30/16 <0.06745 0.01330 ±0.00311
46

Table A1.3Sample Type: Air Particulate Filter and Radiolcdine Cartridge
Analysis: Gross Beta and 1-131
Units: pCi/m3
AIR SAMPLE AS-7 UH
LLD (pCi/m3) 0.07 0.01
LAB 10 START DATE END DATE 1-131 GROSS BETA
L69615-3J7 08/30/16 09/06/16 <0.04037 0.01800 ±O.00349
L69726-3/7 09/06/16 09/13/16 <0.05669 0.00770 ±0.00257
L69883-3/7 09/13/16 09/20/16 <0.03599 0.00505 ±0.00240
L69934-3/7 09/20/16 09/27/16 <0.05093 0.02460 ±0.00411
L70048-3/7 09/27/16 10/04/16 <0.03902 0.01990 ±0.00347
L70178-3/7 10/04/16 10/11/16 <0.04542 0.02100 ±0.00355
L70282-3/7 10/11/16 10/18/16 <0.03120 0.01900 ±0.00359
L70393-3/7 10/18/16 10/25/16 <0.06550 0.01550 ±O.00336
L70536-3/7 10/25/16 11/01/16 <0.05187 0.03280 ±0.00434
L70560-3/7 11/01/16 11/08/16 <0.03594 0.02440 ±0.00384
L70676-3/7 11/08/16 11/15/16 <0.05508 0.03600 ±0.00468
L70742-3/7 11/15/16 11/22116 <0.06611 0.03000 ±O.00439
L70806-3/7 11/22116 11/29/16 <0.05734 0.02730 ±O.00409
L70869-3/7 11/29/16 12/06/16 <0.03580 0.02160 ±0.00386
L70951-3/8 12106/16 12/13/16 <0.02603 0.02050 ±0.00346
L71048-3/7 12113/16 12120/16 <0.06454 0.02280 ±0.00362
L71091-3/7 12120/16 12127/16 <0.05685 0.01790 ±0.00346
Average:
Maximum:
Minimum:
47
0.01699
0.03600
0.00505

Table A1.4Sample Type: Air Particulate Filter and Radioiodine Cartridge
Analysis: Gross Beta and 1-131
Units: pCi/m3
AIR SAMPLE AS-20 GR
LLO (pCi/m3) 0.07 0.01
LAB 10 START DATE END DATE 1-131 GROSS BETA
L68572-4/8 06/14/16 06/21/16 <0.03546 0.01710 ±O.00321
L68711-4/8 06/21/16 06/28/16 <0.04307 0.01460 ±O.00329
L68749-4/8 06/28/16 07105/16 <0.06790 0.01900 ±O.00361
L68844-4/8 07/05/16 07/12116 <0.05047 0.01370 ±0.00299
L68942-4/8 07/12/16 07/19/16 <0.05639 0.01430 ±0.00325
L69076-4/8 07/19/16 07/26/16 <0.05167 0.01250 ±O.00305
L69194-4/8 07/26/16 08/02116 <0.04547 0.01010 ±0.00290
L69272-4/8 08/02116 08/09/16 <0.04337 0.01240 ±O.00305
L69363-4/8 08/09/16 08/16/16 <0.04281 0.00904 +0.00290
L69443-4/8 08/16/16 08/23/16 <0.04009 0.00830 ±O.00262
L69544-4/8 08/23/16 08/30/16 <0.06747 0.01430 ±O.00319
L69615-418 08/30/16 09/06/16 <0.01568 0.02040 ±0.00364
L69726-4/8 09/06/16 09/13/16 <0.05670 0.00674 ±0.00248
L69883-4/8 09/13/16 09/20/16 <0.06700 0.01180 ±0.00471
L69934-4/8 09/20/16 09/27/16 <0.05096 0.02960 ±O.00441
L70048-4/8 09/27/16 10/04/16 <0.03903 0.01970 ±0.00346
L70178-4/8 10104/16 10/11/16 <0.04530 0.01870 ±O.00339
L70282-4/8 10/11/16 10/18/16 <0.03117 0.01420 ±0.00324
L70393-4/8 10/18/16 10/25/16 <0.06563 0.01780 ±O.00353
L70536-4/8 10/25/16 11/01/16 <0.05190 0.03580 ±0.00450
L70560-4/8 11/01/16 11/08/16 <0.03595 0.02820 ±O.00408
L70676-4/8 11/08/16 11/15/16 <0.05509 0.03050 ±0.00438
L70742-4/8 11/15/16 11/22/16 <0.06613 0.03180 ±O.00449
L70806-4/8 11/22/16 11/29/16 <0.05526 0.02310 ±0.00373
L70869-4/8 11/29/16 12106116 <0.03574 0.01590 ±0.00346
L70951-5/10 12106/16 12113/16 <0.02915 0.02210 ±0.00391
L71048-4/8 12113/16 12120/16 <0.06454 0.02350 ±0.00367
L71091-4/8 12/20/16 12/27/16 <0.05685 0.01970 ±O.00358
Average:
Maximum:
Minimum:
48
0.01839
0.03580
0.00674

Table A1.5Sample Type: Air Particulate Filter
Analysis: Gamma Isotopic
Units: pCi/m3AIR PARTICULATE FILTER SAMPLES (GAMMA)LLD (pCilm3) 0.05 0.06
LAB 10 LOCATION DATE CS-134 CS-137
L67692-1 AS-1 PG 02112116 <0.001861 <0.002114
L67692-2 AS-361VA 02112116 <0.002451 <0.001763
L67692-3 AS-7 UH 02112116 <0.003138 <0.002981
L68987-1 AS-1 PG 05/13/16 <0.001597 <0.00161
L68987-2 AS-361VA 05/13/16 <0.001931 <0.001599
L68987-3 AS-7 UH 05/13/16 <0.001755 <0.001427
L68987-4 AS-20 GR 06/21/16 <0.01107* <0.008607*
L70077-1 AS-1 PG 08/16/16 <0.001622 <0.001359
L70077-2 AS-361VA 08/16/16 <0.002109 <0.001509
L70077-3 AS-7 UH 08/16/16 <0.001899 <0.001399
L70077-4 AS-20 GR 08/16/16 <0.002201 <0.001654
L71344-1 AS-1 PG 11/18/16 <0.001483 <0.001579
L71344-2 AS-361VA 11/18/16 <0.001711 <0.001805
L71344-3 AS-7 UH 11/18/16 <0.002363 <0.001571
L71344-4 AS-20 GR 11/18/16 <0.002707 <0.002552
* New monitoring location AS-20 was activated on 06/14/16 with only two weeks left in the quarterly monitoring period. Dueto the activation date, only two weekly samples were included in the quarterly composite analysis (06/21/16) for AS-20, ascompared to 13 samples for each of the remaining (05/13/16) monitoring locations. The difference in activity between the(06/21/16) AS-20 sample and the remaining locations is attributed to the non-comparable sample volumes and samplingintervals. Weekly gross beta and 1-131 activity, as well as the remaining 2016 quarterly composite gamma analyses werecomparable for all monitoring locations.
49
I
I &.i&:'.. ll!LiJJlOii:i:JOlIDii ...,.-

Table A 2.1Sample Type: Thermoluminescent DosimetersAnalysis: Gamma DoseUnits: mrem/Qtr
Inner Ring - Within General Area of Site Boundary
IStation 1st atr I 2nd atr 3rd atr 14th atr Annual Mean
.. M-16 : 9.6 I 9.6 I 12.5 ! 11.8 ! 10.8 I(_._ _._. ·__·---:··~··_·_···_·_·_·_-_···_-t-·_-_···_·",---''',,-, -'-.t----.---·..·."..-,,· ·..~"··r----·-· ..-·-·-···-·-"· '--T.,_._-_._-_._.._-_ _,j
:...._... "_.~~.!.~ ...._"..._L" .._.. .,_.... ,,.. ~.:.4 .__._,,_..J" ....."".",,, _.~_:!t ......"."L..._.".._....!Q:Q,_",.." ""...i. ...._"..."..~9:L.,,, _ L__..",_...~:.~ ....,_ ,.".,_...:: M-21 : 10.6 l 10.51 12.2 I 12.3 j 11.4 ;
M-22 6.8 I 7.5 ! 8.8 I 9.2 ,1... 8.11 I 1
M-23 5.1 L 7.61 9.9! 10.0 L 8.?
M-25 2.2 I 6.0 '11 7.8 I 9.1 6.3
I I 1M-28 ; 9.7 I, 10.3 I 11.6 ".".l 12.6j 11.0M 94 ill !- 8.9 I 9.3 ! 10.4 I 11.3 ! 10.0
"Location with highest annual mean
Outer Ring - Approximately Three (3) to Five (5) Miles from the Site
Station
M-36
M-40
M-48
M-49
M-50
1st Qtr
Not Available
2nd Qtr
7.2
3rd Qtr
7.7
Ij
4th Qtr i Annual Mean
8.3
"Location with highest annual mean
50
eee A .. ¥.. s· -w!: 5· .

Table A 2.2Sample Type: Thermoluminescent DosimetersAnalysis: Gamma DoseUnits: mrem/Qtr
Special Interest Areas - Population Centers & Schools
Station 1st Qtr 2nd etr 3rd etr 4th etr Annual Mean
M-011' 9.6 10.4\ 12.0 13~2, 11.3 . j
...,_",.._...,~~.~?., _.._.:.__._._ _.. ,1..Q.:-?..._., _._"..: "..., ~.~~._,,, .._.,_ i_ _., _.._1..~..:Q_...,., ,_._.,I..__._ _ .._.l!:~_ __..'''..Lm._ ,....1Q;~,_ ,.._.jM-09! 9.1 i 8.1 i 10.3 I 11.3 i 9.7 i
...... M 10 1 '... '. t, !' .': ..' [, - : 7.5 i 8.0 . 8.9 1 9.3 : 8.4 !)--_••••.• _""_._, .•_--._.__ .~ ~ " .. ""_.-- ~_ "'..-..- _" _ - _( ,.,. A '_•• __.A__ ---+-_ ~ _ -........·, ..,--_·.. ~·__..···,,·_·_-_· · ~~ ··__····-··f,·_· -, • - .....•......""_ _.--_.'1
M-33 i 7.1 : 7.5 i 9.0 ! 9.1 ! 8.2 I., ", _._._-_ - ~..- .•_.,_ " _.-••,..",_.._ ;;.._., _"...,,,.,, ,,_.""..•,, ...;.._ ,..,'_ ,.._., _..\-_ _ _--'_._ \_ ,._" ,.., ,•...._ _ "'.'.jM-38 8.2' 9.2 9.7! 10.8 i 9.5 !M-39 7.3 7.4 8.3 I 10.0 8.2 I
*Location with highest annual mean
Table A 2.3Sample Type: Thermoluminescent DosimetersAnalysis: Gamma DoseUnits: mrem/Qtr
Special Interest Areas - Control
Station
M-14
1st Qtr
9.0
2nd Qtr
9.6
51
3rd Qtr
11.7
4th Qtr
12.3
Annual Mean
10.7
I
. pUd iii Sb

Table A3.1
Sample Type: Surface Water
Analysis: Gamma Isotopic
Units: pCi/L
SURFACE WATER SAMPLES (GAMMA)
LLD (pCi/L) 15 15 30 15 30 15 30 15 15 18 60 15
LAB 10 LOCATION DATE MN-54 CO-58 FE-59 CO-60 ZN-65 NB-95 ZR-95 1-131 CS-134 CS-137 BA-140 LA-140
L66700-1 MRDOWN 01/28/16 <4.04 <4.181 <9.821 <4.665 <9.369 <5.258 <10.36 <8.202 <3.522 <4.709 <22.22 <6.429
L66700-2 MRDOWNGG 01/28/16 <5.028 <5.203 <13.54 <5.518 <11.54 <4.863 <10.71 <9.498 <5.244 <6.982 <31.15 <9.123
L66700-5 MRUP 01/28/16 <5.812 <5.276 <12.77 <5.717 <14.56 <5.293 <9.876 <7.603 <5.776 <6.815 <27 <7.967
L66700-6 MRUPGG 01/28/16 <7.004 <8.457 <12.73 <6.747 <13.78 <6.367 <16.48 <13.58 <8.282 <8.363 <38.64 <7.868
L67955-1 MRDOWN 05/04/16 <4.725 <4.656 <10.64 <9.226 <9.971 <7.216 <10.75 <11.83 <5.182 <6.947 <35.76 <12.04
L67955-3 MRUP 05/04/16 <6.193 <7.182 <16.14 <8.43 <17.72 <7.421 <12.41 <11.62 <6.709 <8.409 <35.51 <8.197
L69273-1 MRDOWN 08/04/16 <8.043 <7.064 <11.06 <8.658 <10.11 <6.514 <13.48 <13.33 <7.706 <7.855 <40.98 <9.544
L69273-3 MRUP 08/04/16 <8 <7.778 <15.71 <6.538 <16.7 <5.643 <15.17 <14.8 <7.029 <5.497 <41.63 <13.12
L70558-1R1 MRDOWN 11/03/16 <2.074 <2.542 <5.822 <2.381 <4.726 <2.712 <4.557 <11.64 <2.035 <2.381 <22.41 <7.768
L70558-3R1 MRUP 11/03/16 <2.171 <2.082 <5.373 <2.172 <4.639 <2.638 <4.308 <9.784 <1.831 <2.168 <19.05 <6.132
L70558-5R1 MRDOWN GG 11/03/16 <2.316 <2.563 <5.503 <2.514 <4.816 <2.834 <4.436 <11.17 <2.256 <2.378 <20.72 <6.749
L70558-7R1 MRUPGG 11/03/16 <2.661 <3.077 <7.257 <2.595 <5.853 <3.247 <5.26 <12.32 <2.554 <2.878 <25.13 <7.458
L70609-1R1 MRDOWN· 11/09/16 <1.772 <1.795 <4.152 <1.698 <3.693 <2.094 <3.463 <4.957 <1.705 <2.051 <12.17 <3.548
L70609-3R1 MRDOWN GG· 11/09/16 <2.351 <2.527 <5.134 <2.186 <4.74 <2.591 <4.77 <7.842 <2.819 <2.581 <16.44 <4.402
"GG" - indicates duplicate sample* Annual Sample collected during liquid discharge
52
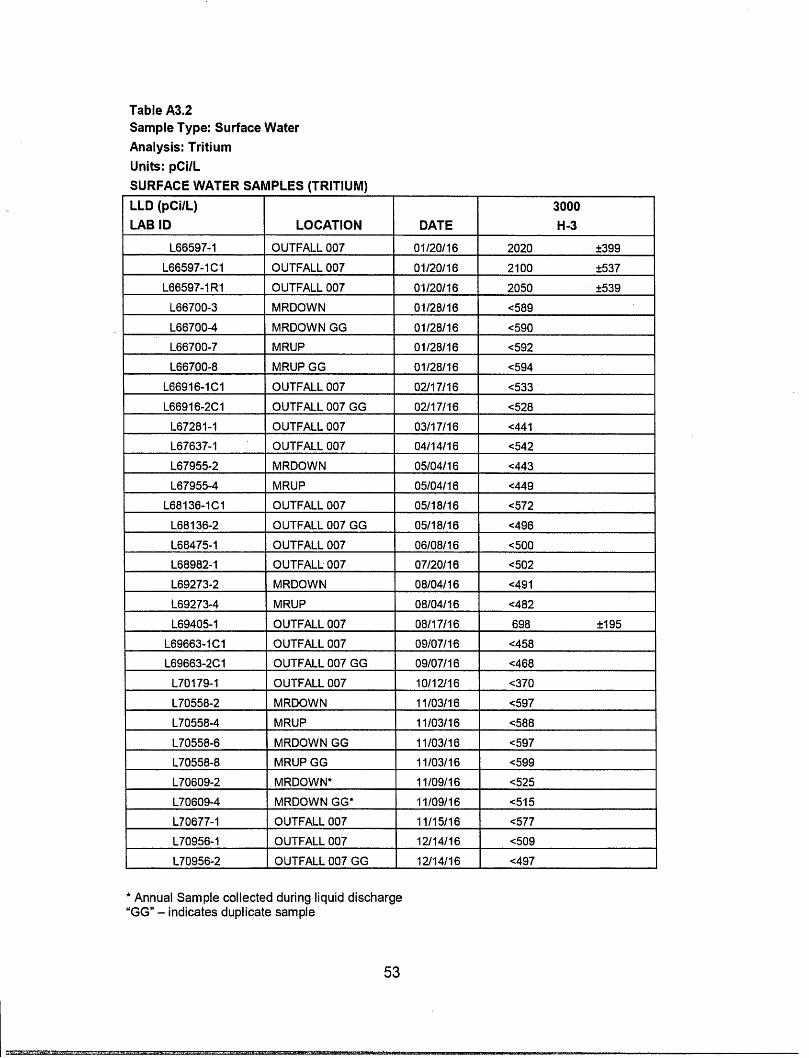
Table A3.2Sample Type: Surface Water
Analysis: Tritium
Units: pCi/L
SURFACE WATER SAMPLES (TRITIUM)
LLD (pCi/L) 3000LASlO LOCATION DATE H-3
L66597-1 OUTFALL 007 01/20/16 2020 ±399
L66597-1C1 OUTFALL 007 01/20/16 2100 ±537
L66597-1R1 OUTFALL 007 01/20/16 2050 ±539
L66700-3 MRDOWN 01/28/16 <589
L66700-4 MRDOWN GG 01/28/16 <590
L66700-7 MRUP 01/28/16 <592
L66700-8 MRUP GG 01128/16 <594
L66916-1C1 OUTFALL 007 02117/16 <533
L66916-2C1 OUTFALL 007 GG 02117/16 <528
L67281-1 OUTFALL 007 03/17/16 <441
L67637-1 OUTFALL 007 04/14/16 <542
L67955-2 MRDOWN 05104/16 <443
L67955-4 MRUP 05/04/16 <449
L68136-1C1 OUTFALL 007 05/18/16 <572
L68136-2 OUTFALL 007 GG 05/18/16 <496
L68475-1 OUTFALL 007 06/08/16 <500
L68982-1 OUTFALL 007 07/20/16 <502
L69273-2 MRDOWN 08/04/16 <491
L69273-4 MRUP 08/04/16 <482
L69405-1 OUTFALL 007 08/17/16 698 ±195
L69663-1C1 OUTFALL 007 09/07/16 <458
L69663-2C1 OUTFALL 007 GG 09/07/16 <468
L70179-1 OUTFALL 007 10/12116 <370
L70558-2 MRDOWN 11/03/16 <597
L70558-4 MRUP 11103/16 <588
L70558-6 MRDOWN GG 11/03/16 <597
L70558-8 MRUPGG 11/03/16 <599
L70609-2 MRDOWN* 11/09/16 <525
L70609-4 MRDOWN GG* 11/09/16 <515
L70677-1 OUTFALL 007 11/15/16 <577
L70956-1 OUTFALL 007 12114/16 <509
L70956-2 OUTFALL 007 GG 12114/16 <497
.. Annual Sample collected during liquid discharge"GG" - indicates duplicate sample
53

Table A4.1
Sample Type: Ground Water
Analysis: Gamma Isotopic
Units: pCi/L
GROUND WATER SAMPLES (GAMMA)
LLD (pCi/L) 15 15 30 15 30 15 30 15 18 60 15
LASlO LOCATION DATE MN-54 CO-58 FE-59 CO-60 ZN-65 NB-95 ZR-95 CS-134 CS-137 BA-140 LA-140
L70675-1 PGWELL 11/16/16 <7.819 <8.921 <15.99 <8.332 <17.72 <11.9 <15.54 <11.51 <9.43 <36.87 <7.972
L70675-5 CONSTWELL 3 11/16/16 <10.96 <10.11 <18.33 <8.68 <20.51 <8.684 <15.54 <9.291 <9.564 <31.52 <11.8
L70675-9 CONSTWELL4 11/16/16 <8.531 <8.158 <13.67 <7.554 <15.32 <9.443 <12.09 <9.681 <8.422 <30.48 <10.31
54

db+- -.. g'b",·4;;'· ~¥.
Table A4.2
Sample Type: Ground Water
Analysis: Tritium
Units: pCi/L
GROUND WATER SAMPLES (TRITIUM)
LLO (pCilL) 2000
LAB 10 LOCATION DATE H-3
L70675-3 PGWELL 11/16/16 <564
L70675-4 PGWELLGG 11/16/16 <571
L70675-7 CONSTWELL3 11/16/16 <575
L70675-8 CONSTWELL 3 GG 11/16/16 <572
L70675-11 CONSTWELL4 11/16/16 <574I
L70675-12 CONSTWELL 4 GG 11/16/16 <575
"GG" - indicates duplicate sample.
55

Table A4.3
Sample Type: Ground Water
Analysis: lodine-131
Units: pCilL
GROUND WATER SAMPLES (IODINE-131)
LLD (pCilL) 1
LAB 10 LOCATION DATE 1-131
L70675-2 PGWELL 11/16/16 <0.654
L70675-6 CONSTWELL 3 11/16/16 <0.874
L70675-10 CONSTWELL4 11/16/16 <0.978
56

Table A5.1
Sample Type: Sediment
Analysis: Gamma Isotopic
Units: pCi/kg
SEDIMENT SAMPLES (GAMMA)
LLD (pCi/kg) 150 180
LASlO LOCATION DATE CS-134 CS-137
L69790-1 SEDHAM 09/15/16 <47.07 <44.08
L69790-2 SEDCONT 09/15/16 <55.30 <44.28
L69790-3 SEDHAM GG 09/15/16 <42.23 <43.63
L69790-4 SEDCONT GG 09/15/16 <65.25 <44.80
"GG" - indicates duplicate sample.
57
:s ;; 'n: 1

Table A6.1
Sample Type: Fish
Analysis: Gamma Isotopic
Units: pCi/kg
FISH SAMPLES (GAMMA)
LLD (pCi/kg) 130 130 260 130 260 130 150
LASlO LOCATION DATE MN-54 CO-58 FE-59 CO-60 ZN-65 CS-134 CS-137
L69764-1 FISHUP 09/12116 <50.47 <50.98 <90.56 <50.57 <112.5 <57.99 <46.59
L69764-2 FISHDOWN 09/12116 <48.35 <48.92 <91.05 <40.76 <100.7 <56.13 <51.91
58

Table A7.1
Sample Type: Vegetation
Analysis: Gamma Isotopic
Units: pCi/kg
VEGETATION SAMPLES (GAMMA)
LLD (pCi/kg) 60 60 80
LASlO LOCATION DATE 1-131 CS-134 CS-137
L66964-1 VEG-CONT 02118/16 <28.74 <13.43 <17.25
L66964-2 VEG-J 02118/16 <45.11 <29.37 <29.45
L68361-1 VEG-CONT 06/02116 <48.2 <20.7 <22.69
L68361-2 VEG-J 06/02116 <46.85 <17.81 <18.17
L69404-1 VEG-CONT 08/18/16 <54.45 <21.9 <26.98
L69404-2 VEG-J 08/18/16 <45.23 <29.69 <35.95
" L70740-1 VEG-CONT 11/18/16 <58.7 <20.66 <18.66
L70740-2 VEG-J 11/18/16 <59.61 <20.33 <23.33
59

Table A 8.1Sample Type: Special SamplesAnalysis: Gamma IsotopicUnits: pCi/L, pCi/kg
SPECIAL SURFACE WATER SAMPLES GAMMA)
LLD (pCi/L) 15 15 30 15 30 15 30 15 15 18 60 15LAB 10 LOCATION DATE MN-54 CO-58 FE-59 CO-60 ZN-65 NB-95 ZR-95 1-131 CS-134 CS-137 BA-140 LA-140
L67282-1 OUTFALL 007 03/17/16 <3.783 <3.87 <8.073 <3.557 <8.171 <3.945 <6.315 <6.05 <3.859 <3.866 <18.8 <5.547
L68475-1 OUTFALL 007 06/08/16 <4.924 <5.452 <12.45 <6.23 <12.96 <6.685 <10.34 <14.64 <5.737 <7.146 <38.73 <14.44
L69765-1 OUTFALL 007 09/14/16 <8.508 <7.587 <15.47 <7.912 <15.95 <7.996 <10.39 <12.12 <6.151 <6.289 <30.35 <13.53
OUTFALL 007L69765-2 GG 09/14/16 <5.875 <6.712 <12.02 <6.12 <11.76 <6.045 <9.541 <9.667 <6.041 <5.803 <28.09 <8.569
L71173-1 OUTFALL 007 12120/16 <2.237 <2.315 <5.641 <2.236 <5.15 <2.611 <4.158 <11.39 <2.103 <2.129 <22.68 <7.422
LLD (pCi/kg) 130 130 260 130 260 130 150LASlO LOCATION DATE MN-54 CO-58 FE-59 CO-60 ZN-65 CS-134 CS-137
L70071-1 Meat 1 10103/16 <31.21 <34.33 <61.04 <25.55 <86.28 <37.86 <43.9
L70071-2 Meat 2 10103/16 <41.5 <43.19 <88.9 <31.8 <55.13 <46.3 <47.66
60
Table A 9.1Sample Type: Quality Assurance ReportAnalysis: Environmental Dosimeters
STANFORD DOSIMETRY
ENVIRONMENTAL DOSIMETRY COMPANY
ANNUAL QUALITY ASSURANCE STATUS REPORT
January - December 2016
Prepared By:
Approved By:
Date:
Date:
I ,
~ i ~' / t '=1--, r
Environmental Dosimetry Company10 Ashton Lane
Sterling, MA 01564

TABLE OF CONTENTS
Page
LIST OF TABLES '" '" iii
EXECUTIVE SUMMARy iv
I. INTRODUCTION 1
A. QC Program 1
B. QA Program 1
II. PERFORMANCE EVALUATION CRITERIA , 1
A. Acceptance Criteria for Internal Evaluations 1
B. QC Investigation Criteria and Result Reporting 3
C. Reporting of Environmental Dosimetry Results to EDC Customers 3
III. DATA SUMMARY FOR ISSUANCE PERIOD JANUARY-DECEMBER 2016 3
A. General Discussion ; 3
B. Result Trending 4
IV. STATUS OF EDC CONDITION REPORTS (CR) 4
V. STATUS OF AUDITS/ASSESSMENTS 4
A. InternaL 4
B. External 4
VI. PROCEDURES AND MANUALS REVISED DURING JANUARY - DECEMBER 2016 4
VII. CONCLUSION AND RECOMMENDATIONS 4
VIII. REFERENCES 4
APPENDIX A DOSIMETRY QUALITY CONTROL TRENDING GRAPHS
-ii-
.. 81:'

1.
2.
3.
LIST OF TABLES
Percentage of Individual Analyses Which Passed EDC Internal Criteria,January- December 2016
Mean Dosimeter Analyses (n=6), January - December 2016
Summary of Independent QC Results for 2016
·iii-
5
5
5
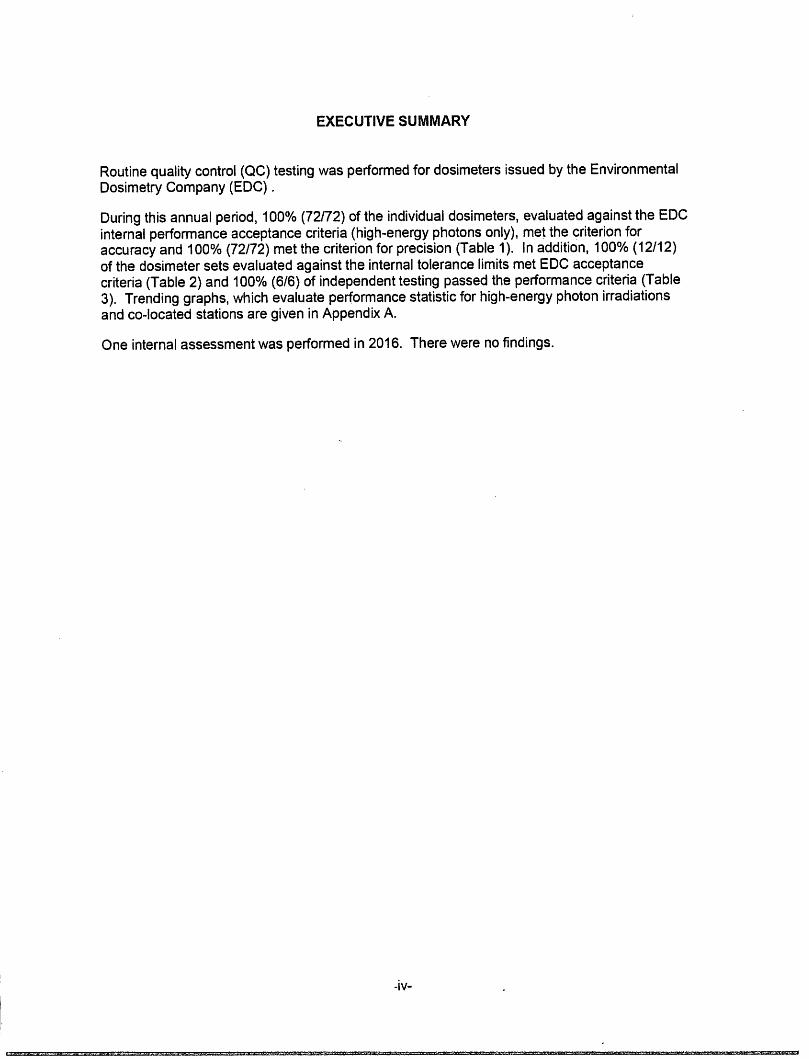
EXECUTIVE SUMMARY
Routine quality control (QC) testing was performed for dosimeters issued by the EnvironmentalDosimetry Company (EDC) .
During this annual period, 1000/0 (72172) of the individual dosimeters, evaluated against the EDCinternalperformance acceptance criteria (high-energy photons only), met the criterion foraccuracyand 1000/0 (72/72) met the criterion for precision (Table 1). In addition, 100% (12/12)of the dosimetersets evaluated against the internal tolerance limits met EDC acceptancecriteria (Table 2) and 100%(6/6) of independent testing passed the performance criteria (Table3). Trending graphs, which evaluate performance statistic for high-energy photon irradiationsand co-located stations are given in AppendixA.
One internalassessmentwas performed in 2016. There were no findings.
-iv-

I. INTRODUCTION
The TLD systems at the Environmental Dosimetry Company (EDC) are calibrated andoperated to ensure consistent and accurate evaluation of TLDs. The quality of thedosimetric results reported to EDC clients is ensured by in-house performance testingand independent performance testing by EDC clients, and both internal and clientdirected program assessments.
The purpose of the dosimetry quality assurance program is to provide performancedocumentation of the routine processing of EDC dosimeters. Performance testingprovides a statistical measure of the bias and precision of dosimetry processing againsta reliable standard, which in turn points out any trends or performance changes. Twoprograms are used:
A. QC Program
Dosimetry quality control tests are performed on EDC Panasonic 814Environmental dosimeters. These tests include: (1) the in-house testing programcoordinated by the EDC QA Officer and (2) independent test perform by EDCclients. In-house test are performed using six pairs of 814 dosimeters, a pair isreported as an individual result and six pairs are reported as the mean result.Results of these tests are described in this report.
Excluded from this report are instrumentation checks. Although instrumentationchecks represent an important aspect of the quality assurance program, they arenot included as process checks in this report. Instrumentation checks representbetween 5-10% of the TLDs processed.
B. QA Program
An internal assessment of dosimetry activities is conducted annually by theQuality Assurance Officer (Reference 1). The purpose of the assessment is toreview procedures, results, materials or components to identify opportunities toimprove or enhance processes and/or services.
II. PERFORMANCE EVALUATION CRITERIA
A. Acceptance Criteria for Internal Evaluations
1. Bias
For each dosimeter tested, the measure of bias is the percent deviation ofthe reported result relative to the delivered exposure. The percentdeviation relative to the delivered exposure is calculated as follows:
where:
H; = the corresponding reported exposure for the jlh
dosimeter (Le., the reported exposure)
HI = the exposure delivered to the ith irradiateddosimeter (i.e., the delivered exposure)
1 of 6

2. Mean Bias
For each group of test dosimeters, the mean bias is the average percentdeviation of the reportedresult relative to the delivered exposure. Themean percent deviation relative to the delivered exposure is calculated asfollows:
where:
H; = the corresponding reported exposure for the ith
dosimeter (Le., the reported exposure)
Hi = the exposure delivered to the i1h irradiatedtestdosimeter (Le., the delivered exposure)
n = the numberof dosimeters in the test group
3. Precision
For a group of test dosimeters irradiated to a given exposure, themeasure of precision is the percentdeviation of individual results relativeto the mean reported exposure. At least two values are required for thedetermination of precision. The measure of precision for the ith dosimeteris:
where:
H; = the reported exposurefor the ith dosimeter(Le., thereported exposure)
R = the mean reported exposure; i.e., R=LH:(*Jn = the numberof dosimeters in the test group
4. EDC Internal Tolerance Limits
All evaluation criteria are taken from the "EDC QualitySystem Manual,"(Reference 2). These criteria are only applied to individual testdosimeters irradiated with high-energy photons (Cs-137) and are asfollows for PanasonicEnvironmental dosimeters: ± 15%for bias and ±12.8%for precision.
2 of 6
~)·a 6 .e:
B. aClnvestigation Criteria and Result Reporting
EDC Quality System Manual (Reference 2) specifies when an investigation isrequired due to a QC analysis that has failed the EDC bias criteria. The criteriaare as follows:
1. No investigation is necessary when an individual QC result falls outsidethe QC performance criteria for accuracy.
2. Investigations are initiated when the meanof a QC processing batch isoutside the performance criterion for bias.
C. Reporting of Environmental Dosimetry Results to EDC Customers
1. All results are to be reported in a timely fashion.
2. If the QA Officer determines that an investigation is required for aprocess, the results shall be issued as normal. If the QC results,prompting the investigation, have a mean bias from the known of greaterthan ±20%, the results shall be issued with a note indicating that theymay be updated in the future, pending resolution of a QA issue.
3. Environmental dosimetry results do not require updating if theinvestigation has shown that the mean bias between the original resultsand the corrected results, based on applicable correction factors from theinvestigation, does not exceed ±20%.
III. DATA SUMMARY FOR ISSUANCE PERIOD JANUARY-DECEMBER 2016
A. General Discussion
Results of performance tests conducted are summarized and discussed in thefollowing sections. Summaries of the performance.tests for the reporting periodare given in Tables 1 through 3 and Figures 1 through 4.
Table 1 provides a summary of individual dosimeter results evaluated against theEDC internal acceptance criteria for high-energy photons only. During this period,100% (72/72) of the individual dosimeters, evaluated against these criteria metthe tolerance limits for accuracy and 100% (72/72) met the criterion for precision.A graphical interpretation is provided in Figures 1 and 2.
Table 2 provides the Bias + Standard deviation results for each group (N=6) ofdosimeters evaluated against the internal tolerance criteria. Overall,100%(12/12) of the dosimeter sets evaluated against the internal toleranceperformance criteria met these criteria. A graphical interpretation is provided inFigure 3.
Table 3 presents the independent blind spike results for dosimeters processedduring this annual period. All results passed the performance acceptancecriterion. Figure 4 is a graphical interpretation of Seabrook Station blind 00located station results.
3 of 6

;:;i$4#9&% ..
B. Result Trending
One of the main benefits of performing quality control tests on a routine basis isto identify trends or performance changes. The results of the Panasonicenvironmental dosimeter performance tests are presented in Appendix A. Theresults are evaluated against each of the performance criteria listed in Section II,namely: individual dosimeter accuracy, individual dosimeter precision, and meanbias.
All of the results presented in Appendix A are plotted sequentially by processingdate.
IV. STATUS OF EDC CONDITION REPORTS (CR)
No condition reports were issued during this annual period.
V. STATUS OF AUDITS/ASSESSMENTS
A. Internal
EDC Internal Quality Assurance Assessment was conducted during the fourthquarter 2016. There were no findings identified.
B. External
None.
VI. PROCEDURES AND MANUALS REVISED DURING JANUARY - DECEMBER 2016
Several procedures were reissued with no changes as part of the 5 year review cycle.
VII. CONCLUSION AND RECOMMENDATIONS
The quality control evaluations continue to indicate the dosimetry processing programsat the EDC satisfy the criteria specified in the Quality System Manual. The EDCdemonstrated the ability to meet all applicable acceptance criteria.
VIII. REFERENCES
1. EDC Quality Control and Audit Assessment Schedule, 2016.
2. EDC Manual 1, Quality System Manual, Rev. 3, August 1, 2012.
40f6

--------------------
TABLE 1
PERCENTAGE OF INDIVIDUAL DOSIMETERSTHAT PASSED EDC INTERNAL CRITERIAJANUARY - DECEMBER 2016(1};-(2)
(1)-rhis table summarizes results of tests conducted by EDC.(2)Environmental dosimeter results are free in air.
TABLE 2
MEAN DOSIMETERANALYSES (N=6)JANUARY - DECEMBER 2016(1), (2)
4/22/20164/29/20165/10/20167/25/20168/2120168/2/2016
10125/201610/29/201611/6120161/30/20171/31/20171/31/2017
40807033561232893613976101
3.51.81.82.42.40.72.93.20.01.42.2-1.7
0.70.71.81.51.61.41.01.81.62.51.31.5
I PassPassPassPassPassPassPassPassPassPassPassPass
(1)This table summarizes results of tests conducted by EDC for TLDs issued in 2016.(2)Environmental dosimeter results are free in air.
TABLE 3SUMMARY OF INDEPENDENTDOSIMETERTESTING
JANUARY - DECEMBER 2016(1), (2)
1S Qtr.20162n Qtr.20162n Qtr.20163r Qtr. 20164 Qtr.20164 Qtr.2016
MillstoneMillstoneSeabrookMillstoneMillstoneSeabrook
Pass 'I
PassPassPassPassPass
(1)Performance criteria are +/- 30%.(2)Slind spike irradiations using Cs-137
5 of 6

APPENDIX A
DOSIMETRY QUALITY CONTROL TRENDING GRAPHS
ISSUE PERIOD JAf\:JAURY - DECEMBER 2016
6of6
j. - - -%·i~ ~

INDMDUALACCURACY ENVlRONMENTALAGURE1
~ ~ ~ ~ ~ ~ ~ ~ ~ ~ ~ ~ ~ ~ ~ ~ ~ ~ ~~ ~ & ~ & .~ & ~ & ~ & ~ ~ & & & & & rt~ ~ ~ ~ ~ ~ ~ ~ ~ ~ ~ ~ 9l\ # ~ ~ ~ ~ ~~ ~ ~ ~ $ ~ ~ ~ ~ ~ ~ ~ ~ ~ ~ ~ ~ ~ ~
~ ~ ~ ~ 't " ~ "PROCESSING DATE
...kH-J£§¥%¥"#%;:· e, ¥-;§5ii.g+j.&.§~~
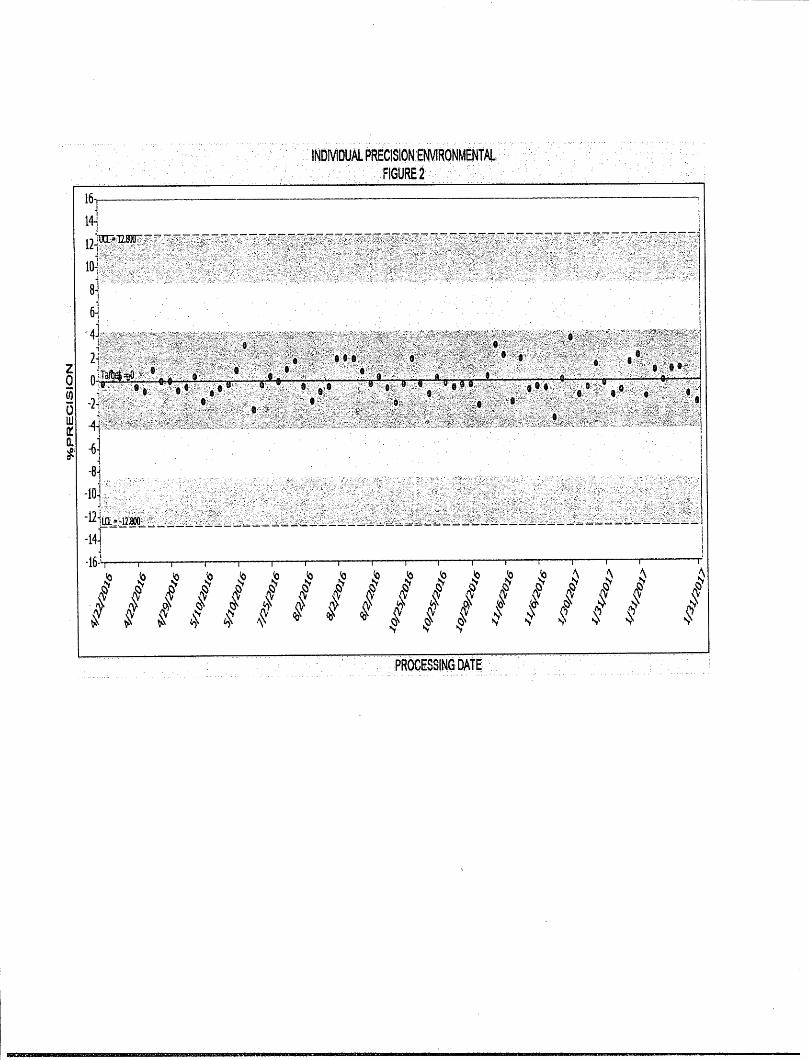
~ ~ ~ ~ ~ ~ ~ ~ ~ ~ ~ ~ ~ ~ ~ ~ ~ ~~ ~ ~ ~ ~ fj ~ s ~ & ~ & ~ s fj $ {f s
'~ ~ ~ ~ ~ ~ t ! ~ Pi- ~ ~ s ~ ~~~ ~ ~ ~ ~ ~ ~ ~ ~ s~ ~ ~
"Y ~ ~ 'f ~
PROCESSING DATE ' '

A 4- ~J.
MEAN ACCURACY ENVIRONMENtALFIGURE 3
i i i
~ ~ § ~ ~ ~ ~ ~ ~ ~ 1\~rt & s s fl s ~ ~ ~ ~
~ ~
i ~ ~ ~ ~ « !?f. ~ ~ ~~ ~ ~ ~ ~ ~ ~ ~ ~ ~ ~~ ~~ ~
"I "f "f
PROCESSING DATE
s

•
SEABROOK CO-lOCATE ACCURACY.FIGURE4
i
I I I I I I r---I j i I iJ
'0 ,;r ~ " CI\ ~I() CI\ ,,')I e., ... ,.,
~ " 'b ~ ~'9 ~::;' ~. ~. '0' 10' ¢' .:y ~~. Qt' ~.... ~ .... ... ... ... tV

Table A.9.2Sample Type: Quality Assurance ReportMatrix: Milk, Soil, Liquid, Vegetation, Air Charcoal, Air Particulate, Water
TELEDYNE BROWN ENGINEERING

~._» .. :s . ... ~ F
For the TBE laboratory, 156 out of 160 analyses performed met the specifiedacceptance criteria. Four analyses (Milk - Sr-90, Vegetation - Sr-90, and WaterH-3 samples) did not meet the specified acceptance criteria for the followingreasons and were addressed through the TBE Corrective Action Program.
Note: The Department ofEnergy (DOE) Mixed Analyte Performance EvaluationProgram (MAPEP) samples are created to mimic conditions found at DOE siteswhich do not resemble typical environmental samples obtained at commercialnuclear power facilities.
1. Teledyne Brown Engineering's MAPEP March 2016 air particulate crosscheck sample is now being provided to TBE by Analytics. MAPEP'spolicy is to evaluate as failed non-reported nuclides that were reported inthe previous study. NCR 16-14
1a. Since the Sr-90 was reported in the previous MAPEP study but not in thisstudy MAPEP evaluated the Sr-90 for Soil as failed. NCR 16-14
lb. The MAPEP March 2016 Sr-90 in vegetation was evaluated as failing afalse positive test. In reviewing the data that was reported vs the data inLIMS, it was found that the error was incorrectly reported as 0.023 ratherthan the correct value of0.230. If the value had been reported with theactivity and correct uncertainty of 0.301 ± 0.230, MAPEP would haveevaluated the result as acceptable. NCR 16-14
2. Teledyne Brown Engineering's Analytics' March 2016 milk Sr-90 resultof 15 ± .125 pCiIL was higher than the known value of 11.4 pCiIL with aratio of 1.32. The upper ratio of 1.30 (acceptable with warning) wasexceeded. After an extensive review of the data it is believed thetechnician did not rinse the filtering apparatus properly and some crosscontamination from one of the internal laboratory spike samples may havebeen transferred to the analytics sample. We feel the issue is specific to theMarch 2016 Analytics sample. NCR 16-26
3. Teledyne Brown Engineering's ERA November 2016 sample for H-3 inwater was evaluated as failing. A result of 918 pCiIL was reportedincorrectly due to a data entry issue. Ifthe correct value of 9180 had beenreported, ERA would have evaluated the result as acceptable. NCR 16-34

4. Teledyne Brown Engineering's Analytics' December 2016 milk Sr-90sample result of 14.7 ± .26 pCi/L was higher than the known value of 10pCiIL with a ratio of 1.47. The upper ratio of 1.30 (acceptable withwarning) was exceeded. The technician entered the wrong aliquot into theLIMS system. To achieve a lower error term TBE uses a larger aliquot of1.2L (Normally we use.6L for client samples). If the technician hadentered an aliquot of 1.2L into the LIMS system, the result would havebeen 12.2 pCiIL, which would have been considered acceptable. NCR 1635
• % ~·s - . w::zwswo::

ANALYTICS ENVIRONMENTAL RADIOACTIVITY CROSS CHECK PROGRAMTELEDYNE BROWN ENGINEERING ENVIRONMENTAL SERVICES
(PAGE 1 OF3)
Identification Reported Known Ratio (c)
MonthNear Number Matrix Nuclide Units Value (a) Value (b) TBEJAnalytics Evaluation (d)
March 2016 E11476 Milk Sr-89 pCilL 97 86.7 1.12 ASr-90 pCilL 15 11.4 1.32 N(2)
E11477 Milk 1-131 pCi/L 85.9 82.2 1.05 ACe-141 pCi/L 106 98.4 1.08 ACr-51 pCi/L 255 243 1.05 ACs-134 pCi/L 134 130 1.03 ACs-137 pCi/L 174 161 1.08 ACo-58 pCi/L 123 117 1.05 AMn':54 pCilL 141 117 1.21 WFe-59 pCi/L 152 131 1.16 AZn-G5 pCi/L 193 179 1.08 ACo-60 pCi/L 259 244 1.06 A
E11479 AP Ce-141 pCi 69 81.1 0.85 ACr-51 pCi 242 201 1.20 WCs-134 pCi 98.1 107.0 0.92 ACs-137 pCi 136 133 1.02 ACo-58 pCi 91.9 97 0.95 AMn-54 pCi 98.6 96.2 1.02 AFe-59 pCi 98.8 108 0.91 AZn-G5 pCi 131 147 0.89 ACo-GO pCi 209 201 1.04 A
E11478 Charcoal 1-131 pCi 85.3 88.3 0.97 A
E11480 Water Fe-55 pCi/L 1800 1666 1.08 A
June 2016 E11537 Milk Sr-89 pCilL 94.4 94.4 1.00 ASr-90 pCi/L 13.4 15.4 0.87 A
E11538 Milk 1-131 pCilL 96.8 94.5 1.02 ACe-141 pCi/L 129 139 0.93 ACr-51 pCi/L 240 276 0.87 ACs-134 pCi/L 157 174 0.90 ACs-137 .. pCi/L 117 120 0.98 ACo-58 pCi/L 131 142 0.92 AMn-54 pCi/L 128 125 1.02 AFe-59 pCi/L 132 122 1.08 AZn-65 pCilL 235 235 1.00 ACo-60 pCi/L 169 173 0.98 A
(a) Teledyne Brown Engineering reported result.
(b) The Analytics known value Is equal to 100% of the parameterpresent in the standard as determined by gravimetric ancVor
volumetric measurements made during standard preparation.
(c) Ratio of Teledyne Brown Engineering to Analytlcs results.
(d) Analytlcs evaluation based on TBE Internal QC limits: A=Acceptable, reported result faits within ratio limits of0.80-1.20.
W-Acceptable With warning, reported result falls within 0.70-0.80 or 1.20-1.30. N =Not Acceptable, reported
result falls outside the ratio limits of < 0.70 and> 1.30.
(2) NCR 16-26 was initiated
%t?~· ~.
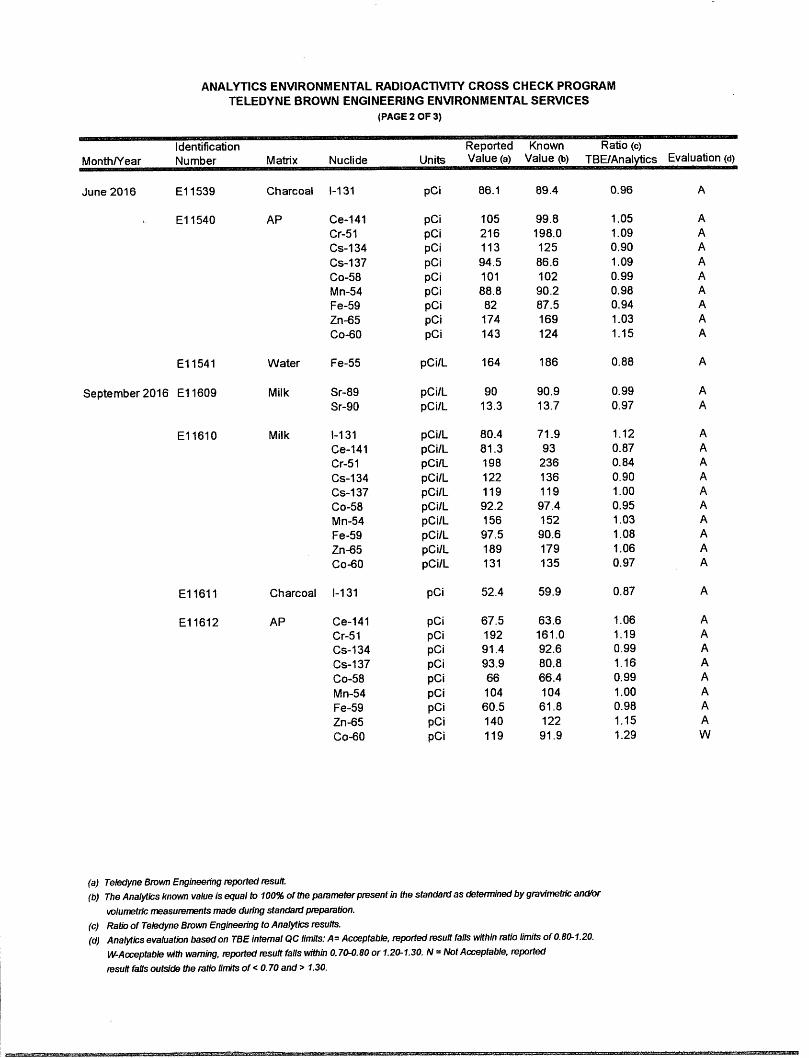
. f
ANALYTICS ENVIRONMENTAL RADIOACTIVITY CROSS CHECK PROGRAMTELEDYNE BROWN ENGINEERING ENVIRONMENTAL SERVICES
(PAGE20F3)
Identification Reported Known Ratio (c)
MonthNear Number Matrix Nuclide Units Value (a) Value (b) TBE/Analytics Evaluation (d)
June 2016 E11539 Charcoal 1-131 pCi 86.1 89.4 0.96 A
E11540 AP Ce-141 pCi 105 99.8 1.05 ACr-51 pCi 216 198.0 1.09 ACs-134 pCi 113 125 0.90 ACs-137 pCi 94.5 86.6 1.09 ACo-58 pCi 101 102 0.99 AMn-54 pCi 88.8 90.2 0.98 AFe-59 pCi 82 87.5 0.94 AZn~5 pCi 174 169 1.03 ACo-60 pCi 143 124 1.15 A
E11541 Water Fe-55 pCi/L 164 186 0.88 A
September 2016 E11609 Milk Sr-89 pCi/L 90 90.9 0.99 ASr-90 pCi/L 13.3 13.7 0.97 A
E11610 Milk 1-131 pCi/L 80.4 71.9 1.12 ACe-141 pCi/L 81.3 93 0.87 ACr-51 pCi/L 198 236 0.84 ACs-134 pCi/L 122 136 0.90 ACs-137 pCi/L 119 119 1.00 ACo-58 pCi/L 92.2 97.4 0.95 AMn-54 pCi/L 156 152 1.03 AFe-59 pCi/L 97.5 90.6 1.08 AZn~5 pCi/L 189 179 1.06 ACo-60 pCi/L 131 135 0.97 A
E11611 Charcoal 1-131 pCi 52.4 59.9 0.87 A
E11612 AP Ce-141 pCi 67.5 63.6 1.06 ACr-51 pCi 192 161.0 1.19 ACs-134 pCi 91.4 92.6 0.99 ACs-137 pCi 93.9 80.8 1.16 ACo-58 pCi 66 66.4 0.99 AMn-54 pCi 104 104 1.00 AFe-59 pCi 60.5 61.8 0.98 AZn-65 pCi 140 122 1.15 ACo-60 pCi 119 91.9 1.29 W
(a) Telecfyne Brown Engineering reported result.
(b) The Analytlcs known value ;s equal to 100% of the parameter present In the standarrf as determined by gravimetric andlor
volumetric measurements made during standarrf preparation.
(c) Ratio of Teledyne Brown Engineering to Analytlcs results.(d) Analyt/cs evaluation based on TBE Internal QC limits: A=Acceptable, reported result falls within ratio limits of O. 80-1.20.
W-Acceptable vJth warning, reported result falls wffhln 0.70-0.80 or 1.20-1.30. N =Not Acceptable, reported
result falls outside the ratio limits of < 0.70 and> 1.30.

ANALYTICS ENVIRONMENTAL RADIOACTIVITY CROSS CHECK PROGRAMTELEDYNE BROWN ENGINEERING ENVIRONMENTAL SERVICES
(PAGE30F3)
Identification Reported Known Ratio (c)
MonthlYear Number Matrix Nuclide Units Value (a) Value (b) TBEIAnalytics Evaluation (d)
September 2016 E11613 Water Fe-55 pCi/L 1990 1670 1.19 A
E11614 Soil Ce-141 pCi/g 0.153 0.175 0.87 ACr-51 pCi/g 0.482 0.441 1.09 ACs-134 pCi/g 0.270 0.254 1.06 ACs-137 pCi/g 0.313 0.299 1.05 ACo-58 pCi/g 0.177 0.182 0.97 AMn-54 pCi/g 0.340 0.285 1.19 AFe-59 pCi/g 0.206 0.17 1.21 WZn-G5 pCi/g 0.388 0.335 1.16 ACo-GO pCi/g 0.284 0.252 1.13 A
December 2016 E11699 Milk Sr-89 pCilL 95 74.2 1.28 WSr-90 pCi/L 14.7 10 1.47 N(3)
E11700 Milk 1-131 pCi/L 97.5 97.4 1.00 ACe-141 pCi/L 136 143 0.95 ACr-51 pCi/L 247 280 0.88 ACs-134 pCi/L 164 178 0.92 ACs-137 pCilL 120 126 0.95 ACo-58 pCi/L 139 146 .0.95 AMn-54 pCi/L 126 129 0.98 AFe-59 pCi/L 114 125 0.91 AZn-65 pCi/L 237 244 0.97 ACo-60 pCi/L 168 178 0.94 A
E11701 Charcoal 1-131 pCi 95.6 98 0.98 A
E11702 AP Ce-141 pCi 91.7 97.7 0.94 ACr-51 pCi 210 192.0 1.09 ACs-134 pCi 122 122 1.00 ACs-137 pCi 93.9 86.4 1.09 ACo-58 pCi 92 100 0.92 AMn-54 pCi 93.7 88.5 1.06 AFe-59 pCi 84.9 84.5 1.00 AZn-65 pCi 176 167 1.05 ACo-GO pCi 151 122 1.24 W
E11702 AP Sr-89 pCi 79.1 92 0.86 ASr-90 pCi 10 12.5 0.80 A
E11703 Water Fe-55 pCi/L 2180 1800 1.21 W
(a) Teledyne Brown Engineering reported result.(b) The Analytlcs known value is equal to 100% of the parameter present in the standard as determined by gravimetric ancVor
volumetric measurements made during standanJ preparation.
(c) Ratio of Teledyne Brown Engineering to Analytics results.
(d) Analytlcs evaluation based on rBE Internal QC limits: A= Acceptable, reported result faJJs within ratio limits of 0.8CJ..1.20.
W-Acceptable ...nth warning, reported result falls within 0.70-0.80 or 1.2CJ..1.30. N =Not Acceptable, reported
result falls outside the ratio limits of < 0.70 and> 1.30.
(3) NCR 16-35 was Initiated
-- ,.Ii

DOE's MIXED ANALYTE PERFORMANCE EVALUATION PROGRAM (MAPEP)TELEDYNE BROWN ENGINEERING ENVIRONMENTAL SERVICES
(PAGE 1 OF 1)
Identification Reported Known AcceptanceMonthNear Number Media Nuclide Units Value (a) Value (b) Range Evaluation (c)
March 2016 16-MaW34 Water Am-241 Bq/L 0.008 (1) ANi-63 Bq/L 12.4 12.3 8.6-16.0 APu-238 Bq/L 1.4900 1.2440 0.871-1.617 APu-239/240 Bq/L 0.729 0.641 0.449-0.833 A
16-MaS34 Soil Ni-63 Bq/kg 1140 1250.0 875-1625 ASr-90 Bq/kg 8.15 (1) A
16-RdF34 AP U-234/233 Bq/sample 0.1620 0.1650 0.116-0.215 AU-238 Bq/sample 0.163 0.172 0.120-0.224 A
16-GrF34 AP Gr-A Bq/sample 0.608 1.20 0.36-2.04 AGr-B Bq/sample 0.8060 0.79 0.40-1.19 A
16-RdV34 Vegetation Cs-134 Bq/sample 10.10 10.62 7.43-13.81 ACs-137 Bq/sample 6.0 5.62 3.93-7.31 ACo-57 Bq/sample 13.3000 11.8 8.3-15.3 ACo-60 Bq/sample 0.013 (1) AMn-54 Bq/sample 0.0150 (1) ASr-90 'Bq/sample 0.301 (1) N(4)Zn-65 Bq/sample 10.500 9.6 6.7-12.5 A
September 2016 16-MaW35 Water Am-241 Bq/L 0.626 0.814 .570-1058 WNi-63 Bq/L 12.4 17.2 12.0-22.4 APu-238 Bq/L 1.23 1.13 0.79-1.47 WPu-239/240 Bq/L 0.0318 0.013 (1) A
16-MaS35 Soil Ni-63 Bq/kg 724 990 693-1287 ASr-90 Bq/kg 747 894 626-1162 A
16-RdF35 AP U-234/233 Bq/sample 0.160 0.15 0.105-0.195 AU-238 Bq/sample 0.157 0.156 0.109-0.203 A
16-RdV35 Vegetation Cs-134 Bq/sample -0.103 (1) ACs-137 Bq/sample 5.64 5.54 3.88-7.20 ACo-57 Bq/sample 7.38 6.81 4.77-8.85 ACo-60 Bq/sample 4.81 4.86 3.40-6.32 AMn-54 Bq/sample 7.4 7.27 5.09-9.45 ASr-90 Bq/sample 0.774 0.80 0.56-1.04 AZn-65 Bq/sample 5.46 5.4 3.78-7.02 A
(1) False positive test.
(a) Teledyne Brown Engineering reported result
(b) The MAPEP known value is equal to 100% of the parameter present in the standard as determined by gravimetric ancVor
volumetric measurements made during standard preparation.
(c) DOEIMAPEP evaluation: A=acceptable, W--acceptable wffh warning, N=not acceptable.
(~NCR1~14wasmmamd
,if' & gem ~ .........01- ..;

ERA ENVIRONMENTAL RADIOACTIVITY CROSS CHECK PROGRAMTELEDYNE BROWN ENGINEERING ENVIRONMENTAL SERVICES
(PAGE 1 OF1)
Identification Reported Known AcceptanceMonthNear Number Media Nuclide Units Value (a) Value (b) Limits Evaluation (c)
May 2016 RAD-105 Water Sr-89 pCi/L 48.9 48.2 37.8 - 55.6 ASr-90 pCi/L 25.0 28.5 20.7 - 33.1 ABa-133 pCi/L 53.1 58.8 48.7 - 64.9 ACs-134 pCi/L 40.9 43.3 34.6 - 47.6 ACs-137 pCi/L 84.8 78.4 70.6 - 88.9 ACo-60 pCi/L 108 102 91.8 -114 AZn-65 pCi/L 226 214 193 - 251 AGr-A pCi/L 38.9 62.7 32.9 - 77.8 AGr-B pCi/L 41.9 39.2 26.0 - 46.7 A1-131 pCi/L 24.1 26.6 22.1 - 31.3 AU-Nat pCi/L 4.68 4.64 3.39 - 5.68 AH-3 pCi/L 7720 7840 6790 - 8620 A
November 2016 RAD-107 Water Sr-89 pCi/L 43.0 43.3 33.4-50.5 ASr-90 pCi/L 30.0 33.6 24.6-38.8 A8a-133 pCi/L 47.8 54.9 45.4-60.7 ACs-134 pCi/L 72.9 81.8 67.0-90.0 ACs-137 pCi/L 189 210 189-233 ACo-60 pCi/L 58.4 64.5 58.0-73.4 AZn-65 pCilL 243 245 220-287 AGr-A pCi/L 37.2 68.4 35.9-84.5 AGr-B pCi/L 35.1 33.9 22.1-41.6 A1-131 pCi/L 23.5 26.3 21.9-31.0 AU-Nat pCi/L 49.2 51.2 41.6-56.9 AH-3 pCi/L 918 9820 8540-10800 N(5)
MRAD-25 AP Gr-A pCi/Filter 56.8 71.2 23.9-111 A
(a) Teledyne Brown Engineering reported result.
(b) The ERA known value Is equal to 100% of the parameter present In the standard as determined by gravimetric ancVor
...-olumetric measurements made during standard preparation.
(c) ERA evaluation: A=acceptabIe. Reported result falls within the Warning Limits. NA=not acceptable. Reported result falls
outside of the Control Limits. CE=check for Error. Reported result falls within the Control Limits and outside of the Warning Limit.
(5) NCR 16-34 was initiated
4 ?-Y· Sd "~h