grain stocks 09/30/2021
TRANSCRIPT

Grain Stocks (September 2021) 1 USDA, National Agricultural Statistics Service
Grain Stocks
ISSN: 1949-0925
Released September 30, 2021, by the National Agricultural Statistics Service (NASS), Agricultural Statistics Board, United States
Department of Agriculture (USDA).
Corn Stocks Down 36 Percent from September 2020 Soybean Stocks Down 51 Percent All Wheat Stocks Down 18 Percent Old crop corn stocks in all positions on September 1, 2021 totaled 1.24 billion bushels, down 36 percent from
September 1, 2020. Of the total stocks, 395 million bushels are stored on farms, down 47 percent from a year earlier.
Off-farm stocks, at 842 million bushels, are down 28 percent from a year ago. The June - August 2021 indicated
disappearance is 2.87 billion bushels, compared with 3.08 billion bushels during the same period last year.
Based on an analysis of end-of-marketing year stock estimates, disappearance data for exports, and farm program
administrative data, the 2020 corn for grain production is revised down 71.0 million bushels from the previous estimate.
Corn silage production is revised down 54 thousand tons. Planted area is revised to 90.7 million acres, and area harvested
for grain is revised to 82.3 million acres. Area harvested for silage is revised to 6.71 million acres. The 2020 grain yield,
at 171.4 bushels per acre, is down 0.6 bushel from the previous estimate. The 2020 silage yield, at 20.5 tons per acre,
remains unchanged from the previous estimate. A table with 2020 acreage, yield, and production estimates by States is
included on pages 17 and 18 of this report.
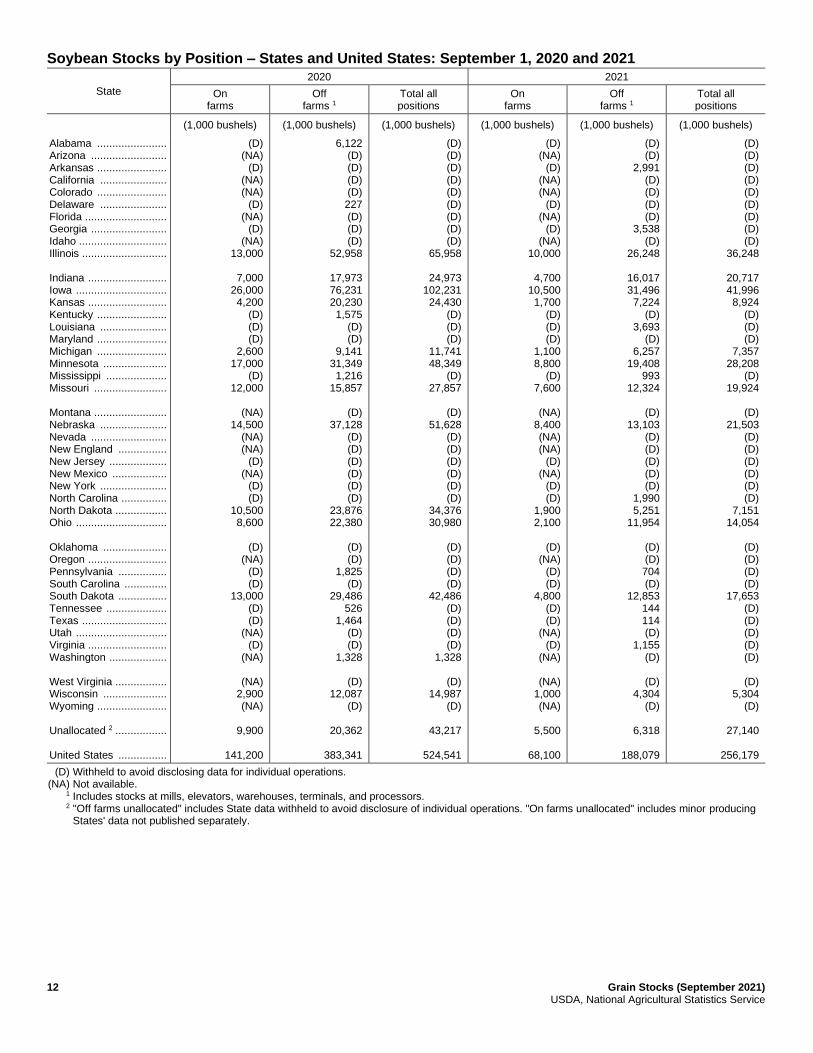
Old crop soybeans stored in all positions on September 1, 2021 totaled 256 million bushels, down 51 percent from
September 1, 2020. Soybean stocks stored on farms totaled 68.1 million bushels, down 52 percent from a year ago.
Off-farm stocks, at 188 million bushels, are down 51 percent from last September. Indicated disappearance for
June - August 2021 totaled 513 million bushels, down 40 percent from the same period a year earlier.
Based on an analysis of end-of-marketing year stock estimates, disappearance data for exports and crushings, and farm
program administrative data, the 2020 soybean production is revised up 80.8 million bushels from the previous estimate.
Planted area is revised to 83.4 million acres, and harvested area is revised to 82.6 million acres. The 2020 yield, at
51.0 bushels per acre, is up 0.8 bushel from the previous estimate. A table with 2020 acreage, yield, and production
estimates by States is included on page 19 of this report.
Special Note
The marketing year for corn and soybeans is finished and a thorough review of the balance sheet was
completed. This process, which is normal for this time of the year, led to revisions in acreage, yield, and
production for the 2020 crop.
U.S. corn production for 2020 is revised down 71.0 million bushels and U.S. soybean production is revised up
80.8 million bushels from the previous estimate. All revisions can be found on pages 17-19.
U.S. corn production for 2019 is revised up 2.67 million bushels and U.S. soybean production is revised down
333,000 bushels from the previous estimate. All revisions can be found on pages 17-19.
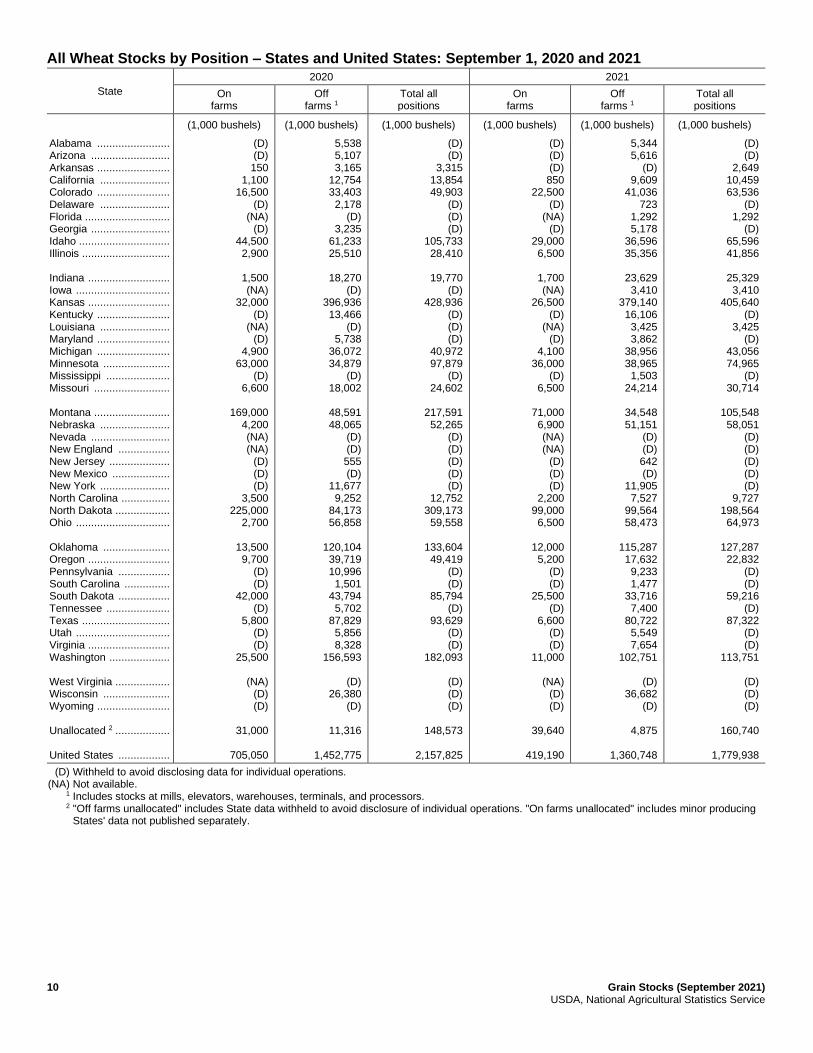
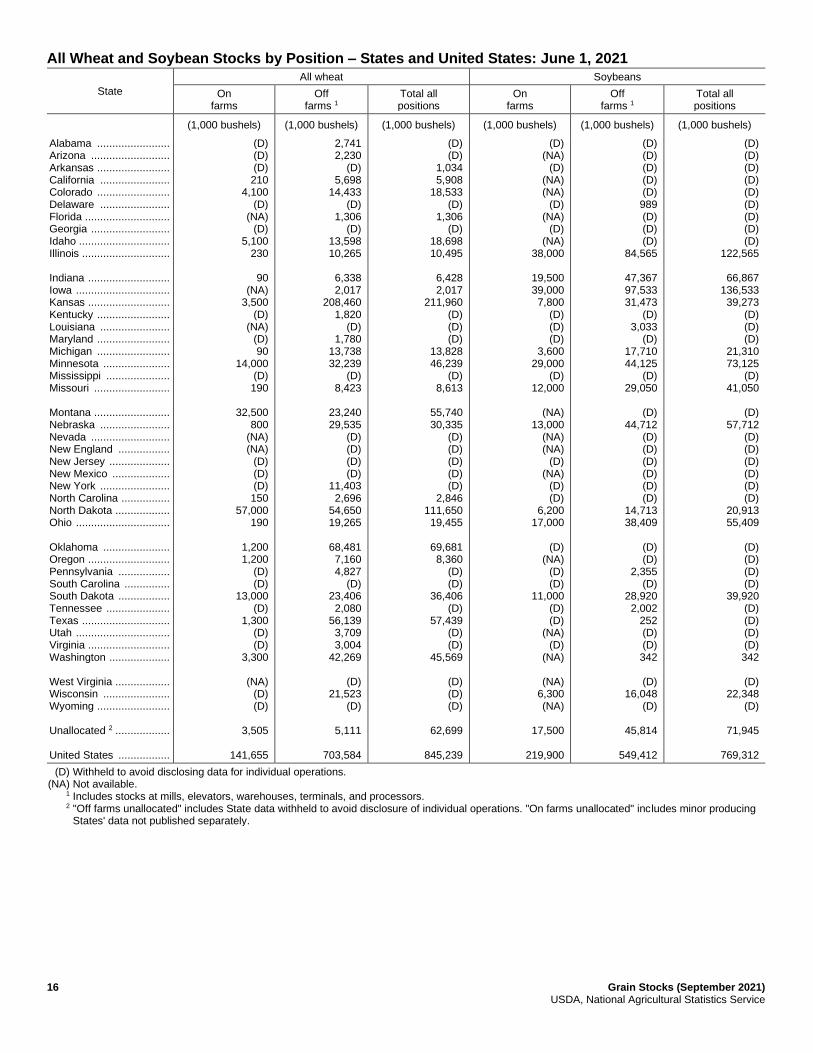
All wheat stored in all positions on September 1, 2021 totaled 1.78 billion bushels, down 18 percent from a year ago.
On-farm stocks are estimated at 419 million bushels, down 41 percent from last September. Off-farm stocks, at
1.36 billion bushels, are down 6 percent from a year ago. The June - August 2021 indicated disappearance is
711 million bushels, up 2 percent from the same period a year earlier.
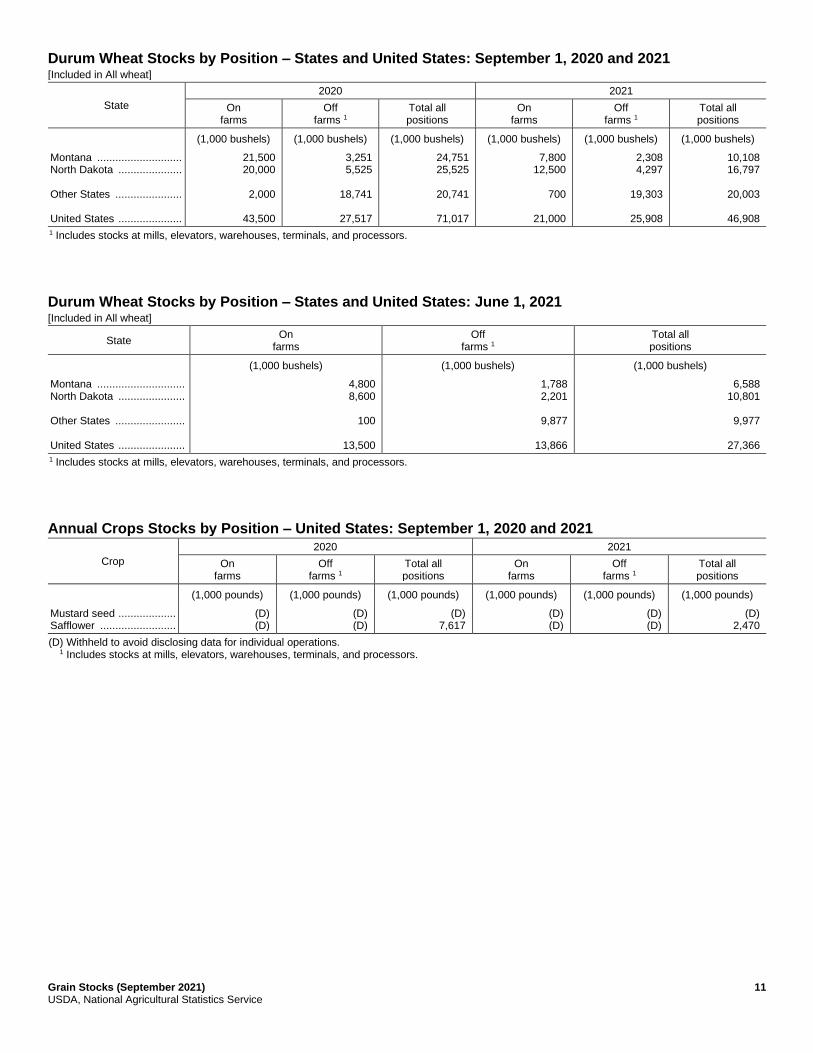
Durum wheat stocks in all positions on September 1, 2021 totaled 46.9 million bushels, down 34 percent from a year
ago. On-farm stocks, at 21.0 million bushels, are down 52 percent from September 1, 2020. Off-farm stocks totaled
25.9 million bushels, down 6 percent from a year ago. The June - August 2021 indicated disappearance of
17.7 million bushels is down 56 percent from the same period a year earlier.
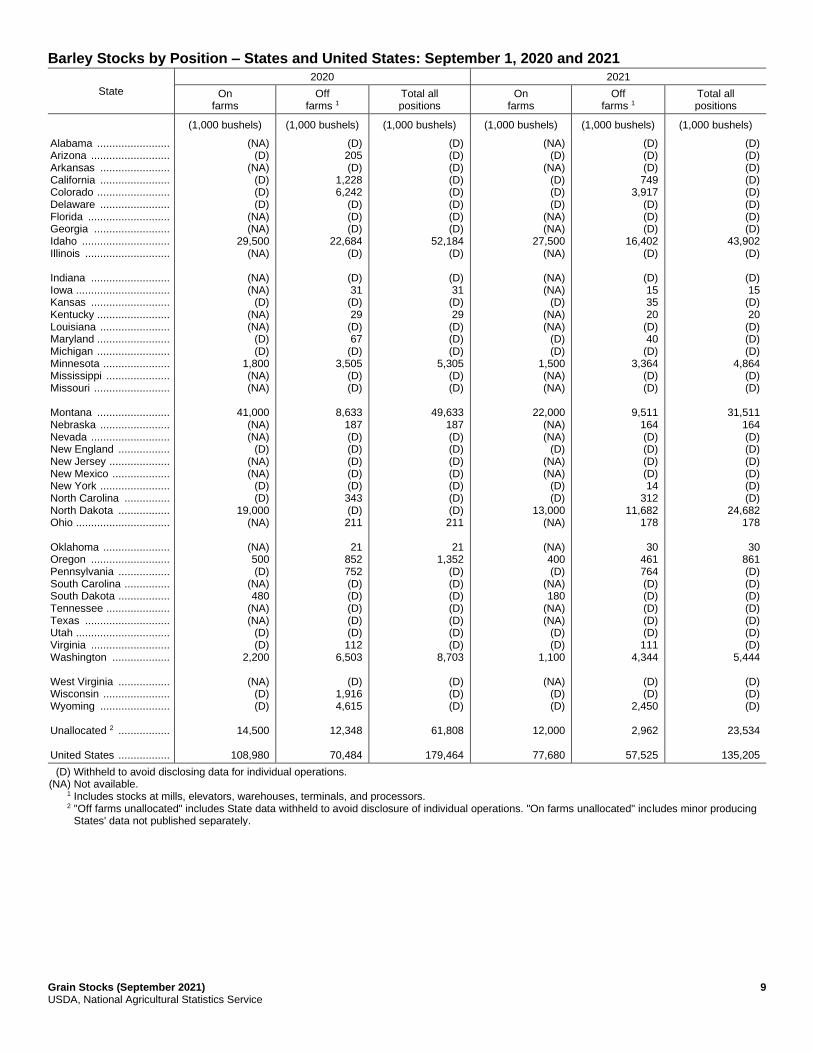
Barley stocks in all positions on September 1, 2021 totaled 135 million bushels, down 25 percent from
September 1, 2020. On-farm stocks are estimated at 77.7 million bushels, 29 percent below a year ago. Off-farm stocks, at
57.5 million bushels, are 18 percent below September 2020. The June - August 2021 indicated disappearance is
53.9 million bushels, 25 percent below the same period a year earlier.
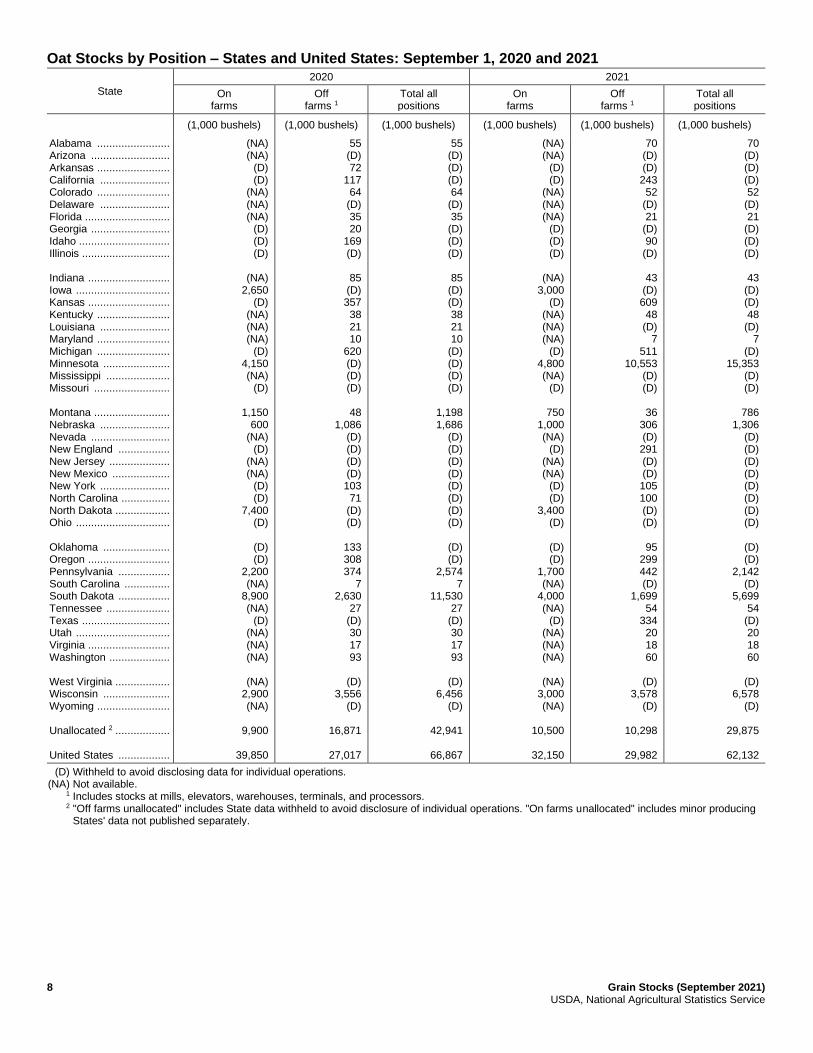
Oats stored in all positions on September 1, 2021 totaled 62.1 million bushels, 7 percent below the stocks on
September 1, 2020. Of the total stocks on hand, 32.2 million bushels are stored on farms, 19 percent lower than a year
ago. Off-farm stocks totaled 30.0 million bushels, 11 percent above the previous year. Indicated disappearance during
June - August 2021 totaled 15.8 million bushels, compared with 35.6 million bushels during the same period a year ago.
Old crop grain sorghum stored in all positions on September 1, 2021 totaled 20.3 million bushels, down 32 percent from
a year ago. On-farm stocks, at 588 thousand bushels, are down 80 percent from last year. Off-farm stocks, at
19.8 million bushels, are down 27 percent from September 1, 2020. The June - August 2021 indicated disappearance from
all positions is 20.6 million bushels, down 51 percent from the same period a year ago.
Old crop sunflower stocks in all positions on September 1, 2021 totaled 388 million pounds, up 100 percent from a year
ago. All stocks stored on farms totaled 68.1 million pounds and off-farm stocks totaled 320 million pounds. Stocks of oil
type sunflower seed are 298 million pounds; of this total, 60.3 million pounds are on-farm stocks and 238 million pounds
are off-farm stocks. Non-oil sunflower stocks totaled 89.6 million pounds, with 7.80 million pounds stored on the farm
and 81.8 million pounds stored off the farm.
This report was approved on September 30, 2021.
Secretary of Agriculture
Designate
Seth Meyer
Agricultural Statistics Board
Chairperson
Joseph L. Parsons

Grain Stocks (September 2021) 3 USDA, National Agricultural Statistics Service
Contents
Grain Stocks by Position and Month in Domestic Units – United States: 2020 and 2021 ................................................... 4
Grain Stocks by Position and Month in Metric Units – United States: 2020 and 2021 ........................................................ 5
Corn Stocks by Position – States and United States: September 1, 2020 and 2021 ............................................................. 6
Sorghum Stocks by Position – States and United States: September 1, 2020 and 2021 ....................................................... 7
Oat Stocks by Position – States and United States: September 1, 2020 and 2021 ................................................................ 8
Barley Stocks by Position – States and United States: September 1, 2020 and 2021 ........................................................... 9
All Wheat Stocks by Position – States and United States: September 1, 2020 and 2021 ................................................... 10
Durum Wheat Stocks by Position – States and United States: September 1, 2020 and 2021 ............................................. 11
Durum Wheat Stocks by Position – States and United States: June 1, 2021 ...................................................................... 11
Annual Crops Stocks by Position – United States: September 1, 2020 and 2021 .............................................................. 11
Soybean Stocks by Position – States and United States: September 1, 2020 and 2021 ...................................................... 12
Sunflower Stocks by Position and Type – States and United States: September 1, 2020 and 2021 ................................... 13
Sunflower Stocks by Position and Type – States and United States: March 1, 2021 ......................................................... 13
Corn and Sorghum Stocks by Position – States and United States: June 1, 2021 .............................................................. 14
Oat and Barley Stocks by Position – States and United States: June 1, 2021 ..................................................................... 15
All Wheat and Soybean Stocks by Position – States and United States: June 1, 2021 ....................................................... 16
Corn Area Planted for All Purposes and Harvested for Grain, Yield, and Production – States and
United States: 2020 ............................................................................................................................................................. 17
Corn for Silage Area Harvested, Yield, and Production – States and United States: 2020 ................................................ 18
Soybeans for Beans Area Planted and Harvested, Yield, and Production – States and United States: 2020 ..................... 19
Statistical Methodology ...................................................................................................................................................... 20
Information Contacts .......................................................................................................................................................... 21

4 Grain Stocks (September 2021) USDA, National Agricultural Statistics Service
Grain Stocks by Position and Month in Domestic Units – United States: 2020 and 2021 [Blank data cells indicate estimation period has not yet begun]
Date
2020 2021
On farms
Off farms 1
Total all positions
On farms
Off farms 1
Total all positions
(1,000 bushels) (1,000 bushels) (1,000 bushels) (1,000 bushels) (1,000 bushels) (1,000 bushels)
Corn March 1 ........................ June 1 .......................... September 1 ................ December 1 .................
4,454,000 2,867,000
750,800 7,046,000
3,497,576 2,135,987 1,168,662 4,247,750
7,951,576 5,002,987 1,919,462
11,293,750
4,036,500 1,743,600
394,900
3,659,648 2,366,140
841,581
7,696,148 4,109,740 1,236,481
Sorghum March 1 ........................ June 1 .......................... September 1 ................ December 1 .................
17,220 8,360 2,955
21,300
147,725 64,227 27,140
198,386
164,945 72,587 30,095
219,686
5,410 2,050
588
131,477 38,929 19,758
136,887 40,979 20,346
Oats March 1 ........................ June 1 .......................... September 1 ................ December 1 .................
16,970 10,070 39,850 28,830
30,722 26,693 27,017 33,712
47,692 36,763 66,867 62,542
16,880 12,540 32,150
34,585 25,513 29,982
51,465 38,053 62,132
Barley March 1 ........................ June 1 .......................... September 1 ................ December 1 .................
51,580 25,100
108,980 85,190
63,760 55,153 70,484 63,437
115,340 80,253
179,464 148,627
55,850 21,390 77,680
64,628 50,028 57,525
120,478 71,418
135,205
All wheat March 1 ........................ June 1 .......................... September 1 ................ December 1 .................
338,690 228,585 705,050 483,470
1,076,724 799,699
1,452,775 1,219,220
1,415,414 1,028,284 2,157,825 1,702,690
283,920 141,655 419,190
1,026,870 703,584
1,360,748
1,310,790 845,239
1,779,938
Durum wheat 2 March 1 ........................ June 1 .......................... September 1 ................ December 1 .................
23,500 17,700 43,500 39,000
27,898 24,230 27,517 22,639
51,398 41,930 71,017 61,639
22,600 13,500 21,000
19,592 13,866 25,908
42,192 27,366 46,908
Soybeans March 1 ........................ June 1 .......................... September 1 ................ December 1 .................
1,011,500 633,000 141,200
1,308,500
1,243,382 748,394 383,341
1,638,240
2,254,882 1,381,394
524,541 2,946,740
594,000 219,900 68,100
967,684 549,412 188,079
1,561,684 769,312 256,179
1 Includes stocks at mills, elevators, warehouses, terminals, and processors. 2 Included in All wheat.

Grain Stocks (September 2021) 5 USDA, National Agricultural Statistics Service
Grain Stocks by Position and Month in Metric Units – United States: 2020 and 2021 [Data may not add to totals due to rounding. Blank data cells indicate estimation period has not yet begun.]
Date
2020 2021
On farms
Off farms 1
Total all positions
On farms
Off farms 1
Total all positions
(metric tons) (metric tons) (metric tons) (metric tons) (metric tons) (metric tons)
Corn March 1 ........................ June 1 .......................... September 1 ................. December 1 ..................
113,136,810 72,825,150 19,071,200
178,976,640
88,842,520 54,256,570 29,685,380
107,897,820
201,979,330 127,081,720 48,756,580
286,874,460
102,531,820 44,289,480 10,030,920
92,959,340 60,102,720 21,377,140
195,491,160 104,392,200 31,408,060
Sorghum March 1 ........................ June 1 .......................... September 1 ................. December 1 ..................
437,410 212,350 75,060
541,040
3,752,390 1,631,440
689,390 5,039,240
4,189,800 1,843,790
764,450 5,580,280
137,420 52,070 14,940
3,339,670 988,840 501,880
3,477,090 1,040,910
516,810
Oats March 1 ........................ June 1 .......................... September 1 ................. December 1 ..................
246,320 146,170 578,420 418,470
445,930 387,450 392,150 489,330
692,250 533,610 970,570 907,790
245,010 182,020 466,660
502,000 370,320 435,190
747,010 552,340 901,840
Barley March 1 ........................ June 1 .......................... September 1 ................. December 1 ..................
1,123,020 546,490
2,372,760 1,854,790
1,388,210 1,200,810 1,534,610 1,381,180
2,511,230 1,747,300 3,907,370 3,235,970
1,215,990 465,710
1,691,280
1,407,110 1,089,230 1,252,460
2,623,100 1,554,940 2,943,740
All wheat March 1 ........................ June 1 .......................... September 1 ................. December 1 ..................
9,217,630 6,221,060
19,188,320 13,157,900
29,303,630 21,764,240 39,538,060 33,181,730
38,521,260 27,985,300 58,726,370 46,339,630
7,727,040 3,855,220
11,408,480
27,946,820 19,148,420 37,033,490
35,673,860 23,003,640 48,441,970
Durum wheat 2 March 1 ........................ June 1 .......................... September 1 ................. December 1 ..................
639,570 481,720
1,183,880 1,061,410
759,260 659,430 748,890 616,130
1,398,820 1,141,150 1,932,770 1,677,540
615,070 367,410 571,530
533,210 377,370 705,100
1,148,280 744,780
1,276,630
Soybeans March 1 ........................ June 1 .......................... September 1 ................. December 1 ..................
27,528,520 17,227,440 3,842,830
35,611,530
33,839,310 20,367,950 10,432,830 44,585,590
61,367,830 37,595,380 14,275,670 80,197,120
16,166,030 5,984,700 1,853,380
26,336,040 14,952,540 5,118,670
42,502,070 20,937,240 6,972,050
1 Includes stocks at mills, elevators, warehouses, terminals, and processors. 2 Included in All wheat.

6 Grain Stocks (September 2021) USDA, National Agricultural Statistics Service
Corn Stocks by Position – States and United States: September 1, 2020 and 2021
State
2020 2021
On farms
Off farms 1
Total all positions
On farms
Off farms 1
Total all positions
(1,000 bushels) (1,000 bushels) (1,000 bushels) (1,000 bushels) (1,000 bushels) (1,000 bushels)
Alabama ........................ Arizona .......................... Arkansas ........................ California ....................... Colorado ........................ Delaware ....................... Florida ............................ Georgia .......................... Idaho .............................. Illinois ............................. Indiana ........................... Iowa ............................... Kansas ........................... Kentucky ........................ Louisiana ....................... Maryland ........................ Michigan ........................ Minnesota ...................... Mississippi ..................... Missouri ......................... Montana ......................... Nebraska ....................... Nevada .......................... New England ................. New Jersey .................... New Mexico ................... New York ....................... North Carolina ................ North Dakota .................. Ohio ............................... Oklahoma ...................... Oregon ........................... Pennsylvania ................. South Carolina ............... South Dakota ................. Tennessee ..................... Texas ............................. Utah ............................... Virginia ........................... Washington .................... West Virginia .................. Wisconsin ...................... Wyoming ........................ Unallocated 2 .................. United States .................
(D) (D) (D) (D)
5,300 (D) (D) (D) (D)
52,000
30,000 140,000 17,500 4,500
(D) (D)
17,500 130,000
(D) 25,000
(D)
87,000 (NA) (NA)
(D) (D) (D)
1,000 40,000 25,000
(D) (D)
35,000 (D)
57,000 (D) (D) (D) (D) (D)
(D)
40,000 (D)
44,000
750,800
1,855 2,080 1,114 5,154 9,988 3,810
(D) 4,211 2,837
199,456
59,603 233,270 77,600 6,097 3,723 2,529
18,339 117,389
4,791 27,333
(D)
139,730 (D) (D) (D) (D)
1,379 4,299
46,794 39,643
2,565
(D) 5,071
842 55,837 3,781
25,956 (D)
1,686 4,458
(D)
52,145 (D)
3,297
1,168,662
(D) (D) (D) (D)
15,288 (D) (D) (D) (D)
251,456
89,603 373,270 95,100 10,597
(D) (D)
35,839 247,389
(D) 52,333
(D)
226,730 (D) (D) (D) (D) (D)
5,299 86,794 64,643
(D) (D)
40,071 (D)
112,837 (D) (D) (D) (D) (D)
(D)
92,145 (D)
120,068
1,919,462
(D) (D) (D) (D)
3,600 (D) (D) (D) (D)
44,000
25,000 55,000 10,500 4,900
(D) (D)
8,800 42,000
(D) 28,000
(D)
47,500 (NA) (NA)
(D) (D) (D)
1,400 5,200
22,500
(D) (D)
10,000 (D)
26,500 (D) (D) (D) (D) (D)
(D)
21,000 (D)
39,000
394,900
2,235 1,671 3,204 6,793 6,060
(D) 67
4,269 3,472
83,820
48,457 199,370 48,552 5,349
21,565 2,278
15,454 66,103 4,387
21,902
(D) 115,557
(D) (D) (D) (D)
1,319 6,873
22,251 31,856
1,260
(D) 5,269 1,098
37,305 3,942
27,709 300
1,700 1,671
(D)
34,734 (D)
3,729
841,581
(D) (D) (D) (D)
9,660 (D) (D) (D) (D)
127,820
73,457 254,370 59,052 10,249
(D) (D)
24,254 108,103
(D) 49,902
(D)
163,057 (D) (D) (D) (D) (D)
8,273 27,451 54,356
(D) (D)
15,269 (D)
63,805 (D) (D) (D) (D) (D)
(D)
55,734 (D)
131,669
1,236,481
(D) Withheld to avoid disclosing data for individual operations. (NA) Not available. 1 Includes stocks at mills, elevators, warehouses, terminals, and processors. 2 "Off farms unallocated" includes State data withheld to avoid disclosure of individual operations. "On farms unallocated" includes minor producing
States' data not published separately.

Grain Stocks (September 2021) 7 USDA, National Agricultural Statistics Service
Sorghum Stocks by Position – States and United States: September 1, 2020 and 2021
State
2020 2021
On farms
Off farms 1
Total all positions
On farms
Off farms 1
Total all positions
(1,000 bushels) (1,000 bushels) (1,000 bushels) (1,000 bushels) (1,000 bushels) (1,000 bushels)
Alabama ........................ Arizona .......................... Arkansas ....................... California ....................... Colorado ........................ Delaware ....................... Florida ........................... Georgia ......................... Idaho ............................. Illinois ............................ Indiana .......................... Iowa ............................... Kansas .......................... Kentucky ........................ Louisiana ....................... Maryland ........................ Michigan ........................ Minnesota ...................... Mississippi ..................... Missouri ......................... Montana ........................ Nebraska ....................... Nevada .......................... New England ................. New Jersey .................... New Mexico ................... New York ....................... North Carolina ............... North Dakota ................. Ohio ............................... Oklahoma ...................... Oregon .......................... Pennsylvania ................. South Carolina ............... South Dakota ................. Tennessee ..................... Texas ............................ Utah ............................... Virginia .......................... Washington ................... West Virginia ................. Wisconsin ...................... Wyoming ....................... Unallocated 2 ................. United States .................
(NA) (NA) (NA) (NA)
(D) (NA) (NA) (NA) (NA) (NA)
(NA) (NA)
2,200 (NA) (NA) (NA) (NA) (NA) (NA) (NA)
(NA)
(D) (NA) (NA) (NA) (NA) (NA) (NA) (NA) (NA)
(D)
(NA) (NA) (NA)
(D) (NA) 150
(NA) (NA) (NA)
(NA) (NA) (NA)
605
2,955
(D) (D) (D) (D) 327 (D) (D) (D) (D) (D)
(D) (D)
13,122 (D) (D) (D) (D) (D) (D) 216
(D)
1,061 (D) (D) (D) (D) (D) (D) (D) (D)
691 (D) (D) (D) (D) (D)
9,581 (D) (D) (D)
(D) (D) (D)
2,142
27,140
(D) (D) (D) (D) (D) (D) (D) (D) (D) (D)
(D) (D)
15,322 (D) (D) (D) (D) (D) (D) 216
(D) (D) (D) (D) (D) (D) (D) (D) (D) (D)
(D) (D) (D) (D) (D) (D)
9,731 (D) (D) (D)
(D) (D) (D)
4,826
30,095
(NA) (NA) (NA) (NA)
(D) (NA) (NA) (NA) (NA) (NA)
(NA) (NA) 340
(NA) (NA) (NA) (NA) (NA) (NA) (NA)
(NA)
(D) (NA) (NA) (NA) (NA) (NA) (NA) (NA) (NA)
(D)
(NA) (NA) (NA)
(D) (NA) 120
(NA) (NA) (NA)
(NA) (NA) (NA)
128
588
(D) (D) (D) (D) 400 (D) (D) (D) (D) (D)
(D) (D)
7,715 (D) (D) (D) (D) (D) (D) 188
(D) 835 (D) (D) (D) (D) (D) (D) (D) (D)
666 (D) (D) (D) 470 (D)
7,182 (D) (D) (D)
(D) (D) (D)
2,302
19,758
(D) (D) (D) (D) (D) (D) (D) (D) (D) (D)
(D) (D)
8,055 (D) (D) (D) (D) (D) (D) 188
(D) (D) (D) (D) (D) (D) (D) (D) (D) (D)
(D) (D) (D) (D) (D) (D)
7,302 (D) (D) (D)
(D) (D) (D)
4,801
20,346
(D) Withheld to avoid disclosing data for individual operations. (NA) Not available. 1 Includes stocks at mills, elevators, warehouses, terminals, and processors. 2 "Off farms unallocated" includes State data withheld to avoid disclosure of individual operations. "On farms unallocated" includes minor producing
States' data not published separately.
8 Grain Stocks (September 2021) USDA, National Agricultural Statistics Service
Oat Stocks by Position – States and United States: September 1, 2020 and 2021
State
2020 2021
On farms
Off farms 1
Total all positions
On farms
Off farms 1
Total all positions
(1,000 bushels) (1,000 bushels) (1,000 bushels) (1,000 bushels) (1,000 bushels) (1,000 bushels)
Alabama ........................ Arizona .......................... Arkansas ........................ California ....................... Colorado ........................ Delaware ....................... Florida ............................ Georgia .......................... Idaho .............................. Illinois ............................. Indiana ........................... Iowa ............................... Kansas ........................... Kentucky ........................ Louisiana ....................... Maryland ........................ Michigan ........................ Minnesota ...................... Mississippi ..................... Missouri ......................... Montana ......................... Nebraska ....................... Nevada .......................... New England ................. New Jersey .................... New Mexico ................... New York ....................... North Carolina ................ North Dakota .................. Ohio ............................... Oklahoma ...................... Oregon ........................... Pennsylvania ................. South Carolina ............... South Dakota ................. Tennessee ..................... Texas ............................. Utah ............................... Virginia ........................... Washington .................... West Virginia .................. Wisconsin ...................... Wyoming ........................ Unallocated 2 .................. United States .................
(NA) (NA)
(D) (D)
(NA) (NA) (NA)
(D) (D) (D)
(NA)
2,650 (D)
(NA) (NA) (NA)
(D) 4,150 (NA)
(D)
1,150 600
(NA) (D)
(NA) (NA)
(D) (D)
7,400 (D)
(D) (D)
2,200 (NA)
8,900 (NA)
(D) (NA) (NA) (NA)
(NA)
2,900 (NA)
9,900
39,850
55 (D) 72
117 64
(D) 35 20
169 (D)
85
(D) 357 38 21 10
620 (D) (D) (D)
48
1,086 (D) (D) (D) (D) 103 71
(D) (D)
133 308 374
7 2,630
27 (D) 30 17 93
(D)
3,556 (D)
16,871
27,017
55 (D) (D) (D) 64
(D) 35
(D) (D) (D)
85
(D) (D) 38 21 10
(D) (D) (D) (D)
1,198 1,686
(D) (D) (D) (D) (D) (D) (D) (D)
(D) (D)
2,574 7
11,530 27
(D) 30 17 93
(D)
6,456 (D)
42,941
66,867
(NA) (NA)
(D) (D)
(NA) (NA) (NA)
(D) (D) (D)
(NA)
3,000 (D)
(NA) (NA) (NA)
(D) 4,800 (NA)
(D)
750 1,000 (NA)
(D) (NA) (NA)
(D) (D)
3,400 (D)
(D) (D)
1,700 (NA)
4,000 (NA)
(D) (NA) (NA) (NA)
(NA)
3,000 (NA)
10,500
32,150
70 (D) (D) 243 52
(D) 21
(D) 90
(D)
43 (D) 609 48
(D) 7
511 10,553
(D) (D)
36
306 (D) 291 (D) (D) 105 100 (D) (D)
95
299 442 (D)
1,699 54
334 20 18 60
(D)
3,578 (D)
10,298
29,982
70 (D) (D) (D) 52
(D) 21
(D) (D) (D)
43
(D) (D) 48
(D) 7
(D) 15,353
(D) (D)
786
1,306 (D) (D) (D) (D) (D) (D) (D) (D)
(D) (D)
2,142 (D)
5,699 54
(D) 20 18 60
(D)
6,578 (D)
29,875
62,132
(D) Withheld to avoid disclosing data for individual operations. (NA) Not available. 1 Includes stocks at mills, elevators, warehouses, terminals, and processors. 2 "Off farms unallocated" includes State data withheld to avoid disclosure of individual operations. "On farms unallocated" includes minor producing
States' data not published separately.
Grain Stocks (September 2021) 9 USDA, National Agricultural Statistics Service
Barley Stocks by Position – States and United States: September 1, 2020 and 2021
State
2020 2021
On farms
Off farms 1
Total all positions
On farms
Off farms 1
Total all positions
(1,000 bushels) (1,000 bushels) (1,000 bushels) (1,000 bushels) (1,000 bushels) (1,000 bushels)
Alabama ........................ Arizona .......................... Arkansas ....................... California ....................... Colorado ........................ Delaware ....................... Florida ........................... Georgia ......................... Idaho ............................. Illinois ............................ Indiana .......................... Iowa ............................... Kansas .......................... Kentucky ........................ Louisiana ....................... Maryland ........................ Michigan ........................ Minnesota ...................... Mississippi ..................... Missouri ......................... Montana ........................ Nebraska ....................... Nevada .......................... New England ................. New Jersey .................... New Mexico ................... New York ....................... North Carolina ............... North Dakota ................. Ohio ............................... Oklahoma ...................... Oregon .......................... Pennsylvania ................. South Carolina ............... South Dakota ................. Tennessee ..................... Texas ............................ Utah ............................... Virginia .......................... Washington ................... West Virginia ................. Wisconsin ...................... Wyoming ....................... Unallocated 2 ................. United States .................
(NA) (D)
(NA) (D) (D) (D)
(NA) (NA)
29,500 (NA)
(NA) (NA)
(D) (NA) (NA)
(D) (D)
1,800 (NA) (NA)
41,000
(NA) (NA)
(D) (NA) (NA)
(D) (D)
19,000 (NA)
(NA) 500 (D)
(NA) 480
(NA) (NA)
(D) (D)
2,200
(NA) (D) (D)
14,500
108,980
(D) 205 (D)
1,228 6,242
(D) (D) (D)
22,684 (D)
(D) 31
(D) 29
(D) 67
(D) 3,505
(D) (D)
8,633
187 (D) (D) (D) (D) (D) 343 (D) 211
21
852 752 (D) (D) (D) (D) (D) 112
6,503
(D) 1,916 4,615
12,348
70,484
(D) (D) (D) (D) (D) (D) (D) (D)
52,184 (D)
(D) 31
(D) 29
(D) (D) (D)
5,305 (D) (D)
49,633
187 (D) (D) (D) (D) (D) (D) (D) 211
21
1,352 (D) (D) (D) (D) (D) (D) (D)
8,703
(D) (D) (D)
61,808
179,464
(NA) (D)
(NA) (D) (D) (D)
(NA) (NA)
27,500 (NA)
(NA) (NA)
(D) (NA) (NA)
(D) (D)
1,500 (NA) (NA)
22,000
(NA) (NA)
(D) (NA) (NA)
(D) (D)
13,000 (NA)
(NA) 400 (D)
(NA) 180
(NA) (NA)
(D) (D)
1,100
(NA) (D) (D)
12,000
77,680
(D) (D) (D) 749
3,917 (D) (D) (D)
16,402 (D)
(D) 15 35 20
(D) 40
(D) 3,364
(D) (D)
9,511
164 (D) (D) (D) (D) 14
312 11,682
178
30 461 764 (D) (D) (D) (D) (D) 111
4,344
(D) (D)
2,450
2,962
57,525
(D) (D) (D) (D) (D) (D) (D) (D)
43,902 (D)
(D) 15
(D) 20
(D) (D) (D)
4,864 (D) (D)
31,511
164 (D) (D) (D) (D) (D) (D)
24,682 178
30
861 (D) (D) (D) (D) (D) (D) (D)
5,444
(D) (D) (D)
23,534
135,205
(D) Withheld to avoid disclosing data for individual operations. (NA) Not available. 1 Includes stocks at mills, elevators, warehouses, terminals, and processors. 2 "Off farms unallocated" includes State data withheld to avoid disclosure of individual operations. "On farms unallocated" includes minor producing
States' data not published separately.
10 Grain Stocks (September 2021) USDA, National Agricultural Statistics Service
All Wheat Stocks by Position – States and United States: September 1, 2020 and 2021
State
2020 2021
On farms
Off farms 1
Total all positions
On farms
Off farms 1
Total all positions
(1,000 bushels) (1,000 bushels) (1,000 bushels) (1,000 bushels) (1,000 bushels) (1,000 bushels)
Alabama ........................ Arizona .......................... Arkansas ........................ California ....................... Colorado ........................ Delaware ....................... Florida ............................ Georgia .......................... Idaho .............................. Illinois ............................. Indiana ........................... Iowa ............................... Kansas ........................... Kentucky ........................ Louisiana ....................... Maryland ........................ Michigan ........................ Minnesota ...................... Mississippi ..................... Missouri ......................... Montana ......................... Nebraska ....................... Nevada .......................... New England ................. New Jersey .................... New Mexico ................... New York ....................... North Carolina ................ North Dakota .................. Ohio ............................... Oklahoma ...................... Oregon ........................... Pennsylvania ................. South Carolina ............... South Dakota ................. Tennessee ..................... Texas ............................. Utah ............................... Virginia ........................... Washington .................... West Virginia .................. Wisconsin ...................... Wyoming ........................ Unallocated 2 .................. United States .................
(D) (D) 150
1,100 16,500
(D) (NA)
(D) 44,500 2,900
1,500 (NA)
32,000 (D)
(NA) (D)
4,900 63,000
(D) 6,600
169,000
4,200 (NA) (NA)
(D) (D) (D)
3,500 225,000
2,700
13,500 9,700
(D) (D)
42,000 (D)
5,800 (D) (D)
25,500
(NA) (D) (D)
31,000
705,050
5,538 5,107 3,165
12,754 33,403 2,178
(D) 3,235
61,233 25,510
18,270
(D) 396,936 13,466
(D) 5,738
36,072 34,879
(D) 18,002
48,591 48,065
(D) (D) 555 (D)
11,677 9,252
84,173 56,858
120,104 39,719 10,996 1,501
43,794 5,702
87,829 5,856 8,328
156,593
(D) 26,380
(D)
11,316
1,452,775
(D) (D)
3,315 13,854 49,903
(D) (D) (D)
105,733 28,410
19,770
(D) 428,936
(D) (D) (D)
40,972 97,879
(D) 24,602
217,591 52,265
(D) (D) (D) (D) (D)
12,752 309,173 59,558
133,604 49,419
(D) (D)
85,794 (D)
93,629 (D) (D)
182,093
(D) (D) (D)
148,573
2,157,825
(D) (D) (D) 850
22,500 (D)
(NA) (D)
29,000 6,500
1,700 (NA)
26,500 (D)
(NA) (D)
4,100 36,000
(D) 6,500
71,000 6,900 (NA) (NA)
(D) (D) (D)
2,200 99,000 6,500
12,000 5,200
(D) (D)
25,500 (D)
6,600 (D) (D)
11,000
(NA) (D) (D)
39,640
419,190
5,344 5,616
(D) 9,609
41,036 723
1,292 5,178
36,596 35,356
23,629 3,410
379,140 16,106 3,425 3,862
38,956 38,965 1,503
24,214
34,548 51,151
(D) (D) 642 (D)
11,905 7,527
99,564 58,473
115,287 17,632 9,233 1,477
33,716 7,400
80,722 5,549 7,654
102,751
(D) 36,682
(D)
4,875
1,360,748
(D) (D)
2,649 10,459 63,536
(D) 1,292
(D) 65,596 41,856
25,329 3,410
405,640 (D)
3,425 (D)
43,056 74,965
(D) 30,714
105,548 58,051
(D) (D) (D) (D) (D)
9,727 198,564 64,973
127,287 22,832
(D) (D)
59,216 (D)
87,322 (D) (D)
113,751
(D) (D) (D)
160,740
1,779,938
(D) Withheld to avoid disclosing data for individual operations. (NA) Not available. 1 Includes stocks at mills, elevators, warehouses, terminals, and processors. 2 "Off farms unallocated" includes State data withheld to avoid disclosure of individual operations. "On farms unallocated" includes minor producing
States' data not published separately.
Grain Stocks (September 2021) 11 USDA, National Agricultural Statistics Service
Durum Wheat Stocks by Position – States and United States: September 1, 2020 and 2021 [Included in All wheat]
State
2020 2021
On farms
Off farms 1
Total all positions
On farms
Off farms 1
Total all positions
(1,000 bushels) (1,000 bushels) (1,000 bushels) (1,000 bushels) (1,000 bushels) (1,000 bushels)
Montana ............................ North Dakota ..................... Other States ...................... United States .....................
21,500 20,000
2,000
43,500
3,251 5,525
18,741
27,517
24,751 25,525
20,741
71,017
7,800 12,500
700
21,000
2,308 4,297
19,303
25,908
10,108 16,797
20,003
46,908
1 Includes stocks at mills, elevators, warehouses, terminals, and processors.
Durum Wheat Stocks by Position – States and United States: June 1, 2021 [Included in All wheat]
State On
farms Off
farms 1 Total all positions
(1,000 bushels) (1,000 bushels) (1,000 bushels)
Montana ............................. North Dakota ...................... Other States ....................... United States ......................
4,800 8,600
100
13,500
1,788 2,201
9,877
13,866
6,588 10,801
9,977
27,366
1 Includes stocks at mills, elevators, warehouses, terminals, and processors.
Annual Crops Stocks by Position – United States: September 1, 2020 and 2021
Crop
2020 2021
On farms
Off farms 1
Total all positions
On farms
Off farms 1
Total all positions
(1,000 pounds) (1,000 pounds) (1,000 pounds) (1,000 pounds) (1,000 pounds) (1,000 pounds)
Mustard seed ................... Safflower .........................
(D) (D)
(D) (D)
(D) 7,617
(D) (D)
(D) (D)
(D) 2,470
(D) Withheld to avoid disclosing data for individual operations. 1 Includes stocks at mills, elevators, warehouses, terminals, and processors.
12 Grain Stocks (September 2021) USDA, National Agricultural Statistics Service
Soybean Stocks by Position – States and United States: September 1, 2020 and 2021
State
2020 2021
On farms
Off farms 1
Total all positions
On farms
Off farms 1
Total all positions
(1,000 bushels) (1,000 bushels) (1,000 bushels) (1,000 bushels) (1,000 bushels) (1,000 bushels)
Alabama ....................... Arizona ......................... Arkansas ....................... California ...................... Colorado ....................... Delaware ...................... Florida ........................... Georgia ......................... Idaho ............................. Illinois ............................ Indiana .......................... Iowa .............................. Kansas .......................... Kentucky ....................... Louisiana ...................... Maryland ....................... Michigan ....................... Minnesota ..................... Mississippi .................... Missouri ........................ Montana ........................ Nebraska ...................... Nevada ......................... New England ................ New Jersey ................... New Mexico .................. New York ...................... North Carolina ............... North Dakota ................. Ohio .............................. Oklahoma ..................... Oregon .......................... Pennsylvania ................ South Carolina .............. South Dakota ................ Tennessee .................... Texas ............................ Utah .............................. Virginia .......................... Washington ................... West Virginia ................. Wisconsin ..................... Wyoming ....................... Unallocated 2 ................. United States ................
(D) (NA)
(D) (NA) (NA)
(D) (NA)
(D) (NA)
13,000
7,000 26,000 4,200
(D) (D) (D)
2,600 17,000
(D) 12,000
(NA)
14,500 (NA) (NA)
(D) (NA)
(D) (D)
10,500 8,600
(D)
(NA) (D) (D)
13,000 (D) (D)
(NA) (D)
(NA)
(NA) 2,900 (NA)
9,900
141,200
6,122 (D) (D) (D) (D) 227 (D) (D) (D)
52,958
17,973 76,231 20,230 1,575
(D) (D)
9,141 31,349 1,216
15,857
(D) 37,128
(D) (D) (D) (D) (D) (D)
23,876 22,380
(D) (D)
1,825 (D)
29,486 526
1,464 (D) (D)
1,328
(D) 12,087
(D)
20,362
383,341
(D) (D) (D) (D) (D) (D) (D) (D) (D)
65,958
24,973 102,231 24,430
(D) (D) (D)
11,741 48,349
(D) 27,857
(D)
51,628 (D) (D) (D) (D) (D) (D)
34,376 30,980
(D) (D) (D) (D)
42,486 (D) (D) (D) (D)
1,328
(D) 14,987
(D)
43,217
524,541
(D) (NA)
(D) (NA) (NA)
(D) (NA)
(D) (NA)
10,000
4,700 10,500 1,700
(D) (D) (D)
1,100 8,800
(D) 7,600
(NA)
8,400 (NA) (NA)
(D) (NA)
(D) (D)
1,900 2,100
(D)
(NA) (D) (D)
4,800 (D) (D)
(NA) (D)
(NA)
(NA) 1,000 (NA)
5,500
68,100
(D) (D)
2,991 (D) (D) (D) (D)
3,538 (D)
26,248
16,017 31,496 7,224
(D) 3,693
(D) 6,257
19,408 993
12,324
(D) 13,103
(D) (D) (D) (D) (D)
1,990 5,251
11,954
(D) (D) 704 (D)
12,853 144 114 (D)
1,155 (D)
(D)
4,304 (D)
6,318
188,079
(D) (D) (D) (D) (D) (D) (D) (D) (D)
36,248
20,717 41,996 8,924
(D) (D) (D)
7,357 28,208
(D) 19,924
(D)
21,503 (D) (D) (D) (D) (D) (D)
7,151 14,054
(D) (D) (D) (D)
17,653 (D) (D) (D) (D) (D)
(D)
5,304 (D)
27,140
256,179
(D) Withheld to avoid disclosing data for individual operations. (NA) Not available. 1 Includes stocks at mills, elevators, warehouses, terminals, and processors. 2 "Off farms unallocated" includes State data withheld to avoid disclosure of individual operations. "On farms unallocated" includes minor producing
States' data not published separately.

Grain Stocks (September 2021) 13 USDA, National Agricultural Statistics Service
Sunflower Stocks by Position and Type – States and United States: September 1, 2020 and 2021
Varietal type and State
2020 2021
On farms
Off farms 1
Total all positions
On farms
Off farms 1
Total all positions
(1,000 pounds) (1,000 pounds) (1,000 pounds) (1,000 pounds) (1,000 pounds) (1,000 pounds)
Oil North Dakota .................... Other States ..................... United States .................... Non-oil North Dakota .................... Other States ..................... United States .................... All North Dakota .................... Other States ..................... United States ....................
1,400
12,470
13,870
1,900
6,715
8,615
3,300
19,185
22,485
61,573
64,488
126,061
24,243
21,496
45,739
85,816
85,984
171,800
62,973
76,958
139,931
26,143
28,211
54,354
89,116
105,169
194,285
15,500
44,820
60,320
5,100
2,700
7,800
20,600
47,520
68,120
98,327
139,507
237,834
48,151
33,602
81,753
146,478
173,109
319,587
113,827
184,327
298,154
53,251
36,302
89,553
167,078
220,629
387,707
1 Includes stocks at mills, elevators, warehouses, terminals, and processors.
Sunflower Stocks by Position and Type – States and United States: March 1, 2021
Varietal type and State
On farms
Off farms 1
Total all positions
(1,000 Pounds) (1,000 Pounds) (1,000 Pounds)
Oil North Dakota ...................... Other States ....................... United States ...................... Non-oil North Dakota ...................... Other States ....................... United States ...................... All North Dakota ...................... Other States ....................... United States ......................
120,000
211,130
331,130
51,000
32,800
83,800
171,000
243,930
414,930
343,820
213,032
556,852
57,390
44,687
102,077
401,210
257,719
658,929
463,820
424,162
887,982
108,390
77,487
185,877
572,210
501,649
1,073,859
1 Includes stocks at mills, elevators, warehouses, terminals, and processors.

14 Grain Stocks (September 2021) USDA, National Agricultural Statistics Service
Corn and Sorghum Stocks by Position – States and United States: June 1, 2021
State
Corn Sorghum
On farms
Off farms 1
Total all positions
On farms
Off farms 1
Total all positions
(1,000 bushels) (1,000 bushels) (1,000 bushels) (1,000 bushels) (1,000 bushels) (1,000 bushels)
Alabama ........................ Arizona .......................... Arkansas ........................ California ....................... Colorado ........................ Delaware ....................... Florida ............................ Georgia .......................... Idaho .............................. Illinois ............................. Indiana ........................... Iowa ............................... Kansas ........................... Kentucky ........................ Louisiana ....................... Maryland ........................ Michigan ........................ Minnesota ...................... Mississippi ..................... Missouri ......................... Montana ......................... Nebraska ....................... Nevada .......................... New England ................. New Jersey .................... New Mexico ................... New York ....................... North Carolina ................ North Dakota .................. Ohio ............................... Oklahoma ...................... Oregon ........................... Pennsylvania ................. South Carolina ............... South Dakota ................. Tennessee ..................... Texas ............................. Utah ............................... Virginia ........................... Washington .................... West Virginia .................. Wisconsin ...................... Wyoming ........................ Unallocated 2 .................. United States .................
(D) (D) (D) (D)
17,000 (D) (D) (D) (D)
195,000
105,000 340,000 46,000 21,500
(D) (D)
34,000 300,000
(D) 58,000
(D)
210,000 (NA) (NA)
(D) (D) (D)
6,100 33,000 78,000
(D) (D)
26,000 (D)
110,000 (D) (D) (D) (D) (D)
(D)
74,000 (D)
90,000
1,743,600
6,671 1,877 7,247 7,343
16,269 (D) 663
8,367 5,175
416,450
154,866 480,013 155,387 26,979 19,490 10,873 46,892
177,600 9,501
61,623
52 293,894
(D) (D) (D) (D) (D)
19,432 46,170
101,312
4,004 (D)
10,642 3,324
81,936 16,740 43,975
(D) 7,634 8,539
(D)
104,136 (D)
11,064
2,366,140
(D) (D) (D) (D)
33,269 (D) (D) (D) (D)
611,450
259,866 820,013 201,387 48,479
(D) (D)
80,892 477,600
(D) 119,623
(D)
503,894 (D) (D) (D) (D) (D)
25,532 79,170
179,312
(D) (D)
36,642 (D)
191,936 (D) (D) (D) (D) (D)
(D)
178,136 (D)
262,539
4,109,740
(NA) (NA) (NA) (NA)
(D) (NA) (NA) (NA) (NA) (NA)
(NA) (NA)
1,250 (NA) (NA) (NA) (NA) (NA) (NA) (NA)
(NA) 350
(NA) (NA) (NA) (NA) (NA) (NA) (NA) (NA)
(D)
(NA) (NA) (NA)
(D) (NA) 200
(NA) (NA) (NA)
(NA) (NA) (NA)
250
2,050
(D) (D) (D) (D)
1,894 (D) (D) (D) (D) (D)
(D) (D)
21,971 (D) (D) (D) (D) (D) (D) 367
(D)
1,255 (D) (D) (D) (D) (D) (D) (D) (D)
981 (D) (D) (D) 705 (D)
10,296 (D) (D) (D)
(D) (D) (D)
1,460
38,929
(D) (D) (D) (D) (D) (D) (D) (D) (D) (D)
(D) (D)
23,221 (D) (D) (D) (D) (D) (D) 367
(D)
1,605 (D) (D) (D) (D) (D) (D) (D) (D)
(D) (D) (D) (D) (D) (D)
10,496 (D) (D) (D)
(D) (D) (D)
5,290
40,979
(D) Withheld to avoid disclosing data for individual operations. (NA) Not available. 1 Includes stocks at mills, elevators, warehouses, terminals, and processors. 2 "Off farms unallocated" includes State data withheld to avoid disclosure of individual operations. "On farms unallocated" includes minor producing
States' data not published separately.

Grain Stocks (September 2021) 15 USDA, National Agricultural Statistics Service
Oat and Barley Stocks by Position – States and United States: June 1, 2021
State
Oats Barley
On farms
Off farms 1
Total all positions
On farms
Off farms 1
Total all positions
(1,000 bushels) (1,000 bushels) (1,000 bushels) (1,000 bushels) (1,000 bushels) (1,000 bushels)
Alabama ........................ Arizona .......................... Arkansas ....................... California ....................... Colorado ........................ Delaware ....................... Florida ........................... Georgia ......................... Idaho ............................. Illinois ............................ Indiana .......................... Iowa ............................... Kansas .......................... Kentucky ........................ Louisiana ....................... Maryland ........................ Michigan ........................ Minnesota ...................... Mississippi ..................... Missouri ......................... Montana ........................ Nebraska ....................... Nevada .......................... New England ................. New Jersey .................... New Mexico ................... New York ....................... North Carolina ............... North Dakota ................. Ohio ............................... Oklahoma ...................... Oregon .......................... Pennsylvania ................. South Carolina ............... South Dakota ................. Tennessee ..................... Texas ............................ Utah ............................... Virginia .......................... Washington ................... West Virginia ................. Wisconsin ...................... Wyoming ....................... Unallocated 2 ................. United States .................
(NA) (NA)
(D) (D)
(NA) (NA) (NA)
(D) (D) (D)
(NA) 840 (D)
(NA) (NA) (NA)
(D) 1,200 (NA)
(D)
450 260
(NA) (D)
(NA) (NA)
(D) (D)
2,300 (D)
(D) (D) 440
(NA) 2,800 (NA)
(D) (NA) (NA) (NA)
(NA)
1,050 (NA)
3,200
12,540
57 (D) (D) 107 45
(D) (D) 43 72
(D)
46 (D) 185 71
(D) 3
347 11,356
(D) (D)
25
488 (D) (D) (D) (D) 14 51
175 (D)
124 208 150 (D)
1,056 19
285 12 27 55
(D)
3,166 (D)
7,326
25,513
57 (D) (D) (D) 45
(D) (D) (D) (D) (D)
46
(D) (D) 71
(D) 3
(D) 12,556
(D) (D)
475 748 (D) (D) (D) (D) (D) (D)
2,475 (D)
(D) (D) 590 (D)
3,856 19
(D) 12 27 55
(D)
4,216 (D)
12,802
38,053
(NA) (D)
(NA) (D) (D) (D)
(NA) (NA)
5,200 (NA)
(NA) (NA)
(D) (NA) (NA)
(D) (D) 420
(NA) (NA)
9,000 (NA) (NA)
(D) (NA) (NA)
(D) (D)
4,600 (NA)
(NA) 100 (D)
(NA) 100
(NA) (NA)
(D) (D) 270
(NA)
(D) (D)
1,700
21,390
(D) 28
(D) 563
2,898 (D) (D) (D)
17,098 (D)
(D) 21 10
(D) (D) (D) (D)
3,177 (D) (D)
9,099
141 (D) (D) (D) (D) (D) 82
9,669 (D)
26
417 209 (D) (D) (D) (D) (D) 39
3,192
(D) (D) (D)
3,359
50,028
(D) (D) (D) (D) (D) (D) (D) (D)
22,298 (D)
(D) 21
(D) (D) (D) (D) (D)
3,597 (D) (D)
18,099
141 (D) (D) (D) (D) (D) (D)
14,269 (D)
26
517 (D) (D) (D) (D) (D) (D) (D)
3,462
(D) (D) (D)
8,988
71,418
(D) Withheld to avoid disclosing data for individual operations. (NA) Not available. 1 Includes stocks at mills, elevators, warehouses, terminals, and processors. 2 "Off farms unallocated" includes State data withheld to avoid disclosure of individual operations. "On farms unallocated" includes minor producing
States' data not published separately.
16 Grain Stocks (September 2021) USDA, National Agricultural Statistics Service
All Wheat and Soybean Stocks by Position – States and United States: June 1, 2021
State
All wheat Soybeans
On farms
Off farms 1
Total all positions
On farms
Off farms 1
Total all positions
(1,000 bushels) (1,000 bushels) (1,000 bushels) (1,000 bushels) (1,000 bushels) (1,000 bushels)
Alabama ........................ Arizona .......................... Arkansas ........................ California ....................... Colorado ........................ Delaware ....................... Florida ............................ Georgia .......................... Idaho .............................. Illinois ............................. Indiana ........................... Iowa ............................... Kansas ........................... Kentucky ........................ Louisiana ....................... Maryland ........................ Michigan ........................ Minnesota ...................... Mississippi ..................... Missouri ......................... Montana ......................... Nebraska ....................... Nevada .......................... New England ................. New Jersey .................... New Mexico ................... New York ....................... North Carolina ................ North Dakota .................. Ohio ............................... Oklahoma ...................... Oregon ........................... Pennsylvania ................. South Carolina ............... South Dakota ................. Tennessee ..................... Texas ............................. Utah ............................... Virginia ........................... Washington .................... West Virginia .................. Wisconsin ...................... Wyoming ........................ Unallocated 2 .................. United States .................
(D) (D) (D) 210
4,100 (D)
(NA) (D)
5,100 230
90
(NA) 3,500
(D) (NA)
(D) 90
14,000 (D) 190
32,500
800 (NA) (NA)
(D) (D) (D) 150
57,000 190
1,200 1,200
(D) (D)
13,000 (D)
1,300 (D) (D)
3,300
(NA) (D) (D)
3,505
141,655
2,741 2,230
(D) 5,698
14,433 (D)
1,306 (D)
13,598 10,265
6,338 2,017
208,460 1,820
(D) 1,780
13,738 32,239
(D) 8,423
23,240 29,535
(D) (D) (D) (D)
11,403 2,696
54,650 19,265
68,481 7,160 4,827
(D) 23,406 2,080
56,139 3,709 3,004
42,269
(D) 21,523
(D)
5,111
703,584
(D) (D)
1,034 5,908
18,533 (D)
1,306 (D)
18,698 10,495
6,428 2,017
211,960 (D) (D) (D)
13,828 46,239
(D) 8,613
55,740 30,335
(D) (D) (D) (D) (D)
2,846 111,650 19,455
69,681 8,360
(D) (D)
36,406 (D)
57,439 (D) (D)
45,569
(D) (D) (D)
62,699
845,239
(D) (NA)
(D) (NA) (NA)
(D) (NA)
(D) (NA)
38,000
19,500 39,000 7,800
(D) (D) (D)
3,600 29,000
(D) 12,000
(NA)
13,000 (NA) (NA)
(D) (NA)
(D) (D)
6,200 17,000
(D)
(NA) (D) (D)
11,000 (D) (D)
(NA) (D)
(NA)
(NA) 6,300 (NA)
17,500
219,900
(D) (D) (D) (D) (D) 989 (D) (D) (D)
84,565
47,367 97,533 31,473
(D) 3,033
(D) 17,710 44,125
(D) 29,050
(D)
44,712 (D) (D) (D) (D) (D) (D)
14,713 38,409
(D) (D)
2,355 (D)
28,920 2,002
252 (D) (D) 342
(D)
16,048 (D)
45,814
549,412
(D) (D) (D) (D) (D) (D) (D) (D) (D)
122,565
66,867 136,533 39,273
(D) (D) (D)
21,310 73,125
(D) 41,050
(D)
57,712 (D) (D) (D) (D) (D) (D)
20,913 55,409
(D) (D) (D) (D)
39,920 (D) (D) (D) (D) 342
(D)
22,348 (D)
71,945
769,312
(D) Withheld to avoid disclosing data for individual operations. (NA) Not available. 1 Includes stocks at mills, elevators, warehouses, terminals, and processors. 2 "Off farms unallocated" includes State data withheld to avoid disclosure of individual operations. "On farms unallocated" includes minor producing
States' data not published separately.

Grain Stocks (September 2021) 17 USDA, National Agricultural Statistics Service
Corn Area Planted for All Purposes and Harvested for Grain, Yield, and Production – States and United States: 2020
State Area planted for all purposes Area harvested for grain Yield per acre Production
(1,000 acres) (1,000 acres) (bushels) (1,000 bushels)
Alabama ........................ Arizona .......................... Arkansas ....................... California ....................... Colorado ........................ Connecticut 1 ................. Delaware ....................... Florida ........................... Georgia ......................... Idaho ............................. Illinois ............................ Indiana .......................... Iowa ............................... Kansas .......................... Kentucky ........................ Louisiana ....................... Maine 1 .......................... Maryland ........................ Massachusetts 1 ............ Michigan ........................ Minnesota ...................... Mississippi ..................... Missouri ......................... Montana ........................ Nebraska ....................... Nevada 1 ........................ New Hampshire 1 ........... New Jersey .................... New Mexico ................... New York ....................... North Carolina ............... North Dakota ................. Ohio ............................... Oklahoma ...................... Oregon .......................... Pennsylvania ................. Rhode Island 1 ............... South Carolina ............... South Dakota ................. Tennessee ..................... Texas ............................ Utah ............................... Vermont 1 ....................... Virginia .......................... Washington ................... West Virginia ................. Wisconsin ...................... Wyoming ....................... United States .................
330 75
620 440
1,420 24
180 100 420 390
11,300 5,400
13,600 6,100 1,470
500 30
480 14
2,350
8,000 510
3,450 115
10,200 13 13 80
125 1,030
990
1,950 3,550
360 100
1,500 2
390 4,900
860
2,250 85 85
560 195 51
3,950 95
90,652
320 29
605 60
1,060 (NA) 176 61
390 130
11,100 5,250
12,900 5,720 1,360
485 (NA) 430
(NA) 1,990
7,510
490 3,280
61 9,890 (NA) (NA)
73 37
500
940 1,780 3,300
320 65
1,000 (NA) 370
4,450 815
1,810
29 (NA) 420 85 38
2,930 54
82,313
158.0 202.0 184.0 187.0 116.0 (NA)
160.0 138.0 180.0 199.0
191.0 187.0 177.0 134.0 184.0 181.0 (NA)
155.0 (NA)
153.0
191.0 180.0 171.0 109.0 180.0 (NA) (NA)
156.0 195.0 157.0
113.0 139.0 171.0 135.0 241.0 138.0 (NA)
132.0 162.0 170.0
128.0 149.0 (NA)
122.0 228.0 144.0 173.0 122.0
171.4
50,560 5,858
111,320 11,220
122,960 (NA)
28,160 8,418
70,200 25,870
2,120,100
981,750 2,283,300
766,480 250,240 87,785
(NA) 66,650
(NA) 304,470
1,434,410
88,200 560,880
6,649 1,780,200
(NA) (NA)
11,388 7,215
78,500
106,220 247,420 564,300 43,200 15,665
138,000 (NA)
48,840 720,900 138,550
231,680
4,321 (NA)
51,240 19,380 5,472
506,890 6,588
14,111,449
(NA) Not available. 1 Area harvested for grain not estimated.

18 Grain Stocks (September 2021) USDA, National Agricultural Statistics Service
Corn for Silage Area Harvested, Yield, and Production – States and United States: 2020
State Area harvested Yield per acre Production
(1,000 acres) (tons) (1,000 tons)
Alabama ......................................... Arizona ........................................... Arkansas ......................................... California ........................................ Colorado ......................................... Connecticut ..................................... Delaware ........................................ Florida ............................................. Georgia ........................................... Idaho ............................................... Illinois .............................................. Indiana ............................................ Iowa ................................................ Kansas ............................................ Kentucky ......................................... Louisiana ........................................ Maine .............................................. Maryland ......................................... Massachusetts ................................ Michigan ......................................... Minnesota ....................................... Mississippi ...................................... Missouri .......................................... Montana .......................................... Nebraska ........................................ Nevada ........................................... New Hampshire .............................. New Jersey ..................................... New Mexico .................................... New York ........................................ North Carolina ................................. North Dakota ................................... Ohio ................................................ Oklahoma ....................................... Oregon ............................................ Pennsylvania .................................. Rhode Island ................................... South Carolina ................................ South Dakota .................................. Tennessee ...................................... Texas .............................................. Utah ................................................ Vermont .......................................... Virginia ............................................ Washington ..................................... West Virginia ................................... Wisconsin ....................................... Wyoming ......................................... United States ..................................
5 45 6
375 230 22 4
35 25
260
110 130 260 250 95 3
27 40 12
350
420 7
100 51
260 13 12 6
79 520
40
145 200 20 34
485 2 9
360 35
270 52 80
120 110 12
960 25
6,711
16.0 29.0 15.0 27.0 23.0 16.0 19.0 19.0 18.0 29.0
20.0 21.0 20.5 19.5 20.0 17.0 19.0 17.0 16.0 17.5
23.0 14.0 17.0 21.0 19.0 26.0 20.0 20.0 21.0 18.0
14.0 15.5 21.0 14.0 23.0 19.0 13.0 15.0 18.0 18.0
18.0 23.0 19.0 17.0 26.0 19.0 21.0 20.0
20.5
80 1,305
90 10,125 5,290
352 76
665 450
7,540
2,200 2,730 5,330 4,875 1,900
51 513 680 192
6,125
9,660 98
1,700 1,071 4,940
338 240 120
1,659 9,360
560
2,248 4,200
280 782
9,215 26
135 6,480
630
4,860 1,196 1,520 2,040 2,860
228 20,160
500
137,675

Grain Stocks (September 2021) 19 USDA, National Agricultural Statistics Service
Soybeans for Beans Area Planted and Harvested, Yield, and Production – States and United States: 2020
State Area planted Area harvested Yield Production
(1,000 acres) (1,000 acres) (bushels) (1,000 bushels)
Alabama ...................... Arkansas ..................... Delaware ..................... Georgia ....................... Illinois .......................... Indiana ........................ Iowa ............................. Kansas ........................ Kentucky ...................... Louisiana ..................... Maryland ...................... Michigan ...................... Minnesota .................... Mississippi ................... Missouri ....................... Nebraska ..................... New Jersey .................. New York ..................... North Carolina ............. North Dakota ............... Ohio ............................. Oklahoma .................... Pennsylvania ............... South Carolina ............. South Dakota ............... Tennessee ................... Texas .......................... Virginia ........................ Wisconsin .................... United States ...............
280 2,820
150 100
10,300 5,750 9,450 4,800 1,850 1,050
485
2,200 7,450 2,090 5,850 5,200
94 315
1,600 5,750
4,950
560 640 310
4,950 1,650
120 570
2,020
83,354
275 2,800
148 95
10,250 5,730 9,370 4,750 1,840 1,020
465
2,190 7,380 2,060 5,810 5,160
93 312
1,570 5,700
4,920
540 630 295
4,920 1,620
110 560
1,990
82,603
41.0 51.5 49.0 41.0 60.0 59.0 54.0 41.0 55.0 53.0
47.0 48.0 50.0 54.0 51.0 58.0 46.0 51.0 38.0 34.0
55.0 30.0 46.0 35.0 46.0 50.0 34.0 42.0 52.0
51.0
11,275 144,200
7,252 3,895
615,000 338,070 505,980 194,750 101,200 54,060
21,855
105,120 369,000 111,240 296,310 299,280
4,278 15,912 59,660
193,800
270,600 16,200 28,980 10,325
226,320 81,000 3,740
23,520 103,480
4,216,302

20 Grain Stocks (September 2021) USDA, National Agricultural Statistics Service
Statistical Methodology
Survey Procedures: The grain stocks estimates in this report are based on surveys conducted during the first two weeks
of September. Separate surveys are conducted to obtain the on-farm and off-farm estimates. The on-farm stocks survey is
a probability survey that includes a sample of approximately 62,200 farm operators selected from a list of producers that
ensures all operations in the United States have a chance to be selected. These producers are asked to provide the total
quantities of grain stored on their operations as of September 1, 2021. This includes all whole grains and oilseeds stored
whether for feed, seed, or sale as well as any stored under a government program.
The off-farm stocks survey is an enumeration of all known commercial grain storage facilities. This includes
approximately 8,300 facilities with 11.8 billion bushels of storage capacity. An effort is made to obtain a report from all
facilities. Reports of stock holdings are normally received from operations covering about 90 percent of the capacity.
Estimates are made for missing facilities to make the survey complete.
Estimation Procedures: On-farm and off-farm survey data are reviewed at the State and National levels for
reasonableness, consistency with historical estimates, and current crop size. After estimates are made for on-farm and
off-farm stocks, the totals of these two are combined and evaluated using the balance sheet approach. This method utilizes
other sources of data to check the reasonableness of the stocks estimates. Estimates of production, imports, exports,
crushings, millings, and all other recorded uses of grains and oilseeds are reviewed to make sure beginning stocks,
production, utilization, and ending stocks are within reasonable balance and present the best possible estimate of stocks.
Revision Policy: On-farm and off-farm stocks are subject to revision the quarter following initial publication and again in
the following December 1 Grain Stocks report published in January each year. Revisions can be made when late reports
are received, errors are detected in reporting and calculations, and production estimates are revised. Estimates will also be
reviewed following the 5-year Census of Agriculture. No revisions to these years will be made after that date.
Reliability: Reliability of the on-farm and off-farm stocks must be treated separately because the survey designs for the
two surveys are very different. The on-farm stocks estimates are subject to sampling variability because all operations
holding on-farm stocks are not included in the sample. This variability, as measured by the relative standard error at the
United States level, is approximately 3.6 percent for corn, 5.9 percent for soybeans, and 2.9 percent for all wheat. This
means that chances are approximately 95 out of 100 that survey estimates for stocks will be within plus or minus
7.2 percent for corn, 11.8 percent for soybeans, and 5.8 percent for all wheat of the value that could be developed by
averaging the estimates produced from all possible samples selected from the same population and surveyed using the
same procedures. The relative standard errors for sorghum, barley, and oats are 20.2, 5.9, and 4.0 percent, respectively.
Survey indications are also subject to non-sampling errors such as omission, duplication, imputation for missing data, and
mistakes in reporting, recording, and processing the data. Off-farm, as well as on-farm stocks, are subject to these types of
errors. These errors cannot be measured directly, but they are minimized through rigid quality controls in the data
collection process and a careful review of all reported data for consistency and reasonableness.

Information Contacts
Listed below are the commodity statisticians in the Crops Branch of the National Agricultural Statistics Service to contact
for additional information. E-mail inquiries may be sent to [email protected]
Lance Honig, Chief, Crops Branch ....................................................................................................... (202) 720-2127
Chris Hawthorn, Head, Field Crops Section ......................................................................................... (202) 720-2127
Irwin Anolik – Crop Weather .......................................................................................................... (202) 720-7621
Joshua Bates – Oats, Soybeans ........................................................................................................ (202) 690-3234
David Colwell – Current Agricultural Industrial Reports ................................................................ (202) 720-8800
Michelle Harder – Barley, County Estimates, Hay .......................................................................... (202) 690-8533
James Johanson – Rye, Wheat ......................................................................................................... (202) 720-8068
Greg Lemmons – Corn, Flaxseed, Proso Millet ............................................................................... (202) 720-9526
Becky Sommer – Cotton, Cotton Ginnings, Sorghum ..................................................................... (202) 720-5944
Travis Thorson – Sunflower, Other Oilseeds ................................................................................... (202) 720-7369
Lihan Wei – Peanuts, Rice ............................................................................................................... (202) 720-7688

Access to NASS Reports For your convenience, you may access NASS reports and products the following ways:
➢ All reports are available electronically, at no cost, on the NASS web site: www.nass.usda.gov
➢ Both national and state specific reports are available via a free e-mail subscription. To set-up this free
subscription, visit www.nass.usda.gov and click on “National” or “State” in upper right corner above “search”
box to create an account and select the reports you would like to receive.
➢ Cornell’s Mann Library has launched a new website housing NASS’s and other agency’s archived reports. The
new website, https://usda.library.cornell.edu. All email subscriptions containing reports will be sent from the new
website, https://usda.library.cornell.edu. To continue receiving the reports via e-mail, you will have to go to the
new website, create a new account and re-subscribe to the reports. If you need instructions to set up an account or
subscribe, they are located at: https://usda.library.cornell.edu/help. You should whitelist notifications@usda-
esmis.library.cornell.edu in your email client to avoid the emails going into spam/junk folders.
For more information on NASS surveys and reports, call the NASS Agricultural Statistics Hotline at (800) 727-9540,
7:30 a.m. to 4:00 p.m. ET, or e-mail: [email protected].
The U.S. Department of Agriculture (USDA) prohibits discrimination against its customers, employees, and applicants for
employment on the basis of race, color, national origin, age, disability, sex, gender identity, religion, reprisal, and where
applicable, political beliefs, marital status, familial or parental status, sexual orientation, or all or part of an individual's
income is derived from any public assistance program, or protected genetic information in employment or in any program
or activity conducted or funded by the Department. (Not all prohibited bases will apply to all programs and/or
employment activities.)
If you wish to file a Civil Rights program complaint of discrimination, complete the USDA Program Discrimination
Complaint Form (PDF), found online at www.ascr.usda.gov/filing-program-discrimination-complaint-usda-customer, or
at any USDA office, or call (866) 632-9992 to request the form. You may also write a letter containing all of the
information requested in the form. Send your completed complaint form or letter to us by mail at U.S. Department of
Agriculture, Director, Office of Adjudication, 1400 Independence Avenue, S.W., Washington, D.C. 20250-9410, by fax
(202) 690-7442 or email at [email protected].

USDA Fall Data Users’ Meeting Virtual Meeting
October 13 & 14, 2021
12:00 – 3:00 pm ET
USDA’s National Agricultural Statistics Service (NASS) will hold a virtual meeting for users of U.S. domestic
and international agriculture data. Along with NASS, the 2021 Fall Data Users’ Meeting will headline the
Agricultural Marketing Service, Economic Research Service, Farm Service Agency, Foreign Agricultural
Service, World Agricultural Outlook Board – and the Census Bureau’s Foreign Trade Division. Representatives
will provide agency updates, answer questions, and listen to concerns from data users.
Abbreviated Agenda
Day 1 – October 13
Agency Updates– All agencies
AMS Transportation & Marketing Program - Agricultural Marketing Service
NASS Milk Production Program - National Agricultural Statistics Service
Showcasing ERS Data and New Initiatives - Economic Research Service
Foreign Production, Trade, and Import/Export Data - World Agricultural Outlook Board, Foreign
Agricultural Service, and U.S. Census Bureau
Day 2 – October 14
Open Forum – All agencies
Climate Information for Informed Decision Making - World Agricultural Outlook Board
AMS Market News - Agricultural Marketing Service
NASS Modernization - National Agricultural Statistics Service
GADAS Demo – Foreign Agricultural Service
For registration details or additional information about the Data Users’ Meeting, see the meeting page on the
NASS website (https://www.nass.usda.gov/Education_and_Outreach/Meeting/index.php).