grain prices and food crises in 14th century flemish
TRANSCRIPT

Grain prices and food crises in 14th century Flemish cities (1280-1370)STEF ESPEEL
ESSHC BELFAST – SESSION SHOCK CITIES (6 APRIL 2018)

IntroductionOverview:
• Introduction
• Shock Cities• Character different case-studies
• Sources
• Long term price movements• 1280-1370
• General course
• Short term price movements• Focus on price peaks
• Concluding remarks
1. Introduction | 2. Shock Cities | 3. Long term price movements | 4. Short term price movements | 5. Conclusion

Introduction• Vulnerability 14th century Flemish cities – no demographic decline?
• FAD vs. FED-> Co-production of food crises
• Malthusian Null-Hypothesis
• Focus: chronology of the price peaks and food crises
1. Introduction | 2. Shock Cities | 3. Long term price movements | 4. Short term price movements | 5. Conclusion

Shock Cities• H.L. Platt, Shock Cities (2005).
• Flemish cities• Extremely rapid growth & structural transformation (12th – 13th century)
• Potential vulnerability towards food shocks
• Bruges – Ghent – Lille – Douai – Cambrai
Cambrai
Source: Wikimedia Commons
1. Introduction | 2. Shock Cities | 3. Long term price movements | 4. Short term price movements | 5. Conclusion

Shock Cities• Character of hinterland• Peasant agriculture vs. agrarian specialisation
• Degree of political power• Inclusive regimes vs. patrician autocracy
• Political autonomy vs. territorial lords
• Connection to international markets• International gateway vs. regional distribution
1. Introduction | 2. Shock Cities | 3. Long term price movements | 4. Short term price movements | 5. Conclusion

Sources• Representative sample for the general population
• Account series• Caritative institutions: hospitals in particular
• Collegial church chapters
• Abbeys
1. Introduction | 2. Shock Cities | 3. Long term price movements | 4. Short term price movements | 5. Conclusion

Sources – institutions• Bruges• Hospital Saint-John
• Hospital Our Lady ter Potterie
• Chapter Saint-Donatian
• Memorial Simon de Rikelike
• Ghent• Chapter Saint-Nicolas
• Chapter Saint-Veerle
• Chapter Our-Lady-Saint-Peter
• Abbey Saint-Peter
• Abbey Saint-Bavo
• Lille• Hospital Saint-Sauveur
• Chapter Saint-Peter
• Douai• Chapter Saint-Amé
• Abbey des Prés
• Hospital Wetz
• Cambrai• Metropolitan Chapter of Our Lady
• Chapters Saint-Croix & Saint-Géry
• Hospital Saint-Julian
• Abbey Saint-Sépulchre
1. Introduction | 2. Shock Cities | 3. Long term price movements | 4. Short term price movements | 5. Conclusion

Long term price movements• Differences in measures and coinage systems• All prices in: d.gr. (vl./torn.) / hectolitres
• Long term inflation not excluded
• Comparing wheat prices• Insufficient data for all the other grain types
• Main bread cereal
• Other grain types usually followed this trend
1. Introduction | 2. Shock Cities | 3. Long term price movements | 4. Short term price movements | 5. Conclusion

0
5
10
15
20
25
30
35
40
45
50
55
Wheat price in Flemish cities, 1280-1375 (d.gr./hl.)
Bruges Ghent Lille Douai Cambrai
1. Introduction | 2. Shock Cities | 3. Long term price movements | 4. Short term price movements | 5. Conclusion

0
10
20
30
40
50
60
70
80
1349 1350 1351 1352 1353 1354 1355 1356 1357 1358 1359 1360 1361 1362 1363 1364 1365 1366 1367 1368 1369 1370 1371 1372 1373 1374 1375
Wheat price in Flemish cities, 1349-1375 (gr.silver/hl.)
Bruges Ghent Lille Douai Cambrai
1. Introduction | 2. Shock Cities | 3. Long term price movements | 4. Short term price movements | 5. Conclusion

Average relative differences• First glance: same course of the five series
• Comparing the series: rows compared to columns• Results (%):
• Bruges highest overall (26,8% on Ghent and 19,8% on Lille etc.)
• Ghent and Lille followed closely, in favour for Lille (4,1% higher than Ghent)
• Douai lower and Cambrai lowest
Bruges Ghent Lille Douai Cambrai
Bruges 100,00
Ghent -26,75 100,00
Lille -19,83 4,09 100,00
Douai -37,02 -12,07 -15,46 100,00
Cambrai -74,32 -39,55 -50,35 -29,56 100,00
1. Introduction | 2. Shock Cities | 3. Long term price movements | 4. Short term price movements | 5. Conclusion

Correlation coefficient• Parallel course of wheat price series
• In what degree are series correlated to each other? Doesn’t imply a causal relation!• Results:
• Category ]0,9 – ]1:• Bruges – Ghent; Bruges – Lille; Ghent – Lille; Lille – Douai
• All relations above 0,81
Bruges Ghent Lille Douai Cambrai
Bruges 1
Ghent 0,926718 1
Lille 0,916245 0,924648 1
Douai 0,828163 0,863255 0,923455 1
Cambrai 0,813699 0,841455 0,894194 0,870104 1
1. Introduction | 2. Shock Cities | 3. Long term price movements | 4. Short term price movements | 5. Conclusion
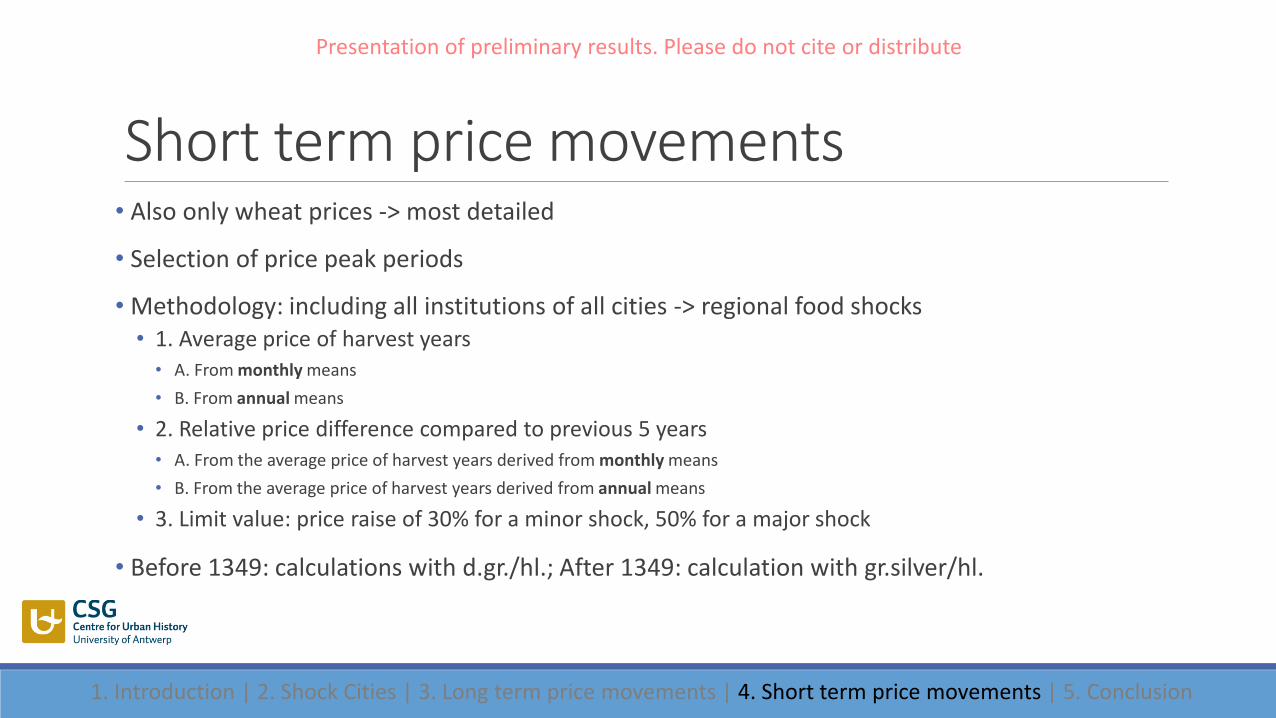
Short term price movements• Also only wheat prices -> most detailed
• Selection of price peak periods
• Methodology: including all institutions of all cities -> regional food shocks• 1. Average price of harvest years• A. From monthly means
• B. From annual means
• 2. Relative price difference compared to previous 5 years• A. From the average price of harvest years derived from monthly means
• B. From the average price of harvest years derived from annual means
• 3. Limit value: price raise of 30% for a minor shock, 50% for a major shock
• Before 1349: calculations with d.gr./hl.; After 1349: calculation with gr.silver/hl.
1. Introduction | 2. Shock Cities | 3. Long term price movements | 4. Short term price movements | 5. Conclusion

Periods of price peaks• 8 peak periods throughout the whole period:• 1292-93
• 1302-04
• 1314-16
• 1321-23
• 1328-30
• 1339-43
• 1348-52
• 1356-61
1. Introduction | 2. Shock Cities | 3. Long term price movements | 4. Short term price movements | 5. Conclusion

Periods of price peaks• 1292-93• +35,10%
• 1302-04• +54,35% and +43,07%
• Franco-Flemish War (1297-1305)
• Battle of the Golden spurs (11 July 1302)
• 1305: Athis-sur-Orge: Lille/Douai/Orchies to French kingdom
-> Peaks based on small amount of data
1. Introduction | 2. Shock Cities | 3. Long term price movements | 4. Short term price movements | 5. Conclusion

Periods of price peaks• 1314-16• +145,94% and +119,8% (highest in 14th century)
• The Great Famine• actually 1315-17, but skewered because of the yearly averages & starting/ending date of the accounts
• Back to back harvest failures because of heavy rainfall
• Only data for Bruges (Saint-John) and Douai (Saint-Amé)• Bruges hit harder? Staple right Douai? Or just because trading character of Bruges?
1. Introduction | 2. Shock Cities | 3. Long term price movements | 4. Short term price movements | 5. Conclusion
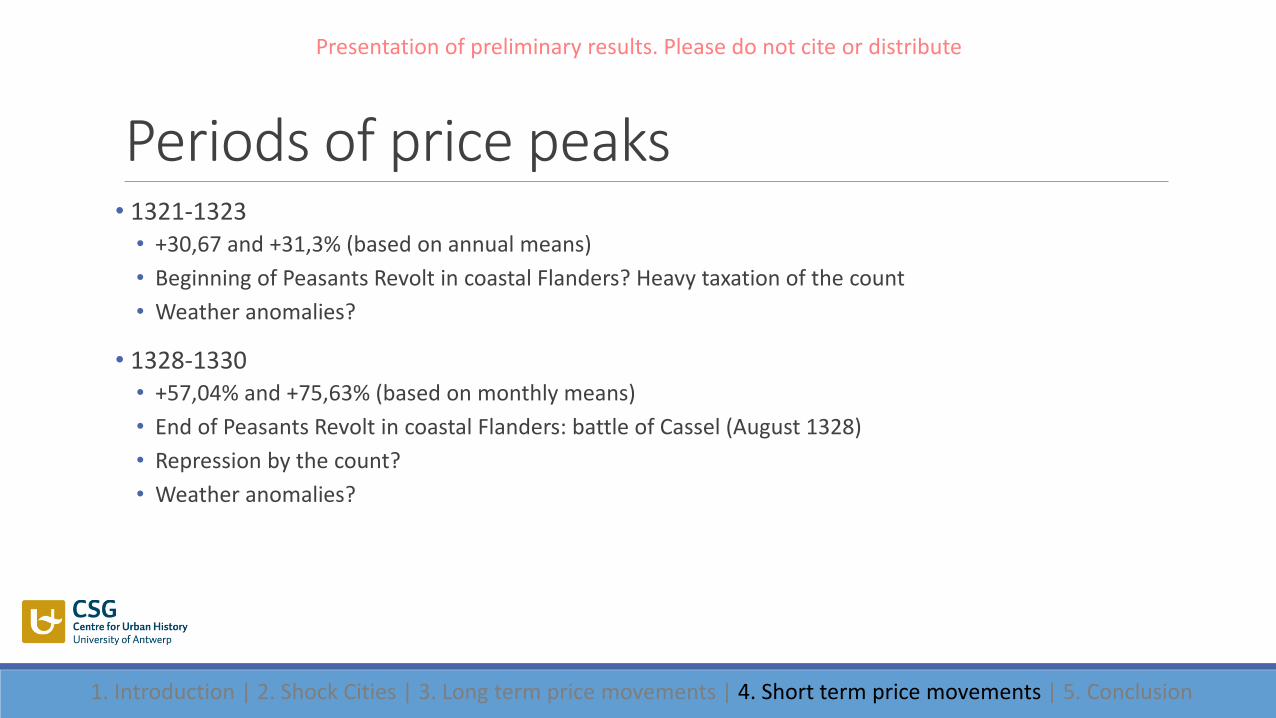
Periods of price peaks• 1321-1323• +30,67 and +31,3% (based on annual means)
• Beginning of Peasants Revolt in coastal Flanders? Heavy taxation of the count
• Weather anomalies?
• 1328-1330• +57,04% and +75,63% (based on monthly means)
• End of Peasants Revolt in coastal Flanders: battle of Cassel (August 1328)
• Repression by the count?
• Weather anomalies?
1. Introduction | 2. Shock Cities | 3. Long term price movements | 4. Short term price movements | 5. Conclusion

1339-1343
• Hundred Years’ War• England vs. France -> strategic importance of Walloon Flanders
• 1339: Siege of Cambrai
• 1340: Battle of Sluys
• Bruges/Ghent: anglophile ‘Artevelde-regime’
Harvest year Monthly avg. Rel. diff. With previous
5 years (monthly avg.)
Annual avg. Ref. diff. With previous
5 years (annual avg.)
1339-1340 16,28 99,94 12,68 47,64
1340-1341 11,80 18,79 13,17 39,66
1341-1342 16,57 55,55 17,46 70,76
1342-1343 16,11 33,04 15,80 31,14
1. Introduction | 2. Shock Cities | 3. Long term price movements | 4. Short term price movements | 5. Conclusion

1339-1343
1. Introduction | 2. Shock Cities | 3. Long term price movements | 4. Short term price movements | 5. Conclusion
0
5
10
15
20
25
30
1338 1339 1340 1341 1342 1343 1344 1345 1346
Bruges Ghent Lille Douai Cambrai
0
5
10
15
20
25
30
35
40
45
Ghent (S.-Nicolas) Lille (S.-Sauveur) Douai (S.-Amé)
Douai (Wetz) Douai (Des Prés) Cambrai (N.-Dame)

1348-1352
• Black Death• Crimea (1347) -> Italy -> northwestern-Europe (1348)
• Fleas on rats & humans
• Coin revaluations• 1350, 1352
Harvest year Monthly avg. Rel. diff. With previous
5 years (monthly avg.)
Annual avg. Ref. diff. With previous
5 years (annual avg.)
1348-1349 24,09385 32,81845 32,84775 48,61241349-1350 36,47108 95,42338 31,98997 33,594721350-1351 29,91723 32,35477 35,30831 31,107451351-1352 41,36436 62,29095 36,44491 20,49589
1. Introduction | 2. Shock Cities | 3. Long term price movements | 4. Short term price movements | 5. Conclusion

1348-1352
1. Introduction | 2. Shock Cities | 3. Long term price movements | 4. Short term price movements | 5. Conclusion
0
10
20
30
40
50
60
70
Bruges (S.-Donatian) Lille (S.-Sauveur) Douai (S.-Amé)
Douai (Wetz) Cambrai (N.-Dame) Cambrai (S.-Julian)
0
10
20
30
40
50
60
1348 1349 1350 1351 1352 1353 1354
Bruges Ghent Lille Douai Cambrai

1356-1361
• 1360: Return of the plague (1360-61)• Blockmans: more severe than Black Death!
Harvest year Monthly avg. Rel. diff. With previous
5 years (monthly avg.)
Annual avg. Ref. diff. With previous
5 years (annual avg.)
1356-1357 27,60547 11,07297 35,30459 35,603271357-1358 35,26615 59,56325 37,24418 44,317331358-1359 32,6073 32,72297 36,33576 27,450251359-1360 44,35202 59,8908 48,74584 53,123521360-1361 58,9931 77,74848 45,02639 21,25596
1. Introduction | 2. Shock Cities | 3. Long term price movements | 4. Short term price movements | 5. Conclusion

1356-1361
1. Introduction | 2. Shock Cities | 3. Long term price movements | 4. Short term price movements | 5. Conclusion
0
10
20
30
40
50
60
70
80
1356 1357 1358 1359 1360 1361
Bruges Ghent Lille Douai Cambrai
0
10
20
30
40
50
60
70
80
Bruges (S.-Donatian) Lille (S.-Sauveur) Douai (S.-Amé)
Douai (Wetz) Douai (Des Prés) Cambrai (N.-Dame)
Cambrai (S.-Julian)

Quod 1369-71?
• 1369: Return of the plague (1369-1370)
• 1369: Marriage of Philip the Bold and Margaret of Flanders• Walloon Flanders back to the county of Flanders• Influence on price?
• Price peak not so severe!
Harvest year Monthly avg. Rel. diff. With previous
5 years (monthly avg.)
Annual avg. Ref. diff. With previous
5 years (annual avg.)
1368-1369 33,46219 -17,1412 41,85776 5,1687431369-1370 47,93287 28,06244 44,6323 11,809091370-1371 37,49684 -6,85777 38,00383 -9,59072
1. Introduction | 2. Shock Cities | 3. Long term price movements | 4. Short term price movements | 5. Conclusion
Illumination from the Grandes Chroniques de France showing Philip marrying Margaret of Flanders in 1369 (Source: https://www.historytoday.com/richard-cavendish/philip-bold-becomes-duke-burgundy)

1364-1371
1. Introduction | 2. Shock Cities | 3. Long term price movements | 4. Short term price movements | 5. Conclusion
0
10
20
30
40
50
60
70
1364 1365 1366 1367 1368 1369 1370 1371
Bruges Ghent Lille Douai Cambrai
0
10
20
30
40
50
60
70
Grafiektitel
Bruges (S.-Donatian) Ghent (S.-Nicolas) Lille (S.-Sauveur)
Douai (S.-Amé) Douai (Wetz) Douai (Des Prés)
Cambrai (N.-Dame)

Conclusion• Newly constructed price series detailed & useful, especially from 1320 onwards
• Bruges highest series on long term & most of the peaks• Followed by Ghent/Lille, then Douai, Cambrai the lowest
• All the series are remarkably parallel to each other• Already high degree of market integration
• Black Death as transition event from quasi-stable price periods (e.g. 1330-1339) to a veryvolatile course
1. Introduction | 2. Shock Cities | 3. Long term price movements | 4. Short term price movements | 5. Conclusion

1. Introduction | 2. Shock Cities | 3. Long term price movements | 4. Short term price movements | 5. Conclusion