grain-oriented electrical steel from germany, japan, and poland · 2014-09-10 · grain-oriented...
TRANSCRIPT

U.S. International Trade CommissionPublication 4491 September 2014
Washington, DC 20436
Grain-Oriented Electrical Steel from Germany, Japan, and Poland
Investigation Nos. 731-TA-1233, 1234, and 1236

U.S. International Trade Commission
COMMISSIONERS
Meredith Broadbent, Chairman Dean A. Pinkert
Irving A. Williamson David S. Johanson
F. Scott Kieff Rhona K. Schmidtlein
Robert B. Koopman
Staff assigned
Address all communications to Secretary to the Commission
United States International Trade Commission Washington, DC 20436
Director of Operations
Mary Messer, Investigator Carolyn Esko, Investigator James Fetzer, Economist Justin Jee, Accountant
Karl Tsuji, Industry Analyst Mara Alexander, Statistician
Carolyn Holmes, Statistical Assistant Rhonda Hughes, Attorney
Douglas Corkran, Supervisory Investigator

U.S. International Trade CommissionWashington, DC 20436
www.usitc.gov
Publication 4491 September 2014
Grain-Oriented Electrical Steel from Germany, Japan, and Poland
Investigation Nos. 731-TA-1233, 1234, and 1236

CONTENTS
Page
i
Determinations……………………………………………………………………………………………………………………..1
Views of the Commission………………………………………………………………………………………………..…….3
Dissenting views of Commissioner Rhonda K. Schmidtlein…………………………………………………..37
Part I: Introduction .............................................................................................................. I-1
Background ...................................................................................................................................... I-1
Statutory criteria and organization of the report ............................................................................ I-3
Statutory criteria .......................................................................................................................... I-3
Organization of report.................................................................................................................. I-4
Market summary .............................................................................................................................. I-4
Summary data and data sources ...................................................................................................... I-6
Previous and related investigations ................................................................................................. I-6
Safeguard investigations .............................................................................................................. I-6
Patent infringement proceeding .................................................................................................. I-7
Antidumping and countervailing duty proceedings ..................................................................... I-7
Nature and extent of subsidies and sales at LTFV ......................................................................... I-10
Subsidies ..................................................................................................................................... I-10
Sales at LTFV ............................................................................................................................... I-11
The subject merchandise ............................................................................................................... I-13
Commerce’s scope ..................................................................................................................... I-13
Tariff treatment .......................................................................................................................... I-13
The product .................................................................................................................................... I-14
Description and applications ...................................................................................................... I-14
Manufacturing processes ........................................................................................................... I-20
Domestic like product issues .......................................................................................................... I-22
Physical characteristics and uses ............................................................................................... I-24
Manufacturing facilities and production employees ................................................................. I-25
Interchangeability and customer and producer perceptions .................................................... I-25
Channels of distribution ............................................................................................................. I-26
Price ............................................................................................................................................ I-26
CONTENTS
Page
ii
Part II: Conditions of competition in the U.S. market........................................................... II-1
U.S. market characteristics ............................................................................................................. II-1
Channels of distribution .................................................................................................................. II-1
U.S. purchasers ................................................................................................................................ II-1
Geographic distribution .................................................................................................................. II-2
Supply and demand considerations ................................................................................................ II-2
U.S. supply ................................................................................................................................... II-2
U.S. demand ................................................................................................................................ II-9
Substitutability issues .................................................................................................................... II-13
Lead times ................................................................................................................................. II-13
Knowledge of country sources .................................................................................................. II-13
Factors affecting purchasing decisions ..................................................................................... II-13
Comparisons of domestic products, subject imports, and nonsubject imports ....................... II-18
Elasticity estimates ........................................................................................................................ II-23
U.S. supply elasticity .................................................................................................................. II-23
U.S. demand elasticity ............................................................................................................... II-24
Substitution elasticity ................................................................................................................ II-24
Part III: U.S. producers’ production, shipments, and employment ...................................... III-1
U.S. producers ................................................................................................................................ III-1
U.S. production, capacity, and capacity utilization ........................................................................ III-3
GOES ........................................................................................................................................... III-3
Overall capacity and production ................................................................................................ III-3
Toll production ........................................................................................................................... III-4
Order book projections .............................................................................................................. III-5
U.S. producers’ U.S. shipments and exports .................................................................................. III-5
U.S. producers’ inventories ............................................................................................................ III-8
U.S. producers’ imports and purchases ......................................................................................... III-9
U.S. employment, wages, and productivity ................................................................................... III-9

CONTENTS
Page
iii
Part IV: U.S. imports, apparent U.S. consumption, and market shares...................................... IV-1
U.S. importers ............................................................................................................................... IV-1
U.S. imports ................................................................................................................................... IV-2
Critical circumstances ................................................................................................................... IV-5
Negligibility .................................................................................................................................... IV-7
Cumulation considerations ........................................................................................................... IV-9
Fungibility .................................................................................................................................. IV-9
Presence in the market ........................................................................................................... IV-11
Geographical markets ............................................................................................................. IV-14
Apparent U.S. consumption and market shares ......................................................................... IV-17
Ratio of imports to U.S. production ............................................................................................ IV-22
Part V: Pricing data .................................................................................................................. V-1
Factors affecting prices .................................................................................................................. V-1
Raw material and other costs .................................................................................................... V-1
U.S. inland transportation costs ................................................................................................. V-2
Pricing practices ............................................................................................................................. V-2
Pricing methods.......................................................................................................................... V-2
Sales terms and discounts .......................................................................................................... V-3
Price leaders ............................................................................................................................... V-3
Price data ....................................................................................................................................... V-4
Price trends ................................................................................................................................ V-7
Price comparisons ...................................................................................................................... V-8
Lost sales and lost revenue ............................................................................................................ V-9

CONTENTS
Page
iv
Part VI: Financial experience of U.S. producers ........................................................................ VI-1
Background ................................................................................................................................... VI-1
Operations on GOES ...................................................................................................................... VI-1
Capital expenditures and research and development expenses .................................................. VI-5
Assets and return on assets .......................................................................................................... VI-5
Capital and investment ................................................................................................................. VI-6
Part VII: Threat considerations and information on nonsubject countries ............................... VII-1
The industry in China ................................................................................................................... VII-3
Overview .................................................................................................................................. VII-3
Operations on GOES ................................................................................................................. VII-3
Alternative products ................................................................................................................ VII-5
The industry in the Czech Republic .............................................................................................. VII-5
Overview .................................................................................................................................. VII-5
Operations on GOES ................................................................................................................. VII-5
Alternative products ................................................................................................................ VII-7
The industry in Germany .............................................................................................................. VII-7
Overview .................................................................................................................................. VII-7
Operations on GOES ................................................................................................................. VII-8
Alternative products ................................................................................................................ VII-8
The industry in Japan ................................................................................................................... VII-9
Overview .................................................................................................................................. VII-9
Operations on GOES ................................................................................................................. VII-9
Alternative products .............................................................................................................. VII-10
The industry in Korea ................................................................................................................. VII-11
Overview ................................................................................................................................ VII-11
Operations on GOES ............................................................................................................... VII-11
Alternative products .............................................................................................................. VII-12

CONTENTS
Page
v
The industry in Poland ............................................................................................................... VII-13
Overview ................................................................................................................................ VII-13
The industry in Russia ................................................................................................................ VII-15
Overview ................................................................................................................................ VII-15
Operations on GOES ............................................................................................................... VII-16
Alternative products .............................................................................................................. VII-17
Combined subject country data ................................................................................................. VII-18
U.S. inventories of imported merchandise ................................................................................ VII-19
U.S. importers’ outstanding orders ............................................................................................ VII-20
Antidumping or countervailing duty orders in third-country markets ...................................... VII-20
Information on nonsubject countries ........................................................................................ VII-25
Appendixes
A. Federal Register notices ......................................................................................................... A-1
B. List of hearing witnesses ......................................................................................................... B-1
C. Summary data ......................................................................................................................... C-1
D. Purchase prices by direct importers ....................................................................................... D-1
Note.—Information that would reveal confidential operations of individual concerns may not
be published and therefore has been redacted and replaced with asterisks.


1
UNITED STATES INTERNATIONAL TRADE COMMISSION Investigation Nos. 731-TA-1233, 1234, and 1236 (Final)
GRAIN-ORIENTED ELECTRICAL STEEL FROM GERMANY, JAPAN, AND POLAND
DETERMINATIONS
On the basis of the record1 developed in the subject investigations, the United States International Trade Commission (“Commission”) determines, pursuant to section 735(b) of the Tariff Act of 1930 (19 U.S.C. § 1673d(b)) (“the Act”), that an industry in the United States is not materially injured or threatened with material injury, and the establishment of an industry in the United States is not materially retarded, by reason of imports from Germany, Japan, and Poland of grain-oriented electrical steel, provided for in subheadings 7225.11.00, 7226.11.10, and 7226.11.90 of the Harmonized Tariff Schedule of the United States, that have been found by the Department of Commerce (“Commerce”) to be sold in the United States at less than fair value (“LTFV”).2
BACKGROUND
The Commission instituted these investigations effective September 18, 2013, following receipt of a petition filed with the Commission and Commerce by AK Steel Corp., West Chester, Ohio; Allegheny Ludlum, LLC, Pittsburgh, Pennsylvania; and the United Steelworkers, Pittsburgh, Pennsylvania. The final phase of the investigations was scheduled by the Commission following notification of preliminary determinations by Commerce that imports of grain-oriented electrical steel from Germany, Japan, and Poland were being sold at LTFV within the meaning of section 733(b) of the Act (19 U.S.C. § 1673b(b)). Notice of the scheduling of the final phase of the Commission’s investigations and of a public hearing to be held in connection therewith was given by posting copies of the notice in the Office of the Secretary, U.S. International Trade Commission, Washington, DC, and by publishing the notice in the Federal Register of June 4, 2014 (79 FR 32310). The hearing was held in Washington, DC, on July 24, 2014, and all persons who requested the opportunity were permitted to appear in person or by counsel.
1 The record is defined in sec. 207.2(f) of the Commission’s Rules of Practice and Procedure (19
CFR § 207.2(f)). 2 Commissioner Rhonda K. Schmidtlein dissented.


3
Views of the Commission
Based on the record in the final phase of these investigations, we find that an industry in the United States is neither materially injured nor threatened with material injury by reason of imports of grain-oriented electrical steel (“GOES”) from Germany, Japan, and Poland found by the U.S. Department of Commerce (“Commerce”) to be sold in the United States at less than fair value.1
I. Background
Parties to the Investigations. The petitions in these investigations concerning GOES from China, Czech Republic, Germany, Japan, Korea, Poland, and Russia were filed on September 18, 2013 by AK Steel Corp. (“AK Steel”) and Allegheny Ludlum, LLC (“Allegheny Ludlum”), both of which are U.S. producers of GOES, and the United Steelworkers (“USW”), which represents workers involved in the U.S. production of GOES.2 Representatives of petitioners appeared at the hearing accompanied by counsel, and petitioners submitted prehearing and posthearing briefs. Six respondent groups participated actively in the final phase investigations. Representatives and counsel for Baoshan Iron & Steel Co., Ltd. and Baosteel America, Inc. (“Baosteel”), a Chinese producer and exporter of the subject merchandise, appeared at the hearing and submitted prehearing and posthearing briefs. Representatives and counsel for the following groups did the same: ThyssenKrupp Electrical Steel GmbH (“ThyssenKrupp”), a German producer and exporter of subject merchandise; Nippon Steel & Sumitomo Metal Corporation (“NSSMC”), a Japanese producer and exporter of subject merchandise; JFE Steel Corporation (“JFE Steel”), a Japanese producer and exporter of subject merchandise; Novolipetsk Steel (“NLMK”), a Russian producer and exporter of subject merchandise; and ABB, Inc. (“ABB”), an importer and purchaser of subject merchandise from Japan and Russia. Data Coverage. U.S. industry data are based on questionnaire responses from the two domestic producers that accounted for all U.S. production of GOES in 2013.3 U.S. import data are based on questionnaire responses of 19 U.S. importers of GOES from the subject countries over the period of investigation (“POI”), which encompasses the period January 1, 2011
1 Commissioner Rhonda K. Schmidtlein dissenting. See her Dissenting Views. She joins sections I-V.B. of these views. 2 Subsequent to the filing of the petitions, the International Union, United Automobile Aerospace and Agricultural Implement Workers of America (“UAW”), which also represents workers involved in the U.S. production of GOES, joined as a petitioner. Commerce has extended its deadlines for issuing final determinations in its investigations of GOES from China, Czech Republic, Korea, and Russia. 79 Fed. Reg. 26936 (May 12, 2014) (id. at 26936 (China), 26939 (Korea), and 26941 (Russia)); 79 Fed. Reg. 26717 (May 9, 2014) (Czech Republic). Commerce also aligned its final countervailing duty determination of imports of GOES from China with its final antidumping duty determination. 79 Fed. Reg. 13617 (Mar. 11, 2014). 3 Confidential Report, INV-MM-077 (Aug. 14, 2014), as revised by INV-MM-080 (Aug. 20, 2014) (“CR”) /Public Report (“PR”) at Table III-1.
4
through March 31, 2014. These 19 importers accounted for *** percent of U.S. imports of GOES from China, *** percent from Czech Republic, *** percent from Germany, *** percent from Japan, *** percent from Korea, *** percent from Poland, and *** percent from Russia.4 The Commission also received the following questionnaire responses from firms accounting for the stated percentages of overall production of GOES in their respective countries during the POI: one firm in China that accounted for *** percent,5 one firm in Czech Republic that accounted for 100 percent,6 one firm in Germany that accounted for 100 percent,7 two firms in Japan that accounted for 100 percent,8 one firm in Korea that accounted for 100 percent,9 and two firms in Russia that accounted for 100 percent.10
II. Domestic Like Product
A. In General
In determining whether an industry in the United States is materially injured or threatened with material injury by reason of imports of subject merchandise, the Commission first defines the “domestic like product” and the “industry.”11 Section 771(4)(A) of the Tariff Act of 1930, as amended (“the Tariff Act”), defines the relevant domestic industry as the “producers as a whole of a domestic like product, or those producers whose collective output of a domestic like product constitutes a major proportion of the total domestic production of the product.”12 In turn, the Tariff Act defines “domestic like product” as “a product which is like, or in the absence of like, most similar in characteristics and uses with, the article subject to an investigation.”13
The decision regarding the appropriate domestic like product in an investigation is a factual determination, and the Commission has applied the statutory standard of “like” or “most similar in characteristics and uses” on a case-by-case basis.14 No single factor is 4 CR/PR at IV-1. 5 CR at VII-4, PR at VII-3. 6 CR at VII-11, PR at VII-5. 7 CR at VII-18, PR at VII-7. 8 CR at VII-23, PR at VII-9. 9 CR at VII-30, PR at VII-11. 10 CR at VII-39, PR at VII-15. The Commission did not receive a questionnaire response from the GOES producer in Poland. CR at VII-35, PR at VII-13. 11 19 U.S.C. § 1677(4)(A). 12 19 U.S.C. § 1677(4)(A). 13 19 U.S.C. § 1677(10). 14 See, e.g., Cleo Inc. v. United States, 501 F.3d 1291, 1299 (Fed. Cir. 2007); NEC Corp. v. Department of Commerce, 36 F. Supp. 2d 380, 383 (Ct. Int’l Trade 1998); Nippon Steel Corp. v. United States, 19 CIT 450, 455 (1995); Torrington Co. v. United States, 747 F. Supp. 744, 749 n.3 (Ct. Int’l Trade 1990), aff’d, 938 F.2d 1278 (Fed. Cir. 1991) (“every like product determination ‘must be made on the particular record at issue’ and the ‘unique facts of each case’”). The Commission generally considers a number of factors, including the following: (1) physical characteristics and uses; (2) interchangeability; (3) channels of distribution; (4) customer and producer perceptions of the products; (5) common (Continued...)

5
dispositive, and the Commission may consider other factors it deems relevant based on the facts of a particular investigation.15 The Commission looks for clear dividing lines among possible like products and disregards minor variations.16 Although the Commission must accept Commerce’s determination as to the scope of the imported merchandise that is subsidized or sold at less than fair value,17 the Commission determines what domestic product is like the imported articles Commerce has identified.18
B. Product Description
Commerce defined the imported merchandise within the scope of these investigations as follows:
GOES. GOES is a flat-rolled alloy steel product containing by weight at least 0.6 percent but not more than 6 percent of silicon, not more than 0.08 percent of carbon, not more than 1.0 percent of aluminum, and no other element in an amount that would give the steel the characteristics of another alloy steel, in coils or in straight lengths. The GOES that is subject to this investigation is currently classifiable under subheadings 7225.11.0000, 7226.11.1000, 7226.11.9030, and 7226.11.9060 of the Harmonized Tariff Schedule of the United States (HTSUS). Although the HTSUS subheadings are provided for convenience and customs purposes, the written description of the scope of these investigations is dispositive. Excluded are flat-rolled products not in coils that, prior to importation into the United States, have been cut to a shape and undergone all
(…Continued) manufacturing facilities, production processes, and production employees; and, where appropriate, (6) price. See Nippon, 19 CIT at 455 n.4; Timken Co. v. United States, 913 F. Supp. 580, 584 (Ct. Int’l Trade 1996). 15 See, e.g., S. Rep. No. 96-249 at 90-91 (1979). 16 Nippon, 19 CIT at 455; Torrington, 747 F. Supp. at 748-49; see also S. Rep. No. 96-249 at 90-91 (Congress has indicated that the like product standard should not be interpreted in “such a narrow fashion as to permit minor differences in physical characteristics or uses to lead to the conclusion that the product and article are not ‘like’ each other, nor should the definition of ‘like product’ be interpreted in such a fashion as to prevent consideration of an industry adversely affected by the imports under consideration.”). 17 See, e.g., USEC, Inc. v. United States, 34 Fed. Appx. 725, 730 (Fed. Cir. 2002) (“The ITC may not modify the class or kind of imported merchandise examined by Commerce.”); Algoma Steel Corp. v. United States, 688 F. Supp. 639, 644 (Ct. Int’l Trade 1988), aff’d, 865 F.3d 240 (Fed. Cir.), cert. denied, 492 U.S. 919 (1989). 18 Hosiden Corp. v. Advanced Display Mfrs., 85 F.3d 1561, 1568 (Fed. Cir. 1996) (the Commission may find a single like product corresponding to several different classes or kinds defined by Commerce); Cleo, 501 F.3d at 1298 n.1 (“Commerce’s {scope} finding does not control the Commission’s {like product} determination.”); Torrington, 747 F. Supp. at 748-52 (affirming the Commission’s determination defining six like products in investigations in which Commerce found five classes or kinds).

6
punching, coating, or other operations necessary for classification in Chapter 85 of the HTSUS as a transformer part (i.e., laminations).19
GOES is sold in either sheet or strip form and either in coils or in straight lengths. GOES, which typically contains approximately 3.2 percent by weight of silicon, is subject to specialized rolling and annealing (heat treatment) processes, which produce grain structures uniformly oriented in the rolling (lengthwise) direction of the steel sheet. This uniformly oriented grain structure permits the steel sheet to conduct a magnetic field with a high degree of efficiency in the direction of rolling compared with other steels, such as non-oriented silicon electrical steel (“NOES”). As a result, GOES has superior magnetic properties compared with NOES, both in terms of higher permeability and lower core loss.20 Both domestic and imported GOES are produced in compliance with specifications issued by ASTM International (“ASTM”)21 or proprietary specifications. The domestic industry produces a wide range of GOES, including conventional GOES in standard gauges (thicknesses), ranging from 0.007 inch (0.18 mm) through 0.0138 inch (0.35 mm), and high-permeability GOES in two standard thicknesses. The conventional products in the standard thicknesses are often referred to by the U.S. grade or American Iron and Steel Institute (“AISI”) grades M2 through M6.22 ASTM standards can be matched with the U.S. grade nomenclature by the product thickness. Within each type of GOES, magnetic characteristics may differ in that the same product manufactured by two producers may have different average core losses.23 GOES is used primarily in the production of laminated cores for large- and medium-sized electrical power transformers and distribution transformers.24 Because thinner laminations
19 79 Fed. Reg. 42501, 42503 (July 22, 2014). 20 “Permeability” refers to the ease with which magnetic lines of force distribute themselves throughout (flow through) a material, or more generally, the ease of magnetization of the GOES product in response to a magnetic field. “Core loss” refers to the measured amount of electrical energy that is lost as heat from eddy currents generated when a magnetic flux flows through the steel. CR at I-18 n.33, PR at I-14 n.33. 21 ASTM International was previously known as the American Society for Testing and Materials. Specification ASTM A876/A876M sets maximum core-loss standards by ASTM grade and by testing standards for conventional GOES, high-permeability GOES, and laser-scribed high-permeability GOES. CR at I-19 n.34, PR at I-14 n.34. 22 The U.S. GOES industry continues to use the “M” grades as a legacy nomenclature. The U.S. grade nomenclature was developed by AISI, which was responsible for establishing the grading and testing standards for GOES until the 1980s when ASTM undertook the responsibility. CR at I-19 n.35, PR at I-14 n.35. 23 CR at I-19, PR at I-14 – I-15. 24 A transformer is an electrical apparatus that transfers electrical energy from one electrical circuit to another without any direct electrical connection by the electromagnetic induction of an alternating electrical current between two or more magnetically coupled coils or windings. Transformers are used to either increase (step-up) or decrease (step-down) the voltage (electrical potential) of an alternating electrical current within the circuitry of electrical equipment or systems. CR at I-21 n.39, PR at I-15 n.39.

7
yield lower core losses in transformers, thinner gauge GOES is often preferred despite the added cost for both the steel and the manufacturing of the transformer core. Laminations for transformer cores are oriented within transformers to take advantage of the directional magnetic properties of the steel.25 The directional magnetic properties of the GOES allow for the transformation of the electrical potential (voltage) for an alternating electrical current. Power transformers are designed to raise the voltage of electrical current from the level at which it is generated by an electric power plant to a higher level for more efficient transmission and to lower the voltage to levels more suitable for local distribution. Distribution transformers, in turn, further lower the electrical voltage to levels suitable for commercial and residential consumers.26 In addition to differences in thickness, GOES is produced in different levels of magnetic permeability, distinguished by the size and orientation precision of the grains within the steel. “Conventional” GOES has smaller but less precisely oriented grains, while “high-permeability” GOES has more precisely oriented but larger grains. High-permeability product allows a transformer to operate at a higher level of flux (flow) density27 than the conventional product, thus permitting a transformer to be smaller and have lower energy operating losses. High-permeability product is also produced as a domain-refined (surface-treated) type that has even lower core loss at high flux density. Domain refinement occurs by scribing thin lines onto the surface of the steel, which subdivides larger oriented grains into smaller ones to produce “domain-refined GOES,” using laser scribing, mechanical scribing or electrolytic etching. Product undergoing laser scribing does not retain its enhanced magnetic characteristics when it is annealed (heat treated) to relieve internal stresses. As a result, laser-scribed GOES (or “non-heat-proof GOES”) is not suitable for producing wound-core transformers,28 which require superior core-loss properties, but must undergo heat treatment to relieve internal stresses (which increase core losses) accumulated from the manufacturing process. By contrast, domain-refined GOES produced by mechanical scribing or electrolytic etching (i.e., “heat-proof GOES”) retains its enhanced magnetic characteristics even through stress-relief treatment. There is no known production of mechanically scribed or electrolytically etched heat-proof GOES in the United States.29
25 CR at I-21, PR at I-15. 26 CR at I-21, PR at I-15. 27 “Flux density” generally refers to the total number of magnetic lines of force per unit area. It can also be understood as the density of magnetic lines of force, or magnetic flux lines, passing through a specific area. CR at I-23 n.43, PR at I-18 n.43. 28 Electrical transformers are produced with either stacked or wound cores. Stacked cores are used in larger distribution and power transformers, while wound cores are used in smaller distribution transformers that step down the voltage from the transmission line and provide power. CR at I-24 – I-25, PR at I-19- I-20. 29 CR at I-23 – I-24, PR at I-18.

8
C. Arguments of the Parties
Petitioners argue that the Commission should define the domestic like product as all GOES, including both conventional and high-permeability GOES, which is coextensive with the scope of the investigations, as it did in its preliminary determinations.30
Two respondents, NLMK and JFE Steel, argue that the Commission should find multiple domestic like products. NLMK argues, as it did in the preliminary phase of the investigations, that due to changes in applicable Department of Energy (“DOE”) regulations, explained below, a clear dividing line exists between lower grade GOES and higher grade GOES, the latter of which can be used to meet the new DOE regulations.31
JFE Steel contends that the Commission should treat heat-proof domain-refined GOES as a separate like product from other forms of GOES. It claims that the physical characteristics of heat-proof domain-refined GOES and other forms of GOES make them quite different. Conventional GOES cannot be used in high-efficiency, low core loss transformer applications, and domain-refined GOES using a laser scribing process cannot be annealed and, therefore, cannot substitute for heat-proof domain-refined GOES.32 Moreover, heat-proof domain-refined GOES cannot be substituted with other types of GOES.33 JFE Steel also maintains that because petitioners do not produce heat-proof domain-refined GOES, manufacturing facilities for the two types of products are distinct and customers perceive them differently.34 JFE Steel also argues that the prices of heat-proof domain-refined GOES are higher than the prices of any other type of domain-refined GOES.35
D. Domestic Like Product Analysis
In its preliminary determinations, the Commission defined a single domestic like product that was coextensive with the scope. In terms of physical characteristics and end uses, it found that all types of GOES, whether conventional or high-permeability, are flat-rolled alloy steel products having a grain-oriented structure that permits the product to conduct a magnetic field in a specific direction with a high degree of efficiency. It also found that all types of GOES share common chemistry and that GOES is used primarily in the production of laminated cores for large and medium-sized electrical power transformers and distribution transformers.36 In terms
30 Petitioners’ Prehearing Brief at 2-3. 31 NLMK’s Prehearing Brief at 6. 32 JFE Steel’s Prehearing Brief at 62-63; see JFE Steel’s Posthearing Brief, Responses to Commissioners’ Questions at 32. 33 JFE Steel’s Prehearing Brief at 64. 34 JFE Steel’s Prehearing Brief at 64-66; JFE Steel’s Posthearing Brief at 12. Petitioners argue that the Commission cannot legally define heat-proof, domain-refined GOES to be a separate like product because it is not produced by the domestic industry. Petitioners’ Posthearing Brief, Exh. 1 at 54. 35 JFE Steel’s Prehearing Brief at 66; JFE Steel’s Posthearing Brief at 14. 36 Grain-Oriented Electrical Steel from China, Czech Republic, Germany, Japan, Korea, Poland, and Russia, Inv. Nos. 701-TA-505 and 731-TA-1231-1237 (Preliminary), USITC Pub. 4439 (Nov. 2013) (“Preliminary Determinations”), at 9.

9
of common manufacturing facilities, production processes and employees, the Commission found that AK Steel produces both conventional and high-permeability GOES on the same equipment using the same manufacturing processes and that Allegheny Ludlum indicated that it was in the process of expanding its product mix to include high-permeability GOES, which it has produced using the same facilities and employees and shipped in trial orders to select customers.37 The Commission also found that AK Steel reported selling both conventional and high-permeability GOES to end users and that Allegheny Ludlum reported sales of conventional GOES to end users.38
The Commission also found there to be some degree of interchangeability among different grades of GOES. It further found that GOES consists of a continuum of types and grades and that an ultimate purchaser’s specifications can often be met using GOES within one or two permeability grade steps.39 The Commission found that notwithstanding differences among the various grades of GOES and the acknowledged distinction between conventional and high-permeability GOES, customers and producers generally perceive both types to be suitable in the construction of transformer cores used in the generation and distribution of electricity.40 With respect to price, the Commission found that prices per short ton for high-permeability GOES overlap with prices for conventional GOES.41
On the basis of the above findings, the Commission defined a single domestic like product, consisting of all GOES, that was coextensive with Commerce’s scope definition.42 The Commission noted in its preliminary determinations that the parties should identify and define with specificity any particular GOES products for which the Commission should collect data.43 No parties did so.44
NLMK, however, reiterated arguments it made in the preliminary phase investigations asserting that DOE regulations support the finding of a clear dividing line between conventional GOES and high-permeability GOES. As previously indicated, the Commission rejected these arguments in the preliminary determinations on the grounds that NLMK mischaracterized the effect of the DOE regulations.45 NLMK has neither disputed the Commission’s prior findings concerning these regulations nor referenced any other information in the record that would
37 Preliminary Determinations, USITC Pub. 4439 at 9. 38 Preliminary Determinations, USITC Pub. 4439 at 9. 39 Preliminary Determinations, USITC Pub. 4439 at 9-10. 40 Preliminary Determinations, USITC Pub. 4439 at 10. The Commission addressed NLMK’s arguments concerning the 2007 changes to the DOE regulations, stating that they did not support a finding of a clear dividing line between lower and higher grades of GOES because the DOE regulations “do not cover all transformer products and thus are limited in the extent to which they indirectly impact potential applications for particular grades or types of GOES.” Indeed, in 2013, DOE removed a type of transformer from the coverage of the 2007 regulations. Id. at 10 n.38. 41 Preliminary Determinations, USITC Pub. 4439 at 10. 42 Preliminary Determinations, USITC Pub. 4439 at 11. 43 Preliminary Determinations, USITC Pub. 4439 at 11 n.41. 44 CR at I-32, PR at I-23. 45 Preliminary Determinations, USITC Pub. 4439 at 10 n.38.
10
support its contention.46 Accordingly, in our view, NLMK’s argument does not warrant further consideration. Indeed, the information in the record of these final phase investigations pertinent to the definition of the domestic like product is substantially unchanged from that collected in the preliminary phase investigations.47
Additionally, as discussed above, JFE Steel argues that the Commission should treat heat-proof domain-refined GOES as a separate like product from other forms of GOES. JFE Steel admits that the domestic industry does not produce heat-proof domain-refined GOES.48 The Commission does not define the domestic like product to include articles that are not domestically produced.49 50 Accordingly, we cannot find that heat-proof domain-refined GOES is a separate domestic like product from other types of GOES.
No other party has argued that we should make a different like product finding than the Commission did in the preliminary phase of these investigations. As previously stated, the record of these final phase investigations does not contain any information that would indicate we should define the domestic like product differently than the Commission did in the preliminary determinations. Therefore, for the same reasons discussed in the preliminary determinations, we find one domestic like product, consisting of all GOES, that is coextensive with Commerce’s scope definition.
III. Domestic Industry
The domestic industry is defined as the domestic “producers as a whole of a domestic like product, or those producers whose collective output of a domestic like product constitutes a major proportion of the total domestic production of the product.”51 In defining the domestic industry, the Commission’s general practice has been to include in the industry producers of all domestic production of the domestic like product, whether toll-produced, captively consumed, or sold in the domestic merchant market. There are no related parties or other domestic industry issues in these investigations. Accordingly, we define the domestic industry as the two U.S. producers of GOES, AK Steel and Allegheny Ludlum.
46 Indeed, NLMK did no more than reference without elaboration the argument it made in the preliminary phase investigations. It did not address the analysis the Commission made in its preliminary determinations. See NLMK’s Prehearing Brief at 6. 47 See generally CR at I-29 – I-39, PR at I-22 – I-26. 48 JFE Steel’s Prehearing Brief at 65. 49 See, e.g., Certain Lined Paper School Supplies, Inv. Nos. 701-TA-442-443 (Preliminary) and 731-TA-1095-1097 (Preliminary), USITC Pub. 3811 (Oct. 2005), at 15 n.50; Artists’ Canvas from China, Inv. No. 731-TA-1091 (Preliminary), USITC Pub. 3777 (May 2005), at 5-6. 50 Vice Chairman Pinkert does not join in this sentence. Nevertheless, given the overlap in physical characteristics and uses discussed in the text -- note in particular the Commission's analysis of conditions of competition -- he agrees with the Commission's determination not to find two domestic like products. 51 19 U.S.C. § 1677(4)(A).

11
IV. Cumulation52
A. Background
For purposes of evaluating the volume and price effects for a determination of material injury by reason of subject imports, section 771(7)(G)(i) of the Tariff Act requires the Commission to cumulate subject imports from all countries as to which petitions were filed and/or investigations self-initiated by Commerce on the same day, if such imports compete with each other and with the domestic like product in the U.S. market. In assessing whether subject imports compete with each other and with the domestic like product, the Commission generally has considered four factors:
(1) the degree of fungibility between subject imports from different countries and between subject imports and the domestic like product, including consideration of specific customer requirements and other quality related questions;
(2) the presence of sales or offers to sell in the same geographic markets of subject imports from different countries and the domestic like product;
(3) the existence of common or similar channels of distribution for subject imports from different countries and the domestic like product; and
(4) whether the subject imports are simultaneously present in the market.53
While no single factor is necessarily determinative, and the list of factors is not
exclusive, these factors are intended to provide the Commission with a framework for determining whether the subject imports compete with each other and with the domestic like product.54 Only a “reasonable overlap” of competition is required.55
52 Between September 2012 and August 2013, imports from China accounted for 5.4 percent of total U.S. imports of GOES, imports from Czech Republic accounted for 9.4 percent, imports from Germany accounted for 7.3 percent, imports from Japan accounted for 47.0 percent, imports from Korea accounted for 10.5 percent, imports from Poland accounted for 6.4 percent, and imports from Russia accounted for 7.4 percent. CR at IV-12, PR at IV-8. Consequently, imports from each subject country accounted for more than three percent of the volume of GOES imported into the United States from all sources in the most recent 12-month period for which data are available preceding the filing of the petition and are therefore not negligible under 19 U.S.C. § 1677(24). 53 See Certain Cast-Iron Pipe Fittings from Brazil, the Republic of Korea, and Taiwan, Inv. Nos. 731-TA-278-280 (Final), USITC Pub. 1845 (May 1986), aff’d, Fundicao Tupy, S.A. v. United States, 678 F. Supp. 898 (Ct. Int’l Trade), aff’d, 859 F.2d 915 (Fed. Cir. 1988). 54 See, e.g., Wieland Werke, AG v. United States, 718 F. Supp. 50 (Ct. Int’l Trade 1989). 55 The Statement of Administrative Action (SAA) to the Uruguay Round Agreements Act (URAA), expressly states that “the new section will not affect current Commission practice under which the (Continued...)

12
B. Arguments of the Parties
Petitioners argue that the Commission should cumulate subject imports from all subject countries in analyzing material injury or threat of material injury by reason of subject imports.56 No respondent argues that the Commission should not cumulate subject imports for the purposes of its analysis of material injury by reason of subject imports. C. Analysis
In these determinations subject imports from China, Czech Republic, Germany, Japan, Korea, Poland, and Russia are eligible for cumulation because petitioners filed the antidumping and countervailing duty petitions with respect to all seven countries on the same day, September 18, 2013.57 For the reasons stated below, we find that there is also a reasonable overlap of competition between subject imports from the subject countries and between subject imports from each source and the domestic like product. Accordingly, we cumulate imports from all seven subject countries for our determinations of material injury by reason of subject imports from Germany, Japan, and Poland.
Fungibility. Both domestic and imported GOES are produced in compliance with ASTM or proprietary specifications.58 Both U.S. producers indicated that imports from each subject country are “always” interchangeable with U.S.-produced GOES and that GOES imported from each of the subject countries is “always” interchangeable with GOES imported from each other subject country. At least two-thirds of responding importers and purchasers indicated that GOES imported from each subject country is either “frequently” or “sometimes” interchangeable with U.S.-produced GOES. At least one-half of responding importers indicated that GOES imported from each subject country is either “frequently” or “sometimes” interchangeable with GOES imported from other subject countries. Most responding purchasers reported that imports from each subject country are “frequently” or “sometimes” interchangeable with U.S.-produced GOES and that GOES imported from each subject country is either “always” or “frequently” interchangeable with GOES imported from other subject countries. No U.S. producer or purchaser, and only one importer, reported that U.S.-produced GOES and GOES imported from any subject country is “never” interchangeable, and no U.S. producer, importer or purchaser reported that GOES imported from any subject countries is “never” interchangeable with GOES imported from any other subject country.59 The record also
(…Continued) statutory requirement is satisfied if there is a reasonable overlap of competition.” H.R. Rep. No. 103-316, Vol. I at 848 (1994) (citing Fundicao Tupy, S.A. v. United States, 678 F. Supp. at 902; see Goss Graphic Sys., Inc. v. United States, 33 F. Supp. 2d 1082, 1087 (Ct. Int’l Trade 1998) (“cumulation does not require two products to be highly fungible”); Wieland Werke, AG, 718 F. Supp. at 52 (“Completely overlapping markets are not required.”). 56 Petitioners’ Prehearing Brief at 18-20. 57 None of the statutory exceptions to cumulation applies. 58 CR at I-18 – I-19, PR at I-14 – I-15. 59 CR/PR at Table II-9.

13
indicates that at least half of responding purchasers reported that the domestically produced product and imports from each subject country were comparable in terms of availability, discounts offered, extension of credits, minimum quantity requirements, and packaging.60
Channels of Distribution. U.S. producers sold GOES mainly to end users, but also sold GOES to distributors and to slitters and laminators. Subject imports from Germany, Japan, and Russia were sold to slitters and laminators and to end users. Subject imports from China, Korea, and Poland were sold to end users. Importers of subject product from Czech Republic sold *** of their product to slitters and laminators.61
Geographic Overlap. *** reported selling GOES to all regions in the contiguous United States, but *** did not sell GOES in the *** regions. Importers from each subject country reported selling product to each region, except that no importers of Chinese product sold to the Northeast or Mountain regions.62
Simultaneous Presence in Market. U.S.-produced GOES was present throughout the period of investigation. Subject imports from all seven countries were similarly present during this period.63
Conclusion. The record indicates that there is a reasonable overlap of competition between and among subject imports from all sources and the domestic like product. The factors concerning geographic overlap and simultaneous presence in the market are clearly satisfied. The record indicates a sufficient degree of fungibility between and among subject imports from each source and the domestic like product for purposes of a cumulation analysis. There is an overlap in terms of channels of distribution between the domestic like product and imports from all subject countries. Although channels of distribution differ between subject imports from Czech Republic, on the one hand, and subject imports from China, Korea, and Poland, on the other, we do not view this as dispositive for our cumulation analysis, particularly in light of the lack of any contrary argument and because subject imports from Czech Republic satisfy the other factors we have examined. Accordingly, for purposes of our analysis of material injury by reason of subject imports from Germany, Japan, and Poland, we cumulate subject imports from China, Czech Republic, Germany, Japan, Korea, Poland, and Russia.
V. No Material Injury by Reason of Cumulated Subject Imports
A. Legal Standards
In the final phase of antidumping and countervailing duty investigations, the Commission determines whether an industry in the United States is materially injured or threatened with material injury by reason of the imports under investigation.64 In making this determination, the Commission must consider the volume of subject imports, their effect on
60 CR/PR at Table II-8. 61 CR/PR at Table II-1. 62 CR at II-3, PR at II- 1 – II-2; see CR/PR at Table IV-14. 63 CR/PR at Table IV-15. 64 19 U.S.C. §§ 1671d(b), 1673d(b).

14
prices for the domestic like product, and their impact on domestic producers of the domestic like product, but only in the context of U.S. production operations.65 The statute defines “material injury” as “harm which is not inconsequential, immaterial, or unimportant.”66 In assessing whether the domestic industry is materially injured by reason of subject imports, we consider all relevant economic factors that bear on the state of the industry in the United States.67 No single factor is dispositive, and all relevant factors are considered “within the context of the business cycle and conditions of competition that are distinctive to the affected industry.”68
Although the statute requires the Commission to determine whether the domestic industry is “materially injured or threatened with material injury by reason of” unfairly traded imports,69 it does not define the phrase “by reason of,” indicating that this aspect of the injury analysis is left to the Commission’s reasonable exercise of its discretion.70 In identifying a causal link, if any, between subject imports and material injury to the domestic industry, the Commission examines the facts of record that relate to the significance of the volume and price effects of the subject imports and any impact of those imports on the condition of the domestic industry. This evaluation under the “by reason of” standard must ensure that subject imports are more than a minimal or tangential cause of injury and that there is a sufficient causal, not merely a temporal, nexus between subject imports and material injury.71
In many investigations, there are other economic factors at work, some or all of which may also be having adverse effects on the domestic industry. Such economic factors might include nonsubject imports; changes in technology, demand, or consumer tastes; competition among domestic producers; or management decisions by domestic producers. The legislative history explains that the Commission must examine factors other than subject imports to ensure that it is not attributing injury from other factors to the subject imports, thereby
65 19 U.S.C. § 1677(7)(B). The Commission “may consider such other economic factors as are relevant to the determination” but shall “identify each {such} factor ... and explain in full its relevance to the determination.” 19 U.S.C. § 1677(7)(B). 66 19 U.S.C. § 1677(7)(A). 67 19 U.S.C. § 1677(7)(C)(iii). 68 19 U.S.C. § 1677(7)(C)(iii). 69 19 U.S.C. §§ 1671d(a), 1673d(a). 70 Angus Chemical Co. v. United States, 140 F.3d 1478, 1484-85 (Fed. Cir. 1998) (“{T}he statute does not ‘compel the commissioners’ to employ {a particular methodology}.”), aff’g, 944 F. Supp. 943, 951 (Ct. Int’l Trade 1996). 71 The Federal Circuit, in addressing the causation standard of the statute, observed that “{a}s long as its effects are not merely incidental, tangential, or trivial, the foreign product sold at less than fair value meets the causation requirement.” Nippon Steel Corp. v. USITC, 345 F.3d 1379, 1384 (Fed. Cir. 2003). This was further ratified in Mittal Steel Point Lisas Ltd. v. United States, 542 F.3d 867, 873 (Fed. Cir. 2008), where the Federal Circuit, quoting Gerald Metals, Inc. v. United States, 132 F.3d 716, 722 (Fed. Cir. 1997), stated that “this court requires evidence in the record ‘to show that the harm occurred “by reason of” the LTFV imports, not by reason of a minimal or tangential contribution to material harm caused by LTFV goods.’” See also Nippon Steel Corp. v. United States, 458 F.3d 1345, 1357 (Fed. Cir. 2006); Taiwan Semiconductor Industry Ass’n v. USITC, 266 F.3d 1339, 1345 (Fed. Cir. 2001).

15
inflating an otherwise tangential cause of injury into one that satisfies the statutory material injury threshold.72 In performing its examination, however, the Commission need not isolate the injury caused by other factors from injury caused by unfairly traded imports.73 Nor does the “by reason of” standard require that unfairly traded imports be the “principal” cause of injury or contemplate that injury from unfairly traded imports be weighed against other factors, such as nonsubject imports, which may be contributing to overall injury to an industry.74 It is clear that the existence of injury caused by other factors does not compel a negative determination.75
Assessment of whether material injury to the domestic industry is “by reason of” subject imports “does not require the Commission to address the causation issue in any particular way” as long as “the injury to the domestic industry can reasonably be attributed to the subject imports” and the Commission “ensure{s} that it is not attributing injury from other sources to
72 SAA at 851-52 (“{T}he Commission must examine other factors to ensure that it is not attributing injury from other sources to the subject imports.”); S. Rep. 96-249 at 75 (1979) (the Commission “will consider information which indicates that harm is caused by factors other than less-than-fair-value imports.”); H.R. Rep. 96-317 at 47 (1979) (“in examining the overall injury being experienced by a domestic industry, the ITC will take into account evidence presented to it which demonstrates that the harm attributed by the petitioner to the subsidized or dumped imports is attributable to such other factors;” those factors include “the volume and prices of nonsubsidized imports or imports sold at fair value, contraction in demand or changes in patterns of consumption, trade restrictive practices of and competition between the foreign and domestic producers, developments in technology and the export performance and productivity of the domestic industry”); accord Mittal Steel, 542 F.3d at 877. 73 SAA at 851-52 (“{T}he Commission need not isolate the injury caused by other factors from injury caused by unfair imports.”); Taiwan Semiconductor Industry Ass’n, 266 F.3d at 1345 (“{T}he Commission need not isolate the injury caused by other factors from injury caused by unfair imports ... . Rather, the Commission must examine other factors to ensure that it is not attributing injury from other sources to the subject imports.” (emphasis in original)); Asociacion de Productores de Salmon y Trucha de Chile AG v. United States, 180 F. Supp. 2d 1360, 1375 (Ct. Int’l Trade 2002) (“{t}he Commission is not required to isolate the effects of subject imports from other factors contributing to injury” or make “bright-line distinctions” between the effects of subject imports and other causes.); see also Softwood Lumber from Canada, Inv. Nos. 701-TA-414 and 731-TA-928 (Remand), USITC Pub. 3658 at 100-01 (Dec. 2003) (Commission recognized that “{i}f an alleged other factor is found not to have or threaten to have injurious effects to the domestic industry, i.e., it is not an ‘other causal factor,’ then there is nothing to further examine regarding attribution to injury”), citing Gerald Metals, 132 F.3d at 722 (the statute “does not suggest that an importer of LTFV goods can escape countervailing duties by finding some tangential or minor cause unrelated to the LTFV goods that contributed to the harmful effects on domestic market prices.”). 74 S. Rep. 96-249 at 74-75; H.R. Rep. 96-317 at 47. 75 See Nippon Steel Corp., 345 F.3d at 1381 (“an affirmative material-injury determination under the statute requires no more than a substantial-factor showing. That is, the ‘dumping’ need not be the sole or principal cause of injury.”).
16
the subject imports.”76 77 Indeed, the Federal Circuit has examined and affirmed various Commission methodologies and has disavowed “rigid adherence to a specific formula.”78
The Federal Circuit’s decisions in Gerald Metals, Bratsk, and Mittal Steel all involved cases where the relevant “other factor” was the presence in the market of significant volumes of price-competitive nonsubject imports. The Commission interpreted the Federal Circuit’s guidance in Bratsk as requiring it to apply a particular additional methodology following its finding of material injury in cases involving commodity products and a significant market presence of price-competitive nonsubject imports.79 The additional “replacement/benefit” test looked at whether nonsubject imports might have replaced subject imports without any benefit to the U.S. industry. The Commission applied that specific additional test in subsequent cases, including the Carbon and Certain Alloy Steel Wire Rod from Trinidad and Tobago determination that underlies the Mittal Steel litigation.
Mittal Steel clarifies that the Commission’s interpretation of Bratsk was too rigid and makes clear that the Federal Circuit does not require the Commission to apply an additional test nor any one specific methodology; instead, the court requires the Commission to have “evidence in the record” to “show that the harm occurred ‘by reason of’ the LTFV imports,” and requires that the Commission not attribute injury from nonsubject imports or other factors to subject imports.80 Accordingly, we do not consider ourselves required to apply the
76 Mittal Steel, 542 F.3d at 877-78; see also id. at 873 (“While the Commission may not enter an affirmative determination unless it finds that a domestic industry is materially injured ‘by reason of’ subject imports, the Commission is not required to follow a single methodology for making that determination ... {and has} broad discretion with respect to its choice of methodology.”) citing United States Steel Group v. United States, 96 F.3d 1352, 1362 (Fed. Cir. 1996) and S. Rep. 96-249 at 75. 77 Vice Chairman Pinkert does not join this paragraph or the following three paragraphs. He points out that the Federal Circuit, in Bratsk, 444 F.3d 1369, and Mittal Steel, held that the Commission is required, in certain circumstances when considering present material injury, to undertake a particular kind of analysis of non-subject imports, albeit without reliance upon presumptions or rigid formulas. Mittal Steel explains as follows:
What Bratsk held is that “where commodity products are at issue and fairly traded, price competitive, non-subject imports are in the market,” the Commission would not fulfill its obligation to consider an important aspect of the problem if it failed to consider whether non-subject or non-LTFV imports would have replaced LTFV subject imports during the period of investigation without a continuing benefit to the domestic industry. 444 F.3d at 1369. Under those circumstances, Bratsk requires the Commission to consider whether replacement of the LTFV subject imports might have occurred during the period of investigation, and it requires the Commission to provide an explanation of its conclusion with respect to that factor.
542 F.3d at 878. 78 Nucor Corp. v. United States, 414 F.3d 1331, 1336, 1341 (Fed. Cir. 2005); see also Mittal Steel, 542 F.3d at 879 (“Bratsk did not read into the antidumping statute a Procrustean formula for determining whether a domestic injury was ‘by reason’ of subject imports.”). 79 Mittal Steel, 542 F.3d at 875-79. 80 Mittal Steel, 542 F.3d at 873 (quoting from Gerald Metals, 132 F.3d at 722), 875-79 & n.2 (recognizing the Commission’s alternative interpretation of Bratsk as a reminder to conduct a non-attribution analysis).

17
replacement/benefit test that was included in Commission opinions subsequent to Bratsk. The progression of Gerald Metals, Bratsk, and Mittal Steel clarifies that, in cases
involving commodity products where price-competitive nonsubject imports are a significant factor in the U.S. market, the Court will require the Commission to give full consideration, with adequate explanation, to non-attribution issues when it performs its causation analysis.81
The question of whether the material injury threshold for subject imports is satisfied notwithstanding any injury from other factors is factual, subject to review under the substantial evidence standard.82 Congress has delegated this factual finding to the Commission because of the agency’s institutional expertise in resolving injury issues.83
B. Conditions of Competition and the Business Cycle
The following conditions of competition inform our analysis of whether there is material injury by reason of subject imports.
1. Demand Considerations
GOES is used primarily in the production of laminated cores for large and medium-sized electrical power transformers and distribution transformers. Power transformers are designed to raise the voltage of electrical current from the level at which it is generated by an electric power plant to a higher level for more efficient transmission and to lower the voltage to levels more suitable for local distribution. Distribution transformers further lower the electrical voltage to levels suitable for commercial and residential consumers.84
It is undisputed that there are two main drivers of transformer demand: replacement and new transformer demand. Petitioners stated that the degree to which utilities replace transformers is a demand driver in the replacement market, which currently makes up about 65 to 70 percent of the market for GOES and accounted for 75 to 80 percent of the market in 2011. They indicate that because of aging transformers, there has been a small increase in the
81 To that end, after the Federal Circuit issued its decision in Bratsk, the Commission began to present published information or send out information requests in final phase investigations to producers in nonsubject countries that accounted for substantial shares of U.S. imports of subject merchandise (if, in fact, there were large nonsubject import suppliers). In order to provide a more complete record for the Commission’s causation analysis, these requests typically seek information on capacity, production, and shipments of the product under investigation in the major source countries that export to the United States. The Commission plans to continue utilizing published or requested information in final phase investigations in which there are substantial levels of nonsubject imports. 82 We provide in our respective discussions of volume, price effects, and impact a full analysis of other factors alleged to have caused any material injury experienced by the domestic industry. 83 Mittal Steel, 542 F.3d at 873; Nippon Steel Corp., 458 F.3d at 1350, citing U.S. Steel Group, 96 F.3d at 1357; S. Rep. 96-249 at 75 (“The determination of the ITC with respect to causation is ... complex and difficult, and is a matter for the judgment of the ITC.”). 84 CR at I-21, PR at I-15.

18
replacement market over the historical rate of 3 percent per year.85 Housing starts are the biggest driver for demand in the new transformer market for
GOES. Seasonally adjusted housing starts increased by 42 percent between January 2011 and June 2014. Housing starts, however, remain well below historic averages.86
One of two responding U.S. producers, four of 11 responding importers and 10 of 17 responding purchasers indicated that the market for GOES was subject to either business cycles or distinct conditions of competition. Several purchasers indicated that demand is higher in the summer and during natural disasters and storm seasons.87
Both producers and the majority of purchasers reported an increase in U.S. demand since 2011, while a majority of importers reported a decrease in demand.88 Most firms reporting an increase in demand attributed the increase to the recovery in the economy or housing market, while most firms reporting a decline in demand cited the slowdown in the economy, housing sector or the renewable energy sector.89
Apparent U.S. consumption fluctuated within a fairly narrow range during the period of investigation. It was *** short tons in 2011, *** short tons in 2012, and *** short tons in 2013. It was *** short tons in interim (January-March) 2013 and *** short tons in interim 2014.90
During the period of investigation, conventional grades of GOES accounted for the predominant share of shipments in the U.S. market. However, demand for higher efficiency grades increased significantly between 2011 and 2013.91 This is likely due, at least in large part, to the DOE regulations that mandated higher energy efficiency standards. The Energy Policy and Conservation Act, 42 U.S.C. § 6317(a)(2), directs the DOE to adopt energy conservation standards for those distribution transformers for which standards would be technologically feasible and economically justified and would result in energy savings. Standards were promulgated in 2007. Higher efficiency standards were imposed in 2010, and revised efficiency requirements will become effective in 2016.92
Global demand for GOES is driven principally by growth in electricity consumption, reflected in the expansion or upgrading of electrical transmission and generating capacity, e.g., transformers. While little public information is available on the global consumption and production of GOES itself, according to the U.S. Energy Information Administration, between 2009 and 2011, the latest year for which statistics are available, global energy consumption increased by 11.4 percent to 19.3 trillion kilowatt hours (kWh). During the same period, global installed electricity capacity increased by 10.0 percent to 5.3 billion kilowatts (kW).93
85 CR at II-16, PR at II-9. 86 CR at II-16, PR at II-9. 87 CR at II-18, PR at II-11. 88 CR/PR at Table II-3. 89 CR at II-19, PR at II-11. 90 CR/PR at Table IV-15. 91 See CR/PR at Tables IV-17 – IV-25. 92 CR at II-19, PR at II-11; Tr. at 31 (Polinski). 93 CR at VII-54, PR at VII-25.
19
2. Supply Considerations
The U.S. market is supplied by the domestic industry, subject imports and nonsubject imports. The two domestic producers supply the bulk of the market. The domestic industry’s share of apparent U.S. consumption, as measured by quantity, was *** percent in 2011, *** percent in 2012, and *** percent in 2013.94 Cumulated subject imports were present throughout the entire period of investigation. Their share of apparent U.S. consumption was *** percent in 2011, *** percent in 2012, and *** percent in 2013.95 Subject imports supplied a larger portion of the U.S. market than nonsubject sources. Nonsubject import market share was *** percent in 2011, *** percent in 2012, and *** percent in 2013.96 The leading nonsubject sources of imports included the United Kingdom and Italy.97
3. Substitutability
As noted above, GOES is produced in compliance with specifications issued by ASTM or proprietary specifications. Commission staff found that there is a moderate to high degree of substitutability between the domestic like product and GOES imported from subject sources.98 Generally speaking, both U.S. producers indicated that imports from all subject and nonsubject countries are “always” interchangeable and that U.S.-produced GOES and GOES imported from all subject and nonsubject countries is “always” interchangeable.99 At least two-thirds of responding importers and purchasers indicated that GOES imported from all subject countries is either “frequently” or “sometimes” interchangeable with U.S.-produced GOES. At least one-half of responding importers and two-thirds of responding purchasers indicated that GOES imported from other subject countries is either “frequently” or “sometimes” interchangeable with GOES imported from other subject countries and nonsubject countries and that U.S.-produced GOES is either “frequently” or “sometimes” interchangeable with GOES imported from nonsubject countries.100 However, when comparing broad categories of conventional, domain-refined and non-domain-refined GOES, U.S. producers reported that these different types of GOES were either frequently or sometimes interchangeable with each other, while most responding importers and purchasers indicated that they were either sometimes or never interchangeable or
94 CR/PR at Table IV-16. The domestic industry’s share of apparent U.S. consumption was *** percent in interim 2013 and *** percent in interim 2014. Id. 95 CR/PR at Table IV-16. Cumulated subject imports’ share of apparent U.S. consumption was *** percent in interim 2013 and *** percent in interim 2014. Id. 96 CR/PR at Table IV-16. Nonsubject import market share was *** percent in interim 2013 and *** percent in interim 2014. Id. 97 CR/PR at Table IV-2 note. 98 CR at II-21, PR at II-13. 99 CR/PR at Table II-9. 100 CR/PR at Table II-9.

20
interchangeable only in certain applications.101 Only one domestic producer, AK Steel, manufactures high-permeability GOES as well as conventional GOES; Allegheny Ludlum’s production is limited to the conventional grades, but it indicated that it is in the process of expanding its product mix to include high-permeability GOES and has successfully produced and shipped that product in trial orders to select customers.102 There is limited interchangeability with respect to different specifications of GOES.103 Some firms indicated that in certain applications, conventional GOES could be interchanged with high-permeability non-domain-refined GOES and that in some applications, such as a large transformer with a stacked core, the heat-proof and non-heat-proof GOES could be interchangeable. However, non-heat-proof GOES would not be interchangeable with heat-proof GOES in wound transformer cores. Firms also indicated that there is a tradeoff between the grade and cost of the GOES used and the transformer design.104 Thus, it may not be economically or commercially viable to substitute certain types of GOES with others, even though it may be technically feasible.105 Producers from Japan reported that *** of the subject imports from Japan consist of the heat-proof product that is directed to the high-end, premium GOES market that uses proprietary, patent-protected domain-refined processes.106 Russian producer NLMK reported that the higher grades required under the 2007 DOE regulations have effectively prevented its sales to the United States, as the market has shifted to higher efficiency products that the Russian producers cannot provide.107 In sum, as discussed above, there is some overlap between the domestic like product and the subject imports in the use of different types of GOES for the same applications, according to producers as well as reporting importers and purchasers. There are also distinctions, however, between various types of GOES products that limit their interchangeability. The domestic industry does not produce high-permeability, heat-proof GOES that is supplied by the subject imports. In 2013, most domestic shipments were of
101 CR/PR at Table II-7. 102 CR at I-34, PR at I-25. 103 For instance, a recent DOE study confirms that high-permeability domain-refined GOES and M-2 and M-3 grade GOES can be used interchangeably to achieve relevant efficiency standards. Petitioners’ Posthearing Brief, Exh. 14. 104 CR at II-27, PR at II-17. 105 JFE Steel’s Posthearing Brief, Responses to Commissioners’ Questions at 17, 28-31; ABB’s Posthearing Brief at 8; Tr. at 168 (Woolfort). If the price of the higher efficiency product is low enough, however, it may make commercial sense to purchase that product. Tr. at 74-75 (Petersen). 106 CR at VII-29, PR at VII-11. We note that subject imports of heat-proof GOES from Japan accounted for approximately *** of reported U.S. shipments of subject imports from Japan in 2013. See CR/PR at Table IV-8. 107 CR at VII-43, PR at VII-17. NLMK manufactures only *** GOES, while Russian producer Public Joint Stock Company Ashinskiy Metallurgical Works (“Ashinskiy”) manufactures ***. CR at VII-44, PR at VII-17. However, Ashinskiy accounted for only *** percent of total GOES production in 2013, and in the most recent fiscal year, only *** percent of Ashinskiy’s total company sales were sales of GOES. CR at VII-39, PR at VII-16.

21
conventional grades,108 while most shipments of the subject imports were high-permeability products.109 We find that the record indicates, overall, that the domestic like product and the subject imports are at least moderately substitutable.
4. Other Conditions
Although price is an important factor in purchasing decisions, quality and availability are other top factors.110 While quality was most frequently cited by purchasers as their top factor in purchasing GOES, price was second. Seven of 21 responding purchasers indicated that price was the most important factor in considering a purchase, and 17 of 21 purchasers indicated that price was one of the three most important purchasing factors.111 Raw material costs comprised *** to *** percent of U.S. producers’ cost of goods sold during 2011 to 2013. The domestic industry’s per-ton raw material costs declined between 2011 and 2013, but were higher in interim 2014 than in interim 2013. Steel scrap and silicon are the predominant material inputs in GOES. Prices for ferrosilicon and ferrous scrap have declined since January 2011, decreasing overall by 10 and 15 percent, respectively, by June 2014. Aside from seasonal fluctuations, the industrial price of electricity generally remained at the same level since January 2011.112 U.S. producers and importers reported selling GOES mostly through contracts. U.S. producers reported making almost *** percent of their sales using short term contracts and just over *** percent using long term contracts, with the remainder being spot sales. Most importers reported making the bulk of their sales with short term contracts.113 U.S. producers use raw material surcharges in contract prices, with the *** primary surcharge elements being ***.114 Importers reported that they do not impose surcharges.115 GOES is sold to distributors, slitters/laminators, and end users. U.S. producers sold mainly to end users during the period of investigation, as did importers of subject product from China, Japan, Korea, Poland, and Russia. Particularly with respect to imports from ***, certain
108 Indeed, conventional grade M-3 alone accounted for *** percent of the domestic industry’s U.S. shipments of GOES in 2013. CR/PR at Table III-7. 109 Compare CR/PR at Table III-8 with Tables IV-5 – IV-11. 110 CR at II-23, PR at II-13 – II-14, CR/PR at Table II-5. 111 CR at II-23, PR at II-14, CR/PR at Table II-5. Eleven of 21 responding purchasers reported that quality was the most important factor in considering a purchase, and 20 of 21 purchasers reported that quality was one of the three most important purchasing factors. CR at II-23, PR at II-14, CR/PR at Table II-5. 112 CR at V-1 – V-2, PR at V-1. 113 CR at V-3 – V-4, PR at V-2 – V-3; see ABB’s Posthearing Brief at 5-6 n.17, 12 (ABB’s contracts to purchase imported GOES ***). 114 CR at V-2, PR at V-1. 115 See ABB’s Posthearing Brief at 5-6 n.17, 12.

22
end users were themselves the importers of record.116 Importers of subject merchandise from Germany sold GOES primarily to slitters and laminators, while importers of subject product from Czech Republic sold *** of their product to slitters and laminators.117 While there have been *** direct exports of GOES from China to the United States since January 2011, GOES was exported from China to processors located in Canada and Mexico that perform slitting operations to customer specifications, store the slit GOES in facilities for resale to the United States, and re-sell the slit GOES to purchasers in the United States for just-in-time delivery.118 All responding purchasers but one require their GOES suppliers to be or become certified. Purchasers reported that the amount of time required to qualify a new supplier ranged from 15 to 360 days, with most certifications requiring 100 to 180 days. Six purchasers reported instances since 2011 when either a domestic or foreign supplier had failed in its attempt to qualify product, or a supplier had lost its approved status. *** were each named by three purchasers as failing to qualify, along with *** and the ***.119
C. Volume of Subject Imports
Section 771(7)(C)(i) of the Tariff Act provides that the “Commission shall consider whether the volume of imports of the merchandise, or any increase in that volume, either in absolute terms or relative to production or consumption in the United States, is significant.”120
The volume of cumulated subject imports increased between 2011 and 2013. It was 26,234 short tons in 2011, 31,182 short tons in 2012, and 29,161 short tons in 2013.121 Most of the change in the volume of subject imports between 2011 and 2013 occurred as a result of the increase in shipments of high-permeability GOES, particularly the heat-proof domain-refined GOES uniquely supplied by Japan. As previously stated, during the period, U.S. GOES demand
116 CR/PR at II-1. Direct importation by these end users accounted for *** percent of total reported subject imports from Japan, *** percent of subject imports from Poland and *** percent of subject imports from Russia during the period of investigation. Petitioners’ Prehearing Brief at 15. 117 CR at II-1, PR at II-1. 118 CR at VII-7, PR at VII-4. The producer in China is not the U.S. importer of record. However, the GOES that is ultimately imported into the United States retains its Chinese origin for Customs purposes because slitting is not a significant manufacturing operation. Id. 119 CR at II-28, PR at II-17. Although *** was reported as a producer that failed to qualify, id., it appears from other evidence in the record that this firm is an importer. See *** Importer Questionnaire Response. 120 19 U.S.C. § 1677(7)(C)(i). 121 CR/PR at Table IV-15. The volume of cumulated subject imports was 7,940 short tons in interim 2013 and 3,122 short tons in interim 2014. Id. The petitions were filed on September 18, 2013, and most importers’ lead times for product made to order ranged up to *** days, CR at II-22, PR at II-13. Seven of 11 importers made *** of their sales to order. Because of the lag time between order and delivery, orders placed after the filing of the petition would be unlikely to reach U.S. ports until December 2013 or later. Thus, we do not attribute the decline in subject import volume and market share from 2012 to 2013 to the filing of the petition. By contrast, we do attribute the reduced volume of subject imports in interim 2014 to the filing of the petition, and we exercise our discretion to accord less weight to these interim data. See 19 U.S.C. § 1677(7)(I).

23
shifted towards higher efficiency grades.122 Subject import market share also increased from 2011 to 2013, notwithstanding a
decline between 2012 and 2013. Subject import market penetration was *** percent in 2011, *** percent in 2012, and *** percent in 2013.123 Most of this increase occurred at the expense of nonsubject imports, although the domestic industry also lost *** percentage points of market share from 2011 to 2013. Nonsubject import market share fell from *** percent in 2011 to *** percent in 2012 and *** percent in 2013.124 The U.S. producers’ market share declined from *** percent in 2011 to *** percent in 2012, then increased to *** percent in 2013.125
In view of the foregoing, we find the volume of subject imports to be significant in absolute terms and relative to consumption in the United States. However, for the reasons we discuss below, we do not find significant adverse price effects or a significant adverse impact on the domestic industry by reason of the subject imports.126
D. Price Effects of the Subject Imports
Section 771(7)(C)(ii) of the Tariff Act provides that in evaluating the price effects of the subject imports, the Commission shall consider whether
(I) there has been significant price underselling by the imported merchandise as compared with the price of domestic like products of the United States, and
(II) the effect of imports of such merchandise otherwise depresses prices to a significant degree or prevents price increases, which otherwise would have occurred, to a significant degree.127
As previously discussed, while price is an important factor in purchasing decisions, quality, consistency and availability are also important. Moreover, as discussed earlier in our analysis of substitutability, there are non-price differences between the domestic like product and the subject imports, reflecting differences in product mix. Subject imports undersold the domestic like product in 65 of 90 standard quarterly price comparisons, with margins of underselling ranging from 0.2 to 28.6 percent.128 While we find
122 Compare CR/PR at Tables IV-17 – IV-19 with CR/PR at Tables IV-21 – IV-25. 123 CR/PR at Table IV-16. Subject import market share was *** percent in interim 2013 and *** percent in interim 2014. Id. 124 CR/PR at Table IV-16. Nonsubject import market share was *** percent in interim 2013 and *** percent in interim 2014. Id. 125 CR/PR at Table IV-16. The U.S. producers’ market share was *** percent in interim 2013 and *** percent in interim 2014. Id. 126 Commissioner Schmidtlein does not join the remainder of these views. See her Dissenting Views. 127 19 U.S.C. § 1677(7)(C)(ii). 128 CR at V-28, PR at V-8.

24
that underselling was prevalent during the period of investigation, its significance is mitigated by its lack of any significant impact on the domestic industry’s market share or on prices for the domestic like product, as explained below. Notwithstanding the observed underselling, there were not significant changes in the domestic industry’s market share, which was relatively stable from 2011 to 2013. As discussed above, the domestic industry lost only *** percentage points of market share during that period.129 Although the domestic industry’s prices declined substantially during this same period, we do not find that this price depression was due to subject imports. Prices declined during the period of investigation for all domestically produced pricing products.130 There was, however, a lack of correlation between the magnitude of the price declines for the various products and the degree of subject import competition. The Commission collected pricing data on five products and subdivided each of these products into two groups.131 Some of the pricing comparisons, such as for pricing products 2a, 4b, and 5b, involve volumes of subject imports that compete directly with the most comparable domestic like product. Other pricing comparisons, such as for pricing products 1a, 1b, and 2b, involve far smaller volumes of subject imports.132 The domestically produced products with the most substantial price declines were
129 CR/PR at Table IV-16. 130 CR/PR at Table V-10.
131 Three products were types of conventional GOES, and two were types of domain-refined high-permeability GOES. Data were collected separately for conventional GOES products sold to slitters/laminators and those sold to other purchasers. For domain-refined high-permeability GOES products, data were collected separately for mechanically or chemically scribed/heat-proof and laser-scribed/non-heat-proof products. CR at V-6 – V-7 & n.10, PR at V-4 – V-5 & n.10. The petitioners chose the pricing products for which data were obtained in these investigations. Petition at 20-21; see id. at 21 (“These price descriptors accounted for over half of all sales made in the United States of GOES during the POI and, accordingly are the appropriate products for the Commission’s analysis and comparison of U.S. producer and import prices”). Data were collected for distinct channels of distribution in accordance with comments received on the draft questionnaires (products 1-3 were modified to ask for data by channel). See ThyssenKrupp’s Comments on Draft Questionnaires at 103 (channels on products 1-3). Products 4 and 5 were modified to ask for data according to whether the product was heat-proof. See JFE Steel’s Comments on Draft Questionnaires at 1. Pricing data accounted for approximately *** percent of U.S. producers’ shipments of product, *** percent of subject imports from China, *** percent of subject imports from Czech Republic, *** percent of subject imports from Germany, *** percent of subject imports from Japan, *** percent of subject imports from Korea, *** percent of subject imports from Poland, *** percent of subject imports from Russia, and 38 percent of all subject imports since 2011. CR at V-7, PR at V-5. Data for direct imports were also collected from U.S. importers that internally consume GOES from ***. See CR/PR at App. D. 132 Pricing product 1 is conventional M-3 GOES, pricing product 2 is conventional M-4 GOES, and pricing products 4 and 5 are domain-refined high-permeability GOES (non-heat-proof). Based on broader U.S. shipment data, conventional M-3 GOES accounted for *** short tons of U.S. shipments from all sources in 2013 and is the largest single grade sold in the United States. In 2013, domestic producers accounted for *** percent of U.S. shipments of M-3 GOES, *** percent of M-4 GOES, and *** percent of domain-refined high-permeability GOES (non-heat-proof). Subject imports accounted for *** percent of U.S. shipments of M-3 GOES, *** percent of M-4 GOES, and *** percent of domain-refined (Continued...)
25
pricing products 1a, 1b, and 2b. Domestic prices declined *** percent for product 1a, *** percent for product 1b, and *** percent for product 2b. While there were substantial shipments from both U.S. producers for each of these pricing products, there were very few shipments of subject imports, including internal consumption.133 By contrast, the smallest declines for domestically produced products occurred in pricing products 2a, 4b, and 5b, in which there was a significant amount of competition between the domestic like product and the subject imports. Prices declined by *** percent for product 2a, *** percent for product 4b, and *** percent for product 5b.134 The change in these prices was comparable to the decrease in raw material costs. The cost of raw materials used to produce one ton of GOES decreased by *** percent from 2011 to 2013.135 As explained above, the domestic industry indicated that it includes adjustments for raw material costs in its sales contracts. Decreasing capacity utilization136 contributed to the declines in prices for domestically produced products. The domestic industry’s exports decreased by more than *** short tons from 2011 to 2013, as *** reduced its presence in foreign markets.137 Exports accounted for *** percent of AK Steel’s total shipments in 2011 and fell to only *** percent in 2013.138 The loss of these export sales *** increased AK Steel’s unused capacity. In addition, domestic producer Allegheny Ludlum’s unused capacity also increased *** after its loss of a major purchaser, Howard Industries, which is one of the *** U.S. purchasers, averaging purchases of *** tons annually over the period of investigation139 and representing *** percent of Allegheny Ludlum’s shipments in 2011.140 *** were of GOES produced in the United States,141 and Allegheny Ludlum’s sales to Howard Industries were ***.142 Whereas AK Steel supplied *** short tons of GOES to Howard Industries in 2011, it supplied *** short tons to this purchaser in
(…Continued) high-permeability GOES (non-heat-proof), with additional volumes of domain-refined high-permeability GOES (heat-proof). See CR/PR at Tables IV-17 - IV-25. 133 See CR/PR at Tables V-2 – V-3, V-5, D-1 – D-6. As discussed above, only AK Steel produces both conventional and high-permeability GOES. Thus, it was the only domestic producer that shipped pricing products 4b and 5b. See CR/PR at Tables V-8 - V-9. 134 CR/PR at Table V-10. 135 CR/PR at Table VI-5. 136 Capacity utilization decreased from *** percent in 2011 to *** percent in 2012 and *** percent in 2013. It was *** percent in interim 2013 and *** percent in interim 2014. CR/PR at Table III-3. 137 Export shipments totaled *** short tons in 2011, *** short tons in 2012 and *** short tons in 2013. They totaled *** short tons in interim 2013 and *** short tons in interim 2014. CR/PR at Table III-6. Export shipments were *** percent lower in interim 2014 than in interim 2013. Id. Most GOES exports during the period of investigation were to Belgium, India, Turkey, Canada, Brazil, Mexico, and Saudi Arabia. ThyssenKrupp’s Prehearing Brief at 6. 138 CR at III-13, PR at III-6. 139 Howard Industries’ Purchaser Questionnaire Response at II-1. 140 CR/PR at Table III-10. 141 CR at V-28, PR at V-8. 142 See NSSMC’s Prehearing Brief at 21 (graph showing shift of Howard Industries’ shipments).

26
2013. Over the same period, Allegheny Ludlum’s shipments to Howard Industries *** in 2011 to *** in 2013.143 The shift in such a large U.S. purchaser’s domestic supply arrangement had a substantial downward effect on the industry’s aggregate pricing, particularly in the conventional grades. The prices of the product sold to Howard Industries by Allegheny Ludlum at the beginning of the period of investigation were *** than the prices paid elsewhere in the market. Allegheny Ludlum’s prices to Howard Industries in 2011 were $*** per ton, or $*** ***. By contrast, AK Steel’s prices to Howard Industries in 2011 were $*** per ton – more than $***. In 2012, Allegheny Ludlum’s average price to Howard Industries *** to $*** per ton, but AK Steel *** on sales to Howard Industries. In 2013, AK Steel *** that year. 144 The record indicates that the trend in prices that Howard Industries paid for GOES was the result of the expiration of a long-term contract that began January 1, 2009 and concluded at the end of 2012, which was based on prices negotiated in 2008,145 as well as the increased competition between domestic producers, and is therefore unrelated to subject import competition.146 When Allegheny Ludlum lost the Howard Industries account, it was forced to find other outlets to sell its product. Consequently, it ***. Allegheny Ludlum’s *** to Howard Industries, AK Steel’s *** in exports and the domestic industry’s resulting unused capacity were well known among the purchasers of GOES, such as ABB.147 We find that such widespread knowledge of existing domestic unused capacity enabled purchasers to obtain lower prices.148 These observations are consistent with evidence in the record that the domestic producers are the price leaders in the industry.149 For the reasons discussed above, we find that the subject imports did not have significant price-depressing effects. Because demand was flat over the period of investigation and the domestic industry’s raw materials costs declined, the industry could not realistically expect to institute price increases. We consequently find that subject imports did not have the
143 CR/PR at Table III-10. 144 CR/PR at Table III-10. 145 Tr. at 30 (Polinski). 146 Howard Industries ***. See NSSMC’s Prehearing Brief at 21 (AK Steel’s 2011 shipments to Howard Industries totaled *** short tons; they were *** short tons in 2012). 147 See, e.g., Tr. at 127, 213-14 (Woolfort). 148 We are mindful of a declaration provided by petitioners that purports to show that ***. Petitioners’ Posthearing Brief at 7-8 & Exh. 5. However, in view of testimony to the contrary, see, e.g., ABB’s Posthearing Brief at 11, Tr. at 127 (Woolfort); we accord it little weight. We treat similarly the emails petitioners provided from purchasers that allegedly show that U.S. producers were requested to provide bids to match low-priced import offers. See Petitioners’ Posthearing Brief, Exh. 1 at 9-10 & Exh. 10; see also Petitioners’ Posthearing Brief, Exh. 1 at 48 (petitioners claim Howard Industries used its knowledge of low import pricing to leverage down AK Steel’s contractual prices). This claim was based on a confidential declaration. As such, it cannot be verified as Commission staff attempts to do with “lost revenue” allegations. 149 AK Steel was identified as a price leader by 11 purchasers, Allegheny Ludlum was identified by four purchasers, and JFE Steel, POSCO, ThyssenKrupp, “Russia,” and “Poland” were each identified by one purchaser. CR at V-5, PR at V-3.

27
effect of preventing price increases that would otherwise have occurred to a significant degree.150 In view of the foregoing, we find that the subject imports did not have the effect of depressing prices or preventing price increases that would otherwise have occurred to a significant degree. While there are confirmed lost sales and revenues, they are of minor magnitude151 and do not outweigh other data in the record showing the lack of significant price effects. Accordingly, we do not find significant price effects by reason of the subject imports.
F. Impact of the Subject Imports152
Section 771(7)(C)(iii) of the Tariff Act provides that examining the impact of subject imports, the Commission “shall evaluate all relevant economic factors which have a bearing on
150 We note that U.S. importers that internally consume GOES and import subject merchandise directly from ***, as well as purchase GOES from U.S. producers, provided purchase price data. See CR/PR at App. D. These data represent approximately *** percent of U.S. producers’ shipments, *** percent of subject imports from Japan, *** percent of imports from Poland, and *** percent of imports from Russia. These prices are not directly comparable to the prices of subject product that is not directly imported by end users, as they do not include any sales markup that would typically be made by an importer selling GOES in the U.S. market. CR/PR at D-3. While these data do indicate that subject imports were priced lower than the domestic like product in 17 of 30 comparisons for imports from Japan, 25 of 28 comparisons for imports from Poland and 7 of 8 comparisons for imports from Russia, CR at D-3 – D-4, PR at D-3, we have already acknowledged that lower prices are prevalent in the price comparisons; moreover, for the highest volume of shipments of U.S.-produced product, 4b, the incidence of higher and lower prices is mixed. See CR/PR at Table D-5. The volumes of imports involved in these comparisons are quite small (*** percent of total subject imports during the entire period of investigation). When compared to the subject imports that are not directly imported by end users, these few direct purchases could not have led the prices of the domestic like product downward. 151 Of the 33 lost sales allegations totaling $***, two, totaling $***, were confirmed. Of the 28 lost revenues allegations totaling $***, three, totaling $***, $*** and $***, were confirmed. CR/PR at Table V-13. The confirmed lost sales do not detract from our analysis, as there were no shifts in market share as discussed above. As the volumes involved in the transactions for which lost revenues were confirmed totaled only ***, id., we do not find that these confirmed volumes outweigh the other data supporting our finding that there were no significant adverse price effects by reason of subject imports. 152 The statute instructs the Commission to consider the “magnitude of the dumping margin” in an antidumping proceeding as part of its consideration of the impact of imports. 19 U.S.C. § 1677(7)(C)(iii)(V). In its final determinations, Commerce found dumping margins ranging from 133.70 percent to 241.91 percent for imports of GOES from Germany, 93.36 percent to 172.30 percent for imports of GOES from Japan, and 78.10 percent to 99.51 percent for imports of GOES from Poland. 79 Fed. Reg. 42501, 42502 (July 22, 2014). As explained above, Commerce extended the time for its final antidumping duty determinations with respect to subject imports from China, Czech Republic, Korea, and Russia. In its preliminary determinations, it found antidumping duty margins of 159.21 percent for imports of GOES from China, 10.35 to 11.45 percent for imports of GOES from Czech Republic, 5.34 percent for subject imports from Korea, and 68.98 to 119.88 percent for imports of GOES from Russia. Id. at 26937, 26939, 26942 (May 12, 2014); id. at 26718 (May 9, 2014).

28
the state of the industry.”153 These factors include output, sales, inventories, capacity utilization, market share, employment, wages, productivity, profits, cash flow, return on investment, ability to raise capital, research and development, and factors affecting domestic prices. No single factor is dispositive and all relevant factors are considered “within the context of the business cycle and conditions of competition that are distinctive to the affected industry.”
Most of the industry’s trade, employment, and financial indicators deteriorated over the period of investigation. However, because the subject imports did not take significant market share away from the domestic industry and also did not have significant price effects, we do not find the domestic industry to be materially injured by reason of the subject imports.
The domestic industry’s capacity remained the same throughout the period of investigation.154 The domestic industry’s domestic shipments increased ***.155 Nevertheless, due to the decline in export shipments156 and the drawdown in inventories,157 the domestic industry’s production declined steadily between 2011 and 2013.158 Capacity utilization trended downward as well over that period.159 The industry’s market share, as previously discussed, remained essentially stable.160
The domestic industry’s decline in production led to fewer workers, and the number of production and related workers declined steadily.161 Total hours worked declined as well.162
153 19 U.S.C. § 1677(7)(C)(iii); see also SAA at 851 and 885 (“In material injury determinations, the Commission considers, in addition to imports, other factors that may be contributing to overall injury. While these factors, in some cases, may account for the injury to the domestic industry, they also may demonstrate that an industry is facing difficulties from a variety of sources and is vulnerable to dumped or subsidized imports.”). 154 The domestic industry’s capacity totaled *** short tons in 2011-13 and *** short tons in both interim periods. CR/PR at Table III-3. 155 U.S. shipments declined from *** short tons in 2011 to *** short tons in 2012, then rose to *** short tons in 2013. They totaled *** short tons in interim 2013 and *** short tons in interim 2014. CR/PR at Table III-6. 156 Export shipments decreased from *** short tons in 2011 to *** short tons in 2012 and *** short tons in 2013. They totaled *** short tons in interim 2013 and *** short tons in interim 2014. CR/PR at Table III-6. 157 End-of-period Inventories decreased from *** short tons in 2011 to *** short tons in 2012 and *** short tons in 2013. They totaled *** short tons in interim 2013 and *** short tons in interim 2014. CR/PR at Table III-11. 158 Production fell from *** short tons in 2011 to *** short tons in 2012 and *** short tons in 2013. It was *** short tons in interim 2013 and *** short tons in interim 2014. CR/PR at Table III-3. 159 Capacity utilization declined from *** percent in 2011 to *** percent in 2012 and *** percent in 2013. It was *** percent in interim 2013 and *** percent in interim 2014. CR/PR at Table III-3. 160 The domestic industry’s share of apparent U.S. consumption was *** percent in 2011, *** percent in 2012, and *** percent in 2013. It was *** percent in interim 2013 and *** percent in interim 2014. CR/PR at Table IV-16. 161 The number of production and related workers fell from *** in 2011 to *** in 2012 and *** in 2013. It was *** in interim 2013 and *** in interim 2014. CR/PR at Table III-12.
29
Wages paid decreased between 2011 and 2013,163 and productivity also fell during that period.164
The domestic industry’s financial indicators deteriorated. The quantity of net sales decreased between 2011 and 2013.165 The ratio of the cost of goods sold (“COGS”) to net sales increased between 2011 and 2013,166 as did unit COGS,167 notwithstanding a decline in raw materials costs, because fixed costs were distributed over a smaller number of sales. The industry had operating income in 2011 and 2012, but operating losses in 2013 and the interim periods.168 Accordingly, operating margins declined.169
Capital expenditures declined over the period of investigation,170 and research and development expenses increased due to ***.171
The domestic industry’s unfavorable trends in operating performance were a combination of adverse output-related effects and adverse revenue effects. These, in turn, were caused by the loss of export shipments, higher unit costs resulting from less production,
(…Continued) 162 Total hours worked fell from *** hours in 2011 to *** in 2012 and *** in 2013. They totaled *** in interim 2013 and *** in interim 2014. CR/PR at Table III-12. 163 Wages paid declined from $*** in 2011 to $*** in 2012 and $*** in 2013. They totaled $*** in interim 2013 and $*** in interim 2014. CR/PR at Table III-12. 164 Productivity decreased from *** short tons per 1,000 hours in 2011 to *** short tons in 2012 and *** short tons in 2013. It was *** short tons per 1,000 hours in interim 2013 and *** short tons in interim 2014. CR/PR at Table III-12. 165 The quantity of net sales fell from *** short tons in 2011 to *** short tons in 2012 and *** short tons in 2013. They totaled *** short tons in interim 2013 and *** short tons in interim 2014. CR/PR at Table VI-1. 166 The ratio of COGS to net sales increased from *** percent in 2011 to *** percent in 2012 and *** percent in 2013. It was *** percent in interim 2013 and *** percent in interim 2014. CR/PR at Table VI-1. 167 Unit COGS increased from $*** per short ton in 2011 to $*** per short ton in 2012, then fell slightly to $*** per short ton in 2013. It totaled $*** per short ton in interim 2013 and $*** per short ton in interim 2014. CR/PR at Table VI-3. 168 Operating income declined from $*** in 2011 to $*** in 2012, then fell to an operating loss of $*** in 2013. The industry sustained an operating loss of $*** in interim 2013 and $*** in interim 2014. CR/PR at Table VI-1. 169 The industry’s ratio of operating income to net sales declined from *** percent in 2011 to *** percent in 2012 and was *** percent in 2013. The ratio was *** percent in interim 2013 and *** percent in interim 2014. CR/PR at Table VI-1. We observe that, notwithstanding that subject import volume and market share were lower in interim 2014 than in interim 2013 -- which we have found was a function of the filing of the petition -- and the domestic industry’s market share was higher, the domestic industry’s operating performance did not improve in any appreciable sense in interim 2014. 170 Capital expenditures fell from $*** in 2011 to $*** in 2012 and $*** in 2013. They totaled $*** in interim 2013 and $*** in interim 2014. CR/PR at Table VI-7. 171 Research and development expenses increased from $*** in 2011 to $*** in 2012 and $*** in 2013. They totaled $*** in interim 2013 and $*** in interim 2014. CR/PR at Table VI-7.

30
and reduced prices. However, none of these factors were a function of the subject imports.172 In particular, the decline in production was entirely attributable to the decline in export shipments, as domestic shipments increased from 2011 to 2013. The price declines, as explained above in our discussion of price effects, were a result of lower raw materials prices, unused capacity and intra-industry competition.
In view of the foregoing, we find that the subject imports have not had a significant impact on the domestic industry.
VI. No Threat of Material Injury by Reason of Cumulated Subject Imports
A. Legal Standard
Section 771(7)(F) of the Tariff Act directs the Commission to determine whether the domestic industry is threatened with material injury by reason of the subject imports by analyzing whether “further dumped or subsidized imports are imminent and whether material injury by reason of imports would occur unless an order is issued or a suspension agreement is accepted.”173 The Commission may not make such a determination “on the basis of mere conjecture or supposition,” and considers the threat factors “as a whole” in making its determination whether dumped or subsidized imports are imminent and whether material injury by reason of subject imports would occur unless an order is issued.174 In making our determination, we consider all statutory threat factors that are relevant to these investigations.175
172 We note that we have examined the domestic industry’s argument that the industry would have been unprofitable even if export shipments had been excluded. See Petitioners’ Posthearing Brief at 10-12. This is correct, but is a result of revenue declines due to lower prices that were not caused by the subject imports, as explained above. 173 19 U.S.C. § 1677(7)(F)(ii). 174 19 U.S.C. § 1677(7)(F)(ii). 175 These factors are as follows: (I) if a countervailable subsidy is involved, such information as may be presented to it by the administering authority as to the nature of the subsidy (particularly as to whether the countervailable subsidy is a subsidy described in Article 3 or 6.1 of the Subsidies Agreement) and whether imports of the subject merchandise are likely to increase, (II) any existing unused production capacity or imminent, substantial increase in production capacity in the exporting country indicating the likelihood of substantially increased imports of the subject merchandise into the United States, taking into account the availability of other export markets to absorb any additional exports, (III) a significant rate of increase of the volume or market penetration of imports of the subject merchandise indicating the likelihood of substantially increased imports, (IV) whether imports of the subject merchandise are entering at prices that are likely to have a significant depressing or suppressing effect on domestic prices and are likely to increase demand for further imports, (V) inventories of the subject merchandise, (Continued...)

31
B. Cumulation for Threat
Under section 771(7)(H) of the Tariff Act, the Commission may “to the extent practicable” cumulatively assess the volume and price effects of subject imports from all countries as to which petitions were filed on the same day if the requirements for cumulation in the material injury context are satisfied.176 Accordingly, for purposes of our analysis of threat of material injury by reason of subject imports, subject imports from Germany, Japan, and Poland are eligible for cumulation with subject imports from China, Czech Republic, Korea, and Russia.
Petitioners argue that the Commission should cumulatively assess the impact of the imports from the seven subject countries in making its threat determinations. They argue that the volume and price trends of imports from the seven subject countries are similar.177
The respondents from Japan and Russia argue that the Commission should exercise its discretion not to cumulate subject imports from Japan or Russia with those from any other subject countries in making any threat determination. Their arguments focus largely on the purportedly unique characteristics of the products from those subject countries.178
We found in our discussion of cumulation above that there is a reasonable overlap of competition among subject imports from all seven countries and between subject imports from each country and the domestic like product. The considerations discussed above apply to our decision to cumulate subject imports for the purposes of our threat determinations.
The record does not indicate that there would likely be any significant difference in the conditions of competition between subject imports from the seven countries. We recognize that some potential differences exist between the industries in these subject countries (especially between Japan and the other countries), but after examining these differences, find
(…Continued) (VI) the potential for product-shifting if production facilities in the foreign country, which can be used to produce the subject merchandise, are currently being used to produce other products, … (VIII) the actual and potential negative effects on the existing development and production efforts of the domestic industry, including efforts to develop a derivative or more advanced version of the domestic like product, and (IX) any other demonstrable adverse trends that indicate the probability that there is likely to be material injury by reason of imports (or sale for importation) of the subject merchandise (whether or not it is actually being imported at the time). 19 U.S.C. § 1677(7)(F)(i). To organize our analysis, we discuss the applicable statutory threat factors using the same volume/price/impact framework that applies to our material injury analysis. Statutory threat factors (I), (II), (III), (V), and (VI) are discussed in the analysis of subject import volume. Statutory threat factor (IV) is discussed in the analysis of subject import price effects. Statutory factors (VIII) and (IX) are discussed in the analysis of impact. Statutory (VII) concerning agricultural products is inapplicable to these investigations. 176 19 U.S.C. § 1677(7)(H). 177 Petitioners’ Posthearing Brief, Exh. 1 at 79-83. 178 JFE Steel’s Prehearing Brief at 36-41; NSSMC’s Prehearing Brief at 58-63; NSSMC’s Posthearing Brief at 14; NLMK’s Prehearing Brief at 17-26; NLMK’s Posthearing Brief at 2-6.

32
that they are not significant enough to warrant not cumulating all subject imports. For these reasons, we conclude that it is appropriate to exercise our discretion to cumulate subject imports from China, Czech Republic, Germany, Japan, Korea, Poland, and Russia for the purposes of our threat analysis.
C. Analysis
1. Likely Volume
As discussed above, we have found the volume of cumulated subject imports to be significant during the period of investigation. Nevertheless, we also found that the significant subject import volume did not injure the domestic industry. We find that the increase in subject import volume and market share during the period does not indicate a likelihood that any increase in subject import volume in the imminent future would result in declines in the domestic industry’s output or market share. In our discussion of volume above, we found that most of the increase in subject import volume and market share was at the expense of nonsubject imports. Additionally, most of the increase in the volume of subject imports was due to the increase in shipments of high-permeability GOES, reflecting changes in demand in response to the promulgation of DOE’s high efficiency standards. There is no evidence in the record that these trends will change in the imminent future. U.S. demand is expected to increase in the near future, consistent with anticipated trends in housing starts and commercial use.179 We find no evidence in the record that any increase in subject imports would likely adversely affect the domestic industry in the imminent future, inasmuch as increasing imports did not adversely affect the domestic industry while demand increased over the period of investigation and conditions of competition in the U.S. market are unlikely to change appreciably. We also find that capacity in the cumulated subject countries, which is high both absolutely and relative to apparent U.S. consumption, increased over the period of investigation and is projected to increase further.180 Although unused capacity increased between 2011 and 2013, it was greater in interim 2013 than in interim 2014. It is projected to
179 Projections for 2014 and 2015 indicate that utility capital expenditures will remain above $85
billion in both years, which would exceed capital expenditures in any year from 2003 to 2011. NSSMC’s Prehearing Brief at 5 & Exh. 2. A number of firms expect there to be a further shift in demand towards higher grades of GOES with lower core losses in light of the revised DOE efficiency requirements for distribution transformers, to become effective in 2016. CR at II-19, PR at II-11.
180 Capacity increased from 1.5 million short tons in 2011 to 1.6 million short tons in 2012, then to 1.7 million short tons in 2013. It was 422,057 short tons in interim 2013 and 423,820 short tons in interim 2014. It is projected to be 1.7 million short tons in 2014 and 1.7 million short tons in 2015. CR/PR at Table VII-14.

33
decline further in 2014 and further still in 2015.181 Production, which increased over the period, is expected to continue to increase in 2014 and 2015.182 A rather high portion of the aggregate production of GOES in the subject countries was used to meet home market demand.183 Shipments to the home market increased over the period and are expected to continue to increase.184 Exports to other markets increased between 2011 and 2013 and are projected to increase in the future as well.185 The ratio of subject export shipments to the United States as a share of total shipments was steady throughout the period and is projected to remain so in the future.186 The data indicate that the United States is not a principal export market for the cumulated subject industries. In view of the subject industries’ projection of increasing shipments to the home market and exports to other countries, and their very limited reliance on the U.S. export market, we find that significantly increased imports of the subject merchandise into the United States are not likely in the imminent future. Although U.S. prices for GOES have been and will likely continue to be higher than prices in other markets, this is not a factor that led the subject industries to direct an appreciably larger share of their export shipments to the United States from 2011 to 2013, and there is no indication in the record that this is likely to change.187 Even if subject imports from the cumulated subject countries do increase somewhat, we do not find that any such increase would likely threaten material injury to the domestic industry given that the significant volume of subject imports did not cause material injury to the domestic industry over the period of investigation.188
181 Capacity utilization increased from 90.3 percent in 2011 to 93.1 percent in 2012, then fell to
86.7 percent in 2013. It was 84.9 percent in interim 2013 and 93.3 percent in interim 2014. It is projected to be 94.3 percent in 2014 and 96.5 percent in 2015. CR/PR at Table VII-14. 182 Production increased from 1.4 million short tons in 2011 to 1.5 million short tons in 2012 and 2013. It was 358,433 short tons in interim 2013 and 395,258 short tons in interim 2014. It is projected to be 1.6 million short tons in 2014 and 2015. CR/PR at Table VII-14. 183 Home market shipments represented *** percent of total shipments in 2011, *** percent in 2012 and *** percent in 2013. They represented *** percent of total shipments in interim 2013 and *** percent in interim 2014. CR/PR at Table VII-14.
184 Shipments to the home market rose from *** short tons in 2011 to *** short tons in 2012 and *** short tons in 2013. They totaled *** short tons in interim 2013 and *** short tons in interim 2014. They are projected to climb to *** short tons in 2014 and *** short tons in 2015. CR/PR at Table VII-14.
185 Total export shipments increased from 918,807 short tons in 2011 to 952,802 short tons in 2012 and 981,674 short tons in 2013. They totaled 254,547 short tons in interim 2013 and 236,743 short tons in interim 2014. They are projected to climb further to 1,008,853 short tons in 2014 and to 1,047,608 short tons in 2015. CR/PR at Table VII-14.
186 The ratio of export shipments to the United States as a share of total shipments was 1.1 percent in 2011, 1.6 percent in 2012 and 1.2 percent in 2013. It was 1.1 percent in interim 2013 and 0.8 percent in interim 2014. It is projected to be 0.7 percent in 2014 and 0.8 percent in 2015. CR/PR at Table VII-14. 187 See CR/PR at V-2 – V-9; Petitioners’ Posthearing Brief, Exh. 1 at 77 (prices of GOES are higher in the U.S. market than in other markets); Tr. at 77 (Petersen), 188 (Woolfort).
188 We do not find any likelihood of product shifting. Only one foreign producer, located in (Continued...)

34
We recognize that China has imposed antidumping duties on GOES from Russia. However, final duties became effective four years ago -- in 2010.189 The Indian Steel Ministry reportedly effectively banned imports of low-grade electrical steel in June 2011.190 The record does not indicate that these restrictions resulted in diverting a volume of subject imports to the United States that materially injured the domestic industry during the period, nor is there any indication that this would change in the imminent future.191 U.S. importers’ inventories fell over the period of investigation.192 Although import inventories of the subject merchandise held in the subject countries increased from 2011 to 2013, they are projected to decline in the future.193 194 For the foregoing reasons, we conclude that, while some continued increase in subject import volume may occur in the imminent future, any such increase likely will not be significant nor be sufficient to have any adverse effects on the domestic industry.
(…Continued)
Czech Republic, stated that it could shift production accounts for a very small portion of the subject merchandise. NMLK’s Prehearing Brief at 30-31.
189 CR at VII-52 – V-53, PR at VII-24. 190 CR at VII-53, PR at VII-24. 191 In June 2014, an antidumping duty petition was filed with the European Commission on
behalf of European producers of GOES covering imports from China, Japan, Korea, Russia, and the United States. The notice of initiation was published on August 14, 2014. It is uncertain whether duties will ultimately be imposed after the investigation. Revision to the Staff Report, INV-MM-080 (Aug. 20, 2014), at III-14, VII-53.
192 U.S. importers’ inventories decreased from *** short tons in 2011 to *** short tons in 2012 and *** short tons in 2013. They totaled *** short tons in interim 2013 and *** short tons in interim 2014. CR/PR at Table VII-15.
193 Subject producers’ end-of-period inventories rose from 77,679 short tons in 2011 to 137,900 short tons in 2012, and then declined to 100,756 short tons in 2013. They totaled 116,742 short tons in interim 2013 and 124,624 short tons in interim 2014. They are projected to fall to 53,670 short tons in 2014 and 48,158 short tons in 2015. CR/PR at Table VII-14. 194 We have also considered the nature of any countervailable subsidy. In its preliminary countervailing duty determination with respect to subject imports from China, Commerce found a number of programs to be countervailable. They are: Policy Loans to the GOES Industry; Preferential Loans to State-Owned Enterprises; Government Provision of Allocated Land-Use Rights for Less than Adequate Remuneration (“LTAR”); Provision of Electricity for LTAR; Enterprise for Tax Law Research and Development Program; Purchases of GOES for More than Adequate Remuneration; and Other Grants. In addition, Commerce stated that it intended to gather additional information about the following programs: Preferential Export Financing by the Export-Import Bank of China and the Government Provision of Granted Land-Use Rights for LTAR. Countervailing Duty Investigation of Grain-Oriented Steel from the People’s Republic of China: Decision Memorandum for the Preliminary Determination (Mar. 4, 2014).

35
2. Likely Price Effects
In our discussion above, we found that underselling by the subject imports was prevalent. However, we also found that notwithstanding the increasing volume of subject imports and underselling by those imports during the period of investigation, the subject imports did not have a significant adverse effect on prices for the domestic like product and the domestic industry has not been materially injured by reason of the subject imports. Even if there is some increase in the volumes of low-priced subject imports entering the U.S. market in the imminent future, in light of increasing demand nothing in the record indicates that subject imports will likely depress or suppress domestic prices. We consequently find that imports of the subject merchandise are unlikely to enter at prices that are likely to have a significant depressing or suppressing effect on domestic prices or to increase demand for further imports.
3. Likely Impact
As we discussed above, the domestic industry has experienced declines in performance and operating income levels, but we have found no significant causal relationship between the subject imports and the domestic industry’s performance during the period. Nothing in the record of these investigations gives us reason to believe that any further deterioration of the condition of the domestic industry will be by reason of the subject imports in the imminent future. We further find that subject imports have had no significant actual or potential negative effects on the existing development and production efforts of the domestic industry, including efforts to develop a derivative or more advanced version of the domestic like product.195 In view of the foregoing, we conclude that an industry in the United States is not threatened with material injury by reason of subject imports.
195 In January 2013, Big River Steel LLC announced plans for a $1.1 billion greenfield mini-mill, to
be located in Arkansas, for manufacturing high-end steel mill products for the automotive, oil and gas, and electrical energy industries. This proposed facility reportedly will have an annual production capacity of 1.7 million short tons and the ability to roll coils up to 76-78 inches wide and one inch thick. Groundbreaking and site work commenced in July 2014, and melting of steel is reportedly anticipated by July 2016. In anticipation of solid demand for electrical steels by the automotive and electric-power transformer markets, the venture plans to manufacture motor lamination steels and some non-oriented electrical steel, with suitable equipment to be added later in the second phase of development, although no time frame has been specified. CR at III-3 – III-4, PR at III-2; see Petitioners’ Posthearing Brief, Exh. 1 at 86.

36
VII. Conclusion
For the reasons stated above, we determine that an industry in the United States is not materially injured or threatened with material injury by reason of subject imports of GOES from Germany, Japan and Poland that are sold in the United States at less than fair value.
37
Dissenting Views of Commissioner Rhonda K. Schmidtlein
I. Material Injury
I join my colleagues in their determinations regarding the domestic like product, the
domestic industry, cumulation, and conditions of competition. I also join my colleagues in
finding that the volume of subject imports is significant, both in absolute terms and relative to
apparent U.S. consumption. As explained below, I further find that this significant volume of
subject imports has undersold the domestic like product, significantly depressed U.S. prices,
and contributed to the material injury that the domestic industry incurred over the period of
investigation (“POI”).
A. Price Effects of the Subject Imports
Section 771(7)(C)(ii) of the Tariff Act provides that, in evaluating the price effects of the subject imports, the Commission shall consider whether
(I) there has been significant price underselling by the imported merchandise as compared with the price of domestic like products of the United States, and
(II) the effect of imports of such merchandise otherwise depresses prices to a significant degree or prevents price increases, which otherwise would have occurred, to a significant degree.1
As explained in the majority’s views, the record indicates that there is a moderate to
high degree of substitutability between subject imports and domestically produced GOES, and
that price is an important factor in purchasing decisions.
The Commission staff collected pricing data on a number of different products, with
certain products broken out for sales to slitters/laminators and to end users. These traditional
pricing data account for 38 percent of total subject imports since 2011, but include *** percent
of subject imports from Poland and *** percent of subject imports from Russia.2 These data
show that subject imports undersold the U.S.-produced product in 65 of 90 comparisons, or 72
percent of the time, with underselling margins ranging from 0.2 to 28.6 percent.3 Given the
importance of price in purchasing decisions, I find this underselling to be significant.
1 19 U.S.C. § 1677(7)(C)(ii). 2 Confidential Staff Report (“CR”) at V-7; Public Staff Report (“PR”) at V-5. 3 CR/PR at Table V-11.

38
The Commission staff also collected separate pricing data from end users who imported
subject merchandise directly. These data, contained in Appendix D of the Staff Report, show a
significant number of additional instances where subject imports were priced below the
domestic producers’ prices, and often by substantial price differentials.4 These data account for
a large volume of subject import sales, particularly with respect to imported GOES from Poland
and Russia, two countries which are *** in the traditional data, and therefore I find these data
to be an important part of the record and a relevant indicator of subject import pricing
behavior.5 On a weighted-average basis, these data show that subject imports were priced
below the U.S. producers’ prices in 46 of 60 comparisons, or 76.6 percent of the time.6 Even
considering only those comparisons where the subject imports were priced 5 percent or more
below domestic producers’ prices,7 subject imports were still underselling U.S.-produced
product in 50 percent of the comparisons (30 out of 60), with the largest price differential
showing that subject imports were priced up to *** percent below the U.S. producers’ prices.8
These data provide further evidence that subject imports were significantly underselling the
U.S.-produced product.
I also find that this underselling by subject imports significantly depressed U.S. prices.
The record shows that U.S. prices declined *** over the POI, with the U.S. producers’ U.S.
shipment average unit values (“AUVs”) declining *** percent between 2011 and 2013, from
$*** to *** per short ton,9 and U.S. producers experiencing price declines for *** of the pricing
products.10 As a preliminary matter, I note that these price declines far exceeded any declines
in the domestic industry’s raw material costs or total cost of goods sold (“COGS”).11
Additionally, demand for GOES, particularly high-permeability GOES, generally increased
throughout the POI so demand trends also do not explain the domestic industry’s price
4 CR/PR at Appendix D. 5 The data in Appendix D accounts for over *** short tons of subject imports between 2011 and
January-March 2014 (“interim 2014”), including *** percent of subject imports from Poland, *** percent of subject imports from Russia, and *** percent of subject imports from Japan. CR/PR at D-3 and Tables D-1 to D-7.
6 Derived from data in CR/PR Tables D-1 to D-7. 7 Because the purchase price data in Appendix D include estimates from the purchasers for the
cost of delivery and the cost of being the importer of record, eliminating the comparisons where the price differentials are less than 5 percent allows for a margin of error in these estimates. See CR/PR at D-3.
8 Derived from data in CR/PR Tables D-1 to D-7. 9 CR/PR at Table C-1. 10 CR/PR at Table V-10. 11 U.S. producers’ raw material costs declined on a per ton basis over the POI, from $*** per
short ton in 2011 to *** per short ton in 2013, and total COGS for their U.S. sales declined from $*** per short ton in 2011 to $*** per short ton in 2013. CR/PR at Tables VI-3 and VI-5.

39
declines.12 Rather, an examination of the pricing data shows that U.S. producers were forced to
lower prices substantially in the face of low-priced subject imports.
In the traditional pricing data, product 1b shows that subject imports from Germany,
Japan and Poland entered the market in 2012 and *** the U.S.-produced product by margins
ranging from *** to *** percent.13 Subsequently, the U.S. producers’ prices dropped by ***
percent between the last quarter of 2012 and the first quarter of 2013, which likely coincides
with new contract pricing for domestic producers.14 In product 2a, subject imports from
Germany and the U.S. producers’ prices generally *** between the first and last quarters of
2011 and the subject imports shifted from *** to *** the U.S.-produced product. Both prices
then *** somewhat in the first half of 2012, as subject imports from Germany continued to ***
the U.S. product. In the third quarter of 2012, subject imports from Germany *** per short ton,
from *** per short ton in the prior quarter and *** the U.S.-produced product by ***
percent.15 In the same quarter, subject imports from Czech Republic entered the U.S. market
and also *** the U.S.-produced product. Once this *** began, the domestic producers’ price
*** from *** per short ton in the second quarter of 2012 to *** per short ton in the third
quarter of 2012, and then continued to *** throughout the remainder of the POI as the subject
imports from Germany ***.16 For product 4b, the U.S. producers’ price *** between the first
and third quarters of 2011, but then *** starting in the fourth quarter of 2011, after subject
imports entered the market in the third quarter of 2011 and started *** the U.S.-produced
product.17 Product 5b shows a similar pattern, with the U.S. producers’ price *** between the
first and third quarters of 2011, but then *** once subject imports from Korea entered the
market in the fourth quarter of 2011 and *** the U.S.-produced product by *** margins.18
The purchase price data in Appendix D show additional correlations between low-priced
subject imports entering the market and U.S. producers subsequently *** prices. Table D-2
shows that for product 2b, *** started purchasing subject imports from *** at prices that were
more than *** per short less than the U.S.-produced product, and the U.S. producers’ prices
almost immediately start ***, with a significant *** between the U.S. producers’ 2012 and
2013 prices.19 Similarly, *** purchased subject imports from *** in 2012 at prices that were
*** than the U.S. producers’ price and U.S. producers’ *** their price significantly on their 2013
12 See CR/PR at Tables IV-17—IV-10 and C-1. 13 CR/PR at Table V-3. GOES from Russia also entered the market for this pricing product in 2013
and *** the domestically produced product by *** percent. Id. 14 CR/PR at Table V-3; CR at V-3-4; PR at V-3; see also *** U.S. Producers’ Questionnaire at IV-8b. 15 CR/PR at Table V-4. 16 CR/PR at Table V-4. 17 CR/PR at Table V-8. 18 CR/PR at Table V-9. 19 CR/PR at Table D-2.

40
sales.20 This pattern also exists with *** purchases of product 3b, where it purchased subject
imports from *** in 2012 at prices well below the U.S. producers’ price, and then the U.S.
producers *** their price to *** by over *** per short ton for their 2013 sales.21
I find that these pricing data support petitioners’ contention that U.S. producers were
forced to lower prices in response to low-priced subject imports.22 I am not persuaded by the
respondents’ argument that the volumes of subject imports in some of the pricing comparisons
were too small to have an impact on domestic pricing.23 Respondents essentially disregard the
Appendix D data and, consequently, disregard a substantial volume of subject imports.24 As
explained above, I find that the data in Appendix D are an important component of the record
and provide additional evidence of both underselling and price depression. Moreover, the fact
that the volume of subject imports may have been small relative to the U.S. producers’ sales
volume in a particular price comparison does not negate the fact that purchasers were aware of
subject import pricing and could use those low prices as leverage in sales negotiations with the
U.S. producers. Indeed, two purchasers explicitly reported that U.S. producers had reduced
their prices during the POI in order to compete with subject imports, and the record contains at
least *** in confirmed lost sales and revenue that is directly attributable to the low-priced
subject imports.25
In any event, as explained in the majority’s views, price was identified as the first or
second most important factor by 15 of 17 purchasers and was identified as a “very important”
purchase factor by nearly all purchasers (18 of 21).26 The importance of price is elevated due to
the fact that subject imports and domestically produced GOES are moderately to highly
substitutable.27 Moreover, one of petitioners’ witnesses characterized GOES as a price-
sensitive product28 and the import competition with domestic producers as “very direct and
extremely price sensitive…”29 Thus, I find that even if considering only the volumes related to
20 CR/PR at Table D-2. 21 CR/PR at Table D-3. 22 See, e.g., Petitioners’ Posthearing Brief at 3. 23 See, e.g., Nippon Steel & Sumitomo Metal Corporation Posthearing Brief at 9. 24 See, e.g., JFE Steel Corporation Posthearing Brief, Answers to Questions at 25. 25 See CR at V-31; PR at V-9; CR/PR at Tables V-12—V-13; Petitioners’ Final Comments at 2, n. 4.
The record also shows that five purchasers reported they had shifted purchases away from U.S. producers to subject imports since 2010, and two specifically reported that price was the reason for making the switch. CR at V-31; PR at V-9.
26 CR/PR at Tables II-5 and II-6. 27 See CR at II-21; PR at II-13. 28 Hearing Tr. at 43 (Mr. Kerwin). 29 Hearing Tr. at 108‒109 (Mr. Kerwin).

41
the traditional price comparisons, subject imports at these levels were still able to adversely
impact the prices of the domestic product. 30
In addition to the lost sales and lost revenue that were explicitly confirmed by certain
purchasers, petitioners also allege that competition from low-priced subject imports resulted in
at least *** in lost sales and lost revenue with respect to purchases by ABB, one of the largest
end users of GOES in the United States.31 ABB *** and also claims that it never uses specific
quotes from other sources to leverage down U.S. prices.32 ABB further alleges that it is not
possible to use specific quotes for import prices in negotiations with U.S. producers because its
negotiations with foreign suppliers take place after its negotiations with U.S. producers and are
handled by a separate entity in Switzerland.33
Yet, while ABB claims it does not use specific quotes from other suppliers in its
negotiations, ***. As petitioners point out, *** in their negotiations with ABB.34 The record
also shows that ABB’s purchases of *** than the domestically produced product.35
Furthermore, ABB’s witness at the hearing testified that “***s a matter of fact, ABB has a
relationship with all the electrical steel suppliers globally” and that its U.S. negotiators are
30 The Commission has found in previous investigations that a small volume of subject imports
can have significant price effects. See, e.g. Clad Steel Plate from Japan, Inv. 731-TA-739 (Final), USITC Pub. 2972 (June 1996), at 15-16 (because the Commission found the market to be price sensitive, it found relatively small volumes of subject imports to be significant); Certain Circular Welded Pipe and Tube from Brazil, India, Korea, Mexico, Taiwan, Thailand, and Turkey, Inv. Nos. 701-TA-253 and 731-TA-132, 252, 271, 273, 532-534 and 536 (Third Review), USITC Pub. 4333 (June 2012), at 17 (“sustained underselling by even relatively small volumes of dumped or subsidized imports would be likely to significantly depress or suppress prices of the domestic like product”); Certain Welded Stainless Steel Pipe from Korea and Taiwan, Inv. Nos. 731-TA-540 and 541 (Third Review), USITC Pub. 4280 (Dec. 2011), at 20 (“In light of the high degree of substitutability and comparable quality of welded A-312 pipe from different sources, price will be the principal factor influencing purchasing decisions absent the orders. Thus, sustained underselling by even a relatively small amount of subject imports is likely to have significant price-suppressing or price-depressing effects.”).
31 See CR/PR at Tables V-12 and V-13; Petitioners’ Prehearing Brief at 39-40. Petitioners alleged at least *** in lost sales to ABB as a result of low-priced subject imports. See Petitioners’ Prehearing Brief at 40; CR/PR at Table V-12. ABB contests the lost sales allegations because, inter alia, the volumes of subject imports that are alleged to have resulted in lost sales and revenue *** the volume of subject imports that ABB ***. See, e.g., ABB Inc. Final Comments at 11. Although I am sensitive to the fact that domestic producers are limited in the information that may be available to them regarding the specific purchaser transaction details when developing lost sales allegations, I also understand ABB’s concern that the volume of lost sales allegations *** the volume of subject imports that ABB ***. See ABB Inc. Final Comments at 11. The lost revenue allegations, however, are unaffected by the volume of subject imports that ABB actually purchased.
32 See CR/PR at Tables V-12 and V-13; Hearing Tr. at 127, 211 (Ms. Woolfort). 33 Hearing Tr. at 127, 214 (Ms. Woolfort). 34 See CR/PR at Tables V-13; Petitioners’ Prehearing Brief at 39-42. 35 CR/PR at Tables D-2, D-3, D-5, and D-7. ABB’s purchases of subject imports from *** Id.

42
aware of foreign suppliers’ prices.36 The witness further stated that the negotiators have this
information and use it to set targets when they conduct negotiations with U.S. producers.37
Whether ABB discloses specific offers from subject sources to domestic producers during its
negotiations or is more general in its use of subject import prices to leverage down U.S. prices,
both can cause injury to the domestic industry through lost revenue.
In trying to explain the domestic industry’s price declines, the respondents argue that
the U.S. producers are the price leaders in the U.S. market, and that the price declines resulted
from intense competition between the two domestic producers.38 I am not persuaded by these
arguments. The respondents rely heavily on the fact that fifteen purchasers reported that the
U.S. producers are the price leaders in the market.39 This information was provided in response
to a question that explicitly stated a price leader could initiate changes either upward or
downward and a price leader did not necessarily mean the lowest priced supplier in the
market.40 Moreover, as petitioners point out, many of the narratives accompanying these
responses do not support the respondents’ contention that the domestic producers were
driving down U.S. prices.41 Because the definition of a “price leader” in the questionnaire
encompassed both leading the price up and down, and the responses did not specifically
identify U.S. producers as leading the price down, I cannot conclude, as respondents argue, that
all of the responding purchasers were intending to report that domestic producers were leading
the price declines in the U.S. market.
The respondents also point to the fact that Howard Industries, a large purchaser of
GOES in United States, switched domestic suppliers during the course of the POI and argued
36 Hearing Tr. at 213 (Ms. Woolfort). 37 Hearing Tr. at 213 (Ms. Woolfort). 38 See, e.g., JFE Steel Corporation Prehearing Brief at 19-20; ABB Inc. Posthearing Brief at 1;
Nippon Steel & Sumitomo Metal Corporation Final Comments at 5-7. The respondents argue that the increased competition between the two domestic producers was triggered by *** declining export sales and *** loss of a major customer, which resulted in a growing need to increase sales volumes. See, e.g., JFE Steel Corporation Prehearing Brief at 23. As explained below, there is no evidence that *** loss of a major customer was the result of an intense bidding war between the two domestic producers. Indeed, there is no evidence on the record that the competition between the two domestic producers, who have been competing against each other over 40 years, intensified over the period of investigation. See Hearing Tr. at 29-30 (Mr. Polinski) (“I agree…that our two companies compete vigorously with each other. It is important to note, however, that our companies have competed with each other for more than 40 years. In the nine years that I have led the GOES business, we were able to earn a reasonable return every year until the low-priced imports entered the market and caused devastating declines in pricing.”).
39 See CR at V-5; PR at V-3—V-4; JFE Steel Corporation Prehearing Brief at 19; Nippon Steel & Sumitomo Metal Corporation Posthearing Brief, Answers to Questions at 1.
40 CR at V-5, n.8; PR at V-3—V-4, n.8. 41 See Petitioners’ Posthearing Brief at 9, Exhibit 1 at 4-6.

43
that this is an illustrative example of the intense price competition between the two U.S.
producers.42 The record shows that there is a complicated history between Howard Industries
and Allegheny Ludlum, the domestic producer supplying Howard at the beginning of the POI. In
2008, Allegheny and Howard entered into a four-year contract that would expire on December
31, 2012.43 The contract *** and as market conditions began to deteriorate, Howard
attempted to cancel the contract. Litigation between the two parties ensued and Allegheny
prevailed.44 The effects of this contract can be seen in Allegheny’s prices to Howard, which
show *** compared to Allegheny’s other customers in 2011 and a *** in 2012.45
In 2011, ***46 In ***47 AK Steel and Howard Industries ***48 Allegheny Ludlum ***49
The record also shows that in 2013, Howard Industries *** albeit in relatively small volumes.50
In my view, this does not demonstrate intense price competition between AK Steel and
Allegheny Ludlum. There is no evidence of a bidding war between the two domestic producers
that drove prices down on AK Steel’s 2013 sales to Howard. Rather, AK Steel began talking to
Howard Industries in *** Between 2011, when AK Steel *** to Howard Industries, and 2012,
when AK Steel *** to Howard Industries, the unit value of AK Steel’s sales *** per short ton.51
In 2013, when AK Steel ***, its unit value on its sales to Howard *** per short ton.52 This is a
***, particularly in light of the fact that AK Steel had been in talks with Howard for *** of
supply in 2013. Significantly, this price *** coincides with Howard Industries’ purchases of ***,
which began in *** and ***. Indeed, AK Steel reports that *** contract prices to Howard.53
Furthermore, given the litigation between Howard and Allegheny, it begs the question
of whether Allegheny was viewed as a serious competitor to AK Steel obtaining Howard’s sales
in 2013. Given all of this, I do not think the record supports the respondents’ contentions that
it was a price war between Allegheny and AK Steel that caused AK Steel to *** on its 2013 sales
to Howard.
42 See, e.g., Nippon Steel & Sumitomo Metal Corporation Posthearing Brief at 4. 43 Petitioners’ Posthearing Brief, Exhibit 1 at 44. 44 Petitioners’ Posthearing Brief, Exhibit 1 at 44-45. 45 CR/PR at Table III-10. 46 Petitioners’ Posthearing Brief, Exhibit 1 at 46. 47 Petitioners’ Posthearing Brief, Exhibit 7. 48 Petitioners’ Posthearing Brief, Exhibit 7. 49 Petitioners’ Prehearing Brief at 51. 50 Howard Industries Purchasers’ Questionnaire Response at II-1. 51 CR/PR at Table III-10. 52 CR/PR at Table III-10. 53 Petitioners’ Posthearing Brief, Exhibit 7.
44
Respondents also argue that the subject imports could not be used to leverage down
the domestic producers’ prices because U.S. purchasers conclude their negotiations with U.S.
producers before they negotiate with foreign suppliers.54 First, in making this broad allegation,
they appear to rely on statements by just two purchasers, ABB and ***.55 Second, regardless of
how many purchasers may actually operate this way, as discussed above, there is nothing that
prohibits purchasers from using the prices of subject imports in general to leverage down U.S.
prices. The pricing data show that subject imports undersold the U.S.-produced product in the
vast majority of comparisons, so purchasers would be armed with that knowledge of the low-
priced subject imports when they entered price negotiations with U.S. producers.
Finally, respondents argue that there is little correlation between the volume of subject
imports and the price declines experienced by the domestic producers.56 As explained above, I
do not find persuasive the argument that small volumes of subject imports would be unable to
have an impact on U.S. market prices, nor do I find persuasive the argument that intense
competition between the domestic producers explains the price declines in the market. The
fact that certain domestic producer prices do not correspond precisely to the level of import
competition does not undermine either of these previous findings. Moreover, a simple
correlation between prices and import penetration does not take into account differing
demand trends for different grades of GOES. For instance, there seemed to be agreement that
demand was shifting toward the more efficient, high-permeability GOES.57 Rather than seeing
price increases in these products, however, the prices still declined, albeit at lower levels than
the conventional grades.58
In sum, I find that the record shows that subject imports undersold the U.S.-produced
product, often by large margins, which caused significant price depression as the domestic
producers were forced to lower prices in response to low-priced subject imports.
B. Impact of the Subject Imports
I see no real question here that the domestic industry is materially injured. U.S.
producers’ production and capacity utilization declined ***, the industry lost *** workers,
productivity declined, net sales declined by volume and value, and between 2011 and 2013 the
industry’s COGS/net sales ratio increased from *** percent to *** percent, gross profits
54 See, e.g., JFE Steel Corporation Posthearing Brief, Answers to Questions at 26. 55 See Hearing Transcript at 127 (Ms. Woolfort); JFE Steel Corporation Posthearing Brief,
Answers to Questions at 26. 56 See, e.g., Nippon Steel & Sumitomo Metal Corporation Posthearing Brief at 6; ABB Inc.
Posthearing Brief at 13. 57 See, e.g., CR/PR at Tables IV-17—IV-25. 58 See CR/PR at Table III-7.

45
declined from *** to ***, operating income declined from *** to ***, and the industry shifted
from a *** operating margin of *** percent to a *** margin of *** percent.59 Admittedly,
many of these declines in the domestic industry’s performance are related to the fact that the
U.S. producers’ volume of export sales declined significantly over the POI.60 As explained
above, however, the substantial volume of low-priced subject imports undersold the U.S.
producers at significant margins and put additional downward pressure on U.S. prices. This
price depression caused further deterioration of the domestic industry’s financial condition. It
contributed to the domestic industry’s declining profitability and *** operating margins, which
in turn caused the U.S. producers to reduce their capital expenditures and to cancel or
postpone plans to upgrade and expand their GOES operations.61
The staff report contains separate financial information for the U.S. producers’ U.S.
shipments and export shipments, which shows the devastating impact of the declining sales
values on the domestic industry’s profitability that is specifically related to its U.S. shipments.62
Despite the fact that the domestic industry’s U.S. shipments increased from *** short tons in
2011 to *** short tons in 2013, the industry’s operating income from U.S. sales declined from
*** to *** over the same period, and its operating margin from U.S. sales declined from ***
percent to *** percent.63
I see additional evidence of a causal nexus between the subject imports and the
domestic industry’s performance in the annual data. Between 2011 and 2012, the cumulated
volume of subject imports increased by 18.9 percent and gained *** percentage points of
market share.64 At the same time, the domestic producers’ U.S. shipments declined, they lost
*** percentage points of market share, and the AUV of their U.S. shipments declined by ***
per short ton, from *** to *** per short ton.65 Between 2012 and 2013, the U.S. producers ***
their prices by an additional *** per short ton, with the AUV of their U.S. shipments *** to ***
per short ton, and they were able to *** sales and market share.66 In 2013, U.S. producers’ U.S.
shipments were *** short tons, up from *** short tons in 2012, and their share of apparent
U.S. consumption was *** percent, up from *** percent in 2012. The volume of subject
imports declined between 2012 and 2013, from 31,182 short tons to 29,161 short tons, and
59 CR/PR at Table VI-1. 60 CR/PR at Table VI-4. 61 See Petitioners’ Prehearing Brief at 38; CR/PR at Table VI-7. 62 See CR/PR at Table VI-3. 63 CR/PR at Table VI-3. 64 CR/PR at Table C-1. This increase in subject import volume occurred despite the fact that
apparent U.S. consumption declined by *** percent between 2011 and 2012. Id. 65 CR/PR at Table C-1. 66 See CR/PR at Table C-1.
46
their share of apparent U.S. consumption declined from *** percent to *** percent.67
Additionally, after the petitions were filed and the cumulated subject import volume declined in
the first quarter of 2014, the domestic industry’s price declines slowed significantly.68 I find
that these correlations support the petitioners’ contention that they were forced to lower
prices in order to compete with subject imports.69
The statute and case law are clear that the Commission is not required to find that the
subject imports are the sole or principal cause of material injury to the domestic industry;
rather, subject imports must be more than a minimal or tangential cause of such injury.70 I
acknowledge that the industry’s declining export sales over the POI had a negative impact on
some of the industry’s performance indicators and, thus, do not attribute these negative effects
to subject imports. As explained above, however, I have found that the significant volume of
low-priced subject imports has depressed U.S. prices and that this contributed to the domestic
industry’s declining profitability and exacerbated the impact on the industry that resulted from
its declining export sales. The price declines caused by subject imports and consequent lost
revenue were not inconsequential, immaterial, or unimportant to the U.S. producers.71
Therefore, I find that the domestic industry is materially injured by reason of subject imports.
II. Critical Circumstances
In its final antidumping duty determination regarding subject imports from Poland, the
Department of Commerce found that critical circumstances exist with respect to Stalprodukt
S.A. and the companies covered by the “all others” rate. 72 Because I have determined that the
domestic industry is materially injured by reason of subject imports from, inter alia, Poland, I
must also consider "whether the imports subject to the affirmative {Commerce critical
circumstances} determination . . . are likely to undermine seriously the remedial effect of the
67 CR/PR at Table C-1. 68 See CR/PR at Table C-1. The volume of cumulated subject imports dropped from 7,940 short
tons in the first quarter of 2013 to 3,122 short tons in the first quarter of 2014. During this same time, the domestic industry’s U.S. shipment AUV declined by *** percent, after having declined *** percent between 2011 and 2012, and an additional *** percent between 2012 and 2013. Id.
69 Nonsubject imports were not a significant factor in the market, accounting for between *** and *** percent of apparent U.S. consumption between 2011 and 2013. Moreover, the limited pricing data on the record shows that the AUVs of nonsubject imports were consistently higher than the AUVs of subject imports, which indicates that nonsubject imports were not driving prices down in the market. See CR/PR at Table C-1.
70 See e.g., 19 U.S.C. § 1677(7)(A); Mittal Steel Point Lisas Ltd. v. United States, 542 F.3d 867, 873 (Fed. Cir. 2008); Nippon Steel Corp. v. USITC, 345 F.3d 1379, 1381 (Fed. Cir. 2003).
71 See 19 U.S.C. § 1677(7)(A). 72 79 Fed. Reg. 42501, 42502 (July 22, 2014).

47
antidumping {and/or countervailing duty} order{s} to be issued."73 The SAA provides that the
Commission is to determine "whether, by massively increasing imports prior to the effective
date of relief, the importers have seriously undermined the remedial effect of the order" and
specifically "whether the surge in imports prior to the suspension of liquidation, rather than the
failure to provide retroactive relief, is likely to seriously undermine the remedial effect of the
order."74
The statute provides that, in making this determination, the Commission shall consider,
among other factors it considers relevant,
(I) the timing and the volume of the imports,
(II) a rapid increase in inventories of the imports, and
(III) any other circumstances indicating that the remedial effect of the {order} will be seriously undermined.75
In considering the timing and volume of subject imports, the Commission's practice is to
consider import quantities prior to the filing of the petition with those subsequent to the filing
of the petition using monthly statistics on the record regarding those firms for which Commerce
has made an affirmative critical circumstances determination.76
Consistent with Commission practice, in these investigations I have considered data for
the six months prior to and including the month in which the petition was filed (September
2013) and data for the six months following that month. In the sixth months prior to the filing
of the petition, the volume of subject imports from Poland was 361 short tons, and in the six
months after the petition was filed this volume was 400 short tons.77 Thus, subject imports
from Poland increased only 10.8 percent in the sixth months following the filing of the petition.
The record also shows that inventories of U.S. imports from Poland were *** short tons in
March 2013, these inventories fell to *** short tons by the end of 2013, and were *** short
tons in March 2014.78 I do not find this to be a “rapid increase” in inventory volume, nor do I
find that this volume of subject imports, in a market with apparent consumption of over ***
short tons in 2013, is large enough to “undermine the remedial effect” of an antidumping
73 19 U.S.C. §§ 1671d(b)(4)(A)(ii), 1673d(b)(4)(A)(ii). 74 SAA at 877. 75 19 U.S.C. §§ 1671d(b)(4)(A)(ii), 1673d(b)(4)(A)(ii). 76 See Lined Paper School Supplies from China, India, and Indonesia, Inv. Nos. 701-TA-442-43,
731-TA-1095-97, USITC Pub. 3884 at 46-48 (Sept. 2006); Carbazole Violet Pigment from China and India, Inv. Nos. 701-TA-437 and 731-TA-1060-61 (Final), USITC Pub. 3744 at 26 (Dec. 2004); Certain Frozen Fish Fillets from Vietnam, Inv. No. 731-TA-1012 (Final), USITC Pub. 3617 at 20-22 (Aug. 2003).
77 CR/PR at Table IV-3. 78 CR/PR at VI-11.

48
order, if one were to be issued on GOES from Poland. Consequently, I make a negative critical
circumstances determination with respect to imports from Poland that are subject to
Commerce’s affirmative critical circumstances determination.
I-1
PART I: INTRODUCTION
BACKGROUND
These investigations result from a petition filed with the U.S. Department of Commerce (“Commerce”) and the U.S. International Trade Commission (“USITC” or “Commission”) by counsel on behalf of AK Steel Corp. (“AK Steel”), West Chester, Ohio; Allegheny Ludlum, LLC, (“Allegheny Ludlum”), Pittsburgh, Pennsylvania; and the United Steelworkers (“USW”),1 Pittsburgh, Pennsylvania, on September 18, 2013, alleging that an industry in the United States is materially injured and threatened with material injury by reason of subsidized imports of grain-oriented electrical steel (“GOES”)2 from China and by reason of less-than-fair-value (“LTFV”) imports of GOES from China, the Czech Republic, Germany, Japan, Korea, Poland, and Russia. The following tabulation provides information relating to the background of these investigations.3 4
1 The USW represents employees of Allegheny Ludlum that are engaged in the production of GOES in the United States.
2 See the section entitled “The Subject Merchandise” in Part I of this report for a complete description of the merchandise subject to these investigations.
3 Pertinent Federal Register notices are referenced in app. A, and may be found at the Commission’s website (www.usitc.gov).
4 App. B presents the list of witnesses that appeared at the hearing.

I-2
Effective date Action
September 18, 2013 Petition filed with Commerce and the Commission; institution of Commission’s investigations (78 FR 59059, September 25, 2013)
October 31, 2013 Commerce’s notices of initiation (78 FR 65265 and 78 FR 65283)
November 20, 2013 Commission’s preliminary determinations (78 FR 70574, November 26, 2013)
March 11, 2014
Commerce’s preliminary determination concerning the countervailing duty order on imports from China and alignment of final determination with final antidumping duty determination (79 FR 13617) (correction notice 79 FR 15100, March 18, 2014)
May 9, 2014
Commerce’s preliminary determination and postponement of final determination concerning the antidumping duty order on imports from the Czech Republic (79 FR 26717)
May 12, 2014
Commerce’s preliminary determinations concerning the antidumping duty orders on imports from China, Germany, Japan, Korea, Poland, and Russia and postponement of final determinations with respect to China, Korea, and Russia (79 FR 26936-26943); scheduling of final phase of Commission’s investigations (79 FR 32310, June 4, 2014); augmented and revised effective August 13, 2014 (79 FR 49339, August 20, 2014)
July 22, 2014 Commerce’s final determinations concerning the antidumping duty orders on imports from Germany, Japan, and Poland (79 FR 42501-42503)
July 24, 2014 Commission’s hearing
August 27, 2014 Commission’s vote (Germany, Japan, and Poland)
September 8, 2014 Commission’s views (Germany, Japan, and Poland)
September 22, 2014 Scheduled date for Commerce’s final determinations (Czech Republic)
September 24, 2014 Scheduled date for Commerce’s final determinations (China, Korea, and Russia)
October 23, 2014
Scheduled date for the Commission’s vote (China, Czech Republic, Korea, and Russia)
November 4, 2014 Scheduled date for Commission’s views (China, Czech Republic, Korea, and Russia)

I-3
STATUTORY CRITERIA AND ORGANIZATION OF THE REPORT
Statutory criteria
Section 771(7)(B) of the Tariff Act of 1930 (the “Act”) (19 U.S.C. § 1677(7)(B)) provides that in making its determinations of injury to an industry in the United States, the Commission--
shall consider (I) the volume of imports of the subject merchandise, (II) the effect of imports of that merchandise on prices in the United States for domestic like products, and (III) the impact of imports of such merchandise on domestic producers of domestic like products, but only in the context of production operations within the United States; and. . . may consider such other economic factors as are relevant to the determination regarding whether there is material injury by reason of imports.
Section 771(7)(C) of the Act (19 U.S.C. § 1677(7)(C)) further provides that--
In evaluating the volume of imports of merchandise, the Commission shall consider whether the volume of imports of the merchandise, or any increase in that volume, either in absolute terms or relative to production or consumption in the United States is significant. . . . In evaluating the effect of imports of such merchandise on prices, the Commission shall consider whether. . .(I) there has been significant price underselling by the imported merchandise as compared with the price of domestic like products of the United States, and (II) the effect of imports of such merchandise otherwise depresses prices to a significant degree or prevents price increases, which otherwise would have occurred, to a significant degree. . . . In examining the impact required to be considered under subparagraph (B)(i)(III), the Commission shall evaluate (within the context of the business cycle and conditions of competition that are distinctive to the affected industry) all relevant economic factors which have a bearing on the state of the industry in the United States, including, but not limited to . . . (I) actual and potential decline in output, sales, market share, profits, productivity, return on investments, and utilization of capacity, (II) factors affecting domestic prices, (III) actual and potential negative effects on cash flow, inventories, employment, wages, growth, ability to raise capital, and investment, (IV) actual and potential negative effects on the existing development and production efforts of the domestic industry, including efforts to develop a derivative or more advanced version of the

I-4
domestic like product, and (V) in {an antidumping investigation}, the magnitude of the margin of dumping.
Organization of report
Part I of this report presents information on the subject merchandise, subsidy/dumping margins, and domestic like product. Part II of this report presents information on conditions of competition and other relevant economic factors. Part III presents information on the condition of the U.S. industry, including data on capacity, production, shipments, inventories, and employment. Parts IV and V present the volume of subject imports and pricing of domestic and imported products, respectively. Part VI presents information on the financial experience of U.S. producers. Part VII presents the statutory requirements and information obtained for use in the Commission’s consideration of the question of threat of material injury as well as information regarding nonsubject countries.
MARKET SUMMARY
GOES is primarily used in the production of laminated cores for large and medium-sized electrical power transformers and distribution transformers. There are two U.S. producers of GOES: AK Steel and Allegheny Ludlum. Leading producers of GOES outside the United States and leading U.S. importers of GOES are listed in table I-1. In particular, leading producers of GOES in countries subject to these investigations include Baoshan Iron & Steel Co., Ltd. (China), ArcelorMittal Frýdek-Místek a.s. (Czech Republic), ThyssenKrupp Electrical Steel GmbH (Germany), JFE Steel Corp. and Nippon Steel & Sumitomo Metal Corp. (Japan), Pohang Iron and Steel Co. (Korea), Stalprodukt S.A. (Poland), and Novolipetsk Steel (Russia). Leading producers of GOES in countries that are not subject to these investigations include ThyssenKrupp Electrical Steel UGO S.A.S. (France), Legnano (Italy), and Cogent (United Kingdom). The leading U.S. importers of GOES from subject countries include: ***.

I-5
Table I-1
GOES: Leading producers outside the United States and leading U.S. importers
Country Producers/exporters U.S. importers
Subject countries
China
Anshan Iron & Steel Group Corp. Baoshan Iron & Steel Co., Ltd. Hebei Shougang Qian'an Iron & Steel Co., Ltd. Wuhan Iron & Steel Co. Ltd.
*** *** ***
Czech Republic ArcelorMittal Frýdek-Místek a.s.
*** *** ***
Germany ThyssenKrupp Electrical Steel GmbH
*** *** *** ***
Japan JFE Steel Corp. Nippon Steel & Sumitomo Metal Corp.
*** *** *** *** *** *** *** *** *** *** ***
Korea POSCO *** ***
Poland Stalprodukt S.A.
*** *** *** *** *** ***
Russia Novolipetsk Steel (“NLMK”) PJSC Ashinskiy Metallurgical Works (exporter)
*** *** *** ***
Nonsubject countries
France ThyssenKrupp Electrical Steel UGO S.A.S.
*** *** ***
Italy Legnano ***
United Kingdom Cogent *** ***
Source: Compiled from data submitted in response to Commission questionnaires.
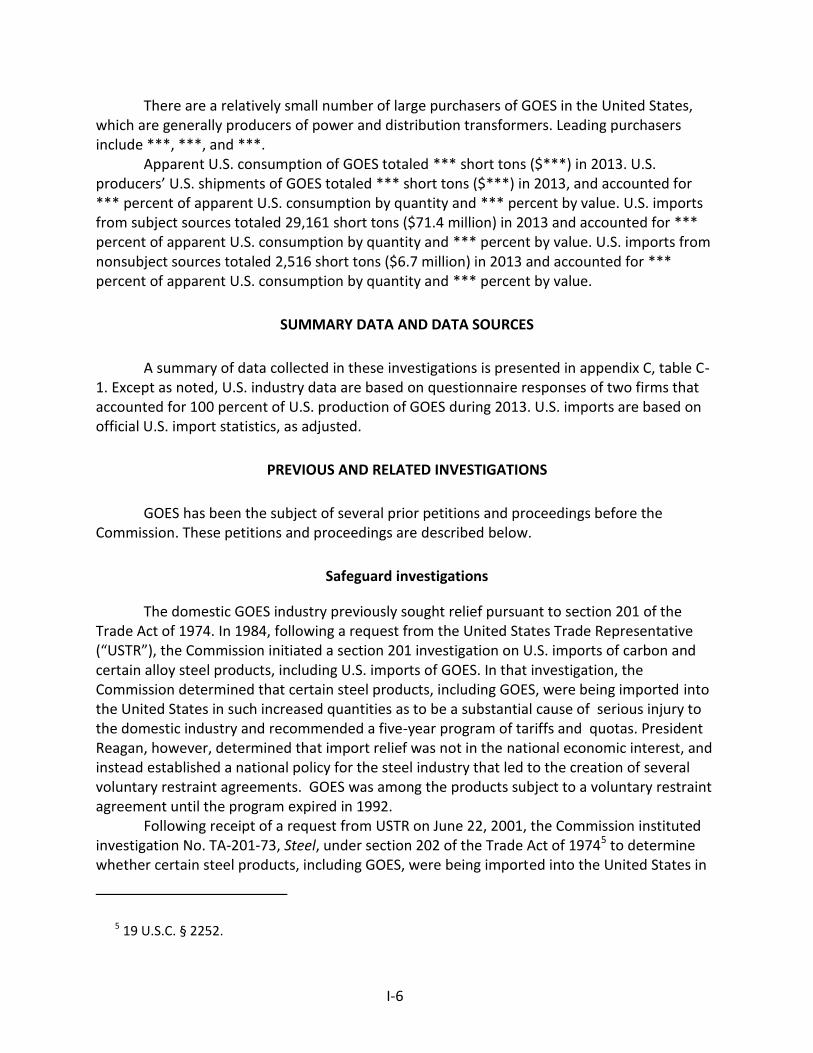
I-6
There are a relatively small number of large purchasers of GOES in the United States, which are generally producers of power and distribution transformers. Leading purchasers include ***, ***, and ***.
Apparent U.S. consumption of GOES totaled *** short tons ($***) in 2013. U.S. producers’ U.S. shipments of GOES totaled *** short tons ($***) in 2013, and accounted for *** percent of apparent U.S. consumption by quantity and *** percent by value. U.S. imports from subject sources totaled 29,161 short tons ($71.4 million) in 2013 and accounted for *** percent of apparent U.S. consumption by quantity and *** percent by value. U.S. imports from nonsubject sources totaled 2,516 short tons ($6.7 million) in 2013 and accounted for *** percent of apparent U.S. consumption by quantity and *** percent by value.
SUMMARY DATA AND DATA SOURCES
A summary of data collected in these investigations is presented in appendix C, table C-1. Except as noted, U.S. industry data are based on questionnaire responses of two firms that accounted for 100 percent of U.S. production of GOES during 2013. U.S. imports are based on official U.S. import statistics, as adjusted.
PREVIOUS AND RELATED INVESTIGATIONS
GOES has been the subject of several prior petitions and proceedings before the Commission. These petitions and proceedings are described below.
Safeguard investigations
The domestic GOES industry previously sought relief pursuant to section 201 of the Trade Act of 1974. In 1984, following a request from the United States Trade Representative (“USTR”), the Commission initiated a section 201 investigation on U.S. imports of carbon and certain alloy steel products, including U.S. imports of GOES. In that investigation, the Commission determined that certain steel products, including GOES, were being imported into the United States in such increased quantities as to be a substantial cause of serious injury to the domestic industry and recommended a five-year program of tariffs and quotas. President Reagan, however, determined that import relief was not in the national economic interest, and instead established a national policy for the steel industry that led to the creation of several voluntary restraint agreements. GOES was among the products subject to a voluntary restraint agreement until the program expired in 1992.
Following receipt of a request from USTR on June 22, 2001, the Commission instituted investigation No. TA-201-73, Steel, under section 202 of the Trade Act of 19745 to determine whether certain steel products, including GOES, were being imported into the United States in
5 19 U.S.C. § 2252.
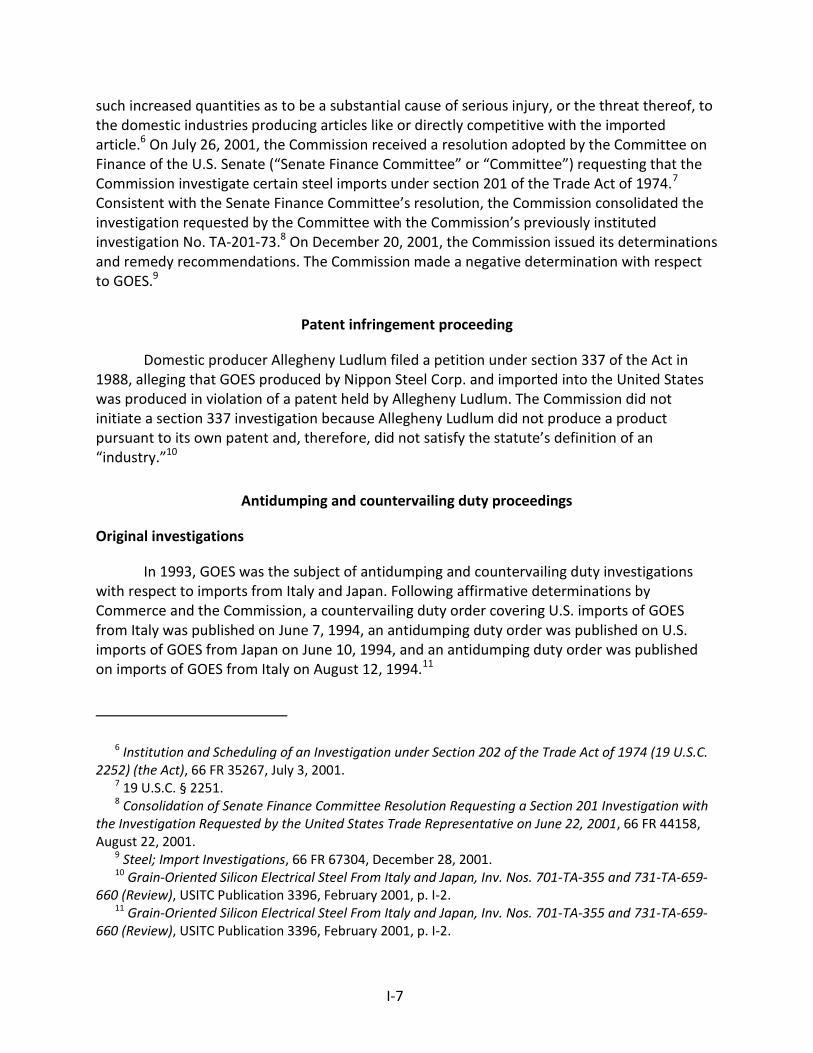
I-7
such increased quantities as to be a substantial cause of serious injury, or the threat thereof, to the domestic industries producing articles like or directly competitive with the imported article.6 On July 26, 2001, the Commission received a resolution adopted by the Committee on Finance of the U.S. Senate (“Senate Finance Committee” or “Committee”) requesting that the Commission investigate certain steel imports under section 201 of the Trade Act of 1974.7 Consistent with the Senate Finance Committee’s resolution, the Commission consolidated the investigation requested by the Committee with the Commission’s previously instituted investigation No. TA-201-73.8 On December 20, 2001, the Commission issued its determinations and remedy recommendations. The Commission made a negative determination with respect to GOES.9
Patent infringement proceeding
Domestic producer Allegheny Ludlum filed a petition under section 337 of the Act in 1988, alleging that GOES produced by Nippon Steel Corp. and imported into the United States was produced in violation of a patent held by Allegheny Ludlum. The Commission did not initiate a section 337 investigation because Allegheny Ludlum did not produce a product pursuant to its own patent and, therefore, did not satisfy the statute’s definition of an “industry.”10
Antidumping and countervailing duty proceedings
Original investigations
In 1993, GOES was the subject of antidumping and countervailing duty investigations with respect to imports from Italy and Japan. Following affirmative determinations by Commerce and the Commission, a countervailing duty order covering U.S. imports of GOES from Italy was published on June 7, 1994, an antidumping duty order was published on U.S. imports of GOES from Japan on June 10, 1994, and an antidumping duty order was published on imports of GOES from Italy on August 12, 1994.11
6 Institution and Scheduling of an Investigation under Section 202 of the Trade Act of 1974 (19 U.S.C. 2252) (the Act), 66 FR 35267, July 3, 2001.
7 19 U.S.C. § 2251. 8 Consolidation of Senate Finance Committee Resolution Requesting a Section 201 Investigation with
the Investigation Requested by the United States Trade Representative on June 22, 2001, 66 FR 44158, August 22, 2001.
9 Steel; Import Investigations, 66 FR 67304, December 28, 2001. 10 Grain-Oriented Silicon Electrical Steel From Italy and Japan, Inv. Nos. 701-TA-355 and 731-TA-659-
660 (Review), USITC Publication 3396, February 2001, p. I-2. 11 Grain-Oriented Silicon Electrical Steel From Italy and Japan, Inv. Nos. 701-TA-355 and 731-TA-659-
660 (Review), USITC Publication 3396, February 2001, p. I-2.

I-8
First five-year reviews
On December 1, 1999, Commerce initiated and the Commission instituted the first five-year reviews of the antidumping and countervailing duty orders on GOES from Italy and Japan. The Commission determined that revocation of the countervailing duty order on imports of GOES from Italy and revocation of the antidumping duty orders on imports of GOES from Italy and Japan would be likely to lead to continuation or recurrence of material injury to an industry in the United States within a reasonably foreseeable time.12 On March 14, 2001, Commerce published a notice of the continuation of the antidumping and countervailing duty orders.13
First remand
Italian and Japanese producers, exporters, and importers of the subject merchandise appealed the Commission’s determinations to the U.S. Court of International Trade (“CIT”) and on December 24, 2002, the CIT remanded the Commission’s determinations.14 On remand, the Commission again found that revocation of the countervailing duty order on GOES from Italy, and the antidumping duty orders on GOES from Italy and Japan, would be likely to lead to a continuation or recurrence of material injury to an industry in the United States within a reasonably foreseeable time.15
Second remand
On December 17, 2003, the CIT issued an opinion remanding the Commission’s no discernible adverse impact, cumulation, likely volume, likely price, and likely impact findings for reconsideration.16 On second remand, the Commission found that revocation of the countervailing duty order on GOES from Italy, and the antidumping duty orders on GOES from Italy and Japan, would be likely to lead to a continuation or recurrence of material injury to an industry in the United States within a reasonably foreseeable time.17
12 Grain-Oriented Silicon Electrical Steel From Italy and Japan, Inv. Nos. 701-TA-355 and 731-TA-659-660 (Review), USITC Publication 3396, February 2001, p. 1. Chairman Koplan, Commissioner Miller, and Commissioner Devaney made affirmative determinations, while Vice Chairman Okun, Commissioner Bragg, and Commissioner Hillman dissented.
13 Continuation of Antidumping Duty Orders and Countervailing Duty Order: Grain-Oriented Silicon Electrical Steel From Italy and Japan, 50 FR 14889, March 14, 2001.
14 Nippon Steel Corp., et al. v. United States, Slip Op. 02-153, December 24, 2002, p. 15. 15 Grain-Oriented Silicon Electrical Steel from Italy and Japan, Inv. Nos. 701-TA-355 and 731-TA-659-
660 (Review) (Remand), USITC Publication 3585, March 2003, p. 1. Commissioners Miller and Koplan made affirmative determinations, while Chairman Okun and Vice Chairman Hillman made negative determinations.
16 Nippon Steel Corp., et al. v. United States, 301 F. Supp 1355 (CIT 2003). 17 Grain-Oriented Silicon Electrical Steel from Italy and Japan, Inv. Nos. 701-TA-355 and 731-TA-659-
660 (Review) (Second Remand), USITC Publication 3680, March 2004, p. 1. Commissioner Koplan, (continued...)

I-9
Third remand
On June 15, 2005, the Court issued an opinion affirming in part and remanding in part the Commission’s affirmative determination on second remand.18 Upon consideration of the third remand order, the Commission determined that revocation of the countervailing duty order on GOES from Italy and the antidumping duty orders on GOES from Italy and Japan would not likely lead to the continuation or recurrence of material injury to an industry in the United States within a reasonably foreseeable time.19
On May 30, 2006, the CIT affirmed the Commission's third remand determination. Following an appeal by the domestic industry to the U.S. Court of Appeals for the Federal Circuit, the CIT's decision was reversed and vacated. On October 10, 2007, and pursuant to the Federal Circuit's mandate, the CIT sustained the Commission’s second remand determination and reinstated the affirmative injury determination.20
Second five-year reviews
On February 1, 2006, Commerce initiated and the Commission instituted the second five-year reviews of the antidumping and countervailing duty orders.21 At that time, the domestic industry chose not to participate in the reviews because it believed subject imports from Italy and Japan were unlikely to cause a recurrence of material injury to the domestic industry.22 As a result, the antidumping and countervailing duty orders on GOES from Italy and Japan were revoked effective March 14, 2006.23
(…continued) Commissioner Miller, and Commissioner Lane made affirmative determinations, while Chairman Okun, Vice Chairman Hillman, and Commissioner Pearson made negative determinations.
18 Nippon Steel Corp., et al. v. United States, Slip Op. 05-72, June 15, 2005. 19 Grain-Oriented Silicon Electrical Steel From Italy and Japan, Inv. Nos. 701-TA-355 (Review) (Third
Remand) and 731-TA-659-660 (Review) (Third Remand), USITC Publication 3798, September 2005, p. 1. Vice Chairman Okun and Commissioners Hillman and Pearson made negative determinations, while Chairman Koplan and Commissioner Lane made affirmative determinations. Commissioner Aranoff did not participate in the third remand proceeding.
20 Nippon Steel Corp. v. United States, 31 C.I.T. 1588 (2007). 21 Initiation of Five-Year (“Sunset”) Reviews, 70 FR 5243, February 1, 2006; and Grain-Oriented Silicon
Electrical Steel from Italy and Japan, 70 FR 5376, February 1, 2006. 22 Petition, p. 8. 23 Grain-Oriented Electrical Steel From Italy and Japan: Final Results of Sunset Reviews and
Revocation of Orders, 59 FR 15376, March 28, 2006.

I-10
NATURE AND EXTENT OF SUBSIDIES AND SALES AT LTFV
Subsidies
On March 11, 2014, Commerce published a notice in the Federal Register of its preliminary determination of countervailable subsidies for producers and exporters of GOES from China.24 Table I-2 presents Commerce’s findings of subsidization of GOES in China.
Table I-2 GOES: Commerce’s preliminary subsidy determination with respect to imports from China
Entity Preliminary countervailable subsidy margin
(percent)
Baoshan Iron & Steel Co., Ltd. 49.15
All others 49.15
Source: 79 FR 13617, March 11, 2014.
Commerce preliminarily determined the following programs to be countervailable: 1. Policy Loans to the GOES Industry 2. Preferential Loans to state-owned enterprises (“SOEs”) 3. Government Provision of Allocated Land-Use Rights for less than adequate
remuneration (“LTAR”) 4. Provision of Electricity for LTAR 5. Enterprise Tax Law Research and Development Program 6. Purchases of GOES for more than adequate remuneration (“MTAR”) 7. Other Grants
Commerce preliminary determined that the following programs were not used by
Baoshan, Baosteel Group, or Zhanjiang Longteng during Commerce’s period of investigation (January 1, 2012, through December 31, 2012):
1. Income Tax Reductions for high- or new-technology enterprises (“HNTEs”) 2. Income Tax Credits for Domestically-Owned Companies Purchasing Domestically-
Produced Equipment 3. State Key Technology Project Fund 4. Special Fund for Energy Savings Technology Reform 5. Export Credits 6. Shanghai City Tax Refund and Administrative Fee Reduction for Advanced
Enterprises
24 Countervailing Duty Investigation of Grain-Oriented Electrical Steel From the People’s Republic of China: Preliminary Determination and Alignment of Final Determination With Final Antidumping Duty Determination, 79 FR 13617, March 11, 2014.

I-11
7. Baoshan District Advanced Manufacturing Industry Development Special Fund 8. Baoshan District Industrial Development Support Matching Fund Special Fund 9. Baoshan District Science and Technology Innovation Special Fund Programs for which Commerce intends to gather additional information about following
its preliminary determination include: 1. Preferential Export Financing by the Export-Import Bank of China 2. Government Provision of Granted Land-Use Rights for LTAR25
Sales at LTFV
On May 9, 2014, Commerce published a notice in the Federal Register of its preliminary determination of sales at LTFV with respect to imports from the Czech Republic26 and on May 12, 2014, Commerce published notices in the Federal Register of its preliminary determinations of sales at LTFV with respect to imports from China, Germany, Japan, Korea, Poland, and Russia.27 Table I-3 presents Commerce’s dumping margins with respect to imports of product from China, the Czech Republic, Germany, Japan, Korea, Poland, and Russia.
On February 24, 2014, the petitioners filed timely allegations of critical circumstances with respect to imports of GOES from the Czech Republic, Poland, and Russia. Commerce preliminarily determined that critical circumstances exist with respect to imports of GOES from Poland and Russia, but that critical circumstances do not exist with respect to imports of GOES from the Czech Republic.28
25 Countervailing Duty Investigation of Grain-Oriented Electrical Steel from the People's Republic of China: Decision Memorandum for the Preliminary Determination, United States Department of Commerce, International Trade Administration, March 4, 2014.
26 Grain-Oriented Electrical Steel From the Czech Republic: Preliminary Determination of Sales at Less Than Fair Value, Negative Preliminary Determination of Critical Circumstances, and Postponement of Final Determination, 79 FR 26717, May 9, 2014.
27 Grain-Oriented Electrical Steel From the People’s Republic of China: Preliminary Determination of Sales at Less Than Fair Value and Postponement of Final Determination, 79 FR 26936, May 12, 2014; Grain-Oriented Electrical Steel From the Republic of Korea: Preliminary Determination of Sales at Less Than Fair Value and Postponement of Final Determination, 79 FR 26939, May 12, 2014; Grain-Oriented Electrical Steel From Germany, Japan, Poland, and the Russian Federation: Preliminary Determinations of Sales at Less Than Fair Value, Certain Affirmative Preliminary Determinations of Critical Circumstances, and Postponement of Russian Final Determination, 79 FR 26941, May 12, 2014.
28 Critical circumstances are addressed in greater detail in Part IV of this report.

I-12
On July 22, 2014, Commerce published a notice in the Federal Register of its final determinations of sales at LTFV with respect to imports from Germany, Japan, and Poland, 29 which are also shown in Table I-3. Commerce made no changes to its preliminary determinations in the investigations concerning GOES from Germany, Japan, and Poland.
Table I-3 GOES: Commerce’s weighted-average LTFV margins with respect to imports from China, the Czech Republic, Germany, Japan, Korea, Poland, and Russia
Manufacturer/exporter Preliminary dumping
margin (percent) Final dumping
margin (percent)
China
PRC-wide entity 159.21 --
Czech Republic
ArcelorMittal Frýdek-Místek 11.45 --
Sujani Enterprises, Inc. 10.35 --
All others 10.38 --
Germany
ThyssenKrupp Electrical Steel GmbH 241.91 241.91
All others 133.70 133.70
Japan
JFE Steel Corporation 172.30 172.30
Nippon Steel & Sumitomo Metal Corporation 172.30 172.30
All others 93.36 93.36
Korea
POSCO 5.34 --
All others 5.34 --
Poland
Stalprodukt S.A. 99.51 99.51
All others 78.10 78.10
Russia
OJSC Novolipetsk Steel/VIZ-Steel LLC 119.88 --
All others 68.98 --
Source: 79 FR 26936-26943, May 12, 2014; 79 FR 42501-42503, July 22, 2014.
29 Grain-Oriented Electrical Steel From Germany, Japan, and Poland: Final Determinations of Sales at Less Than Fair Value and Certain Final Affirmative Determination of Critical Circumstances, 79 FR 42501, July 22, 2014.

I-13
THE SUBJECT MERCHANDISE
Commerce’s scope
Commerce has defined the scope of these investigations as follows:
The scope of these investigations covers grain-oriented silicon electrical steel (GOES). GOES is a flat-rolled alloy steel product containing by weight at least 0.6 percent but not more than 6 percent of silicon, not more than 0.08 percent of carbon, not more than 1.0 percent of aluminum, and no other element in an amount that would give the steel the characteristics of another alloy steel, in coils or in straight lengths. The GOES that is subject to these investigations is currently classifiable under subheadings 7225.11.0000, 7226.11.1000, 7226.11.9030, and 7226.11.9060 of the Harmonized Tariff Schedule of the United States (HTSUS). Although the HTSUS subheadings are provided for convenience and customs purposes, the written description of the scope of these investigations is dispositive. Excluded are flat-rolled products not in coils that, prior to importation into the United States, have been cut to a shape and undergone all punching, coating, or other operations necessary for classification in Chapter 85 of the HTSUS as a transformer part (i.e., laminations).30
Tariff treatment
The merchandise subject to these investigations is classified in subheadings 7225.11.00, 7226.11.10, and 7226.11.90 of the Harmonized Tariff Schedule of the United States (“HTS”) and imported under statistical reporting numbers 7225.11.0000, 7226.11.1000, 7226.11.9030, and 7226.11.9060. The column‐1 general (normal trade relations) rate of duty for these subheadings, applicable to the merchandise subject to these investigations, is “free.”
30 Grain-Oriented Electrical Steel From Germany, Japan, and Poland: Determinations of Sales at Less Than Fair Value and Certain Final Affirmative Determination of Critical Circumstances, 79 FR 42501, July 22, 2014.

I-14
THE PRODUCT31
Description and applications
The product covered by these investigations, as defined by Commerce, is grain-oriented electrical steel (“GOES”), which is a flat-rolled alloy steel product containing by weight at least 0.6 percent but not more than 6 percent of silicon, not more than 0.08 percent of carbon, not more than 1.0 percent of aluminum, and no other element in a proportion that would give the steel the characteristics of another alloy steel.
GOES is sold as either sheets or strips, in either coils or in straight lengths. GOES, which typically contains approximately 3.2 percent by weight of silicon,32 is subject to specialized rolling and annealing (heat treatment) processes, which produce grain structures uniformly oriented in the rolling (lengthwise) direction of the steel sheet. This uniformly oriented grain structure permits the steel sheet to conduct a magnetic field with a high degree of efficiency in the direction of rolling compared with other steels, such as non-oriented silicon electrical steel (“NOES”). As a result, GOES has superior magnetic properties compared with NOES, both in terms of higher permeability and lower core loss.33 Both domestic and imported GOES are produced in compliance with specifications issued by ASTM International (“ASTM”)34 or proprietary specifications. The domestic industry produces a wide range of GOES, including conventional GOES in standard gauges (thicknesses), ranging from 0.007 inch (0.18 mm) through 0.0138 inch (0.35 mm), and high-permeability GOES in two standard thicknesses. The conventional products in the standard thicknesses are often referred by the U.S. grade or American Iron and Steel Institute (“AISI”) numbers M2 through M6.35 ASTM standards can be
31 Except as noted, information presented in the “Description and Applications” and “Manufacturing Processes” is drawn from Grain-Oriented Silicon Electrical Steel from Italy and Japan, Inv. Nos. 701-TA-355 and 731-TA-659-660 (Review), USITC Publication 3396, February 2001; and from Grain-Oriented Silicon Electrical Steel from China, Czech Republic, Germany, Japan, Korea, Poland, and Russia, Inv. Nos. 701-TA-505 and 731-TA-1231-1237 (Preliminary), USITC Publication 4439, November 2013.
32 Silicon, the primary alloying element in GOES, enhances the electro-magnetic properties (i.e., minimizes energy lost as heat) within the steel by promoting the crystal-orientation process and its resulting oriented-grain structure. AK Steel, Selection of Electrical Steels for Magnetic Cores, p. 7.
33 “Permeability” refers to the ease with which magnetic lines of force distribute themselves throughout (flow through) a material, or more generally, the ease of magnetization of the GOES product in response to a magnetic field. “Core loss” refers to the measured amount of electrical energy that is lost as heat from (eddy) currents generated when a magnetic flux flows through the steel.
34 ASTM International was previously known as the American Society for Testing and Materials. Specification ASTM A876/A876M sets maximum core-loss standards by ASTM grade and by testing standards for conventional GOES, high-permeability GOES, and laser-scribed high-permeability GOES.
35 The U.S. GOES industry continues to use the “M” grades as a legacy nomenclature. The U.S. grade nomenclature was developed by AISI, which was responsible for establishing the grading and testing standards for GOES until the 1980s when ASTM undertook the responsibility. Counsel to petitioners, e-mail correspondence with Commission staff, June 13, 2014, p. 2.

I-15
matched with the U.S. grade nomenclature by the product thickness (table I-4).36 Within each type of GOES, magnetic characteristics may differ in that the same product manufactured by two producers may have different average core losses. Nevertheless, the GOES that is available from domestic producers reportedly either meets or outperforms the maximum specified core-loss standards.37 38
GOES is used primarily in the production of laminated cores (described below) for large- and medium-sized electrical power transformers and distribution transformers.39 Because thinner laminations yield lower core losses in transformers, thinner gauge GOES is often preferred despite the added cost for both the steel and the manufacturing of the transformer core.40 Laminations for transformer cores are oriented within transformers to take advantage of the directional magnetic properties of the steel.
The directional magnetic properties of the GOES allow for the transformation of the electrical potential (voltage) for an alternating electrical current (figure I-1). Power transformers are designed to raise the voltage of electrical current from the level at which it is generated by an electric power plant to a higher level for more efficient transmission, and to lower the voltage to levels more suitable for local distribution. Distribution transformers, in turn, further lower the electrical voltage to levels suitable for commercial and residential consumers.
36 Counsel to petitioners, e-mail correspondence with Commission staff, June 13, 2014, p. 2. 37 Counsel to petitioners, e-mail correspondence with Commission staff, June 13, 2014, pp. 2-3. 38 According to an importer, transformer manufacturers consider the “typical core loss” level of
delivered GOES rather than the “maximum core loss” level guaranteed by GOES producers. Representative of ***, e-mail correspondence with Commission staff, October 30, 2013.
39 A transformer is an electrical apparatus that transfers electrical energy from one electrical circuit to another without any direct electrical connection by the electromagnetic induction of an alternating electrical current between two or more magnetically coupled coils or windings. Transformers are used to either increase (step-up) or decrease (step-down) the voltage (electrical potential) of an alternating electrical current within the circuitry of electrical equipment or systems.
40 According to a petitioners’ witness, thinner gauge M2 and M3 account for the vast majority of GOES used for cores in distribution transformers. Hearing transcript, p. 62 (Polinski).

I-16
Table I-4 GOES: U.S. (AISI) grades and ASTM A876/A876M specifications for conventional and high-permeability GOES
U.S. (AISI) grade
ASTM grade
Nominal thickness Maximum specific core loss
Inch (millimeter)
At frequency of 60 hertz1 At frequency of 50 hertz
2
Watts per pound (watts per kilogram)
Conventional GOES (tested at 15 kilogauss (1.5 tesla) by test method A343/A343M):
M2 18G041 0.0070 (0.18) 0.41 (0.90) 0.21 (0.68)
M3 23G045 0.0090 (0.23) 0.45 (0.99) 0.34 (0.75)
M4 27G051 0.0106 (0.27) 0.51 (1.12) 0.39 (0.85)
M5 30G058 0.0118 (0.30) 0.58 (1.28) 0.44 (0.97)
M6 35G066 0.0138 (0.35) 0.66 (1.46) 0.50 (1.11)
Conventional GOES (tested at 17 kilogauss (1.7 tesla) by test method A343/A343M):
M3 23H070 0.0090 (0.23) 0.70 (1.54) 0.53 (1.17)
M4 27H074 0.0106 (0.27) 0.74 (1.63) 0.56 (1.24)
M5 30H083 0.0118 (0.30) 0.83 (1.83) 0.63 (1.39)
M6 35H094 0.0138 (0.35) 0.94 (2.07) 0.71 (1.57)
High-permeability GOES (tested at 17 kilogauss (1.7 tesla) by test method A343/A343M):
H0 23P060 0.0090 (0.23) 0.60 (1.32) 0.46 (1.01)
H1 27P066 0.0106 (0.27) 0.66 (1.46) 0.50 (1.11)
Laser-inscribed, high-permeability GOES (tested at 17 kilogauss (1.7 tesla) by test method A343/A343M):
H0 DR 23Q054 0.0090 (0.23) 0.54 (1.19) 0.41 (0.90)
H1 DR 27Q057 0.0106 (0.27) 0.57 (1.26) 0.43 (0.96) 1 In the United States, a frequency of 60 hertz (cycles per second) is standard for the alternating current
(AC) transmitted through the national electricity grid. 2 A frequency of 50 hertz is common for the AC electricity grids in certain European countries and one-
half of Japan. Source: Counsel to petitioners, e-mail correspondence with Commission staff, June 13, 2014, pp. 1-3; and representative of ***, e-mail correspondence with USITC staff, October 31, 2013.
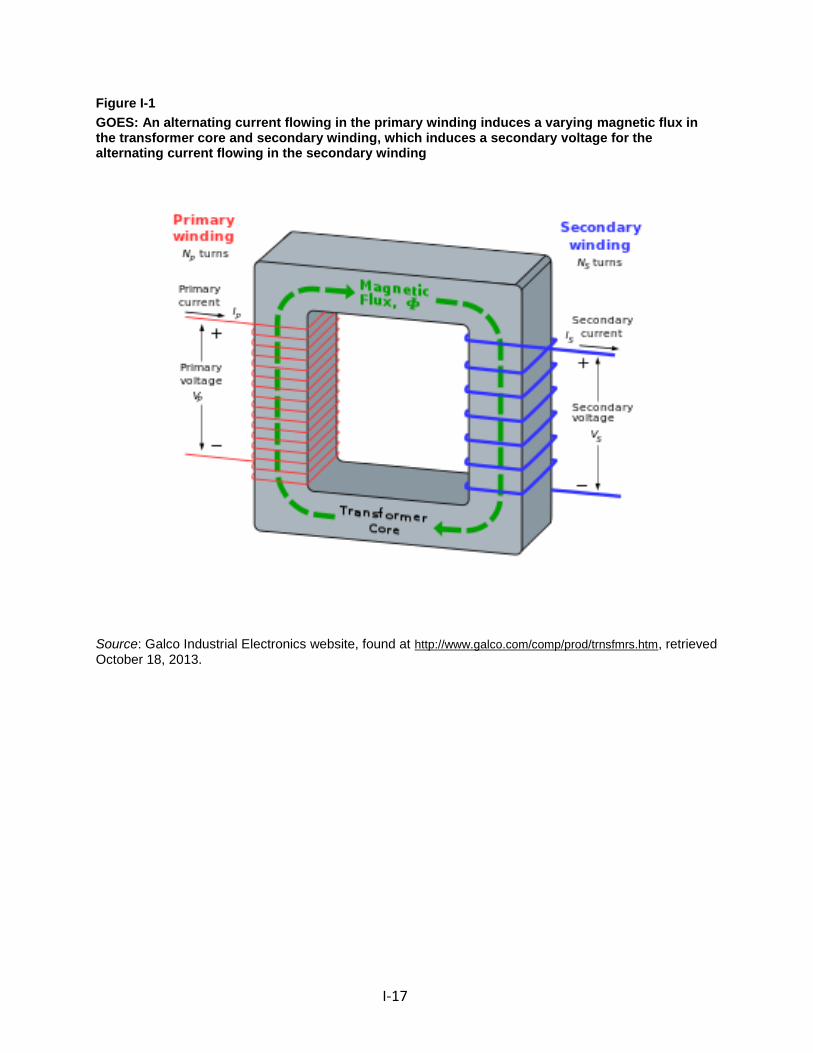
I-17
Figure I-1
GOES: An alternating current flowing in the primary winding induces a varying magnetic flux in the transformer core and secondary winding, which induces a secondary voltage for the alternating current flowing in the secondary winding
Source: Galco Industrial Electronics website, found at http://www.galco.com/comp/prod/trnsfmrs.htm, retrieved October 18, 2013.

I-18
In addition to differences in thickness, GOES is produced in different levels of magnetic permeability, distinguished by the size and orientation precision of the grains within the steel: “conventional” with smaller but less precisely oriented grains versus “high-permeability” with more precisely oriented but larger grains.41 42 High-permeability product allows a transformer to operate at a higher level of flux (flow) density43 than the conventional product, thus permitting a transformer to be smaller and have lower energy operating losses. High-permeability product is also produced as a domain-refined (surface-treated) type that has even lower core loss at high flux density. Domain refinement occurs by scribing thin lines onto the surface of the steel, which subdivides larger oriented grains into smaller ones44 (to produce “domain-refined GOES”),45 using laser scribing, mechanical scribing, or electrolytic etching.46 Product undergoing laser scribing does not retain its enhanced magnetic characteristics when it is annealed (heat treated)47 to relieve internal stresses. As a result, laser-scribed GOES (or “non-heat-proof GOES”) is not suitable for producing wound-core transformers (described below), which require superior core-loss properties,48 but must undergo heat-treatment to relieve internal stresses (which increase core losses)49 accumulated from the manufacturing process. By contrast, domain-refined GOES produced by mechanical scribing or electrolytic etching (i.e., “heat-proof GOES”) retains its enhanced magnetic characteristics even through stress-relief treatment.50 There is no known production of mechanically scribed or electrolytically etched, heat-proof GOES in the United States.
41 One witness compared the grain-size differences as “very, very tiny, about the size of a head of a pencil” for conventional GOES versus “about the size of a silver dollar” for high-permeability GOES. Hearing transcript, pp. 116‒117 (Schoen).
42 One witness characterized GOES thicknesses and grades as a continuum of products based on magnetic capability. A second witness asserted that there is overlap between types of GOES rather than a discrete series of GOES products. Hearing transcript, p. 58‒59 (Petersen); and p. 169 (Woolfort), respectively.
43 “Flux density” generally refers to the total number of magnetic lines of force per unit area. It can also be understood as the density of magnetic lines of force, or magnetic flux lines, passing through a specific area.
44 Hearing transcript, p. 117 (Schoen). 45 In contrast to “domain-refined GOES,” GOES having surfaces that did not undergo any domain
refinement is referred to as “non-domain-refined GOES.” 46 Both the mechanical scribing and electrolytic refining processes impart a dent into the surface of
the steel, by physically cutting into or by dissolving out some surface material, respectively. Hearing transcript, p. 117 (Schoen).
47 Laser scribing imparts a dent into the surface of the steel by melting some surface material, which is nullified by exposure at annealing temperatures. Hearing transcript, p. 104 (Rakowski).
48 Counsel to Nippon Steel and Sumitomo Metal Corp., comments on draft questionnaires, p. 2. 49 Hearing transcript, p. 103 (Polinski). 50 According to petitioner’s witnesses, thinner gauged (M2 and M3) conventional GOES is also
suitable in applications requiring heat-proof GOES, for the M2 and M3 GOES have smaller grain sizes which provide lower core losses. Hearing transcript, p. 49 (Kerwin); pp. 62, 103, and 104‒105 (Polinski).
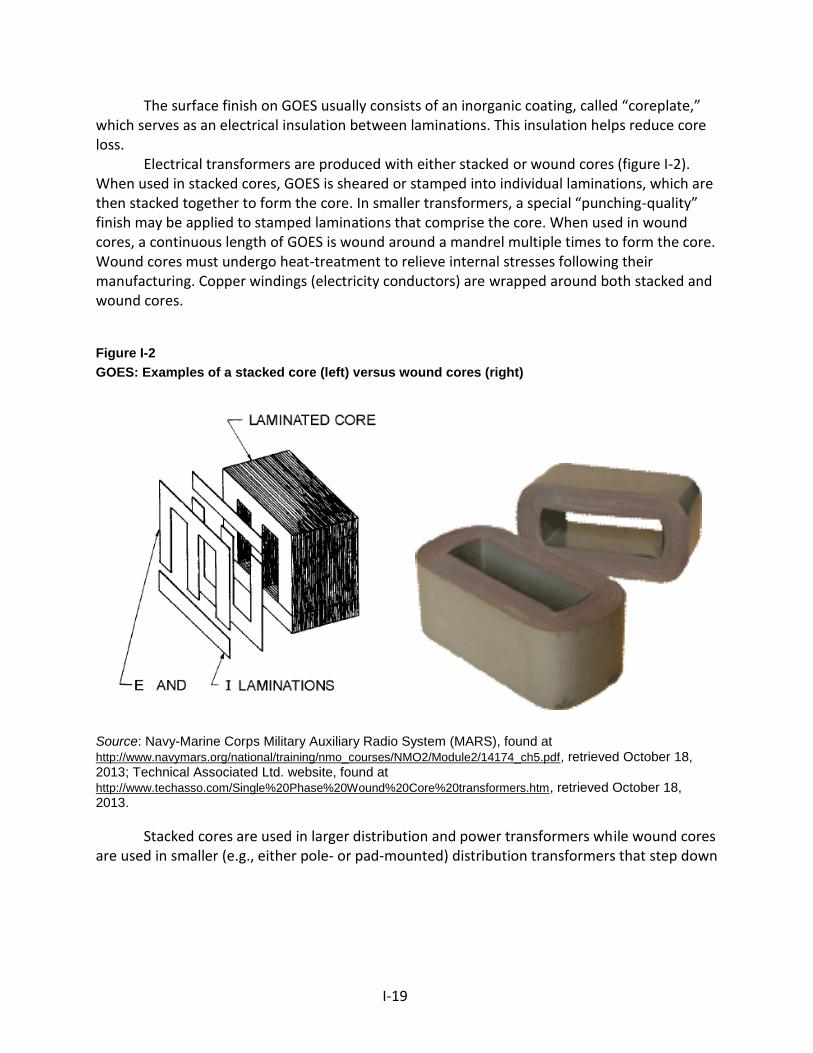
I-19
The surface finish on GOES usually consists of an inorganic coating, called “coreplate,” which serves as an electrical insulation between laminations. This insulation helps reduce core loss.
Electrical transformers are produced with either stacked or wound cores (figure I-2). When used in stacked cores, GOES is sheared or stamped into individual laminations, which are then stacked together to form the core. In smaller transformers, a special “punching-quality” finish may be applied to stamped laminations that comprise the core. When used in wound cores, a continuous length of GOES is wound around a mandrel multiple times to form the core. Wound cores must undergo heat-treatment to relieve internal stresses following their manufacturing. Copper windings (electricity conductors) are wrapped around both stacked and wound cores.
Figure I-2
GOES: Examples of a stacked core (left) versus wound cores (right)
Source: Navy-Marine Corps Military Auxiliary Radio System (MARS), found at http://www.navymars.org/national/training/nmo_courses/NMO2/Module2/14174_ch5.pdf, retrieved October 18, 2013; Technical Associated Ltd. website, found at http://www.techasso.com/Single%20Phase%20Wound%20Core%20transformers.htm, retrieved October 18, 2013.
Stacked cores are used in larger distribution and power transformers while wound cores are used in smaller (e.g., either pole- or pad-mounted) distribution transformers that step down

I-20
the voltage from the transmission line and provide power to residences and offices.51 In general, high-permeability grades are more commonly used in stacked cores and conventional grades M2 through M6 are used most effectively in wound cores.52 In wound-core applications, for example, “ABB would use with an M2 or M3, but the ultimate choice is predicated on the requirements of the customer and their total evaluated losses. As the size of the transformer increases, there is more movement toward lower-loss high-permeability domain-refined steels.”53 Petitioners contend that conventional grades M2 and M3 GOES are more efficient than some high-permeability GOES, resulting in a significant overlap among end-use applications of all types of GOES.54
Based on AK Steel’s sales experience in 2013, petitioners estimated market shares (table I-5) for high-permeability GOES at *** percent and conventional grades M2 through M6 GOES at *** percent of stacked-core transformers. In contrast, high-permeability GOES was *** percent and conventional grades M2 through M6 GOES *** percent of wound-and-annealed core transformers.55 Table I-5 GOES: Sales shares for GOES, by core types and grades
Core type GOES grades Market sales shares (percent)
Stacked-core transformers
High-permeability ***
M2 and M3 conventional ***
M4, M5, and M6 conventional ***
Total 100
Wound- and annealed-core transformers
High-permeability ***
M2 and M3 conventional ***
M4, M5, and M6 conventional ***
Total 100
Source: Petitioners’ posthearing brief, “Petitioners’ Responses to Commission Hearing Questions,” p. 56.
Manufacturing processes
The production of GOES begins with the steel melting process, during which ferrous (iron and steel) scrap and/or iron ore, and ferroalloys (primarily ferrosilicon) are melted either in an electric-arc furnace or a basic-oxygen furnace. Molten steel is then transferred to a vacuum degassing station, where the steel’s chemistry is refined by reducing both dissolved gasses and the carbon content. The steel is then either continuously cast into slabs or is cast into ingots that are subsequently hot-rolled into slabs.
51 ABB Inc.’s posthearing brief, “Answers to Commissioner Questions,” p. 3. 52 Petitioners’ posthearing brief, exhibit 13. 53 ABB Inc.’s posthearing brief, “Answers to Commissioner Questions,” p. 3. 54 Petitioners’ posthearing brief, “Petitioners’ Responses to Commission Hearing Questions,” p. 55. 55 Petitioners’ posthearing brief, “Petitioners’ Responses to Commission Hearing Questions,” p. 56.

I-21
The slabs may be reheated and rolled on a continuous hot-strip mill to produce hot-rolled coils. The coils are then annealed and pickled (cleaned with acid to remove surface oxide) in a continuous processing line, and then cold-reduced on either a multi-stand tandem cold-rolling mill or a reversing cold-rolling mill. The coils undergo this process twice to reach the final thickness.
The product is then processed through a line in which it is decarburized by heating in a controlled atmosphere and then coated with magnesium oxide, which will serve as an insulator when the GOES is assembled into transformer cores.56 It is then annealed at a high temperature in its coil form, a process that takes 5 or 6 days, during which highly oriented grains form within the steel.57 The magnesium oxide prevents the layers of the coils from sticking together during the annealing process and also partially fuses, thereby forming a glass-like coating on the surface on the steel, referred to as “mill-glass” or “glass film,” even though it is not technically a glass. The mill-glass coating is also known as “C-2 coreplate.”
Each coil is processed through a continuous line in which excess magnesium oxide is removed by scrubbing. The coil is then heat-flattened and a second coating of magnesium oxide is applied.58 To manufacture punching-quality GOES, the mill-glass or C-2 coating is removed by pickling in acid before the second coreplate coating is applied. The coating applied to produce punching-quality GOES is an inorganic or mostly inorganic coating, called “C-5 coreplate,” with ceramic fillers or film-forming components to increase the insulating ability of the coating. Finally, the product may be slit to a final width, if necessary, and packaged for shipment.59
Foreign producers in China, the Czech Republic, Germany, Japan, Korea, Poland, and Russia generally use the same processes to produce GOES.60 Although there is no known production of GOES in Canada, slitting operations are undertaken in Burlington, Ontario, by electrical transformer core and components manufacturers Cogent Power Inc.61 and Tempel
56 Hearing transcript, p. 21 (Petersen). 57 Hearing transcript, p. 21 (Petersen). 58 AK Steel produces domain-refined GOES by laser-scribing lines on the surface of the steel using
equipment installed on its heat-flattening and coating lines. The laser scribing occurs after scrubbing and heat-flattening, but before the coating is applied to the steel.
59 GOES may be slit from uncoiled or straight-length sheets into narrower strips, which may then be recoiled or left as straight lengths. GOES that undergoes trimming, filing, slitting, or cutting abroad that does not otherwise materially alter the characteristics of the good, but merely its dimensions, is imported into the United States under the same statistical reporting numbers (HTS 7225.11.0000, 7226.11.1000, 7226.11.9030, and 7226.11.9060) as the original-dimension GOES, according to U.S. Customs and Border Protection (CBP). See, e.g.: CBP, ruling letter HQ 224283, March 17, 1993; ruling letter HQ 225368, February 1, 1995; ruling letter HQ 226152, July 23, 1996; and ruling letter HQ W228610, February 27, 2002.
60 Hearing transcript, p. 21 (Petersen). 61 Cogent Power, “Products,” found at http://www.cogentpowerinc.com/Products.htm, retrieved
June 23, 2014.

I-22
Steel.62 Both U.S. producers of GOES manufacture additional products ***. AK Steel also produces NOES ***.
DOMESTIC LIKE PRODUCT ISSUES
The Commission’s decision regarding the appropriate domestic products that are “like” the subject imported product is based on a number of factors including: (1) physical characteristics and uses; (2) common manufacturing facilities and production employees; (3) interchangeability; (4) customer and producer perceptions; (5) channels of distribution; and (6) price. Information regarding past Commission determinations in related proceedings concerning the domestic like product, the petitioners’ and respondents’ positions on the domestic like product in these proceedings, and the factors the Commission considers in making a domestic like product determination is discussed below.
In the original investigations and first five-year reviews concerning GOES from Italy and Japan, the Commission found that all types of GOES comprised a single domestic like product. The Commission rejected arguments advanced in the original investigations by the Japanese producers that high-permeability and conventional grades of GOES constituted separate domestic like products, finding that the different grades represented a continuum of products. The Commission further found that the different grades of GOES were chemically alike, possessed essentially the same physical characteristics, were marketed through the same channels of distribution, had similar uses, were interchangeable to a certain degree, and shared common production facilities. In the first five-year reviews concerning the orders on GOES imports from Italy and Japan, parties raised no new like product issues, there were no significant changes in the nature, uses, and manufacture of GOES since the original investigations, and there was no information that indicated a need to revisit the Commission’s definition of the domestic like products in the original determinations.63
Petitioners proposed that the Commission should define the domestic like product in these investigations to encompass all GOES, including both conventional and high-permeability GOES products, co-extensive with the scope of the case.64 Petitioners argued that a determination by the Commission defining the domestic like product as co-extensive with the scope of the investigation would be consistent with past Commission findings and the Commission's traditional like product analysis: (1) all GOES has the same basic physical characteristics - both with respect to its physical form and chemistry – and virtually all GOES has the same uses - in the production of electric power and distribution transformers; (2) conventional and high-permeability GOES are made in common manufacturing facilities, using
62 Tempel Steel, “Tempel Global Operations & Capabilities, Burlington, Canada,” found at http://www.tempel.com/capabilities/manufacturing-facilities, retrieved June 23, 2014. See Part IV for more information about ***.
63 Grain-Oriented Silicon Electrical Steel From Italy and Japan, Inv. Nos. 701-TA-355 and 731-TA-659-660 (Review), USITC Publication 3396, February 2001, p. 5.
64 Petition, p. 14.

I-23
similar production processes, and the same production employees; (3) conventional and high-permeability grades of GOES are separately designated in the market but are generally interchangeable with end users within one or two grade steps; (4) customers and producers generally perceive both types of GOES to be suitable for the construction of cores in transformers that are used in the generation and distribution of electricity; and (5) all GOES is sold in the same channels of distribution - primarily direct to end users (transformer manufacturers) and to a lesser extent to processors that slit coils of GOES and/or manufacture laminations that are used in building a transformer core. Petitioners added that none of the respondent witnesses appearing at the staff conference raised any argument suggesting that the Commission should find anything other than a single domestic like product, and such a determination would be consistent with the Commission’s prior proceedings involving GOES.65
Although no respondent parties presented any arguments or data requests for an alternative domestic like product at the staff conference in the preliminary phase of these investigations, the Chinese and Russian respondents provided comments in their postconference briefs in the preliminary phase. Chinese respondents Baoshan Iron & Steel Co., Ltd. and Baosteel America, Inc. noted in their postconference brief that “The respondents did not raise at this preliminary stage any issues on cumulation of subject imports or on like product that would justify collecting additional information and analyzing the data differently for the final investigation.”66 Russian respondent NLMK argued that although the Commission considered the issue of whether conventional and high-permeability GOES were separate like products in the previous proceedings and found one domestic like product, the conditions of competition have changed such that the Commission should reconsider its previous decisions. It further argued that, in October 2007, the Department of Energy (“DOE”) adopted revised energy efficiency standards that changed the market and created two distinct like products within GOES. It explained that conventional GOES is designated as grades M2, M3, M4, and M6 and higher grades are designated as high-permeability steel and amorphous steel. NLMK argued that, prior to 2007, these grades of GOES may have been a continuum of products which were substitutable with each other to some degree, but the DOE regulations have made it “technically impossible to substitute between grades M4/M6 for higher grades.”67
No additional comments or requests for data specifically concerning the domestic like product were provided by parties in their comments on the draft questionnaires in the final phase of these investigations. As was the case in the preliminary phase of these investigations, the domestic producers continue to argue that the Commission should find one domestic like product consisting of both conventional and high-permeability GOES, coextensive with the scope.68 However, Russian respondent NLMK argued in its prehearing brief in the final phase of these investigations that “a clear dividing line exists between low grade GOES and higher grade
65 Petitioners’ postconference brief, pp. 3-6. 66 Baoshan Iron & Steel Co., Ltd. and Baosteel America, Inc. ("Baosteel"), postconference brief, p. 9. 67 NLMK postconference brief, pp. 3-4. 68 Petitioners’ prehearing brief, p. 2.

I-24
GOES which can be used to meet the new DOE regulations.”69 NLMK also urged the Commission to consider the new DOE regulations as a condition of competition should it decide to find one domestic like product consisting of all GOES.70
Japanese respondents JFE Steel Corporation (“JFE Steel”) and Nippon Steel & Sumitomo Metal Corporation (“NSSMC”) argued in the final phase of these investigations that they “have developed proprietary methodologies for producing “heat-proof” domain-refined GOES through mechanical scribing (NSSMC) or electrolytic etching (JFE Steel) techniques.”71 They noted that these heat-proof GOES products produced in Japan are not available from any other GOES producers worldwide and that heat-proof domain-refined GOES cannot be replaced by any other type of GOES.72 The Japanese respondents argued that the heat-proof, domain-refined GOES should be treated as a separate domestic like product because it is not produced by the petitioners or by any other subject country.73 According to the petitioners, however, this product can be substituted for the domestic laser-scribed product in all applications. The petitioners noted that treating GOES imported from Japan as a separate like product is “contrary to the terms of the statute as well as the Commission’s precedent” in that the Commission has, in the past, declined to define a domestic like product that is not produced by a U.S. industry.74
Detailed data regarding shipments of GOES by grade and by type – including individual “M” grades – are presented in Parts III and IV of this report.
Physical characteristics and uses
GOES is a flat-rolled alloy steel product having a grain structure that permits it to conduct a magnetic field with a high degree of efficiency. It primarily consists of a flat-rolled alloy steel product containing by weight at least 0.6 percent but not more than 6 percent of silicon, not more than 0.08 percent of carbon, not more than 1.0 percent of aluminum, and no other element in a proportion that would give the steel the characteristics of another alloy steel. It is used primarily in the production of laminated cores for large and medium-sized electrical power transformers and distribution transformers.
Both conventional and high-permeability GOES have similar physical forms and chemistry, but possess different levels of magnetic permeability. Both are used in power and distribution transformers, but the use of high-permeability GOES can allow a transformer to operate at a higher level of flux density than conventional GOES, thus permitting a transformer to be smaller and have lower operating losses.
69 NLMK prehearing brief, p. 6. 70 Ibid. 71 NSSMC’s prehearing brief, p. 7 and JFE Steel’s prehearing brief, p. 6. 72 Ibid. 73 JFE Steel’s posthearing brief, p. 10. 74 Petitioners’ prehearing brief, pp. 11-12; hearing transcript, pp. 50-51 (Hermann).

I-25
Manufacturing facilities and production employees
AK Steel, ***, manufactures both conventional and high-permeability GOES on the same production equipment using the same manufacturing processes and the same production employees.75 Allegheny Ludlum’s production of GOES is concentrated on the conventional grades, but it indicates that it is in the process of expanding its product mix to include high-permeability GOES and has successfully produced and shipped high-permeability GOES in trial orders to select customers.76
Interchangeability and customer and producer perceptions
U.S. producers argued that conventional grades of GOES compete with high-permeability products to a certain degree (i.e., within one or two grade steps) with purchasers evaluating different grades of GOES to minimize the total costs of owning a transformer.77 They also noted that GOES customers and producers generally perceive both conventional and high-permeability GOES as suitable for constructing transformer cores.78
Russian respondent NLMK, however, argued that DOE energy efficiency standards for transformers have changed the GOES market such that market demand has shifted to higher efficiency GOES. It argued further that there is no longer a continuum of grades for GOES in which different grades are substitutable and that the Commission should “de-cumulate imports from Russia in this investigation.”79 In addition, Japanese respondent JFE Steel noted that “while a customer potentially could satisfy its efficiency specifications by using a lower grade of GOES instead of Japanese heat-proof {domain-refined} GOES, its transformer would then fail to meet other fundamental specifications, specifically size, weight, and noise level… Petitioners’ argument that their GOES is substitutable with heat-proof {domain-refined} GOES disregards the practical reality that this would alter all properties of the transformers, not just its efficiency.”80
When comparing broad categories of conventional, domain‐refined, and non‐domain-refined GOES, U.S. producers reported that the different types of GOES were *** interchangeable with each other, while most importers and purchasers indicated that they were either sometimes or never interchangeable (see Part II (table II‐7) of this report for further information). Purchasers responding to the Commission’s questionnaire reported buying a
75 Petitioners’ prehearing brief, p. 6. 76 Petitioners’ prehearing brief, pp. 7. 77 Conference transcript, p. 38 (Hermann), pp. 27 and 53-54 (Polinski), and p. 57 (Schoen); hearing
transcript, pp. 23 (Petersen). AK Steel testified, “In determining how to minimize the total owning cost, transformer manufacturers evaluate a number of factors including the cost of the GOES that will be used to construct a transformer, the cost of the electricity that’s lost as a result of the relative efficiency of the GOES, and the cost of other materials used in the transformer.” Hearing transcript, p. 23 (Petersen).
78 Petitioners’ prehearing brief, p. 6. 79 NLMK’s posthearing brief, pp. 2-3. 80 JFE Steel’s posthearing brief, pp. 12-13.
I-26
range of grades for use primarily in transformers. The tabulation below shows the grades purchased by the responding firms.
* * * * * * *
Channels of distribution
Although the Commission did not collect separate data specific to channels of distribution for conventional and high-permeability GOES, AK Steel reported that it sells both conventional and high-permeability GOES primarily to end users, with a smaller amount being sold to distributors and processors that slit coils of GOES or manufacture laminations for a transformer core.81 Allegheny Ludlum also reported that a majority of its conventional GOES is sold to end users. As discussed in further detail in Part II of this report, *** percent of all such domestic producer shipments were shipped to end users in 2013.
Price
Petitioners testified that high-permeability GOES may be sold at a higher price compared with conventional GOES because it has lower loss and is more expensive to manufacture.82 The petitioners noted in their prehearing brief, however, that prices per short ton for conventional GOES overlap somewhat with prices for high-permeability GOES and that the data in the Commission’s prehearing report shows some conventional GOES prices higher than the prices of high-permeability GOES.83 Unit value data collected in these investigations on the separate grades of conventional GOES and on the different types of high-permeability GOES are presented in Part III (table III-7). Pricing data collected in these investigations for separate types of conventional and high-permeability GOES are presented in Part V of this report.
81 Petitioners’ prehearing brief, pp. 6. 82 Conference transcript, p. 55 (Schoen). 83 Petitioners’ prehearing brief, p. 7.

II-1
PART II: CONDITIONS OF COMPETITION IN THE U.S. MARKET
U.S. MARKET CHARACTERISTICS
GOES is used primarily in the production of laminated cores for large and medium-sized electrical power transformers and distribution transformers. Power transformers are used to change the voltage of electric power between power plants, distribution centers, and commercial and residential consumers. The two domestic producers of GOES supplied more than four-fifths of the U.S. market during 2011-13.
CHANNELS OF DISTRIBUTION
U.S. producers sold mainly to end users, as did importers of subject product from China, Japan, Korea, Poland, and Russia, as shown in table II-1. Particularly with respect to imports from ***, certain end users were themselves the importer of record. Importers of subject product from Germany sold GOES primarily to slitters and laminators, while importers of subject product from the Czech Republic sold *** of their product to slitters and laminators. Table II-1 GOES: U.S. producers’ and importers’ U.S. shipments, by sources and channels of distribution, 2011-13, January-March 2013, and January-March 2014
* * * * * * *
U.S. PURCHASERS
The Commission sent purchasers’ questionnaires to 48 companies believed to have purchased GOES since 2011. Questionnaire responses were received from 26 purchasers, with 22 reporting that they had purchased GOES since 2011. Seventeen responding purchasers reported that they were end users, five characterized themselves as distributors, and six reported being a manufacturer or stamper of some type (some firms provided more than one narrative response). All but one responding purchaser reported purchasing U.S-produced GOES and 13 of these purchasers reported purchasing GOES from subject countries. Of the responding firms, the three largest U.S. purchasers of GOES were *** purchasing just over *** short tons during 2013.
GEOGRAPHIC DISTRIBUTION
*** reported selling GOES to all regions in the contiguous United States (table II-2). *** did not sell GOES in the *** regions. Only one subject importer, ***, reported selling to all regions in the contiguous United States. Nonetheless, taken together, importers from each

II-2
subject country reported selling product to each region, except that no importers of Chinese product sold to the Northeast or Mountain regions. For U.S. producers, more than *** percent of sales was between 101 and 1,000 miles of their production facility. Most subject importers sold at least 80 percent within 1,000 miles of their U.S. point of shipment. *** which imports GOES from China and Japan, however, made *** from their U.S. point of shipment.
Table II-2
GOES: Geographic market areas in the United States served by U.S. producers and importers, by number of responding firms
* * * * * * *
SUPPLY AND DEMAND CONSIDERATIONS
U.S. supply
Domestic production
Based on available information, U.S. producers of GOES have the ability to respond to changes in demand with large changes in the quantity of shipments of U.S.-produced GOES to the U.S. market. The main contributing factors to the high degree of responsiveness of supply are the availability of unused capacity, the existence of alternate markets and inventories, and the ability to produce alternate products.
Industry capacity
Domestic capacity utilization decreased from *** to *** percent between 2011 and 2013. This suggests that U.S. producers may have capacity to increase production of product in response to an increase in prices.
Alternative markets
U.S. producers’ export shipments fell from *** of total shipments in 2011 to *** percent of total shipments during 2013. This level of export shipments indicates that U.S. producers have an ability to shift shipments between the U.S. market and other markets in response to price changes, although the antidumping and countervailing duty orders on GOES from the United States in China may somewhat limit their ability to export.
Inventory levels
U.S. producers’ inventories fluctuated between *** and *** percent of total shipments from 2011 to 2013. These inventory levels suggest that U.S. producers may have an ability to respond to changes in demand with changes in the quantity shipped from inventories.

II-3
Production alternatives
One of two responding U.S. producers stated that it *** switch production from GOES to other products. *** indicated that it could produce NOES ***.
Supply constraints
*** reported it had refused, declined, or was unable to supply GOES since 2011.
Subject imports from China
Based on available information, the single responding Chinese producer (Baosteel) has the ability to respond to changes in demand with large changes in the quantity of shipments of GOES to the U.S. market, depending on how easily it can shift sales from its home market. The main contributing factors to the high degree of responsiveness of supply are existence of alternate markets and inventories.
Industry capacity
With production and capacity both increasing between 2011 and 2013, capacity utilization declined but remained greater than *** percent. This high level of capacity utilization suggests that the Chinese producer may have little additional capacity to increase production of GOES in response to an increase in prices.
Alternative markets
Between 2011 and 2013, approximately *** percent of Baosteel’s shipments were to the Chinese home market and *** were reportedly to export markets other than the United States. However, Baosteel indicates that it sells GOES in coils to processors in Canada and Mexico who then resell slit GOES in the United States. It also indicates that to its knowledge, Baosteel is the only Chinese exporter of GOES to the United States.1 This indicates that Chinese producer Baosteel likely has some ability to shift shipments from the Chinese home market in response to a change in price.
Inventory levels
The Chinese producer’s inventories as a ratio to total shipments increased to *** percent in 2013. This inventory level suggests that Chinese producers may have an ability to respond to changes in demand with changes in the quantity shipped from inventories.
1 Hearing transcript, p. 153 (Huang).

II-4
Production alternatives
Chinese producer Baosteel stated that it *** switch production from GOES to other products.
Supply constraints
Two importers of Chinese GOES reported that they had refused, declined, or were unable to supply GOES since 2011. *** indicated that due to allocation and availability, it had to decline some inquiries. *** stated that limited production capacity had constrained their supply.
Subject imports from Czech Republic
Based on available information, the Czech producer has the ability to respond to changes in demand with large changes in the quantity of shipments of GOES to the U.S. market. The main contributing factor to the high degree of responsiveness of supply is the existence of alternate markets.
Industry capacity
With production ***, capacity utilization remained greater than *** percent between 2011 and 2013. This high level of capacity utilization suggests that the Czech producer may have little additional capacity to increase production of GOES in response to an increase in prices.
Alternative markets
Between 2011 and 2013, more than *** percent of Czech shipments reportedly were to export markets other than the United States. This indicates the Czech producer likely has an ability to shift shipments from the other export markets in response to a change in price.
Inventory levels
The Czech producer’s inventories as a ratio to total shipments fluctuated between *** and *** percent between 2011 and 2013. This inventory level suggests that the Czech producer may have a limited ability to respond to changes in demand with changes in the quantity shipped from inventories.
Production alternatives
The Czech producer stated that it *** switch production from GOES to other products.

II-5
Supply constraints
No importer of Czech GOES reported that they had refused, declined, or were unable to supply GOES since 2011.
Subject imports from Germany
Based on available information, the German producer has the ability to respond to changes in demand with large changes in the quantity of shipments of GOES to the U.S. market. The main contributing factor to the high degree of responsiveness of supply is the existence of alternate markets and the availability of some unused capacity.
Industry capacity
With production ***, capacity utilization fell below *** percent in 2013 from *** percent during 2011-12 respectively. This level of capacity utilization suggests that the German producer may have some additional capacity to increase production of GOES in response to an increase in prices.
Alternative markets
Between 2011 and 2013, more than *** percent of German shipments were to export markets other than the United States. This indicates the German producer likely has an ability to shift shipments from other export markets in response to a change in price.
Inventory levels
The German producer’s inventories as a ratio to total shipments increased to just under *** percent in during 2013. This inventory level suggests that the German producer may have a limited ability to respond to changes in demand with changes in the quantity shipped from inventories.
Production alternatives
The German producer stated that it *** switch production from GOES to other products.
Supply constraints
Two importers of German GOES reported they had refused, declined, or were unable to supply GOES since 2011. *** indicated that they had not been able to meet short delivery times. *** stated that limited production capacity had constrained their supply.

II-6
Subject imports from Japan
Based on available information, Japanese producers have the ability to respond to changes in demand with large changes in the quantity of shipments of GOES to the U.S. market. The main contributing factors to the high degree of responsiveness of supply are existence of alternate markets.
Industry capacity
Capacity utilization for the Japanese producers declined from *** to *** percent between 2011 and 2013. This high level of capacity utilization suggests that Japanese producers may have limited additional capacity to increase production of GOES in response to an increase in prices.
Alternative markets
Between 2011 and 2013, approximately *** percent of Japanese shipments were to export markets other than the United States. This indicates Japanese producers likely have an ability to shift shipments from other export markets in response to a change in price.
Inventory levels
Japanese producers’ inventories as a ratio to total shipments fluctuated between *** and *** percent between 2011 and 2013. This inventory level suggests that the Japanese producers may have a limited ability to respond to changes in demand with changes in the quantity shipped from inventories.
Production alternatives
Japanese producers stated that they *** switch production from GOES to other products.
Supply constraints
Four Japanese importers reported they had refused, declined, or were unable to supply GOES since 2011. *** indicated that due to allocation and availability, it had to decline some inquiries. *** indicated that its supply was constrained by production capacity of ***. *** had difficulty in getting Japanese producers to allocate any production capacity to meet demand for conventional GOES. *** indicated that its limited production capacity had constrained its supply.

II-7
Subject imports from Korea
Based on available information, the Korean producer POSCO has the ability to respond to changes in demand with large changes in the quantity of shipments of GOES to the U.S. market. The main contributing factors to the high degree of responsiveness of supply are the existence of alternate markets and inventories, as well as some available capacity.
Industry capacity
Capacity utilization remained between *** and *** percent between 2011 and 2013. This relatively moderate level of capacity utilization suggests that Korean producers may have some additional capacity to increase production of GOES in response to an increase in prices.
Alternative markets
Between 2011 and 2013, more than *** percent of Korean shipments were to export markets other than the United States. This indicates the Korean producer likely has an ability to shift shipments from other export markets in response to a change in price.
Inventory levels
The Korean producer’s inventories as a ratio to total shipments fluctuated between *** and *** percent between 2011 and 2013. This inventory level suggests that the Korean producer may have an ability to respond to changes in demand with changes in the quantity shipped from inventories.
Production alternatives
POSCO stated that it *** switch production from GOES to other products.
Supply constraints
One importer of Korean GOES reported it had refused, declined, or was unable to supply GOES since 2011. *** indicated that its supply is constrained by the few mills that can produce high-end grade steel, limited capacity, and low prices in the market for “low grade GOES.”
Subject imports from Poland
There is limited information available about Polish imports because no Polish producers responded to the Commission questionnaire. More than 95 percent of Poland’s 2011-13 exports of GOES are to non-U.S. markets.
Supply constraints
No importer of Polish GOES reported it had refused, declined, or were unable to supply GOES since 2011. *** stated that limited production capacity had constrained its supply.

II-8
Subject imports from Russia
Based on available information, Russian producers have the ability to respond to changes in demand with large changes in the quantity of shipments of GOES to the U.S. market. The main contributing factors to the high degree of responsiveness of supply are existence of alternate markets and inventories.
Industry capacity
With production ***, capacity utilization fell below *** percent in 2013, down from *** percent in 2011 and 2012 respectively. This level of capacity utilization suggests that Russian producers may have limited additional capacity to increase production of GOES in response to an increase in prices.
Alternative markets
Between 2011 and 2013, more than *** percent of Russian shipments were to export markets other than the United States. This indicates Russian producers likely have an ability to shift shipments from other export markets in response to a change in price.
Inventory levels
Russian producers’ inventories as a ratio to total shipments fluctuated between *** to *** percent between 2011 and 2013. This inventory level suggests that Russian producers may have an ability to respond to changes in demand with changes in the quantity shipped from inventories.
Production alternatives
Russian producers stated that they *** switch production from GOES to other products.
Supply constraints
No importer of Russian GOES reported it had refused, declined, or was unable to supply GOES since 2011.
Nonsubject imports
The largest sources of nonsubject imports during 2011-13 were the United Kingdom, Italy, Mexico, France, Sweden, Brazil, and Taiwan. Combined, these countries accounted for the bulk of nonsubject imports in 2013.2
2 Official import statistics suggest that Canada is a large nonsubject source of U.S. imports of GOES,
but it is believed that these data were misreported since there is no known production of GOES in Canada. See Part IV for detailed information on U.S. imports.

II-9
U.S. demand
Based on available information, the overall demand for GOES is likely to experience small changes in response to changes in price. The main contributing factors are the somewhat limited range of substitute products and the small cost share of product in most of its end-use products.
End uses
U.S. demand for GOES depends on the demand for U.S.-produced power and distribution transformers. GOES is used primarily in the production of laminated cores for large and medium-sized electrical power transformers and distribution transformers. Power transformers are used to raise the voltage of electric power from the level at which it is generated by a power plant to a higher level for more efficient transmission, and to lower voltage to levels suitable for local distribution. Distribution transformers, in turn, further reduce electrical voltage to levels suitable for commercial and residential consumers. In addition to these end users, stampers may also use GOES to punch laminations that are used in equipment having smaller transformers, including appliances and aerospace, aeronautical, and electronic equipment.3
There are two main drivers of transformer demand: replacement and new transformer demand. Petitioners stated that the degree to which utilities replace transformers is a demand driver in the replacement market, which currently makes up about 65 to 70 percent of the market for GOES and made up 75 to 80 percent of the market in 2011. They indicate that because of aging transformers, there has been a small increase in the replacement market over the historical rate of 3 percent per year.4
Petitioners also indicated that increases in new energy generation can increase demand.5 Housing starts are the biggest driver for demand in the new transformer market for GOES.6 Japanese respondents indicated that the trend is not linear, as transformer demand is somewhat dependent on the location and type of housing being constructed.7 Seasonally adjusted housing starts increased by 42 percent between January 2011 and June 2014, (figure II-2). Housing starts, however, remain well below historic averages.8 Japanese respondents also indicated that utility capital investment correlates less closely with demand for GOES for new power transformers, and that three new power transformer manufacturers have opened plants in the U.S. market within the past few years, increasing demand. Capital expenditures by
3 Petition, p. 9. 4 Conference transcript, pp. 64-65 (Pfeiffer), pp. 65-66 (Polinski). Petitioners’ postconference brief,
Response to Commission staff questions, pp. 7-8. 5 Conference transcript, pp. 64-65 (Pfeiffer), pp. 65-66 (Polinski). Petitioners’ postconference brief,
Response to Commission staff questions, pp. 7-8. 6 Conference transcript, p. 63 (Pfeiffer), p. 168 (Suzuki). 7 Japanese producers’ postconference brief, Response to staff questions, pp. 9-10. 8 U.S. Census Bureau, New Residential Construction (updated August 6, 2014).
http://www.census.gov/construction/nrc/historical_data/

II-10
shareholder-owned electric utilities increased by just over 20 percent between 2010 and 2012. Capital expenditures were projected to increase a further 5 percent in 2013 and then decline by about 10 percent between 2013 and 2015.9
Figure II-2
Housing starts: Seasonally adjusted housing starts, monthly, January 2011-June 2014
Source: U.S. Census Bureau, New Residential Construction. http://www.census.gov/construction/nrc/historical_data/ (retrieved June 15, 2014).
Japanese respondents indicate that demand for GOES in the U.S. market is expected to increase with housing starts and commercial use both expected to be strong in the imminent future, new regulatory requirements fostering a shift to more efficient transformer design, and the ongoing shift in smaller transformer demand from NOES to GOES. They also expect demand outside the U.S. market to increase as in many countries the electrical grid is still being built.10 Petitioners indicate the higher efficiency requirements for new distribution transformers that take effect in 2016 will likely affect the relative use of types of GOES rather than substantially increase demand.11
9 NSSMC’s postconference brief, Response to staff questions, p. 10, NSSMC’s prehearing brief, exhibit
2, and staff calculations using data from the Edison Electric Institute in exhibit I. 10 Japanese producers’ postconference brief, pp. 8-9. 11 Petitioners’ postconference brief, p. 7.
II-11
Business cycles
Only one of two responding U.S. producers, four of 11 responding importers, and 10 of 17 responding purchasers indicated that the market was subject to either business cycles or distinct conditions of competition. Specifically, in response to the preliminary phase questionnaire *** indicated that the market for GOES is subject to seasonal demand fluctuations, as weather conditions (hot, dry weather and hurricanes) and increased construction activity in the summer and fall result in greater transformer demand. Several importers indicated that business cycles or conditions of competition have changed since 2011, citing increased capacity for GOES in China, ThyssenKrupp being put up for sale, and a large number of transformer producers moving to countries with lower prices for GOES. Several purchasers also indicated that demand is higher in the summer and during natural disasters and storm seasons.
No responding U.S. producers and only three of 16 responding importers indicated that their ability to supply the U.S. market changed since 2011 due to changes in regulations related to production of transformers. Seven of 20 responding purchasers indicated that their purchasing requirements changed due to changes in these regulations. The affected importers and purchasers indicated that demand has shifted toward high grade or low core loss materials.
Standards under the Energy Policy and Conservation Act ("EPCA") (42 U.S.C. § 6317(a)(2)), direct the DOE to adopt energy conservations standards for those distribution transformers for which standards would be technologically feasible and economically justified, and would result in energy savings.12 One responding producer and nine of 17 responding importers indicated that it is likely that the revised DOE efficiency requirements for distribution transformers, effective from 2016, will affect their sales in the U.S. market. Twelve of 20 responding purchasers also indicated that the revised requirement will affect their purchasing decisions. The affected firms expect there to be a further shift in demand toward higher grades of GOES with lower core losses. Importer *** is concerned about the availability of the higher-grades of GOES to meet the new efficiency standards.
Demand trends
Both producers and the majority of purchasers reported an increase in U.S. demand for GOES since 2011, while a majority of importers reported a decrease in demand (table II-3). Most firms reporting an increase in demand attributed the increase to the recovery in the economy or housing market, while most firms reporting a decline in demand cited the slowdown in the economy, housing sector, or the renewable energy sector. Allegheny Ludlum indicated that demand has increased slightly since 2011.13 Nippon indicated that there was a
12 NLMK Postconference Brief at Exhibit 1 (72 F.R. 58190, 58191 (October 12, 2007)). See also DOE’s
final rule, 78 F.R. 23336, April 18, 2013 (EDIS no. 540413) and DOE’s technical support document (EDIS no. 540412).
13 Hearing transcript, p. 34 (Polinski).

II-12
Table II-3
GOES: Firms’ responses regarding U.S. demand, by number of responding firms since 2011
Number of firms reporting
Item Increase No change Decrease Fluctuate
Demand in the United States U.S. producers 2 0 0 0
Importers 6 1 8 2
Purchasers 8 1 3 4
Demand outside the United States: U.S. producers *** *** *** ***
Importers 5 3 2 3
Purchasers 5 2 5 1
Source: Compiled from data submitted in response to Commission questionnaires.
sharp decline in demand for GOES in the past three or four years, but that now demand is increasing.14
Apparent consumption data show that, between 2011 and 2013, the quantity rose slightly while the value fell. Reasons for a small rise in quantity with a larger fall in value could include supply factors such as decreased raw material costs or increased supply in the U.S. market, but may also suggest that demand increased if demand for GOES is highly inelastic.
Substitute products
Both U.S. producers, seven of 16 importers, and five of 20 purchasers reported that there are substitutes for GOES including amorphous metal and NOES. While amorphous metal may be used in certain transformer applications, limited production and low GOES prices preclude amorphous metal from being a realistic substitute in the vast majority of applications.15 They also indicated that substitutability of NOES for GOES is limited to the low end of the GOES product spectrum because GOES shows magnetic behavior in one direction, while NOES has magnetic properties that are isotropic (multi-directional). Petitioners indicated the standard application for NOES is motors and generators that rotate and need multi-directional magnetization) while GOES is for transformers that require one direction of magnetization.16
Cost share
GOES accounts for a small share of the cost of power transformers, which is the primary end-use product in which it is used. Most importers and purchasers reported cost shares of 9 to 43 percent for power transformers. A couple of purchasers reported cost shares greater than
14 Hearing transcript, p. 173 (Yonezawa). 15 Petitioners’ postconference brief, pp. 7-8; hearing transcript, p. 215 (Woolfort). 16 Petitioners’ postconference brief, Response to Commission staff questions, pp. 8-9; see also
hearing transcript, p. 215 (Woolfort).

II-13
60 percent for laminations, which are an intermediate product used in producing power transformers.
SUBSTITUTABILITY ISSUES
The degree of substitution between domestic and imported GOES depends upon such factors as relative prices, quality (e.g., grade standards, reliability of supply, defect rates, etc.), and conditions of sale (e.g., price discounts/rebates, lead times between order and delivery dates, payment terms, product services, etc.). Based on available data, staff believes that there is moderate to high degree of substitutability between domestically produced GOES and GOES imported from subject sources.
Lead times
GOES is both produced-to-order and sold by inventory, depending on the supplier. ***. Seven importers produce *** percent of their sales to order, one importers make *** of their shipments from foreign inventory, and three importers make *** of their shipments from U.S. inventory.
U.S. producers’ lead times from inventory are typically *** days, but sometimes are up to *** days. Importers’ lead times from U.S. inventory range from *** days, and lead times from foreign inventory are about *** days. When they produce to order, U.S. producers’ lead times range from *** days, while most importers’ lead times range from *** days. One importer (***) reported a lead time for produced-to-order sales of *** days.
Knowledge of country sources
As shown in table II-4, most purchasers and their customers sometimes or never make purchasing decisions based on the producer or country of origin. Of the four purchasers that reported that they always make decisions based on the manufacturer, three firms cited quality or qualifications, and the other cited being under contract with the supplier.
Table II-4
GOES: Purchasing decisions based on producer and country of origin, by number of reporting firms
Purchaser/customer decision Always Usually Sometimes Never
Purchaser makes decision based on producer 4 3 7 8
Purchaser’s customers make decision based on producer 0 2 4 13
Purchaser makes decision based on country 0 2 5 13
Purchaser’s customers make decision based on country 0 1 10 9
Source: Compiled from data submitted in response to Commission questionnaires.
Factors affecting purchasing decisions
Available information indicates that purchasers consider a variety of factors when purchasing GOES. While quality, price, and availability were cited most frequently as being top
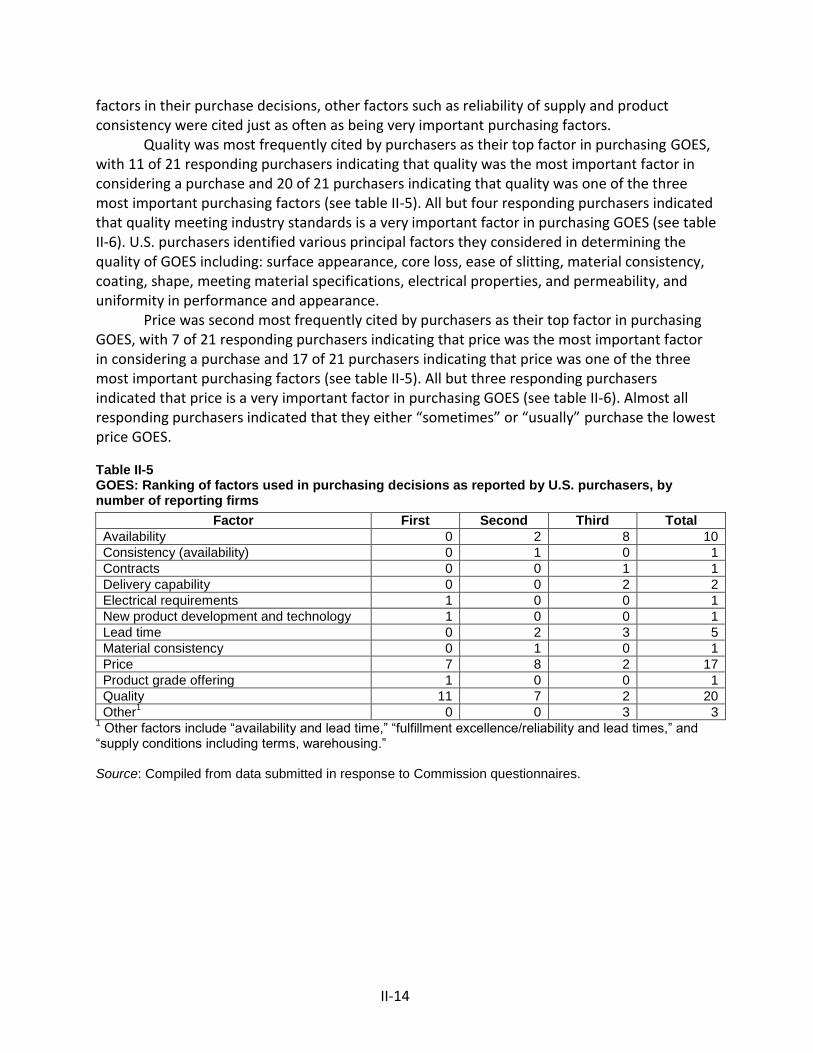
II-14
factors in their purchase decisions, other factors such as reliability of supply and product consistency were cited just as often as being very important purchasing factors.
Quality was most frequently cited by purchasers as their top factor in purchasing GOES, with 11 of 21 responding purchasers indicating that quality was the most important factor in considering a purchase and 20 of 21 purchasers indicating that quality was one of the three most important purchasing factors (see table II-5). All but four responding purchasers indicated that quality meeting industry standards is a very important factor in purchasing GOES (see table II-6). U.S. purchasers identified various principal factors they considered in determining the quality of GOES including: surface appearance, core loss, ease of slitting, material consistency, coating, shape, meeting material specifications, electrical properties, and permeability, and uniformity in performance and appearance.
Price was second most frequently cited by purchasers as their top factor in purchasing GOES, with 7 of 21 responding purchasers indicating that price was the most important factor in considering a purchase and 17 of 21 purchasers indicating that price was one of the three most important purchasing factors (see table II-5). All but three responding purchasers indicated that price is a very important factor in purchasing GOES (see table II-6). Almost all responding purchasers indicated that they either “sometimes” or “usually” purchase the lowest price GOES.
Table II-5 GOES: Ranking of factors used in purchasing decisions as reported by U.S. purchasers, by number of reporting firms
Factor First Second Third Total
Availability 0 2 8 10
Consistency (availability) 0 1 0 1
Contracts 0 0 1 1
Delivery capability 0 0 2 2
Electrical requirements 1 0 0 1
New product development and technology 1 0 0 1
Lead time 0 2 3 5
Material consistency 0 1 0 1
Price 7 8 2 17
Product grade offering 1 0 0 1
Quality 11 7 2 20
Other1 0 0 3 3
1 Other factors include “availability and lead time,” “fulfillment excellence/reliability and lead times,” and
“supply conditions including terms, warehousing.” Source: Compiled from data submitted in response to Commission questionnaires.

II-15
Table II-6 GOES: Importance of purchase factors, as reported by U.S. purchasers, by number of responding firms
Factor Very
important Somewhat important
Not important
Availability 21 0 0
Delivery terms 9 9 3
Delivery time 15 6 0
Discounts offered 5 12 3
Domain refined 7 7 7
Extension of credit 5 5 11
Heat-proof/laser-scribed domain refined 5 7 9
High permeability steel used 10 6 4
Minimum qty requirements 0 8 13
Packaging 2 17 2
Price 18 3 0
Product consistency 19 2 0
Product range 7 9 5
Quality exceeds industry standards 10 9 2
Quality meets industry standards 17 4 0
Reliability of supply 21 0 0
Technical support/service 10 8 2
U.S. transportation costs 7 13 1
Source: Compiled from data submitted in response to Commission questionnaires.
All responding purchasers indicated that availability and reliability of supply were very important factors in purchasing GOES, and all but two purchasers indicated that product consistency is a very important factor in purchasing GOES. More than one-half of responding purchasers indicated minimum quantity requirements and extension of credit were not an important factor in purchasing GOES. Approximately one-half of responding purchasers found that the use of high-permeability steel was a very important factor in their purchases of GOES, while less than one-half of purchasers found the need for domain-refined GOES, or heat-proof/laser-scribed to be a very important factor in their purchases.
When asked if they purchased GOES from one source although a comparable product was available at a lower price from another source, 16 of 22 purchasers reported reasons for the purchases to include higher quality, availability, and a diversified supplier base. Twelve of 21 purchasers reported that certain types of product were only available from a single source.
Petitioners indicated that since U.S.-produced and imported GOES are produced to ASTM or customer specifications, the most important factor for purchasers is price. They noted that transformer manufacturers can use either conventional or high-permeability GOES to construct a medium voltage distribution transformer, such as those outside of a home or attached to a pole.
Petitioners estimated that these transformers make up about 70 percent of the market for GOES. However, they indicated that the large voltage power transformers at utility
II-16
companies that make up about 25 percent of the market typically use high-permeability steels.17 They also reported that although this type of substitution is typically stepping up or down one grade, an extreme price change would allow substitution beyond one adjacent grade.18
Petitioners indicated that producers’ products need not be identical to be considered by purchasers for the same application, but only need to meet minimal criteria on key product characteristics such as core loss. They stated that the ability of transformer manufacturers to analyze price has resulted in importers offering product with higher specifications and efficiency ratings than the domestic product at a price that is not commensurate with the imported product’s higher quality.19 Petitioners also claim that a recent DOE study confirms that M-2 and M-3 grade GOES can be used interchangeably to achieve relevant efficiency standards, with only price operating to distinguish between the products.20 However, respondents claim that petitioners’ citing the DOE study to say that all grades of GOES is in a continuum is inaccurate since the study is only concerned with efficiency standards and not any other properties of transformers.21 ABB indicates that in addition to efficiency, it factors in impedances, noise, weight, and size into the type of GOES that is appropriate for a particular transformer.22
Chinese respondents indicated that GOES is not a typical commodity product, but a specialty, high value-added steel product with complex and wide-ranging chemical properties.23 Respondents reported that although there is some overlap in competition between the various types and grades of GOES, the overlap is limited. They indicated that conventional GOES cannot be used in high-efficiency, low core loss, transformer applications. Also, they noted that domain-refined GOES using a laser scribing process cannot be annealed and therefore cannot substitute for heat-proof domain-refined GOES using either an electrolytic-etching or mechanical scribing process. In addition, respondents indicate that DOE regulations make M4 and M6 grade GOES obsolete in the United States market.24 When comparing broad categories of conventional, domain-refined, and non-domain-refined GOES, U.S. producers reported that these different types of GOES were either frequently or sometimes interchangeable with each other, while most importers and purchasers indicated that they were either sometimes or never interchangeable or interchangeable in certain applications (see table II-7). *** indicated that its conventional
17 Conference transcript, pp. 22-23, 57-59 (Petersen), pp. 57-59 (Polinski). Petitioners estimated that
the remaining 5 percent of the market for GOES is made up of low-voltage transformers. Conference transcript, pp. 58-59 (Polinski).
18 Conference transcript, p. 91 (Petersen). 19 Petitioners’ postconference brief, pp. 9-10. 20 Petitioners’ posthearing brief, p. 14. 21 JFE respondents’ posthearing brief, pp. 12-13. 22 Hearing transcript, pp. 129, 186 (Woolfort). 23 Baosteel’s postconference brief, p. 1. 24 Conference transcript, pp. 145-147 (Becker). Baosteel postconference brief, p. 2. Japanese
producer’s postconference brief, pp. 7, 13, 35-36. NLMK postconference brief, p. 4.

II-17
material competes with other forms of GOES for many of its customers and the company believes they are interchangeable. Some firms indicated that in certain applications, conventional GOES could be interchanged with high-permeability non-domain-refined GOES and that in some applications, such as a large transformer with a stacked core, the heat-proof and non-heat-proof GOES could be interchangeable. However, non-heat-proof GOES would not be interchangeable with heat-proof GOES in wound transformer cores. Firms also indicated that there is a tradeoff between the grade and cost of the GOES used and transformer design.
Table II-7
GOES: Perceived interchangeability between different forms of GOES, by type pairs of GOES
Type pairs
Producers Importers Purchasers
A F S N C A F S N C A F S N C
Conventional vs. HP- non-domain refined 0 2 0 0 0 0 2 3 2 4 0 1 8 4 2
Conventional vs. HP-domain refined (laser-scribed/non-heat-proof)
*** 0 0 4 6 0 0 2 3 7 1
Conventional vs. HP-domain refined (mechanically or chemically scribed/ heat-proof) 0 2 0 0 0 0 0 3 7 0 0 2 4 6 1
HP-non-domain refined vs. HP-domain refined (laser-scribed/non-heat-proof)
*** 0 1 6 2 1 0 1 5 4 2
HP-Non-Domain refined vs. HP-Domain refined (Mechanically or chemically scribed/heat-proof) 0 2 0 0 0 0 0 3 3 4 0 1 5 4 2
HP-domain refined (laser-scribed/non-heat-proof) vs. HP-domain refined (mechanically or chemically scribed/heat-proof) 0 1 1 0 0 1 0 2 3 5 0 2 2 4 2
Note.—A=Always, F=Frequently, S=Sometimes, N=Never, C=Certain applications (the products are interchangeable only in certain applications). HP=High-permeability Source: Compiled from data submitted in response to Commission questionnaires.
Supplier certification
All but one responding purchaser require their suppliers of GOES to be or become certified. Purchasers reported that the time to qualify a new supplier ranged from 15 to 360 days (most require 100 to 180 days). Six purchasers reported that both domestic and foreign suppliers had failed in their attempts to qualify product, or that a supplier had lost its approved status since 2011. *** were each named by three purchasers as failing to qualify and *** were each named by one purchaser.
Importance of purchasing domestic product
Most purchasers reported that purchasing U.S.-produced product was not an important factor in their purchasing decisions. Over ninety percent of reported purchases had no domestic requirements and only four percent were required by law to be domestic purchases. The bulk of these purchases were by *** for which *** percent of its purchases are required by law to be U.S.-produced product.

II-18
Comparisons of domestic products, subject imports, and nonsubject imports
At least one-half of purchasers reported that U.S. and subject product were comparable in terms of availability, discounts offered, extension of credit, minimum quantity requirements, and packaging (see table II-8). Both U.S. producers indicated imports from all subject and nonsubject countries are “always” interchangeable and that U.S.-produced GOES and that GOES imported from all subject and nonsubject countries is “always” interchangeable (see table II-9). At least two-thirds of responding importers and purchasers indicated that GOES imported from all subject countries is either “frequently” or “sometimes” interchangeable with U.S.-produced GOES. At least one-half of responding importers indicated that GOES imported from all subject countries is either “frequently” or “sometimes” interchangeable with GOES imported from other subject countries and nonsubject countries and that U.S.-produced GOES is either “frequently” or “sometimes” interchangeable with GOES imported from nonsubject countries.
Table II-8
GOES: Purchasers’ comparisons between U.S.-produced and imported product1
Factor
Number of firms reporting
U.S. vs. China U.S. vs. Czech
Republic U.S. vs.
Germany U.S. vs. Japan
S C I S C I S C I S C I
Availability 2 4 2 2 4 0 1 5 2 3 11 1
Delivery terms 1 5 1 2 2 1 0 6 1 3 12 2
Delivery time 3 3 2 5 1 0 3 2 2 7 8 0
Discounts offered 0 4 2 1 1 0 1 3 1 2 11 2
Domain refined 0 4 1 3 0 0 1 4 0 2 8 5
Extension of credit 1 5 0 2 2 0 1 5 0 1 11 3
Heat-proof/laser-scribed domain refined 1 1 1 1 0 0 2 1 0 2 7 5
High permeability steel used 1 3 1 2 0 0 2 1 1 1 8 6
Minimum qty requirements 0 8 0 1 3 0 0 5 1 1 13 2
Packaging 2 6 0 1 4 0 1 6 0 2 13 0
Price 1 3 4 1 4 1 1 6 2 3 7 5
Product consistency 0 6 0 2 1 0 0 1 4 0 9 6
Product range 1 3 3 3 1 0 1 4 1 1 9 6
Quality exceeds industry standards 1 6 0 2 1 0 2 1 3 2 9 5
Quality meets industry standards 1 6 0 2 0 0 0 3 3 2 9 4
Reliability of supply 3 4 2 2 1 0 2 2 2 2 11 3
Technical support/service 1 6 1 2 2 0 2 2 1 4 7 5
U.S. transportation costs 2 6 0 4 0 0 1 5 0 5 10 0
Table continued.

II-19
Table II-8-Continued
GOES: Purchasers’ comparisons between U.S.-produced and imported product1
Factor
Number of firms reporting
U.S. vs. Korea
U.S. vs. Poland
U.S. vs. Russia
U.S. vs. all other
S C I S C I S C I S C I
Availability 1 3 0 1 4 1 2 5 0 1 3 0
Delivery terms 1 3 0 1 4 1 1 3 1 0 3 1
Delivery time 2 2 0 3 0 3 3 3 0 0 3 1
Discounts offered 1 2 0 0 3 1 0 2 1 0 3 1
Domain refined 0 2 1 3 0 1 4 1 0 1 0 1
Extension of credit 2 3 0 1 5 1 0 3 2 0 3 0
Heat-proof/laser-scribed domain refined 0 1 1 1 0 1 3 2 0 1 0 1
High permeability steel used 0 2 2 2 0 1 3 1 0 1 0 1
Minimum qty requirements 0 5 0 0 5 1 1 3 1 1 2 1
Packaging 0 4 0 1 5 0 1 4 0 0 3 0
Price 1 2 1 1 2 3 0 2 5 0 2 1
Product consistency 0 3 1 1 4 1 1 4 0 0 1 1
Product range 0 2 1 3 0 2 4 1 0 1 1 1
Quality exceeds industry standards 0 4 0 1 4 1 2 3 0 0 3 0
Quality meets industry standards 0 4 0 0 3 1 0 4 0 0 2 1
Reliability of supply 0 4 0 1 4 1 1 3 1 0 3 0
Technical support/service 1 2 0 1 4 1 3 1 1 0 2 1
U.S. transportation costs 3 1 0 3 2 1 3 2 0 0 2 1 1 A rating of superior means that price/U.S. transportation costs is generally lower. For example, if a firm
reported “U.S. superior,” it meant that the U.S. product was generally priced lower than the imported product. Note.-- S=first listed country’s product is superior; C=both countries’ products are comparable; I=first list country’s product is inferior. Source: Compiled from data submitted in response to Commission questionnaires.

II-20
Table II-9
GOES: Perceived interchangeability between GOES produced in the United States and in other countries, by country pairs
Country pair
U.S. producers U.S. importers U.S. purchasers
A F S N A F S N A F S N
United States vs. China 2 0 0 0 1 2 4 0 2 0 6 0
United States vs. Czech Republic 2 0 0 0 1 1 1 0 1 2 2 0
United States vs. Germany 2 0 0 0 1 5 3 0 1 5 4 0
United States vs. Japan 2 0 0 0 1 2 7 1 2 7 6 0
United States vs. Korea 2 0 0 0 0 2 4 0 1 3 4 0
United States vs. Poland 2 0 0 0 2 3 2 0 2 3 3 0
United States vs. Russia 2 0 0 0 0 3 2 0 2 2 4 0
China vs. Czech Republic 2 0 0 0 0 2 1 0 1 2 0 0
China vs. Germany 2 0 0 0 2 1 1 0 3 1 0 0
China vs. Japan 2 0 0 0 1 1 4 0 2 1 2 0
China vs. Korea 2 0 0 0 1 2 1 0 2 1 1 0
China vs. Poland 2 0 0 0 1 2 1 0 2 1 1 0
China vs. Russia 2 0 0 0 0 2 1 0 2 1 1 0
Czech Republic vs. Germany 2 0 0 0 0 2 1 0 2 1 1 0
Czech Republic vs. Japan 2 0 0 0 1 1 2 0 2 1 1 0
Czech Republic vs. Korea 2 0 0 0 0 2 1 0 1 1 1 0
Czech Republic vs. Poland 2 0 0 0 1 1 1 0 3 1 0 0
Czech Republic vs. Russia 2 0 0 0 0 2 1 0 3 1 0 0
Germany vs. Japan 2 0 0 0 1 1 3 0 2 2 1 0
Germany vs. Korea 2 0 0 0 1 1 2 0 2 1 0 0
Germany vs. Poland 2 0 0 0 1 2 1 0 2 1 1 0
Germany vs. Russia 2 0 0 0 0 2 1 0 2 1 1 0
Japan vs. Korea 2 0 0 0 0 1 3 0 1 2 3 0
Japan vs. Poland 2 0 0 0 1 2 2 0 2 2 2 0
Japan vs. Russia 2 0 0 0 0 1 2 0 2 1 2 0
Korea vs. Poland 2 0 0 0 0 2 1 0 2 1 1 0
Korea vs. Russia 2 0 0 0 0 2 1 0 2 1 1 0
Poland vs. Russia 2 0 0 0 1 1 1 0 3 1 0 0
United States vs. Other 2 0 0 0 2 1 1 0 2 2 1 0
China vs. Other 2 0 0 0 0 1 1 0 2 1 0 0
Czech Republic vs. Other 2 0 0 0 1 0 1 0 1 0 0 0
Germany vs. Other 2 0 0 0 1 0 1 0 1 0 0 0
Japan vs. Other 2 0 0 0 0 0 2 0 2 0 1 0
Korea vs. Other 2 0 0 0 0 1 1 0 1 0 0 0
Poland vs. Other 2 0 0 0 1 1 1 0 1 1 0 0
Russia vs. Other 2 0 0 0 1 0 1 0 1 1 0 0
Note.—A=Always, F=Frequently, S=Sometimes, N=Never. Source: Compiled from data submitted in response to Commission questionnaires.

II-21
Importers cited limitations with interchangeability such as Japanese steel having a lower performance variability in steel quality characteristics; high-permeability steel available in in 0.20mm and 0.18mm widths only being available from Japanese producers; *** grade that is not produced by U.S. producers; U.S. producers not being able to match the performance quality of Japanese-produced steel; GOES with a width of 0.10mm or thinner that is produced by Japanese producers, but not U.S. producers; mechanical-scribed domain-refined GOES which is not interchangeable with laser-scribed product produced by U.S. producers; and Japan, Korea, China, and Germany producing the highest grade of laser-scribed domain-refined GOES. Two purchasers reported having disqualified U.S. producers as a limit for interchangeability.
Both U.S. producers indicated that differences other than price between imports from all subject and nonsubject countries and U.S.-produced GOES were “never” significant and that these differences were “never” significant between GOES imported from all subject and nonsubject countries (see table II-10). Most responding importers and purchasers indicated that differences other than price between GOES imported from all subject and nonsubject countries and U.S.-produced GOES were at least “sometimes” significant and that these differences were at least “sometimes” significant between GOES imported from subject and nonsubject countries.
Petitioners contend that all GOES products cited in the responses to the U.S. importers’ questionnaire in the preliminary phase of these investigations as not being interchangeable are generally interchangeable with other GOES products. They also indicated that the many different grades of GOES are capable of meeting the new DOE efficiency standards including conventional, high-permeability, and heat-proof domain-refined.25
25 Petitioners’ postconference brief, Response to Commission staff questions, p. 10.

II-22
Table II-10
GOES: Significance of differences other than price between GOES produced in the United States and in other countries, by country pairs
Country pair
U.S. producers U.S. importers U.S. purchasers
A F S N A F S N A F S N
United States vs. China 0 0 0 2 2 1 3 0 3 1 3 0
United States vs. Czech Republic 0 0 0 2 2 0 3 0 2 0 3 1
United States vs. Germany 0 0 0 2 2 2 2 0 2 1 4 2
United States vs. Japan 0 0 0 2 4 3 2 0 6 1 3 1
United States vs. Korea 0 0 0 2 2 0 2 0 2 0 4 1
United States vs. Poland 0 0 0 2 3 0 3 1 2 0 3 2
United States vs. Russia 0 0 0 2 2 0 2 2 3 2 1 1
China vs. Czech Republic 0 0 0 2 1 0 1 0 1 0 1 0
China vs. Germany 0 0 0 2 1 0 1 1 1 0 1 1
China vs. Japan 0 0 0 2 2 0 1 0 2 0 2 0
China vs. Korea 0 0 0 2 1 0 1 1 1 0 3 0
China vs. Poland 0 0 0 2 1 0 2 0 1 0 1 1
China vs. Russia 0 0 0 2 1 0 2 0 1 0 2 0
Czech Republic vs. Germany 0 0 0 2 1 0 1 1 1 0 1 1
Czech Republic vs. Japan 0 0 0 2 2 0 1 0 1 0 1 0
Czech Republic vs. Korea 0 0 0 2 1 0 1 0 1 0 1 0
Czech Republic vs. Poland 0 0 0 2 1 0 1 0 1 0 1 1
Czech Republic vs. Russia 0 0 0 2 1 0 1 1 1 0 1 0
Germany vs. Japan 0 0 0 2 2 0 2 0 1 1 2 0
Germany vs. Korea 0 0 0 2 1 0 1 0 1 0 1 0
Germany vs. Poland 0 0 0 2 1 0 2 0 1 0 2 1
Germany vs. Russia 0 0 0 2 1 0 2 0 1 0 1 0
Japan vs. Korea 0 0 0 2 2 0 1 0 1 0 3 0
Japan vs. Poland 0 0 0 2 2 0 2 0 1 0 3 1
Japan vs. Russia 0 0 0 2 2 0 1 0 2 0 2 0
Korea vs. Poland 0 0 0 2 1 0 1 0 1 0 1 1
Korea vs. Russia 0 0 0 2 1 0 1 0 1 0 2 0
Poland vs. Russia 0 0 0 2 1 0 1 1 1 0 1 0
United States vs. Other 0 0 0 2 2 0 2 0 3 0 2 1
China vs. Other 0 0 0 2 1 0 0 0 1 0 1 1
Czech Republic vs. Other 0 0 0 2 1 0 0 0 1 0 0 0
Germany vs. Other 0 0 0 2 1 0 1 0 1 0 1 0
Japan vs. Other 0 0 0 2 2 0 1 0 1 0 2 0
Korea vs. Other 0 0 0 2 1 0 0 0 1 0 0 0
Poland vs. Other 0 0 0 2 1 0 1 0 1 0 1 0
Russia vs. Other 0 0 0 2 1 0 0 0 1 0 0 1
Note.--A = Always, F = Frequently, S = Sometimes, N = Never. Source: Compiled from data submitted in response to Commission questionnaires.

II-23
Japanese respondents indicate imports from Japan consist *** of heat-proofed domain-refined GOES that is not substitutable with U.S.-produced GOES. They indicate that domain-refined GOES imported from Japan use either an electrolytic etching process (JFE) or a mechanical scribing process (NSSMC), while domain-refined GOES produced by the only U.S. producer of domain-refined GOES (AK Steel) uses a laser scribing process that cannot be annealed. They indicate that because post-winding annealing creates a stronger and more efficient transformer, certain transformer manufacturers have developed specialized wound transformer designs based exclusively on heat-proof domain-refined GOES imported from Japan.26 Japanese respondents also indicate that U.S. producers serve a majority of the GOES market for distribution transformers but not the segment with the very high-efficiency design requirements.27
Russian respondents indicate that the conventional grades of GOES produced in Russia cannot compete with the higher grades required under DOE regulations for transformer production. They indicate that the regulations make M4 and M6 obsolete in the United States market and eliminated NLMK’s sales to the United States. Russian respondents also indicate that NLMK can make an M3 grade of GOES, but its standards are not high enough to be used in most transformers.28
Extensive data regarding the production of high-permeability and conventional GOES are presented in Parts III and VII of this report. Detailed shipment data, by grade, are presented in Parts III and IV.
ELASTICITY ESTIMATES
This section discusses elasticity estimates; parties were encouraged to comment on these estimates in their briefs.
U.S. supply elasticity
The domestic supply elasticity29 for GOES measures the sensitivity of the quantity supplied by U.S. producers to changes in the U.S. market price of GOES. The elasticity of domestic supply depends on several factors including the level of excess capacity, the ease with which producers can alter capacity, producers’ ability to shift to production of other products, the existence of inventories, and the availability of alternate markets for U.S.-produced GOES. Analysis of these factors earlier indicates that the U.S. industry has the ability to greatly increase or decrease shipments to the U.S. market; an estimate in the range of 6 to 10 is suggested.
26 Japanese producers’ postconference brief, pp. 7, 13, 35-36. 27 Japanese producers’ postconference brief, Response to staff questions pp. 1-2. 28 NLMK postconference brief, pp. 4, 12. 29 A supply function is not defined in the case of a non-competitive market.
II-24
U.S. demand elasticity
The U.S. demand elasticity for GOES measures the sensitivity of the overall quantity demanded to a change in the U.S. market price of GOES. This estimate depends on factors discussed earlier such as the existence, availability, and commercial viability of substitute products, as well as the component share of the GOES in the production of any downstream products. Nippon indicated that demand for GOES is inelastic.30 Based on the available information, the aggregate demand for GOES is likely to be inelastic; a range of -0.25 to -0.75 is suggested.
Substitution elasticity
The elasticity of substitution depends upon the extent of product differentiation between the domestic and imported products.31 Product differentiation, in turn, depends upon such factors as quality (e.g., chemistry, appearance, etc.) and conditions of sale (e.g., availability, sales terms/ discounts/ promotions, etc.). Based on available information, the elasticity of substitution between U.S.-produced GOES and imported GOES is likely to be in the range of 3 to 5.
30 Nippon’s posthearing brief, p. 3. 31 The substitution elasticity measures the responsiveness of the relative U.S. consumption levels of
the subject imports and the domestic like products to changes in their relative prices. This reflects how easily purchasers switch from the U.S. product to the subject products (or vice versa) when prices change.

III-1
PART III: U.S. PRODUCERS’ PRODUCTION, SHIPMENTS, AND EMPLOYMENT
The Commission analyzes a number of factors in making injury determinations (see 19 U.S.C. §§ 1677(7)(B) and 1677(7)(C)). Information on the subsidies and/or dumping margins was presented in Part I of this report and information on the volume and pricing of imports of the subject merchandise is presented in Part IV and Part V. Information on the other factors specified is presented in this section and/or Part VI and (except as noted) is based on the questionnaire responses of two firms that accounted for all U.S. production of GOES during 2013.
U.S. PRODUCERS
The Commission issued a U.S. producer questionnaire to the two petitioning firms: AK Steel and Allegheny. Both firms provided useable data on their production operations. Staff believes that these responses represent all U.S. production of GOES. Table III-1 lists U.S. producers of GOES, their production locations, positions on the petition, total production, and shares of total production.
Table III-1 GOES: U.S. producers of GOES, their positions on the petition, production locations, and shares of reported production, 2013
Firm Position on
orders U.S. production locations
Share of 2013 production (percent)
AK Steel1
Petitioner
Butler, Pennsylvania Zanesville, Ohio West Chester, Ohio ***
Allegheny Ludlum2
Petitioner Brackenridge, Pennsylvania Leechburg, Pennsylvania ***
Total
100.0 1 AK Steel is wholly owned by AK Steel Holding Corp. (West Chester, Ohio). Through its wholly-owned
subsidiary, Advanced Materials Processing, Inc., AK Steel owns a ***-percent interest in Vicksmetal Armco Associates (Indiana and Mississippi), which provides slitting services for GOES. ***-percent interest is owned by Japanese GOES producer Nippon. 2 Allegheny Ludlum is wholly owned by Allegheny Technologies Inc. (Pittsburgh, Pennsylvania).
Source: Compiled from data submitted in response to Commission questionnaires.
AK Steel is the larger of the two domestic producers, accounting for *** percent of total 2013 domestic production of GOES. Neither U.S. producer directly imports the subject merchandise or purchases the subject merchandise from U.S. importers. In addition, both U.S. producers indicated in their questionnaire responses that they were not related to any foreign producers of the subject merchandise or any U.S. importers of the subject merchandise. However, Japanese GOES producer Nippon Steel & Sumitomo Metal Corp. (“Nippon”) operates two GOES service centers in the United States through Vicksmetal Armco Associates, a *** joint-venture operation owned by Japanese producer Nippon and domestic producer AK Steel.

III-2
Vicksmetal Armco Associates is a slitter of master coils of electrical steel with two facilities in the United States, one in Indiana and the other in Mississippi.1
In the Commission’s questionnaire, U.S. producers were asked if they experienced any plant openings, plant closings, relocations, expansions, acquisitions, consolidations, prolonged shutdowns or production curtailments, or revised labor agreements since January 1, 2011. Table III-2 summarizes the domestic producers’ responses regarding such industry changes.
Table III-2
GOES: U.S. producers’ changes in operations since 2011
* * * * * * *
In January 2013, Big River Steel LLC (“BRS”) venture announced plans for a $1.1 billion greenfield mini-mill, to be located in Osceola, Arkansas (in Mississippi County, in the northeast corner of the state), for manufacturing high-end steel mill products for the automotive, oil and gas, and electrical energy industries.2 This proposed facility reportedly will have an annual production capacity of 1.7 million short tons and the ability to roll coils up to 76–78” wide and 1” thick.3 The Arkansas Pollution Control and Ecology Commission upheld a court ruling granting an air-quality permit to the BRS venture in April 2014,4 groundbreaking and site work commenced in mid-late July 2014,5 and melting of steel is reportedly anticipated by July 2016.6 In anticipation of solid demand for electrical steels by the automotive and electric-power transformer markets,7 BRS initially plans to manufacture motor lamination steels and some NOES, with suitable equipment to be added later, during “Phase II of BRS development,” to manufacture fully processed NOES and GOES, but without specifying the time frame for any further developments.8 9
1 Conference transcript, pp. 105 and 155 (Saito). 2 Carter, Mark, and Lance Turner, “Big River Steel Announces $1.1B Mill for Osceola, Will Employ
525,”Arkansas Business, January 29, 2013. 3 Metal Bulletin, “Spotlight: Nucor Objects to Correnti’s $1.1bn Big River Steel Mill in Arkansas,”
March 19, 2013. 4 American Metal Market, “Big River Steel Clears Big Hurdle with Arkansas Permit,” May 31, 2014. 5 American Metal Market, “Big River Steel Breaks Ground for Ark. Mill,” August 4, 2014. 6 American Metal Market, “Big River Steel Clears Big Hurdle with Arkansas Permit,” May 31, 2014. 7 Cowden, Michael, “US Market has Room for Big River Steel: Correnti,” American Metal Market,
April 28, 2014. 8 BRS, “Electrical Steels,” found at http://wwwbigriversteel.com/project/electrical-steels, retrieved
June 23, 2014. 9 Petitioners’ witnesses noted that Phase-II production of electrical steels at BRS would still be years
away, as capital has not yet reportedly been allocated to electrical steel production. Hearing transcript, pp. 78‒79 (Petersen) and pp. 79‒80 (Polinski).
(continued...)

III-3
U.S. PRODUCTION, CAPACITY, AND CAPACITY UTILIZATION
GOES
Table III-3 presents U.S. producers’ production, capacity, and capacity utilization. Total annual capacity to produce GOES in the United States, which was based on operating *** hours per week and *** weeks per year, has remained unchanged at *** short tons since 2011. GOES production fell from 2011 to 2013 by *** percent, consistent with trends in exports. GOES production in January-March 2014 was *** percent higher than in January-March 2013. Both domestic producers experienced similar trends in GOES production. Capacity utilization decreased from *** percent in 2011 to *** percent in 2013, consistent with the decline in production. Capacity utilization was higher at *** percent in January-March 2014 as compared with *** percent during January-March 2013, reflecting a higher level of production in the first quarter of 2014 than in the first quarter of 2013.
Table III-3
GOES: U.S. producers’ production, capacity, and capacity utilization, 2011-13, January-March 2013, and January-March 2014
* * * * * * *
Overall capacity and production
Domestic producers were asked to provide data on the overall capacity and production in their GOES facilities, by type of item produced. AK Steel reported that, in addition to producing high-permeability GOES (including domain-refined, laser-scribed/non-heat-proof and
(…continued)
More specifically, the petitioners claim that BRS will have no impact on the domestic supply of GOES in the U.S. market in the foreseeable future. On July 1, 2014, BRS completed the financing portion of the project to move forward with its planned $1.3-billion steel mill. Groundbreaking and site work commenced in mid-late July 2014 and construction is expected to take at least two years to complete within three phases. The mill will not be completed until July 2016, at the earliest, and will take even longer before it is capable of producing in commercial quantities. Construction may be further delayed due to continued legal action by Nucor Corporation (“Nucor”) in an attempt to prevent the BRS facility from being built, contingent on the air quality permit. Petitioners’ posthearing brief, exhibit 1 (“Answers to Commissioners’ Questions,” pp. 86‒88) and exhibit 15.
Nucor, with two existing steel mills in the same Arkansas county where the BRS mill will be located, expressed several objections to the BRS project regarding potential for an over-supplied steel market; increased competition for raw materials, energy, and transportation services; reduced operating rate; and shifting of jobs out of the state. For more details, see: Metal Bulletin, “Spotlight: Nucor Objects to Correnti’s $1.1bn Big River Steel Mill in Arkansas,” March 19, 2013; Brock, Roby, “Nucor Officials Push Back Against Big River Steel Mill,” The City Wire, March 21, 2013; SEMO News Service, “Steel Wars, Nucor Files New Suit Against Big River Steel,” Sikeston Standard Democrat, August 12, 2014.

III-4
non-domain-refined) and conventional GOES, it also produces NOES ***. Allegheny Ludlum reported that it currently produces only conventional GOES in commercial quantities at its GOES facilities, but it noted that it is in the process of expanding its product mix to include high-permeability GOES and has successfully produced and shipped high-permeability GOES in trial orders to select customers.10 11 Neither U.S. producer reported the production of domain-refined, high-permeability GOES that is mechanically or chemically scribed (i.e., heat-proof).
Table III-4 presents the domestic industry’s overall U.S. capacity, production, and capacity utilization of NOES and the different varieties of GOES. Production of NOES increased as a share of total production from *** percent in 2011 to *** percent in 2013. *** accounted for *** percent of total plant production in January-March 2013 and *** percent in January-March 2014. Conventional GOES accounted for *** percent of total overall plant production in the United States during 2013, whereas high-permeability GOES (*** of which was domain-refined, laser-scribed/non-heat-proof) accounted for *** percent of overall production.
Table III-4
GOES: U.S. producers’ overall capacity, production, and capacity utilization, by type, 2011-13, January-March 2013, and January-March 2014
* * * * * * *
Producers were asked to describe the constraint(s) that set the limit(s) of their production capacity. AK Steel reported that its overall GOES production capacity ***. Allegheny Ludlum reported in its questionnaire response that “***.”
Producers were asked about their ability to switch production (capacity) between GOES and other products using the same equipment and/or labor. AK Steel, which reported the production of GOES and NOES ***. Allegheny Ludlum, which reported only the production of conventional GOES in its facilities that produce GOES, responded ***.
Toll production
Allegheny Ludlum reported ***. *** specializes in ***.12 *** involves *** and is limited to ***.
10 Conference transcript, p. 27 (Polinski). Specifically, Allegheny Ludlum melted approximately *** in ***. It processed ***. In ***, Allegheny Ludlum *** shipped *** GOES to *** customers, ***. The ***. Email from ***, June 30, 2014.
11 A representative of Allegheny Ludlum testified that it is very interested in making significant additional capital investments necessary to begin producing high-permeability GOES in commercial quantities in order to be able to compete and succeed in the future but currently cannot justify these expenditures due to low prices in the U.S. market. Hearing transcript, p. 28 (Polinski).
12 ***.

III-5
Order book projections
Both U.S. producers reported maintaining order books of projected future shipments of GOES. The firms were asked to describe when projected orders are entered into the order book, whether such projections are subject to change at later dates, and how far in advance customers typically provide projected order quantities. AK Steel simply responded that the quantities it reported are *** and are, therefore, subject to change. Allegheny Ludlum noted the following in its questionnaire response: “***.”
The U.S. producers’ expected production of GOES based on their order books for April-June 2014, July-September 2014, and October-December 2014 are presented in table III-5, by firm. Based on these projections, estimated domestic GOES production for calendar year 2014 (*** short tons) would be *** percent lower than the firms’ reported production for calendar year 2013.
Table III-5
GOES: U.S. producers’ expected production based on order books, by firm, April-June 2014, July-September 2014, and October-December 2014
* * * * * * *
U.S. PRODUCERS’ U.S. SHIPMENTS AND EXPORTS
Table III-6 presents U.S. producers’ U.S. shipments, export shipments, and total shipments. Neither U.S. GOES producer reported internal consumption or transfers of GOES to related firms in the United States.13 Since 2011, U.S. producers’ U.S. commercial shipments have accounted for a growing share of total shipments. U.S. shipments accounted for *** percent of total shipments in 2013, compared with *** percent in 2011. During January-March 2014, U.S. shipments accounted for *** percent of total shipments. U.S. producers’ exports accounted for *** percent of total shipments in 2013, compared with *** percent in 2011. During January-March 2014, exports accounted for *** percent of total shipments.
Table III-6
GOES: U.S. producers’ U.S. shipments, exports shipments, and total shipments, 2011-13, January-March 2013, and January-March 2014
* * * * * * *
13 As discussed in greater detail in Part VI of this report, ***. E-mail from ***, October 24, 2013.

III-6
The quantity of U.S. producers’ U.S. shipments of GOES fell by *** percent from 2011 to 2012, but increased by *** percent in 2013 to a level that was *** percent higher than reported in 2011. U.S. shipments were *** percent higher in January-March 2014 than in January-March 2013. Average unit values of U.S. shipments decreased in each consecutive reporting period, declining by *** percent during 2011-13, and were *** percent lower in January-March 2014 than in January-March 2013.
The quantity of U.S. producers’ exports of GOES declined by *** percent from 2011 to 2013 and was *** percent lower in January-March 2014 than in January-March 2013. Average unit values of exports, which were below the average unit values of U.S. shipments in every period, decreased by *** percent during 2011-13, but were *** percent higher in January-March 2014 than in January-March 2013. AK Steel, which accounted for *** of U.S. producers’ exports of GOES during 2013, indicated that ***. AK Steel noted that, although *** would partially explain the lower export average unit values as compare with U.S. average unit values, “***.”14
The aggregate export trend reflects in large part the experience of ***. AK Steel’s exports accounted for *** percent of its total shipments during 2011, *** percent in 2013, and *** percent in January-March 2014.15 By comparison, Allegheny Ludlum’s exports accounted for *** percent of its total GOES shipments during 2011, *** percent in 2013, and *** percent during January-March 2014. AK Steel’s export markets include: ***. Allegheny Ludlum’s export markets include: ***. According to the petitioners, the *** in AK Steel’s U.S. exports resulted from depressed global GOES prices. ***.16
On June 30, 2014, the European Steel Association filed an antidumping duty petition with the European Commission on behalf of EU producers of GOES. The notice of initiation published on August 14, 2014 noted that the product subject to the investigation is GOES of a thickness of more than 0.16 mm imported from China, Japan, Korea, Russia and the United States.17
Tables III-7, III-8, and III-9 present U.S. producers’ U.S. shipments, export shipments, and total shipments, by types of GOES. These data show that conventional GOES account for the *** majority (*** percent in 2013) of U.S. producers’ U.S. shipments, *** of which (*** percent in 2013) were of grades M3, M4, and M6. High-permeability domain-refined GOES (*** laser-scribed/non-heat-proof) accounted for *** percent of U.S. producers’ U.S. shipments in 2013, whereas high-permeability non-domain-refined GOES accounted for only *** percent. As a share of U.S. producers’ exports in 2013, conventional GOES accounted for *** percent, *** of which (*** percent in 2013) were of grade M3. High-permeability domain-refined GOES (***
14 Email from ***, August 13, 2014. 15 AK Steel explained that its “***.” Email from ***, November 6, 2013. 16 Petitioners’ posthearing brief, exhibit 1, pp. 2 and 84-85. 17 Notice of initiation of an anti-dumping proceeding concerning imports of grain-oriented flat-rolled
products of silicon-electrical steel originating in the People’s Republic of China, Japan, the Republic of Korea, Russia and the United States of America. Official Journal of the European Union, August 14, 2014.

III-7
laser-scribed/non-heat-proof) accounted for *** percent of U.S. producers’ exports in 2013, and high-permeability non-domain-refined GOES accounted for *** percent.
Table III-7
GOES: U.S. producers’ U.S. shipments, by type of GOES, 2011-13, January-March 2013, and January-March 2014
* * * * * * *
Table III-8
GOES: U.S. producers’ export shipments, by type of GOES, 2011-13, January-March 2013, and January-March 2014
* * * * * * *
Table III-9
GOES: U.S. producers’ total shipments (U.S. and export shipments), by type of GOES, 2011-13, January-March 2013, and January-March 2014
* * * * * * *
Respondent JFE argued that ***.18 In its questionnaires in these final phase investigations, the Commission requested specific U.S. shipment data from the U.S. producers to address this issue. Table III-10 presents U.S. producers’ U.S. shipments to Howard Industries and all other customers combined. These data show that Howard Industries, which *** in 2011, was ***. Howard Industries accounted for *** during 2013.19
Table III-10
GOES: U.S. producers’ U.S. shipments to Howard Industries and all other customers combined, by U.S. producer, 2011-13, January-March 2013, and January-March 2014
* * * * * * *
The Commission asked U.S. producers to describe the factors surrounding their firm’s pattern of shipments to Howard Industries since January 1, 2011. AK Steel responded, “***.” Allegheny Ludlum simply responded, “***.” ***.
18 JFE Comments on Draft Questionnaires, May 8, 2014, Comment 4. 19 In its response to the ***.
III-8
Allegheny explained at the Commission’s hearing that, in March 2008, Allegheny Ludlum concluded a four-year agreement with Howard Industries for the supply of GOES from January 1, 2009 through the end of 2012, which specified volume and price commitments and covered the vast majority of Howard Industries’ GOES supplies for distribution transformers.20 The negotiated prices were “reflective of market conditions at the time of the negotiations in 2008, a period of relatively healthy demand for GOES. . .”21 Allegheny testified that “shortly after {the agreement} came into effect, Howard Industries requested that we renegotiate the agreement. We tried to accommodate Howard, but were not able to come to a mutual agreement. As a result, there was litigation between our companies over the long-term contract.”22 On July 26, 2010, the U.S. District Court for the Western District of Pennsylvania found in favor of Allegheny Ludlum, concluding that Howard Industries had no right under the contract to cancel it. Therefore, Allegheny Ludlum’s pricing with Howard Industries ***.23
The Commission also asked U.S. producers to indicate whether any of their major customers (other than Howard Industries) significantly altered their purchases of GOES. AK Steel responded, “***.”24 Allegheny Ludlum responded, “***.”25
U.S. PRODUCERS’ INVENTORIES
Table III-11 presents U.S. producers’ end-of-period inventories and the ratio of these inventories to U.S. producers’ production, U.S. shipments, and total shipments. Producers’ inventories decreased from 2011 to 2013. Inventories were at their lowest in March 2014, a level that was *** percent lower than that reported in March 2013.26 While absolute inventory levels decreased in each consecutive reporting period, end-of-period inventories relative to production and total shipments were generally stable, with the exception of January to March 2013.
Table III-11
GOES: U.S. producers’ end-of-period inventories, 2011-13, January-March 2013, and January-March 2014
* * * * * * *
20 Hearing transcript, p. 30 (Polinski). 21 Petitioners’ posthearing brief, exhibit 1, p. 44. 22 Hearing transcript, p. 30 (Polinski). Additionally, Howard Industries ***. See petitioners’
posthearing brief, p. 13. 23 Petitioners’ posthearing brief, exhibit 1, pp. 45-46. 24 In its response to the ***. 25 In its ***. 26 *** accounted for *** percent of the aggregate inventories held.

III-9
U.S. PRODUCERS’ IMPORTS AND PURCHASES
Neither U.S. producer reported direct imports or purchases of GOES during 2011-13, January-March 2013, or January-March 2014.
U.S. EMPLOYMENT, WAGES, AND PRODUCTIVITY
Table III-12 shows U.S. producers’ employment-related data for GOES. Both AK Steel and Allegheny Ludlum exhibited similar overall trends in the employment indicators reported. In the aggregate, U.S. producers reported a decline in the number of production and related workers (“PRWs”) from 2011 to 2013. Total hours worked, hours worked per PRW, wages paid, and productivity likewise showed overall declines from 2011 to 2013. However, hourly wages increased overall from 2011 to 2013, as did unit labor costs. The number of PRWs employed and total hours worked during January-March 2014 were lower than reported in the comparable period in 2013. Hours worked per PRW, wages paid, hourly wages, and productivity were all higher in January-March 2014 than in January-March 2013.
Table III-12
GOES: Average number of production and related workers (“PRWs”), hours worked, wages paid to such employees, hourly wages, productivity, and unit labor costs, 2011-13, January-March 2013, and January-March 2014
* * * * * * *

IV-1
PART IV: U.S. IMPORTS, APPARENT U.S. CONSUMPTION, AND MARKET SHARES
U.S. IMPORTERS
The Commission issued importer questionnaires to 25 firms believed to be importers of GOES, as well as to all U.S. producers of GOES.1 Nineteen firms submitted usable questionnaire responses representing *** percent of total imports from China, *** percent of U.S. imports from the Czech Republic,2 *** percent of total imports from Germany, *** percent of total imports from Japan,3 *** percent from Korea, *** percent from Poland, *** percent from Russia, and *** percent from all nonsubject sources during 2013 under HTS statistical reporting numbers 7225.11.0000, 7226.11.1000, 7226.11.9030, and 7226.11.9060, as adjusted by staff.4 These data do not include a relatively small volume of “TIB” imports. Specifically, *** imported *** short tons ($***) of GOES from *** during 2012 and *** short tons ($***) under the TIB program. These TIB imports were re-exported to ***. 5
Table IV-1 lists all responding U.S. importers of GOES from China, the Czech Republic, Germany, Japan, Korea, Poland, Russia, and other sources, their locations, and their shares of reported U.S. imports during January 2011-March 2014.
1 The Commission issued questionnaires to those firms identified in the petition, along with firms
that, based on a review of proprietary *** data, may have accounted for more than one percent of total imports under HTS statistical reporting numbers 7225.11.0000, 7226.11.1000, 7226.11.9030, and 7226.11.9060 since January 1, 2011. Firms that indicated in the preliminary phase of the investigations that they were not importers of GOES were not issued a questionnaire in the final phase of the investigations.
2 The primary U.S. importer of GOES from the Czech Republic was ***, which accounted for *** of GOES imports from the Czech Republic for 2013. The Commission also received a questionnaire response with certain usable information but also with certain double-counted imports from ***. Staff believes that these two companies account for *** U.S. imports of GOES from the Czech Republic.
3 Efforts were made to obtain data from ***. See e.g., emails from staff to *** on May 21, 2014; July 23, 2014; and July 24, 2014. *** submitted an importer’s questionnaire on August 20, 2014; its data are not included in this report.
4 The import data presented in this report have been adjusted to remove the data reported for Canada. Adjustments to the import data presented are further described below, under “U.S. Imports.”
5 In general, temporary importation under bond (“TIB”) is a procedure whereby merchandise may be temporarily entered into the U.S. customs territory free of duty by posting a bond in an amount equal to double the estimated duties had all the articles covered by the entry been entered under an ordinary consumption entry. 19 C.F.R. §§ 10.31(f). Under the terms of the bond, the importer agrees to export or destroy the merchandise within a specified time or pay liquidated damages, generally equal to twice the normal duty. See 19 C.F.R. sec. 10.39 (d) (1); Titanium Metals Corp. v. United States, 901 F. Supp. 362, 364 (Ct. Int’l Trade 1995). However, under NAFTA article 303.3, if merchandise were re-exported to a NAFTA country, and subject to an antidumping duty order, antidumping duties would be assessed at such time of re-exportation.

IV-2
Table IV-1 GOES: U.S. importers by source, January 2011-March 2014
* * * * * * *
U.S. IMPORTS
Table IV-2 presents data for U.S. imports of GOES from China, the Czech Republic, Germany, Japan, Korea, Poland, Russia, and all other sources combined. The import data presented are compiled from official statistics (HTS statistical reporting numbers 7225.11.0000, 7226.11.1000, 7226.11.9030, and 7226.11.9060), as adjusted to remove the data reported for Canada.6 Although the import data in the Commission’s preliminary-phase staff report were also adjusted to supplement the Census data reported for the Czech Republic, Germany, and Korea, these data have not been adjusted by staff in this final-phase report.7
6 Official Commerce statistics show entries of GOES from Canada during January 2011-March 2014.
Because there is no GOES production capacity in Canada, the data reported for Canada were removed from the U.S. import presentation in this report to avoid double-counting. ***.
7 The Census import data for the Czech Republic, Germany, and Korea presented in the Commission’s preliminary-phase staff report were supplemented with certain questionnaire data submitted by ***. Although there appear to be some relatively minor discrepancies between the Census data (excluding Canada) and the data reported in response to the Commission’s importer questionnaires, the import data presented in this staff report are believed to be generally consistent.
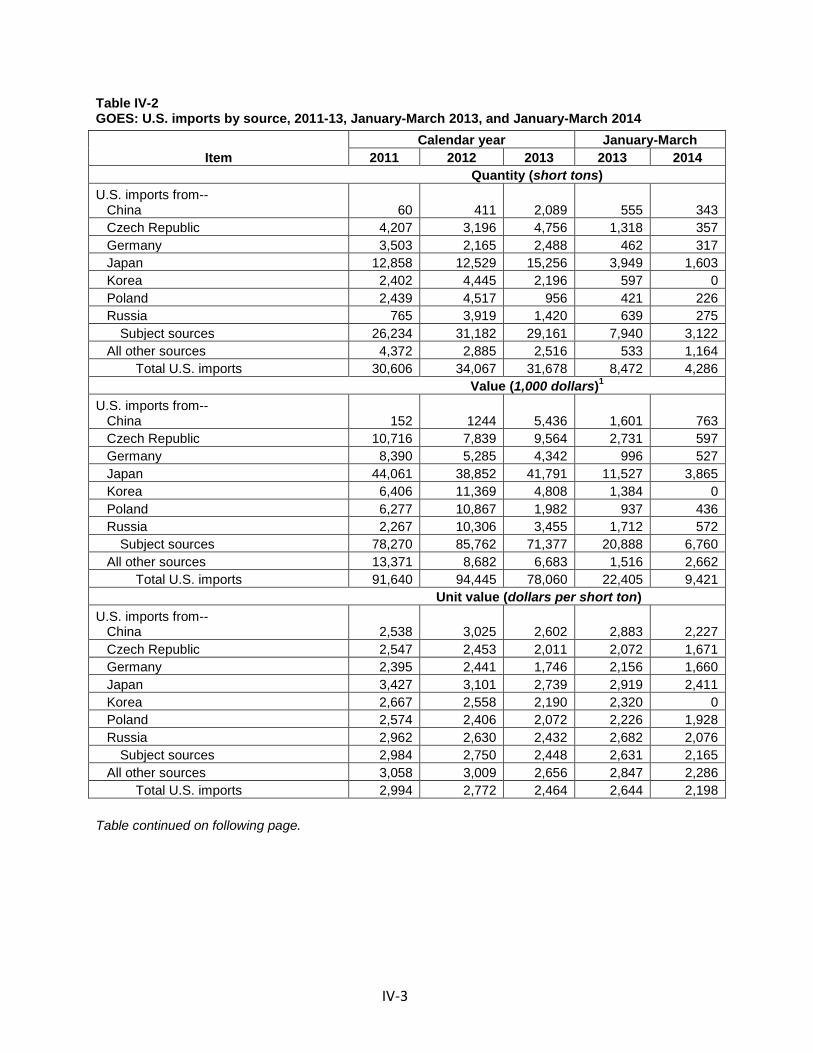
IV-3
Table IV-2 GOES: U.S. imports by source, 2011-13, January-March 2013, and January-March 2014
Item
Calendar year January-March
2011 2012 2013 2013 2014
Quantity (short tons)
U.S. imports from-- China 60 411 2,089 555 343
Czech Republic 4,207 3,196 4,756 1,318 357
Germany 3,503 2,165 2,488 462 317
Japan 12,858 12,529 15,256 3,949 1,603
Korea 2,402 4,445 2,196 597 0
Poland 2,439 4,517 956 421 226
Russia 765 3,919 1,420 639 275
Subject sources 26,234 31,182 29,161 7,940 3,122
All other sources 4,372 2,885 2,516 533 1,164
Total U.S. imports 30,606 34,067 31,678 8,472 4,286
Value (1,000 dollars)1
U.S. imports from-- China 152 1244 5,436 1,601 763
Czech Republic 10,716 7,839 9,564 2,731 597
Germany 8,390 5,285 4,342 996 527
Japan 44,061 38,852 41,791 11,527 3,865
Korea 6,406 11,369 4,808 1,384 0
Poland 6,277 10,867 1,982 937 436
Russia 2,267 10,306 3,455 1,712 572
Subject sources 78,270 85,762 71,377 20,888 6,760
All other sources 13,371 8,682 6,683 1,516 2,662
Total U.S. imports 91,640 94,445 78,060 22,405 9,421
Unit value (dollars per short ton)
U.S. imports from-- China 2,538 3,025 2,602 2,883 2,227
Czech Republic 2,547 2,453 2,011 2,072 1,671
Germany 2,395 2,441 1,746 2,156 1,660
Japan 3,427 3,101 2,739 2,919 2,411
Korea 2,667 2,558 2,190 2,320 0
Poland 2,574 2,406 2,072 2,226 1,928
Russia 2,962 2,630 2,432 2,682 2,076
Subject sources 2,984 2,750 2,448 2,631 2,165
All other sources 3,058 3,009 2,656 2,847 2,286
Total U.S. imports 2,994 2,772 2,464 2,644 2,198
Table continued on following page.

IV-4
Table IV-2--Continued GOES: U.S. imports by source, 2011-13, January-March 2013, and January-March 2014
Item
Calendar year January-March
2011 2012 2013 2013 2014
Share of quantity (percent)
U.S. imports from-- China 0.2 1.2 6.6 6.6 8.0
Czech Republic 13.7 9.4 15.0 15.6 8.3
Germany 11.4 6.3 7.9 5.5 7.4
Japan 42.0 36.8 48.2 46.6 37.4
Korea 7.8 13.0 6.9 7.0 0.0
Poland 8.0 13.3 3.0 5.0 5.3
Russia 2.5 11.5 4.5 7.5 6.4
Subject sources 85.7 91.5 92.1 93.7 72.8
All other sources 14.3 7.9 7.9 6.3 27.2
Total U.S. imports 100.0 100.0 100.0 100.0 100.0
Share of value (percent)
U.S. imports from-- China 0.2 1.3 7.0 7.1 8.1
Czech Republic 11.7 8.3 12.3 12.2 6.3
Germany 9.2 5.6 5.6 4.4 5.6
Japan 48.1 41.1 53.5 51.4 41.0
Korea 7.0 12.0 6.2 6.2 0.0
Poland 6.8 11.5 2.5 4.2 4.6
Russia 2.5 10.9 4.4 7.6 6.1
Subject sources 85.4 90.8 91.4 93.2 71.7
All other sources 14.6 9.2 8.6 6.8 28.3
Total U.S. imports 100.0 100.0 100.0 100.0 100.0 1 Landed, duty-paid.
Note.—The leading sources of GOES among nonsubject countries include the United Kingdom and Italy. Other nonsubject sources include France, Mexico, Sweden, Brazil, and Taiwan. Source: Compiled from official statistics of the U.S. Department of Commerce (excluding Canada). Official import statistics reported through December 2013 reflect revisions available as of July 2014.

IV-5
CRITICAL CIRCUMSTANCES
On May 12, 2014, Commerce issued its preliminary determinations that “critical circumstances” exist with regard to imports of GOES from Poland and Russia.8 On May 9, 2014, Commerce issued its preliminary determinations that “critical circumstances” do not exist with regard to imports of GOES from the Czech Republic.9 In these investigations, if both Commerce and the Commission make affirmative final critical circumstances determinations, certain subject imports may be subject to antidumping duties retroactive by 90 days from May 12, 2014, the effective date of Commerce’s preliminary affirmative LTFV determinations. In making its critical circumstances determination, the Commission may consider, among other factors it considers relevant, (1) the timing and the volume of imports, (2) a rapid increase in inventories of the imports, and (3) any other circumstances indicating that the remedial effect of the antidumping or countervailing duty order will be seriously undermined. Data regarding the volume of U.S. imports and inventories appear below; data regarding the pricing of U.S. imports appear in Part V and Appendix D of this report.
Concerning the timing and volume of imports, table IV-3 presents monthly U.S. imports of GOES from the Czech Republic, Poland, and Russia during April 2013-March 2014. These data show that U.S. imports of GOES from the Czech Republic fell overall during the months prior to the filing of the petition from 466 short tons in April 2013 to 100 short tons in July 2013 before rising again to 420 short tons in August 2013. Imports from the Czech Republic increased to 548 short tons in October 2013 (the month following the filing of the petition), fell to 148 short tons in November 2013 before rising again in December 2013 to 919 short tons. Imports of GOES from the Czech Republic fell during January 2013 and February 2013 to 56 short tons and 73 short tons, respectively, but were once again higher at 228 short tons in March 2013. Imports of GOES from the Czech Republic were 8.2 percent higher during October 2013-March 2014 than during April-September 2013.
8 Grain-Oriented Electrical Steel From Germany, Japan, Poland, and the Russian Federation:
Preliminary Determinations of Sales at Less Than Fair Value, Certain Affirmative Preliminary Determinations of Critical Circumstances, and Postponement of Russian Final Determination, 79 FR 26941, May 12, 2014. When petitioners file timely allegations of critical circumstances, Commerce examines whether there is a reasonable basis to believe or suspect that (1) either there is a history of dumping and material injury by reason of dumped imports in the United States or elsewhere of the subject merchandise, or the person by whom, or for whose account, the merchandise was imported knew or should have known that the exporter was selling the subject merchandise at LTFV and that there was likely to be material injury by reason of such sales; and (2) there have been massive imports of the subject merchandise over a relatively short period.
9 Grain-Oriented Electrical Steel From the Czech Republic: Preliminary Determination of Sales at Less Than Fair Value, Negative Preliminary Determination of Critical Circumstances, and Postponement of Final Determination, 79 FR 26717, May 9, 2014.
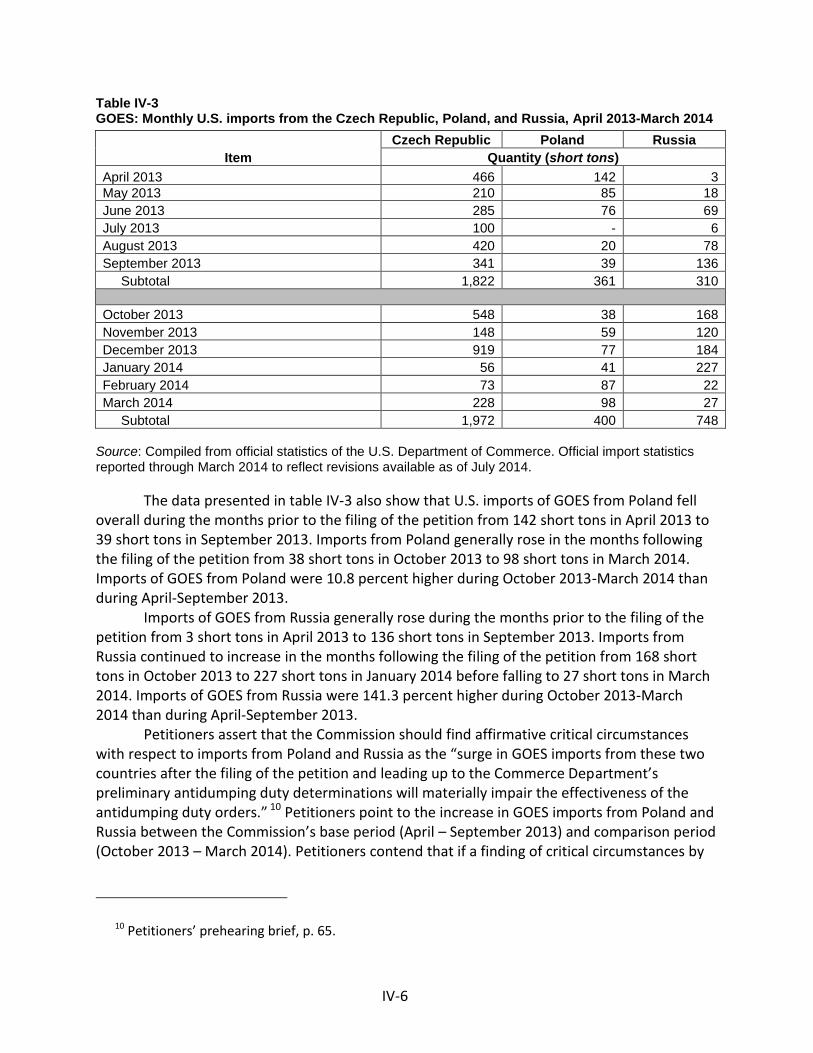
IV-6
Table IV-3 GOES: Monthly U.S. imports from the Czech Republic, Poland, and Russia, April 2013-March 2014
Item
Czech Republic Poland Russia
Quantity (short tons)
April 2013 466 142 3
May 2013 210 85 18
June 2013 285 76 69
July 2013 100 - 6
August 2013 420 20 78
September 2013 341 39 136
Subtotal 1,822 361 310
October 2013 548 38 168
November 2013 148 59 120
December 2013 919 77 184
January 2014 56 41 227
February 2014 73 87 22
March 2014 228 98 27
Subtotal 1,972 400 748
Source: Compiled from official statistics of the U.S. Department of Commerce. Official import statistics reported through March 2014 to reflect revisions available as of July 2014.
The data presented in table IV-3 also show that U.S. imports of GOES from Poland fell overall during the months prior to the filing of the petition from 142 short tons in April 2013 to 39 short tons in September 2013. Imports from Poland generally rose in the months following the filing of the petition from 38 short tons in October 2013 to 98 short tons in March 2014. Imports of GOES from Poland were 10.8 percent higher during October 2013-March 2014 than during April-September 2013.
Imports of GOES from Russia generally rose during the months prior to the filing of the petition from 3 short tons in April 2013 to 136 short tons in September 2013. Imports from Russia continued to increase in the months following the filing of the petition from 168 short tons in October 2013 to 227 short tons in January 2014 before falling to 27 short tons in March 2014. Imports of GOES from Russia were 141.3 percent higher during October 2013-March 2014 than during April-September 2013.
Petitioners assert that the Commission should find affirmative critical circumstances with respect to imports from Poland and Russia as the “surge in GOES imports from these two countries after the filing of the petition and leading up to the Commerce Department’s preliminary antidumping duty determinations will materially impair the effectiveness of the antidumping duty orders.” 10 Petitioners point to the increase in GOES imports from Poland and Russia between the Commission’s base period (April – September 2013) and comparison period (October 2013 – March 2014). Petitioners contend that if a finding of critical circumstances by
10 Petitioners’ prehearing brief, p. 65.

IV-7
the Commission is not made, the impact of import surges from Russia and Poland “will continue to cause price decline and impair any intended remedial effect of an antidumping order.”11
Russian respondent NLMK contends that the Commission should find that critical circumstances do not exist. According to NLMK, “there not only are no critical circumstances of massive imports in a relatively short period that would seriously undermine the remedial nature of any antidumping duties, there have been no imports at all from NLMK or Russia since nine months before the filing of the petition.”12 NLMK asserts that it cannot continue to compete in the United States due to Department of Energy regulations.
On July 22, 2014, Commerce published a notice in the Federal Register of its final determination of sales at LTFV with respect to imports from Germany, Japan, and Poland, and certain final affirmative determination of critical circumstances, which stated that it made no changes to the critical circumstances analysis for Poland.13 14
Inventories of U.S. imports from the Czech Republic increased from *** short tons in March 2013 to *** short tons in December 2013 before falling to *** short tons in March 2014. Inventories of U.S. imports from Poland fell from *** short tons in March 2013 to *** short tons in December 2013 before rising *** to *** short tons in March 2014. Importers of GOES from Russia reported *** during 2013 and *** in March 2014.
NEGLIGIBILITY
The statute requires that an investigation be terminated without an injury determination if imports of the subject merchandise are found to be negligible.15 Negligible imports are generally defined in the Tariff Act of 1930, as amended, as imports from a country of merchandise corresponding to a domestic like product where such imports account for less than 3 percent of the volume of all such merchandise imported into the United States in the most recent 12-month period for which data are available that precedes the filing of the petition or the initiation of the investigation. However, if there are imports of such merchandise from a number of countries subject to investigations initiated on the same day that individually account for less than 3 percent of the total volume of the subject merchandise, and if the imports from those countries collectively account for more than 7 percent of the volume of all
11 Petitioners’ prehearing brief, p. 66. 12 NLMK’s prehearing brief, p. 32. 13 Grain-Oriented Electrical Steel From Germany, Japan, and Poland: Final Determinations of Sales at
Less Than Fair Value and Certain Final Affirmative Determination of Critical Circumstances, 79 FR 42501, July 22, 2014.
14 Commerce has not yet made final critical circumstances determinations with regard to the Czech Republic and Russia.
15 Sections 703(a)(1), 705(b)(1), 733(a)(1), and 735(b)(1) of the Act (19 U.S.C. §§ 1671b(a)(1), 1671d(b)(1), 1673b(a)(1), and 1673d(b)(1)).

IV-8
such merchandise imported into the United States during the applicable 12-month period, then imports from such countries are deemed not to be negligible.16
Table IV-4 presents data for U.S. imports during September 2012-August 2013 (i.e., the most recent 12-month period preceding the filing of the petition) for each subject country and its share of total imports. The U.S. import data presented for September 2012-August 2013 are from official Commerce data, as adjusted to eliminate U.S. imports from Canada.17 Adjusted official Commerce data show that shares of imports from each of the seven subject countries individually account for more than 3 percent of the volume of total imports of GOES – China (5.4 percent), Czech Republic (9.4 percent), Germany (7.3 percent), Japan (47.0 percent), Korea (10.5 percent), Poland (6.4 percent), and Russia (7.4 percent) – and combined account for more than 7 percent of the volume of total imports of GOES – (93.4 percent).
Table IV-4 GOES: U.S. imports by source and share of imports, September 2012-August 2013
Source Adjusted official Commerce data
September 2012-August 2013
Quantity (short tons)
China 1,854
Czech Republic 3,225
Germany 2,489
Japan 16,088
Korea 3,607
Poland 2,177
Russia 2,517
Subject, subtotal 31,956
All other sources 2,241
Total 34,197
Share of quantity (percent)
China 5.4
Czech Republic 9.4
Germany 7.3
Japan 47.0
Korea 10.5
Poland 6.4
Russia 7.4
Subject, subtotal 93.4
All other sources 6.6
Total 100.0
Source: Compiled from official statistics of the U.S. Department of Commerce (excluding Canada). Official import statistics reported through December 2013 reflect revisions available as of July 2014.
16 Section 771 (24) of the Act (19 U.S.C. § 1677(24)). 17 As previously indicated, the data reported for Canada were removed because there is no GOES
production capacity in Canada.

IV-9
CUMULATION CONSIDERATIONS
In assessing whether imports should be cumulated, the Commission determines whether U.S. imports from the subject countries compete with each other and with the domestic like product and has generally considered four factors: (1) fungibility, (2) presence of sales or offers to sell in the same geographical markets, (3) common or similar channels of distribution, and (4) simultaneous presence in the market. Additional information concerning fungibility, geographical markets, and simultaneous presence in the market is presented below.
Fungibility
Tables IV-5 through IV-12 present the shares of U.S. importers' U.S. shipments by type of GOES and by source of import. Comparable data reported by the U.S. producers appear in Part III of this report.
Table IV-5 GOES: U.S. importers' U.S. shipments of GOES imported from China, by type, 2011-13, January-March 2013, and January-March 2014
* * * * * * *
Table IV-6 GOES: U.S. importers' U.S. shipments of GOES imported from the Czech Republic, by type, 2011-13, January-March 2013, and January-March 2014
* * * * * * *
Table IV-7 GOES: U.S. importers' U.S. shipments of GOES imported from the Germany, by type, 2011-13, January-March 2013, and January-March 2014
* * * * * * *
Table IV-8 GOES: U.S. importers' U.S. shipments of GOES imported from Japan, by type, 2011-13, January-March 2013, and January-March 2014
* * * * * * *

IV-10
Table IV-9 GOES: U.S. importers' U.S. shipments of GOES imported from Korea, by type, 2011-13, January-March 2013, and January-March 2014
* * * * * * *
Table IV-10 GOES: U.S. importers' U.S. shipments of GOES imported from Poland, by type, 2011-13, January-March 2013, and January-March 2014
* * * * * * *
Table IV-11 GOES: U.S. importers' U.S. shipments of GOES imported from Russia, by type, 2011-13, January-March 2013, and January-March 2014
* * * * * * *
Table IV-12 GOES: U.S. importers' U.S. shipments of GOES imported from nonsubject countries, by type, 2011-13, January-March 2013, and January-March 2014
* * * * * * *
These data show that U.S. shipments of imports of GOES from the Czech Republic, Poland, and Russia were *** of the conventional type of GOES (grades ***) during January 2011-March 2014. *** U.S. shipments of GOES imported from Germany (*** percent in 2013) were conventional GOES (grades ***), although *** of high-permeability, non-domain-refined GOES and high-permeability, domain-refined (laser-scribed/non-heat-proof) were also reported. In comparison, the data show that during 2013 *** of U.S. shipments of GOES imported from China (*** percent) was high-permeability, domain-refined (laser-scribed/non-heat-proof) GOES, although *** of U.S. shipments of imports from China was of the high-permeability, non-domain-refined GOES and the grade *** conventional type of GOES. During 2013 *** of U.S. shipments of GOES imported from Japan (*** percent) was domain-refined and non-domain-refined high-permeability GOES, almost *** of which was mechanically or chemically scribed/heat-proof domain-refined GOES. In fact, Japan was the only reported source for domain-refined (mechanically or chemically scribed/heat-proof) GOES during January 2011-March 2014. A *** of U.S. shipments of imports from Japan was of conventional grades *** GOES. U.S. shipments of imports of GOES from Korea were *** high-permeability, domain-refined (laser-scribed/non-heat-proof) GOES during 2013, but U.S. shipments of imports from Korea in prior years also included *** high-permeability, non-domain-refined GOES and *** conventional grades ***. During 2013, *** percent of U.S. shipments of GOES
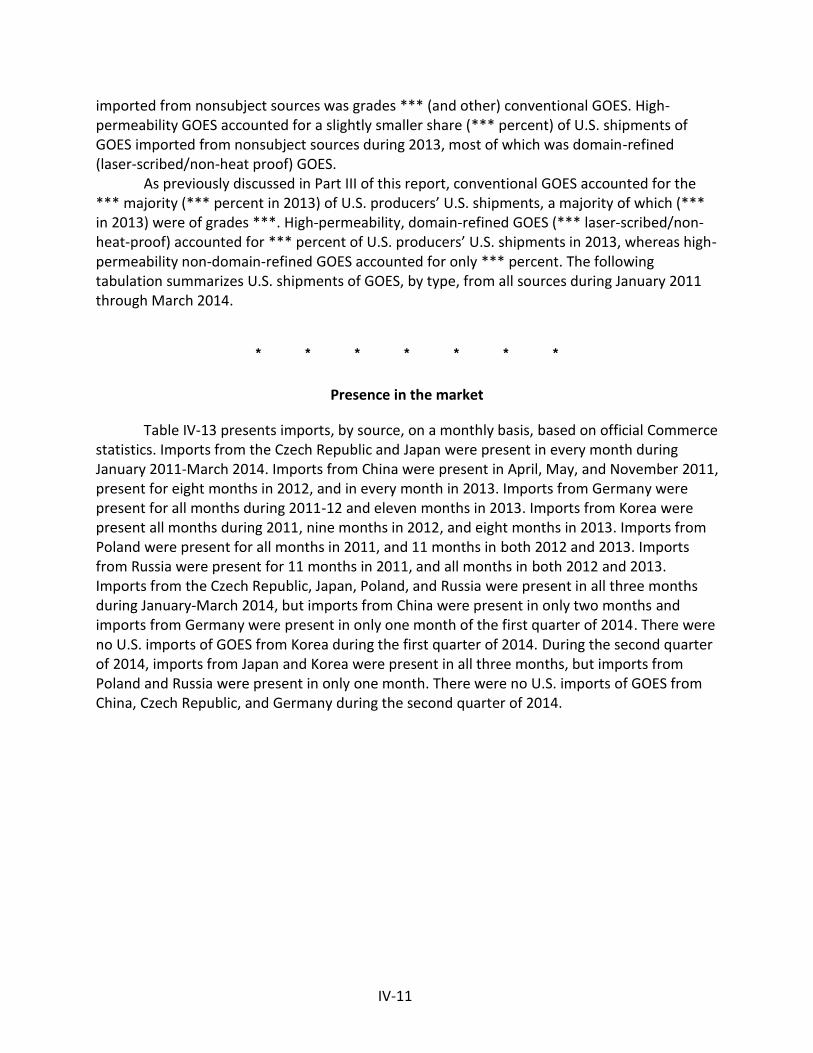
IV-11
imported from nonsubject sources was grades *** (and other) conventional GOES. High-permeability GOES accounted for a slightly smaller share (*** percent) of U.S. shipments of GOES imported from nonsubject sources during 2013, most of which was domain-refined (laser-scribed/non-heat proof) GOES.
As previously discussed in Part III of this report, conventional GOES accounted for the *** majority (*** percent in 2013) of U.S. producers’ U.S. shipments, a majority of which (*** in 2013) were of grades ***. High-permeability, domain-refined GOES (*** laser-scribed/non-heat-proof) accounted for *** percent of U.S. producers’ U.S. shipments in 2013, whereas high-permeability non-domain-refined GOES accounted for only *** percent. The following tabulation summarizes U.S. shipments of GOES, by type, from all sources during January 2011 through March 2014.
* * * * * * *
Presence in the market
Table IV-13 presents imports, by source, on a monthly basis, based on official Commerce statistics. Imports from the Czech Republic and Japan were present in every month during January 2011-March 2014. Imports from China were present in April, May, and November 2011, present for eight months in 2012, and in every month in 2013. Imports from Germany were present for all months during 2011-12 and eleven months in 2013. Imports from Korea were present all months during 2011, nine months in 2012, and eight months in 2013. Imports from Poland were present for all months in 2011, and 11 months in both 2012 and 2013. Imports from Russia were present for 11 months in 2011, and all months in both 2012 and 2013. Imports from the Czech Republic, Japan, Poland, and Russia were present in all three months during January-March 2014, but imports from China were present in only two months and imports from Germany were present in only one month of the first quarter of 2014. There were no U.S. imports of GOES from Korea during the first quarter of 2014. During the second quarter of 2014, imports from Japan and Korea were present in all three months, but imports from Poland and Russia were present in only one month. There were no U.S. imports of GOES from China, Czech Republic, and Germany during the second quarter of 2014.

IV-12
Table IV-13 GOES: Imports by country, by month, January 2011-June 2014
2011
Country
Jan Feb Mar Apr May Jun Jul Aug Sep Oct Nov Dec
Quantity (short tons)
China - - - 22 14 - - - - - 24 -
Czech Republic 226 155 220 298 459 81 811 402 136 210 1,208 1
Germany 151 220 522 764 582 47 58 135 272 319 118 313
Japan 1,972 1,805 1,696 1,542 1,429 440 516 735 649 883 601 588
Korea 551 284 115 152 180 184 235 164 268 111 7 150
Poland 82 69 175 116 216 235 262 267 103 296 329 288
Russia 26 - 81 131 81 22 106 64 124 47 45 38
Subject sources 3,008 2,534 2,809 3,026 2,962 1,009 1,988 1,769 1,553 1,866 2,332 1,378
All other sources 243 425 303 141 747 519 376 311 191 501 441 175
Total imports, excluding Canada 3,251 2,959 3,111 3,167 3,708 1,529 2,364 2,080 1,744 2,367 2,773 1,553
2012
Country
Jan Feb Mar Apr May Jun Jul Aug Sep Oct Nov Dec
Quantity (short tons)
China - - - 5 47 22 21 - 5 65 109 137
Czech Republic 215 191 141 611 122 1,113 16 360 29 216 3 178
Germany 117 316 191 60 204 119 43 214 92 238 124 447
Japan 781 955 1,210 603 1,066 705 1,271 1,330 1,364 1,359 1,443 440
Korea - 415 467 - 440 443 478 572 527 528 575 -
Poland 103 - 600 932 433 297 354 365 472 248 390 322
Russia 355 182 76 5 404 133 657 401 577 438 537 153
Subject sources 1,571 2,059 2,686 2,217 2,717 2,830 2,842 3,242 3,066 3,092 3,183 1,677
All other sources 137 268 221 519 185 390 452 163 147 132 67 204
Total imports, excluding Canada 1,708 2,327 2,907 2,736 2,902 3,220 3,294 3,405 3,213 3,225 3,250 1,880

IV-13
Table IV-13—Continued GOES: Imports by country, by month, January 2011-June 2014
2013
Country
Jan Feb Mar Apr May Jun Jul Aug Sep Oct Nov Dec
Quantity (short tons)
China 160 147 249 275 137 150 185 235 66 231 187 68
Czech Republic
305
517
496
466
210
285
100
420
341
548
148
919
Germany 197 56 209 230 509 153 149 84 448 231 - 221
Japan 1,259 1,582 1,107 1,451 1,441 1,510 1,444 1,688 970 954 1,076 775
Korea 1 40 556 0 22 - 1,113 245 219 - - -
Poland 251 113 56 142 85 76 - 20 39 38 59 77
Russia 562 67 10 3 18 69 6 78 136 168 120 184
Subject sources
2,734
2,522
2,684
2,566
2,422
2,244
2,997
2,771
2,219
2,170
1,590
2,244
All other sources
180
189
163
174
165
165
347
307
252
250
145
179
Total imports, excluding Canada
2,914
2,712
2,846
2,740
2,586
2,409
3,343
3,078
2,471
2,420
1,735
2,423
2014
Country
Jan Feb Mar Apr May Jun
Quantity (short tons)
China 146 197 - - - -
Czech Republic
56
73
228
-
- -
Germany 317 - - - - -
Japan 425 756 422 694 262 147
Korea - - - 460 10 437
Poland 41 87 98 1 - -
Russia 227 22 27 30 - -
Subject sources
1,212
1,136
775
1,185
273 584
All other sources
202
733
229
670
800 1,288
Total imports, excluding Canada
1,414
1,868
1,004
1,855
1,073 1,872
Source: Compiled from official statistics of the U.S. Department of Commerce. Official import statistics reflect revisions available as of July 2014.

IV-14
Geographical markets
Official Commerce statistics show that in during January 2011-March 2014, U.S. imports of GOES from the subject countries entered the United States through 23 Customs districts nationwide.18 Imports of GOES from all subject countries entered through Buffalo, New York, and Detroit, Michigan. In addition, imports of GOES from all subject countries, except for China and Russia, entered the United States through the Customs district of Chicago, Illinois. Table IV-14 presents the shares of U.S. imports, by Customs district and by source of import for January 2011-March 2014.
During January 2011-March 2014, most U.S. imports of GOES from China (91.7 percent) entered the United States through the Customs districts of San Diego, Detroit, and Laredo. Most U.S. imports of GOES from the Czech Republic (89.4 percent) entered the United States through the Customs districts of Buffalo, Chicago, Detroit, and Baltimore during the same time period. Imports of GOES from Germany during January 2011-March 2014 primarily entered the United States through the Customs districts of Chicago and Los Angeles (88.0 percent of total U.S. imports from Germany). GOES imports from Japan entered the United States mostly (88.6 percent) through four separate Customs districts since January 2011 (Buffalo, Detroit, Laredo, and New Orleans). Almost all U.S. imports of GOES from Korea (98.2 percent during January 2011-March 2014) entered the United States through the Customs districts of Los Angeles, and Mobile. Since January 2011, 92.0 percent of U.S. imports of GOES from Poland entered the United States through three Customs districts (St. Louis, Norfolk, and Chicago). Imports of GOES from Russia entered the United States mostly (88.2 percent) through three separate Customs districts since January 2011 (Buffalo, Detroit, and Norfolk).
18 The 23 Customs districts are: Baltimore, Maryland; Buffalo, New York; Charleston, South Carolina;
Charlotte, North Carolina; Chicago, Illinois; Cleveland, Ohio; Detroit, Michigan; Houston-Galveston, Texas; Laredo, Texas; Los Angeles, California; Milwaukee, Wisconsin; Mobile, Alabama; New Orleans, Louisiana; New York, New York; Nogales, Arizona; Norfolk, Virginia; Ogdensburg, New York; Philadelphia, Pennsylvania; San Diego, California; San Juan, Puerto Rico; Savannah, Georgia; St. Louis, Missouri; and Tampa, Florida.

IV-15
Table IV-14 GOES: U.S. imports, by Customs district and by source, January 2011-March 2014
Item
January 2011-March 2014
Quantity (short tons)
Share of quantity (percent)
U.S. imports from China: Buffalo, NY 164 5.7
Detroit, MI 905 31.2
Laredo, TX 352 12.1
Los Angeles, CA 18 0.6
New Orleans, LA 29 1.0
Nogales, AZ 5 0.2
San Diego, CA 1,405 48.4
Savannah, GA 24 0.8
Tampa, FL 1 0.0
Subtotal 2,903 100.0
U.S. imports from Czech Republic: Baltimore, MD 1,814 14.5
Buffalo, NY 2,821 22.5
Chicago, IL 6,556 52.4
Detroit, MI 990 7.9
Laredo, TX 43 0.3
Milwaukee, WI 189 1.5
New York, NY 81 0.6
Ogdensburg, NY 21 0.2
Subtotal 12,516 100.0
U.S. imports from Germany: Baltimore, MD 20 0.2
Buffalo, NY 40 0.5
Chicago, IL 3,359 39.6
Detroit, MI 189 2.2
Los Angeles, CA 4,101 48.4
Savannah, GA 764 9.0
Subtotal 8,473 100.0
U.S. imports from Japan: Buffalo, NY 7,953 18.8
Chicago, IL 13 0.0
Detroit, MI 4,492 10.6
Houston-Galveston, TX 8 0.0
Laredo, TX 16,625 39.4
Los Angeles, CA 1,042 2.5
New Orleans, LA 8,351 19.8
New York, NY 25 0.1
Norfolk, VA 207 0.5
Philadelphia, PA 854 2.0
San Diego, CA 891 2.1
Savannah, GA 1,785 4.2
Subtotal 42,246 100.0
Table continued on following page.

IV-16
Table IV-14--Continued GOES: U.S. imports, by Customs district and by source, January 2011-March 2014
Item
January 2011-March 2014
Quantity (short tons)
Share of quantity (percent)
U.S. imports from Korea: Buffalo, NY 35 0.4
Chicago, IL 5 0.1
Detroit, MI 82 0.9
Laredo, TX 6 0.1
Los Angeles, CA 2,411 26.7
Mobile, AL 6,470 71.6
Ogdensburg, NY 1 0.0
San Juan, PR 32 0.4
Subtotal 9,042 100.0
U.S. imports from Poland: Baltimore, MD 183 2.2
Buffalo, NY 58 0.7
Chicago, IL 917 11.3
Cleveland, OH 284 3.5
Detroit, MI 25 0.3
New Orleans, LA 40 0.5
New York, NY 64 0.8
Norfolk, VA 1,375 16.9
St. Louis, MO 5,192 63.8
Subtotal 8,138 100.0
U.S. imports from Russia: Baltimore, MD 176 2.8
Buffalo, NY 2,705 42.4
Charleston, SC 263 4.1
Charlotte, NC 32 0.5
Cleveland, OH 10 0.2
Detroit, MI 757 11.9
Houston-Galveston, TX 22 0.3
Laredo, TX 171 2.7
New York, NY 56 0.9
Norfolk, VA 2,162 33.9
Ogdensburg, NY 4 0.1
Philadelphia, PA 20 0.3
Subtotal 6,380 100.0
Source: Compiled from official statistics of the U.S. Department of Commerce. Official import statistics reported through December 2013 reflect revisions available as of July 2014.

IV-17
APPARENT U.S. CONSUMPTION AND MARKET SHARES
Table IV-15 presents data on apparent U.S. consumption and U.S. market shares for GOES during 2011-13, January-March 2013, and January-March 2014. These data show that apparent U.S. consumption, by quantity, decreased by *** percent from 2011 to 2012, but increased by *** percent in 2013 to a level above that reported for 2011. Apparent U.S. consumption of GOES, by quantity, was *** percent lower in January-March 2014 than in January-March 2013. Reflecting a general decline in unit values of U.S.-produced and imported GOES in the United States, apparent U.S. consumption of GOES, by value, declined by *** percent from 2011 to 2013, and was *** percent lower in January-March 2014 than in January-March 2013.

IV-18
Table IV-15
GOES: U.S. shipments of domestic product, U.S. imports, and apparent U.S. consumption, 2011-13, January-March 2013, and January-March 2014
Item
Calendar year January-March
2011 2012 2013 2013 2014
Quantity (short tons)
U.S. producers' U.S. shipments *** *** *** *** ***
U.S. imports from-- China 60 411 2,089 555 343
Czech Republic 4,207 3,196 4,756 1,318 357
Germany 3,503 2,165 2,488 462 317
Japan 12,858 12,529 15,256 3,949 1,603
Korea 2,402 4,445 2,196 597 0
Poland 2,439 4,517 956 421 226
Russia 765 3,919 1,420 639 275
Subject sources 26,234 31,182 29,161 7,940 3,122
All other sources 4,372 2,885 2,516 533 1,164
Total U.S. imports 30,606 34,067 31,678 8,472 4,286
Apparent U.S. consumption *** *** *** *** ***
Value (1,000 dollars)
U.S. producers' U.S. shipments *** *** *** *** ***
U.S. imports from-- China 152 1,244 5,436 1,601 763
Czech Republic 10,716 7,839 9,564 2,731 597
Germany 8,390 5,285 4,342 996 527
Japan 44,061 38,852 41,791 11,527 3,865
Korea 6,406 11,369 4,808 1,384 0
Poland 6,277 10,867 1,982 937 436
Russia 2,267 10,306 3,455 1,712 572
Subject sources 78,270 85,762 71,377 20,888 6,760
All other sources 13,371 8,682 6,683 1,516 2,662
Total U.S. imports 91,640 94,445 78,060 22,405 9,421
Apparent U.S. consumption *** *** *** *** ***
Source: Compiled from data submitted in response to Commission questionnaires and adjusted official statistics of the U.S. Department of Commerce. Official import statistics reported through December 2013 reflect revisions available as of July 2014.
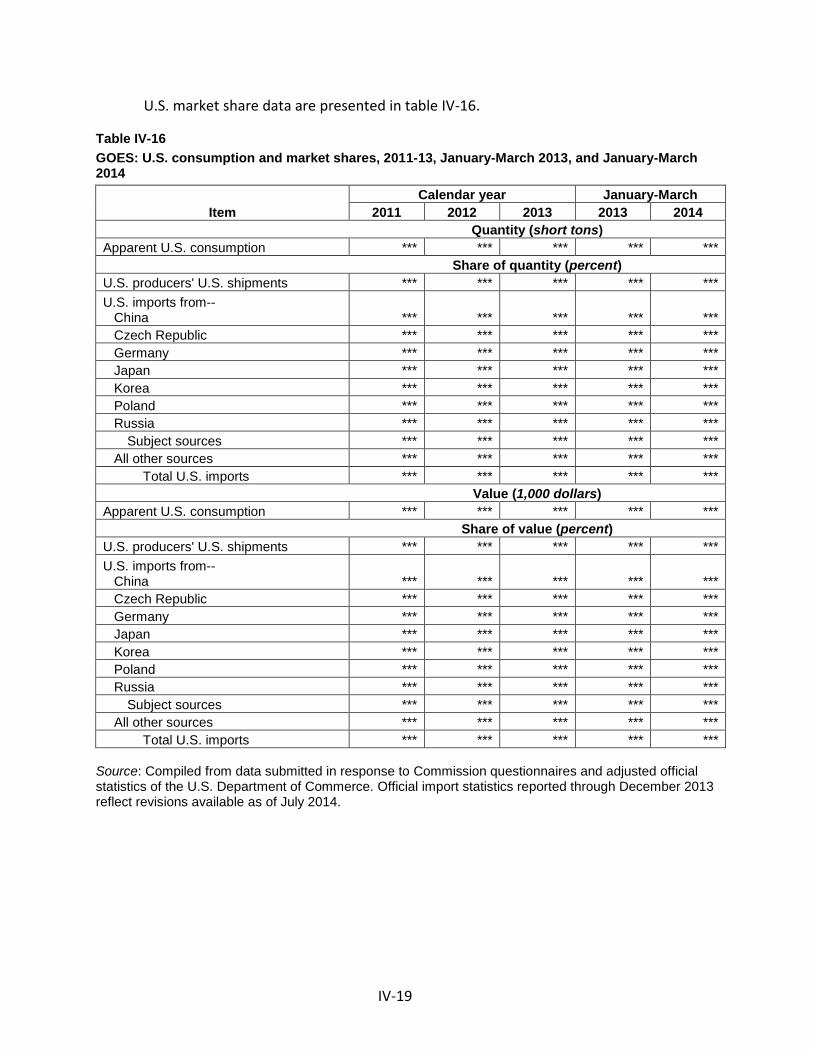
IV-19
U.S. market share data are presented in table IV-16.
Table IV-16
GOES: U.S. consumption and market shares, 2011-13, January-March 2013, and January-March 2014
Item
Calendar year January-March
2011 2012 2013 2013 2014
Quantity (short tons)
Apparent U.S. consumption *** *** *** *** ***
Share of quantity (percent)
U.S. producers' U.S. shipments *** *** *** *** ***
U.S. imports from-- China *** *** *** *** ***
Czech Republic *** *** *** *** ***
Germany *** *** *** *** ***
Japan *** *** *** *** ***
Korea *** *** *** *** ***
Poland *** *** *** *** ***
Russia *** *** *** *** ***
Subject sources *** *** *** *** ***
All other sources *** *** *** *** ***
Total U.S. imports *** *** *** *** ***
Value (1,000 dollars)
Apparent U.S. consumption *** *** *** *** ***
Share of value (percent)
U.S. producers' U.S. shipments *** *** *** *** ***
U.S. imports from-- China *** *** *** *** ***
Czech Republic *** *** *** *** ***
Germany *** *** *** *** ***
Japan *** *** *** *** ***
Korea *** *** *** *** ***
Poland *** *** *** *** ***
Russia *** *** *** *** ***
Subject sources *** *** *** *** ***
All other sources *** *** *** *** ***
Total U.S. imports *** *** *** *** ***
Source: Compiled from data submitted in response to Commission questionnaires and adjusted official statistics of the U.S. Department of Commerce. Official import statistics reported through December 2013 reflect revisions available as of July 2014.

IV-20
U.S. SHIPMENTS OF GOES BY TYPE
Tables IV-17 through IV-25 present U.S. shipments of domestically produced and imported GOES, by type. These tables are based on shipment quantity, since certain importers do not re-sell the GOES they import, but rather consume it (and the GOES they purchase from domestic producers) internally. Import shipments are understated, as noted in the discussions of importer coverage earlier in this chapter.19
Table IV-17
GOES: U.S. shipments of high-permeability, domain-refined, laser-scribed, non-heat proof GOES by quantity and share of shipments, 2011-13, January to March 2013, and January to March 2014
* * * * * * *
Table IV-18 GOES: U.S. shipments of high-permeability, domain-refined (DR), mechanically or chemically scribed heat proof GOES by quantity and share of shipments, 2011-13, January to March 2013, and January to March 2014
* * * * * * *
Table IV-19
GOES: U.S. shipments of high-permeability, non-domain-refined GOES by quantity and share of shipments, 2011-13, January to March 2013, and January to March 2014
* * * * * * *
Table IV-20
GOES: U.S. shipments of conventional grade M2 GOES by quantity and share of shipments, 2011-13, January to March 2013, and January to March 2014
* * * * * * *
19 See also prior discussion of ***

IV-21
Table IV-21
GOES: U.S. shipments of conventional grade M3 GOES by quantity and share of shipments, 2011-13, January to March 2013, and January to March 2014
* * * * * * *
Table IV-22
GOES: U.S. shipments of conventional grade M4 GOES by quantity and share of shipments, 2011-13, January to March 2013, and January to March 2014
* * * * * * *
Table IV-23
GOES: U.S. shipments of conventional grade M5 GOES by quantity and share of shipments, 2011-13, January to March 2013, and January to March 2014
* * * * * * *
Table IV-24
GOES: U.S. shipments of conventional grade M6 GOES by quantity and share of shipments, 2011-13, January to March 2013, and January to March 2014
* * * * * * *
Table IV-25
GOES: U.S. shipments of other conventional grade GOES by quantity and share of shipments, 2011-13, January to March 2013, and January to March 2014
* * * * * * *

IV-22
RATIO OF IMPORTS TO U.S. PRODUCTION
Table IV-26 presents data on the ratio of U.S. imports to U.S. production. During 2013, U.S. imports of GOES from subject countries were equivalent to *** percent of total domestic GOES production.
Table IV-26
GOES: Ratio of U.S. imports to U.S. production, 2011-13, January-March 2013, and January-March 2014
Item
Calendar year January to March
2011 2012 2013 2013 2014
Quantity (short tons)
U.S. production *** *** *** *** ***
U.S. imports from-- China 60 411 2,089 555 343
Czech Republic 4,207 3,196 4,756 1,318 357
Germany 3,503 2,165 2,488 462 317
Japan 12,858 12,529 15,256 3,949 1,603
Korea 2,402 4,445 2,196 597 0
Poland 2,439 4,517 956 421 226
Russia 765 3,919 1,420 639 275
Subject sources 26,234 31,182 29,161 7,940 3,122
All other sources 4,372 2,885 2,516 533 1,164
Total U.S. imports 30,606 34,067 31,678 8,472 4,286
Ratio to U.S. production (percent)
U.S. imports from-- China *** *** *** *** ***
Czech Republic *** *** *** *** ***
Germany *** *** *** *** ***
Japan *** *** *** *** ***
Korea *** *** *** *** ***
Poland *** *** *** *** ***
Russia *** *** *** *** ***
Subject sources *** *** *** *** ***
All other sources *** *** *** *** ***
Total U.S. imports *** *** *** *** ***
Source: Compiled from data submitted in response to Commission questionnaires and adjusted official statistics of the U.S. Department of Commerce. Official import statistics reported through December 2013 reflect revisions available as of July 2014.

V-1
Co
nta
ins B
usin
ess Pro
prieta
ry Info
rma
tion
PART V: PRICING DATA
FACTORS AFFECTING PRICES
Raw material and other costs
Steel scrap and silicon are the predominant material input costs to produce GOES. Raw material costs made up between *** to *** percent of U.S. producers’ cost of goods sold during 2011 to 2013. U.S. producers described raw material costs as increasing, while most importers indicated that these costs have either decreased or fluctuated. The domestic industry’s per-ton raw material costs declined between 2011 and 2013, but were higher in January-March 2014 than in January-March 2013. During the preliminary phase of these investigations, petitioners indicated that increases in the price of electricity were a major driver in increasing costs and that increases in the costs of magnesium oxide and of coatings such as phosphoric acid and base coatings have increased.1 *** indicated that iron scrap prices have been relatively stable since 2010, but that prices for high purity ferrosilicon have increased by about 20 percent since 2010. *** indicated that the principal raw material used to produce GOES is hot-rolled band and that its price has been declining since 2010. Japanese and Chinese respondents stated that Japanese and Chinese producers have a different raw material cost structure than U.S. producers since they are integrated steel mills.2
Prices for ferrosilicon and ferrous scrap have declined since January 2011, decreasing overall by 10 and 15 percent respectively by June 2014 (figure V-1). Aside from seasonal fluctuations, the industrial price of electricity generally remained at the same level since January 2011. The NYMEX futures price for natural gas fluctuated, decreasing by as much as 49 percent between January 2011 and April 2012, but increasing overall by 2 percent through June 2014.
U.S. producers use raw material surcharges in contract prices.3 The *** primary surcharge elements are ***. Allegheny Ludlum calculates its raw material surcharge *** and its surcharges are publicly available on the company website. AK Steel ***.4
1 Conference transcript, p. 51 (Petersen), p. 51 (Polinski). 2 Conference transcript, pp. 168-69 (Suzuki), p. 169 (Huang). 3 Conference transcript, p. 52 (Petersen), p. 52 (Polinski). 4 Petitioners’ postconference brief, Response to staff questions, p. 6 and exhibit 13. See also hearing
transcript, pp. 199-200 (Woolfort).
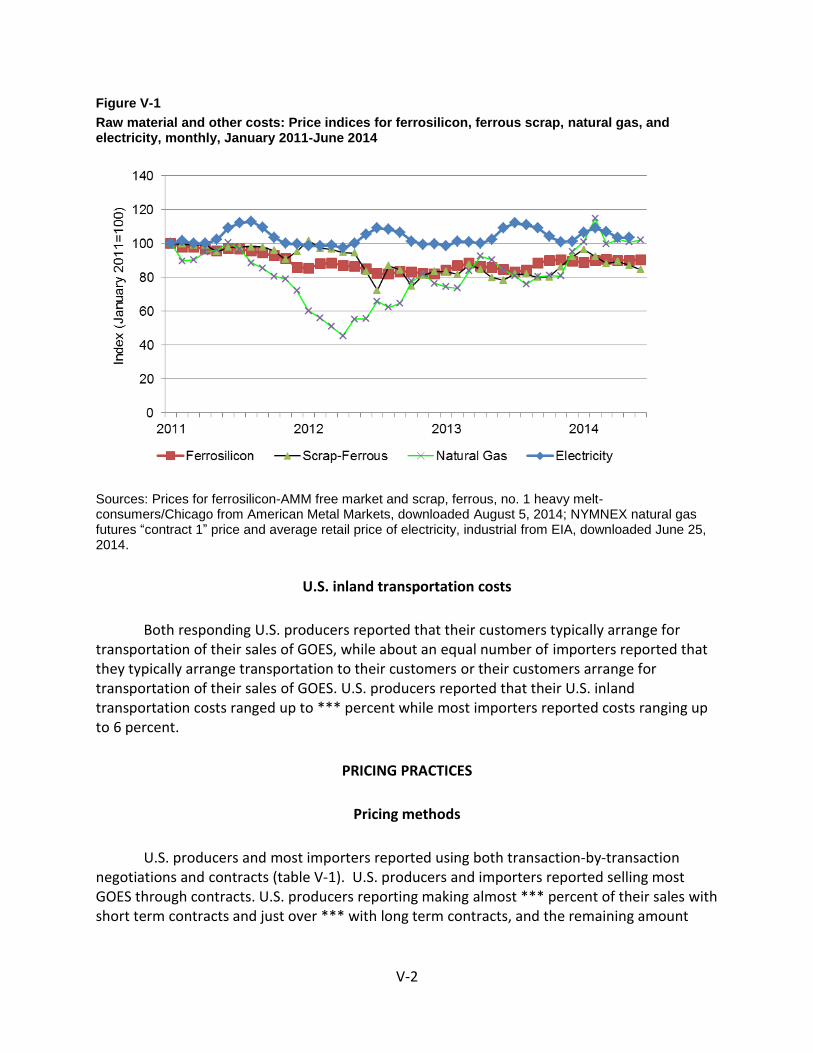
V-2
Co
nta
ins B
usin
ess Pro
prieta
ry Info
rma
tion
Figure V-1
Raw material and other costs: Price indices for ferrosilicon, ferrous scrap, natural gas, and electricity, monthly, January 2011-June 2014
Sources: Prices for ferrosilicon-AMM free market and scrap, ferrous, no. 1 heavy melt-consumers/Chicago from American Metal Markets, downloaded August 5, 2014; NYMNEX natural gas futures “contract 1” price and average retail price of electricity, industrial from EIA, downloaded June 25, 2014.
U.S. inland transportation costs
Both responding U.S. producers reported that their customers typically arrange for transportation of their sales of GOES, while about an equal number of importers reported that they typically arrange transportation to their customers or their customers arrange for transportation of their sales of GOES. U.S. producers reported that their U.S. inland transportation costs ranged up to *** percent while most importers reported costs ranging up to 6 percent.
PRICING PRACTICES
Pricing methods
U.S. producers and most importers reported using both transaction-by-transaction negotiations and contracts (table V-1). U.S. producers and importers reported selling most GOES through contracts. U.S. producers reporting making almost *** percent of their sales with short term contracts and just over *** with long term contracts, and the remaining amount

V-3
Co
nta
ins B
usin
ess Pro
prieta
ry Info
rma
tion
were spot sales. Most importers reports making the bulk of their sales with short term contracts, although one importer (***) makes *** percent of its sales on a spot basis.
Table V-1
GOES: U.S. producers and importers reported price setting methods, by number of responding firms
1
Method U.S. producers Importers
Transaction-by-transaction 2 7
Contract 2 9
Set price list 0 1
Other 0 1 1 The sum of responses down will not add up to the total number of responding firms as each firm was
instructed to check all applicable price setting methods employed. Source: Compiled from data submitted in response to Commission questionnaires.
Petitioners indicated that ***. They also indicate that approximately *** percent of Allegheny Ludlum’s short term contracts were quarterly contracts.5 Moreover, according to Allegheny Ludlum the pricing terms of long term contracts may be renegotiated to reflect current prices.6
Sales terms and discounts
Both U.S. producers typically quote prices on f.o.b. basis, while almost all importers typically quote prices on a delivered basis. ***. *** importer reported offering discounts. ***.7 Most importers offer sales term of net 30 days.
Price leaders
About two-thirds of responding purchasers indicated that there are price leaders for GOES.8 Five purchasers indicated there were no price leaders and two were unsure if there are any price leaders. AK Steel was identified as a price leader by 11 purchasers, Allegheny Ludlum was identified by four purchasers, and JFE, POSCO, ThyssenKrupp, “Russia” and “Poland” were each identified by one purchaser. Some purchasers specifically specified that price leader(s) led
5 Petitioners’ postconference brief, Response to Commission staff’s questions, p. 5. 6 Hearing transcript, p. 33 (Polinski). 7 ½ 10 day net 30 means that there is a 0.5 percent discount if bill is paid in the first 10 days and
otherwise the total amount is due after 30 days. 8 When asking purchasers to list the names of any firms they considered price leaders in the GOES
market since January 1, 2011, the U.S. purchasers’ questionnaire defines a price leader as (1) one or more firms that initiate a price change either upward or downward, that is followed by other firms, or (2) one or more firms that have a significant impact on prices. It also stresses that a price leader is not necessarily the lowest-price supplier.

V-4
Co
nta
ins B
usin
ess Pro
prieta
ry Info
rma
tion
price increases, price declines, or all changes in price. Purchasers cite a variety of forms of price leadership including the industry following the lead of the price leader(s); a U.S. producer following the lead of another U.S. producer; price leaders increasing prices based on market conditions; price leaders being the first firm to announce price increases as well as being the first firm to lower prices; the price leader being the first to raise prices; multiple price leaders leading price changes at different times not competing aggressively for market share; customers setting price with U.S. producers before negotiating with foreign suppliers; and the price leader offering new products that have lowered costs. Petitioners indicate that while they have been price leaders seeking to increase prices in the past, neither company is a low price leader in the U.S. market.9
PRICE DATA
The Commission requested U.S. producers and importers to provide quarterly data for the total quantity and f.o.b. value of the following GOES products shipped to unrelated U.S. customers during January 2011-March 2014.10
Product 1a.--Conventional GOES, 9 mil (0.23 mm.) thickness, maximum core loss 1.20 W/kg, (50 hz, 1.7T), U.S. grade M-3, in unslit coils having a width of 900mm or more and sold to slitters/laminators. Product 1b.--Conventional GOES, 9 mil (0.23 mm.) thickness, maximum core loss 1.20 W/kg, (50 hz, 1.7T), U.S. grade M-3, not included in product 1a. Product 2a.--Conventional GOES, 11 mil (0.27 mm.) thickness, maximum core loss 1.25 W/kg, (50 hz, 1.7T), U.S. grade M-4, in unslit coils having a width of 900mm or more and sold to slitters/laminators.
Product 2b.--Conventional GOES, 11 mil (0.27 mm.) thickness, maximum core loss 1.25 W/kg, (50 hz, 1.7T), U.S. grade M-4, not included in product 2a.
Product 3a.--Conventional GOES, 14 mil (0.35 mm.) thickness, maximum core loss 1.58W/kg, (50 hz, 1.7T), U.S. grade M-6, in unslit coils having a width of 900mm or more and sold to slitters/laminators.
9 Petitioners’ posthearing brief, pp. 8-9. 10 The product numbers refers to the products for which the Commission collected price data in the
preliminary phase of these investigations. In the final phase of these investigations, each product was subdivided based on comments received on the draft questionnaires. Products 1a-3a specify relatively wider product sold to slitters/laminators and products 4a and 5a specify product that is mechanically or chemically scribed/heart-proof GOES.

V-5
Co
nta
ins B
usin
ess Pro
prieta
ry Info
rma
tion
Product 3b.--Conventional GOES, 14 mil (0.35 mm.) thickness, maximum core loss 1.58W/kg, (50 hz, 1.7T), U.S. grade M-6, not included in product 3a. Product 4a.--Domain-refined high-permeability GOES, 9 mil (0.23mm.) thickness, maximum core loss 0.80 W/kg, (50 hz, 1.7T), U.S. grade H-O DR; mechanically or chemically scribed/heat-proof GOES. Product 4b.--Domain-refined high-permeability GOES, 9 mil (0.23mm.) thickness, maximum core loss 0.80 W/kg, (50 hz, 1.7T), U.S. grade H-O DR; laser-scribed/non-heat-proof GOES.
Product 5a.-- Domain-refined high-permeability GOES, 11 mil (0.27mm.) thickness, maximum core loss 0.90 W/kg, (50 hz, 1.7T), U.S. grade H-1 DR; mechanically or chemically scribed/heat-proof GOES.
Product 5b.-- Domain-refined high-permeability GOES, 11 mil (0.27mm.) thickness, maximum core loss 0.90 W/kg, (50 hz, 1.7T), U.S. grade H-1 DR; laser-scribed/non-heat-proof GOES.
Two U.S. producers and 7 importers provided usable pricing data for sales of the requested products, although not all firms reported pricing for all products for all quarters. There was also no data reported for product 5a. Pricing data reported by these firms accounted for approximately *** percent of U.S. producers’ shipments of product, *** percent of subject imports from China, *** percent of subject imports from the Czech Republic, *** percent of subject imports from Germany, *** percent of subject imports from Japan, *** percent of subject imports from Korea, *** percent of subject imports from Poland, *** percent of subject imports from Russia, and 38 percent all subject imports since 2011.
Petitioners’ contend that price data reported by importers for value added GOES and GOES with a different specified maximum core loss than specified in the product descriptions should not be included in the price comparisons.11 Staff excluded price products for valued added products and products for which was a different grade than the specified product. This included all of the price data identified by petitioners except for imports from Japan for product 4a ***.12 Staff also included price data for ***.
Price data for products 1a-5b are presented in Tables V-2 to V-9 and Figure V-2. Purchase prices by importers that internally consume GOES from *** and also purchase domestically produced GOES with the same product specifications are reported in Appendix D.
11 Petitioners’ prehearing brief, pp. 24-27. 12 Data for ***. ***. Staff interview with ***, July 30, 2014. ***. ***.

V-6
Co
nta
ins B
usin
ess Pro
prieta
ry Info
rma
tion
Table V-2
GOES: Weighted-average f.o.b. prices and quantities of domestic and imported product 1a and margins of underselling/(overselling), by quarters, January 2011-March 2014
* * * * * * *
Table V-3
GOES: Weighted-average f.o.b. prices and quantities of domestic and imported product 1b and margins of underselling/(overselling), by quarters, January 2011-March 2014
* * * * * * *
Table V-4
GOES: Weighted-average f.o.b. prices and quantities of domestic and imported product 2a and margins of underselling/(overselling), by quarters, January 2011-March 2014
* * * * * * *
Table V-5
GOES: Weighted-average f.o.b. prices and quantities of domestic and imported product 2b and margins of underselling/(overselling), by quarters, January 2011-March 2014
* * * * * * *
Table V-6
GOES: Weighted-average f.o.b. prices and quantities of domestic and imported product 3a and margins of underselling/(overselling), by quarters, January 2011-March 2014
* * * * * * *
Table V-7
GOES: Weighted-average f.o.b. prices and quantities of domestic and imported product 3b and margins of underselling/(overselling), by quarters, January 2011-March 2014
* * * * * * *
Table V-8
GOES: Weighted-average f.o.b. prices and quantities of domestic and imported products 4a and 4b and margins of underselling/(overselling), by quarters, January 2011-March 2014
* * * * * * *

V-7
Co
nta
ins B
usin
ess Pro
prieta
ry Info
rma
tion
Table V-9
GOES: Weighted-average f.o.b. prices and quantities of domestic and imported product 5b and margins of underselling/(overselling), by quarters, January 2011-March 2014
* * * * * * *
Figure V-2
GOES: Weighted-average prices and quantities of domestic and imported product, by quarters, January 2011-March 2014
* * * * * * *
Price trends
Most prices for price products decreased during January 2011 to March 2014. Table V-10 summarizes the price trends, by country and by product. As shown in the table, domestic price decreases ranged from about *** to *** percent during 2011 to the first quarter of 2014 while most import price decreased by amounts ranging up to 46 percent.13
Table V-10
GOES: Summary of weighted-average f.o.b. prices for product
* * * * * * *
Citing average unit value of trade data and U.S. producer shipment data, Japanese respondents indicate that prices for subject and nonsubject producers to the U.S. market and U.S. producers to export markets ***. They also claim that these data indicate that U.S. producers are price leaders because the average unit value for U.S. industry shipments fell by a *** amount.14
Japanese respondents also indicated that U.S.-producer prices fell because of a price war between the two U.S. producers. Japanese respondents stated that the price war was started by purchaser Howard Industries shifting its annual purchases of GOES of *** from Allegheny Ludlum to AK Steel due to a dispute over terms of their contract as well as the loss of approximately *** of exports sales.15
Petitioners claim that ***. Petitioners also claim that respondents’ theory of price competition between the two domestic producers would only explain price trends for sales to
13 Note that many of the import price series cover less than 10 observations. 14 Japanese respondents’ postconference brief, pp. 16-17, citing Petition Exhibit General-4 and
Exhibit General-9. 15 Japanese respondents’ postconference brief, pp. 19-20.

V-8
Co
nta
ins B
usin
ess Pro
prieta
ry Info
rma
tion
Howard Industries in 2013, while price declines occur throughout the period examined during these investigations.16
In response to the purchaser questionnaire, Howard Industries indicated that ***. It also reported that its purchasing decisions are made based on ***. See Part III of this report for the quantities, values, and average unit values of the GOES at issue in these transactions.
Price comparisons
As shown in table V-11, prices for GOES imported from subject countries were below those for U.S.-produced product in 65 of 90 instances; margins of underselling ranged from 0.2 to 28.6 percent. In the remaining 25 instances, prices for GOES from subject countries were between 0.1 to 18.1 percent above prices for the domestic product.
Table V-11
GOES: Instances of underselling/overselling and the range and average of margins, by country, January 2011-March 2014
Source
Underselling Overselling
Number of instances
Range (percent)
Average margin
(percent) Number of instances
Range (percent)
Average margin
(percent)
China 9 *** *** 9 *** ***
Czech Republic 15 *** *** 0 - -
Germany 16 *** *** 8 *** ***
Japan 1 *** *** 2 *** ***
Korea 17 *** *** 0 - -
Poland 1 *** *** 0 - -
Russia 6 *** *** 6 *** ***
Total 65 0.2 to 28.6 10.4 25 0.1 to 18.1 7.2
Source: Compiled from data submitted in response to Commission questionnaires.
Petitioners indicated that subject imports have undersold the corresponding domestic product in a majority of comparisons and by significant margins.17 Respondents argue that underselling was most frequently found where there was small volume of competition from subject imports.18 German respondents indicate that the price data for product 1b show that ***.19 AK Steel’s prices were lower than Allegheny Ludlum’s prices in *** instances for all price products for which both countries reported price data ***.
In the preliminary phase of these investigations, German respondents described any comparison of price data from Germany with U.S. price data as “meaningless.” They indicated
16 Petitioners’ posthearing brief, pp. 12-14. 17 Petitioners’ posthearing brief, p. 4. 18 JFE Steel posthearing brief, JFE Steel’s Responses to Commissioner’s Questions, p. 1 and Nippon’s
posthearing brief, pp. 9-10. 19 TKES posthearing brief, p. 2.

V-9
Co
nta
ins B
usin
ess Pro
prieta
ry Info
rma
tion
that it is likely that more than *** percent of the domestic price data is based on sales to end users, while virtually none of the imports for GOES from Germany are sold to end users.20 U.S. producers reported that more than *** percent of their overall shipments is to end users and less than *** percent were to slitters or laminators (see table II-1).
LOST SALES AND LOST REVENUE
The Commission requested U.S. producers of GOES to report any instances of lost sales or revenue they experienced due to competition from imports of GOES from subject countries since 2010. Of the two responding U.S. producers, *** reported that they had to either reduce prices, but *** indicated that it did not roll back announced price increases. The 33 lost sales allegations totaled $*** dollars and involved *** pounds (*** short tons) of GOES and the 28 lost revenue allegations totaled $*** and involved *** pounds (*** short tons) of GOES.21 Staff attempted to contact all purchasers and a summary of the information obtained follows.
Purchasers responding to the lost sales allegations also were asked whether they shifted their purchases of GOES from U.S. producers to suppliers of GOES from subject countries since 2011. In addition, they were asked whether U.S. producers reduced their prices in order to compete with suppliers of GOES from subject countries. Five of the eight responding purchasers reported that they had shifted purchases of GOES from U.S. producers to subject imports since 2010; two of these purchasers reported that price was the reason for the shift. Two of five purchasers reported that the U.S. producers had reduced their prices in order to compete with the prices of subject imports since 2010.
Petitioners claim that while purchasers occasionally disagreed with certain specific aspects of the allegations, they have essentially confirmed that subject imports displaced U.S. producers’ shipments with imports selling at lower prices. In particular, petitioners indicate that ABB confirmed the majority of the lost sales and lost revenue allegations concerning that company.22 ABB claims that it could not use specific offers from foreign suppliers in its negotiations with U.S. producers because it only has general intelligence on prevailing GOES prices in global markets and their probable direction over the coming year, but does not know the price imported GOES during its negotiations with U.S. producers. ABB also noted that ABB Inc. negotiates with U.S. suppliers while ABB, Ltd., in Zurich (***), negotiates with foreign producers on behalf of ABB, Inc. ***.23
20 TKES postconference brief, pp. 8-10. In this final phase of these investigations, price data were
collected separately for slitters and laminators and other channels of distribution for the price products for which sales of imports from Germany were reported in the preliminary phase.
21 These included two lost sales allegations for which ***. Email from ***, October 21, 2013. These did not include two lost sales and two lost revenue allegations that occurred before the petition was filed, but submitted by petitioning firms after the petition was filed. ***.
22 Petitioners’ prehearing brief, pp. 39-43. 23 Hearing transcript, p. 127 (Woolfort); Supplemental response to ***’s preliminary phase importer
questionnaire.

V-10
Co
nta
ins B
usin
ess Pro
prieta
ry Info
rma
tion
Respondents to the purchaser questionnaire reported increasing purchases of U.S. produced product by 952 short tons between 2011 and 2013, while their purchases of subject imports increased by 1,044 short tons. There was much variation in the change in purchases by each subject country with the largest increase in purchases for imports from Japan (*** short tons) and imports from China (*** short tons) and the largest declines in purchases for imports from Germany (*** short tons) and imports from Poland (*** short tons).
Table V-12
GOES: U.S. producers’ lost sales allegations
* * * * * * *
Table V-13
GOES: U.S. producers’ lost revenue allegations
* * * * * * *
VI-1
PART VI: FINANCIAL EXPERIENCE OF U.S. PRODUCERS
BACKGROUND
Two U.S. producers, AK Steel and Allegheny Ludlum, which together accounted for all U.S. production of GOES during January 2011 – March 2014, supplied financial data on their GOES operations.1 *** reported transfer sales of GOES to related firms; these sales accounted for *** percent of the industry’s 2013 sales values. The unit sales values of ***.2 Neither firm reported any internal consumption of GOES. Allegheny Ludlum’s submitted questionnaire data were verified at its Flat Rolled Products’ offices in Brackenridge, Pennsylvania.3
OPERATIONS ON GOES
Table VI-1 presents aggregate income-and-loss data for the U.S. producers. To summarize, the domestic GOES industry’s net sales quantities and values and its operating income all declined between 2011 and 2013. While the domestic industry reported *** in 2011 and 2012, the level declined from *** in 2011 to *** in 2012. From 2011 to 2012, the decrease in unit sales price (*** per short ton) in addition to the increase in unit total cost4 (by *** per short ton) resulted in a *** lower per-unit operating income in 2012. From 2012 to 2013, both net sales quantities and net sales values decreased further, with a *** lower per-unit sales value and a *** decreased per-unit total cost, which resulted in *** in 2013. The operating income of *** in 2012 changed to *** in 2013, reflecting both the decreases in unit sales value (by ***) and in unit total cost (by ***).
During January-March (“interim”) 2014, the domestic industry’s net sales were *** higher than in January-March 2013. The domestic industry’s *** in interim 2013, remained *** in interim 2014, reflecting primarily a lower per-unit total cost. As a result, the domestic industry’s operating margin, which was *** percent in interim 2013, settled at *** percent in interim 2014.
1 Both firms have their fiscal years ending December 31. 2 In response to the Commission staff’s inquiry, *** confirmed that ***. The transfer sales are ***. E-
mails from ***, October 24, 2013 and June 12 and 26, 2014. 3 Commission staff conducted a verification of Allegheny Ludlum’s questionnaire response on July 15-
17, 2014. There was no major issues or revisions that resulted from the verification (refer to the verification report issued on July 22, 2014).
4 Total cost is cost of goods sold (“COGS”) and selling, general, and administrative (“SG&A”) expenses combined.

VI-2
Table VI-1 GOES: Results of operations of U.S. producers, fiscal years 2011-13, January-March 2013, and January-March 2014
* * * * * * *
Table VI-2 presents selected company-by-company data. Total net sales (quantities and values), operating income (loss), the ratio of operating income (loss) to net sales, as well as per-unit values (sales, COGS, SG&A, and operating income), are presented in this table on a firm-by-firm basis. The differences between *** are also presented for comparison purposes.
Table VI-2
GOES: Results of operations of U.S. producers, by firm, fiscal years 2011-13, January-March 2013, and January-March 2014
* * * * * * *
AK Steel reported *** between 2011 and 2013 and *** in January-March 2014 than in
January-March 2013.Allegheny Ludlum reported *** between 2011 and 2013, but *** in January-March 2014 compared to January-March 2013. Both producers reported *** between 2011 and 2013. AK Steel reported a *** in interim 2014 compared to interim 2013 while Allegheny Ludlum reported a *** in interim 2014 compared to interim 2013.
***. ***.5 Part III of this report presents ***. Part IV of this report presents the quantity of U.S. imports of GOES from the seven subject countries.
AK Steel reported ***. However, as instructed ***.6 Neither firm reported any nonrecurring items for any period. Both producers reported ***.7 8
5 E-mail response from ***, June 12, 2014. 6 E-mails from ***, June 12, 2014 and October 24, 2013. 7 Based on Allegheny Technologies Incorporated’s Form 10-K submitted to the Securities and
Exchange Commission (“SEC”) for the twelve months of 2013, p. 6, Allegheny Technologies, Inc. has two business segments; High performance metals (48 percent of total revenues) and Flat-rolled products (52 percent of total revenues) segments. Flat-rolled products segment produces, converts and distributes stainless steel, nickel-based alloys, specialty alloys, and titanium and titanium-based alloys, in a variety of product forms including plate, sheet, engineered strip, and precision rolled strip products, as well as GOES. The operations in this segment are ATI Allegheny Ludlum, and the Chinese joint venture company known as Shanghai STAL Precision Stainless Steel Company Limited (STAL), in which it holds a 60 percent interest. Segment results included its 50 percent interest in the industrial titanium joint venture known as Uniti LLC. Based on From 10-K for the twelve months of 2013, p. 18, while the High performance metals segment generated an operating profit, the Flat-rolled products segment generated an operating loss. These reported results from continuing operations did not include corporate expenses and retirement benefit expenses (p. 80 of Form 10-K). E-mail from ***, June 24, 2014.
8 Based on AK Steel’s Form 10-K submitted to the Securities and Exchange Commission (“SEC”) for the twelve months of 2013 and 2012, AK Steel has six product categories; Stainless/Electrical, Coated,

VI-3
Tables VI-3 and VI-4 present the financial performance data of U.S. sales and export sales of GOES produced in the U.S., respectively.9 Profitability, in terms of operating income levels and margins, was generally *** higher for U.S. sales as compared to the overall financial data in table VI-1 and to the financial data for export sales in table VI-4. This trend was mainly attributable to the higher average unit sales prices of U.S. sales compared to export sales.10
Table VI-3 GOES: Results of U.S. sales of U.S. producers, fiscal years 2011-13, January-March 2013, and January-March 2014
* * * * * * *
Cold-Rolled, Tubular (these four are value-added products), Hot-Rolled, and Secondary (these two are non value-added). During 2013, shipment tonnage from Stainless/Electrical was 822 thousand tons (15.6 percent of total shipment tons of 5.3 million tons). AK Steel’s income from operations for 2013 was $21.4 million compared to a consolidated operating income of $135.8 million of AK Steel Holding Corporation for the same year. In 2012, shipment tonnage from Stainless/Electrical was 849 thousand tons (15.6 percent of total shipment tons of 5.4 million tons). AK Steel’s loss from operations for 2012 was $248 million compared to a consolidated operating loss of $128 million of AK Steel Holding Corporation for the same year. In its 2013 10-K, p. 33 and its 2012 10-K, p. 32, AK Steel notes that “it sells electrical steel products, which are iron-silicon alloys with unique magnetic properties, primarily to manufacturers of power transmission and distribution transformers and electrical motors and generators in the infrastructure and manufacturing markets. AK Steel continued to experience a decline in both its domestic and international sales of GOES products, due primarily to weak market demand and excess global capacity. Internationally, this reduction was caused principally by a decline in spending for new electric power transmission and distribution transformers. To a lesser extent, its international electrical sales were negatively impacted by the determination in a China trade case to impose duties on GOES imported from the U.S. The domestic GOES market likewise was negatively impacted by reduced maintenance and capital spending by utilities and the decline in the U.S. housing and construction markets, which principally drive the domestic need for new electrical transformers. Overall pricing for GOES continues to be well below pre-recession levels. In addition, AK Steel’s GOES shipment volume has been affected by changes in mix and by changes in production requirements to meet evolving quality requirements, principally for sales to the international market. Under current market conditions, its GOES production capacity is approximately 285,000 tons. As demand improves, it anticipates that it will be able to adjust its market mix and make other changes to increase its current capacity.”
9 ***. E-mail from ***, August 4, 2014. 10 Hearing transcripts, p. 43 and 55 (Kerwin), p. 67 (Petersen), p. 134 (Greenwald), p. 137, 163, and
201 (Husisian).
VI-4
Table VI-4 GOES: Results of export sales of U.S. producers, fiscal years 2011-13, January-March 2013, and January-March 2014
* * * * * * *
Selected aggregate per-short ton cost data of the producers on their operations, i.e., COGS and SG&A expenses, are presented in table VI-5. Overall per-short ton COGS and total cost (which includes SG&A expenses) increased *** between 2011 and 2013, ***. Per-unit SG&A expenses decreased during 2011-13. Per-short ton total costs were somewhat lower in interim 2014 compared to interim 2013, due to the *** (***). The ratio of total COGS to net sales increased *** between 2011 and 2013 (from *** percent to *** percent), but were *** lower in interim 2014 than in interim 2013 (*** percent compared to *** percent).
Table VI-5 GOES: Average unit costs of U.S. producers, fiscal years 2011-13, January-March 2013, and January-March 2014
* * * * * * *
A variance analysis for showing the effects of prices and volume on the producers’ sales of GOES, and of costs and volume on their total costs is presented in table VI-6.11 The information for this variance analysis is derived from table VI-1. The analysis indicates that the decrease in operating income between 2011 and 2013 (by ***) was the result of the combined negative effects of decreased price, increased per-unit costs and expenses and decreased sales volume. The summary at the bottom of the table illustrates the negative effects of decreased prices (***), increased costs and expenses (***), and lower sales quantities (***) between 2011 and 2013. The analysis indicates that the *** in operating income between 2011 and 2013 is primarily attributable to ***. Comparing the two interim periods, the variance analysis indicates that *** by ***, which resulted from the combined negative effects of lower prices (***) and increased sales volume (***, (***), offset by the positive effect of lower costs/expenses (***).
11 The Commission’s variance analysis is calculated in three parts: Sales variance, cost of sales
variance (COGS variance), and SG&A expense variance. Each part consists of a price variance (in the case of the sales variance) or a cost or expense variance (in the case of the COGS and SG&A expense variance), and a volume variance. The sales or cost/expense variance is calculated as the change in unit price or per-unit cost/expense times the new volume, while the volume variance is calculated as the change in volume times the old unit price or per-unit cost/expense. Summarized at the bottom of the table, the price variance is from sales; the cost/expense variance is the sum of those items from COGS and SG&A variances, respectively, and the net volume variance is the sum of the price, COGS, SG&A volume variance. All things equal, a stable overall product mix generally enhances the utility of the Commission’s variance analysis.

VI-5
Table VI-6 GOES: Variance analysis of operations of U.S. producers, fiscal years 2011-13, January-March 2013, and January-March 2014
* * * * * * *
CAPITAL EXPENDITURES AND RESEARCH AND DEVELOPMENT EXPENSES
Table VI-7 presents aggregate data on capital expenditures and research and development (“R&D”) expenses. Both producers reported capital expenditures. Capital expenditures decreased continuously and *** from 2011 to 2013. Capital expenditures were *** higher in 2011 (higher expenditures were mainly associated with ***, compared to 2012 and 2013. Data for capital expenditures on a firm-by-firm basis are shown in table VI-8.
Both producers reported R&D expenses (table VI-7). Allegheny Ludlum reported ***.12
Table VI-7 GOES: Capital expenditures and R&D expenses by U.S. producers, fiscal years 2011-13, January-March 2013, and January-March 2014
* * * * * * *
Table VI-8 GOES: Capital expenditures by U.S. producers, by firms, fiscal years 2011-13, January-March 2013, and January-March 2014
* * * * * * *
ASSETS AND RETURN ON ASSETS
Table VI-9 presents data on the U.S. producers’ total net assets and their return on assets. Total net assets decreased *** between 2011 and 2013, due primarily to lower capital expenditures in 2012 and 2013 compared to 2011 and ***. ***.13 At the same time, the return on assets decreased between 2011 and 2013 due to lower operating income during the same period. The trend of return on assets during 2011-13 was the same as the trend of the operating income (loss) margin shown in table VI-1.
12 E-mail response from ***, June 12, 2014. 13 E-mail responses from ***, June 12, 2014 and ***, June 12, 2014.

VI-6
Table VI-9
GOES: Value of assets and return on assets of U.S. producers, fiscal years 2011-13
* * * * * * *
CAPITAL AND INVESTMENT
The Commission requested U.S. producers to describe any actual negative effects on their return on investment, or their growth, investment, ability to raise capital, existing development and production efforts, or the scale of capital investments as a result of imports of GOES from China, Czech Republic, Germany, Japan, Korea, Poland, and Russia. Their comments are as follows:
Actual Negative Effects
AK Steel.–***
Allegheny Ludlum.–***
Anticipated Negative Effects
AK Steel.–***
Allegheny Ludlum.–***

VII-1
PART VII: THREAT CONSIDERATIONS AND INFORMATION ON NONSUBJECT COUNTRIES
Section 771(7)(F)(i) of the Act (19 U.S.C. § 1677(7)(F)(i)) provides that—
In determining whether an industry in the United States is threatened with material injury by reason of imports (or sales for importation) of the subject merchandise, the Commission shall consider, among other relevant economic factors1-- (I) if a countervailable subsidy is involved, such information as may be
presented to it by the administering authority as to the nature of the subsidy (particularly as to whether the countervailable subsidy is a subsidy described in Article 3 or 6.1 of the Subsidies Agreement), and whether imports of the subject merchandise are likely to increase,
(II) any existing unused production capacity or imminent, substantial increase in production capacity in the exporting country indicating the likelihood of substantially increased imports of the subject merchandise into the United States, taking into account the availability of other export markets to absorb any additional exports,
(III) a significant rate of increase of the volume or market penetration of imports of the subject merchandise indicating the likelihood of substantially increased imports,
(IV) whether imports of the subject merchandise are entering at prices that are likely to have a significant depressing or suppressing effect on domestic prices, and are likely to increase demand for further imports,
(V) inventories of the subject merchandise,
1 Section 771(7)(F)(ii) of the Act (19 U.S.C. § 1677(7)(F)(ii)) provides that “The Commission shall consider {these factors} . . . as a whole in making a determination of whether further dumped or subsidized imports are imminent and whether material injury by reason of imports would occur unless an order is issued or a suspension agreement is accepted under this title. The presence or absence of any factor which the Commission is required to consider . . . shall not necessarily give decisive guidance with respect to the determination. Such a determination may not be made on the basis of mere conjecture or supposition.”

VII-2
(VI) the potential for product-shifting if production facilities in the foreign country, which can be used to produce the subject merchandise, are currently being used to produce other products,
(VII) in any investigation under this title which involves imports of both a raw agricultural product (within the meaning of paragraph (4)(E)(iv)) and any product processed from such raw agricultural product, the likelihood that there will be increased imports, by reason of product shifting, if there is an affirmative determination by the Commission under section 705(b)(1) or 735(b)(1) with respect to either the raw agricultural product or the processed agricultural product (but not both),
(VIII) the actual and potential negative effects on the existing development and production efforts of the domestic industry, including efforts to develop a derivative or more advanced version of the domestic like product, and
(IX) any other demonstrable adverse trends that indicate the probability that there is likely to be material injury by reason of imports (or sale for importation) of the subject merchandise (whether or not it is actually being imported at the time).2
Information on the nature of the subsidies was presented earlier in this report; information on the volume and pricing of imports of the subject merchandise is presented in Parts IV and V; and information on the effects of imports of the subject merchandise on U.S. producers’ existing development and production efforts is presented in Part VI. Information on inventories of the subject merchandise; foreign producers’ operations, including the potential for “product-shifting;” any other threat indicators, if applicable; and any dumping in third-country markets, follows. Also presented in this section of the report is information obtained for consideration by the Commission on nonsubject countries.
2 Section 771(7)(F)(iii) of the Act (19 U.S.C. § 1677(7)(F)(iii)) further provides that, in antidumping investigations, “. . . the Commission shall consider whether dumping in the markets of foreign countries (as evidenced by dumping findings or antidumping remedies in other WTO member markets against the same class or kind of merchandise manufactured or exported by the same party as under investigation) suggests a threat of material injury to the domestic industry.”
VII-3
THE INDUSTRY IN CHINA
Overview
The petition identified four producers/exporters of GOES in China: (1) Wuhan Iron & Steel (“Wuhan”); (2) Baoshan Iron & Steel Co., Ltd. (subsidiary of Shanghai Baosteel Group Corporation) (“Baosteel”); (3) Anshan Iron & Steel Group Corporation (“Anshan”); and, (4) Hebei Shougang Qian'an Iron & Steel (“Shougang”). Wuhan and Baosteel are identified as the two largest producers of GOES in China, with reported annual production capacity of approximately 440,000 short tons and approximately 330,000 short tons, respectively. The petitioners indicated that Shougang began producing GOES in China during 2011 with an annual production capacity of approximately 165,000 short tons. They also indicated that Anshan, which began production of GOES in the same year with an annual production capacity of approximately 110,000 short tons, has expanded its GOES annual capacity to approximately 330,000 short tons.3 The petitioners contend that the Chinese GOES industry is the largest in the world.4
The Commission issued foreign producers’/exporters’ questionnaires to the four known firms identified I n the petition as producers or exporters of GOES from China. The Commission also transmitted the foreign producers’/exporters’ questionnaire to counsel representing the Government of China in the ongoing proceedings at Commerce.5 The Commission received a completed response from one firm in China: Baosteel. Baosteel reported that *** percent of its total sales in the most recent fiscal year were sales of GOES. Baosteel reported *** exports to the United States of GOES from China during January 2011-March 2014.6 According to the estimate requested of the responding Chinese producer, the production of GOES in China reported in this Part of the report accounts for approximately *** percent of overall production of GOES in China in 2013. In response to a question concerning changes in its GOES operations, Baosteel reported ***. Baosteel also reported ***.
Operations on GOES
Table VII-1 presents information on the GOES operations reported by Baosteel. Baosteel’s capacity increased by *** percent from 2011 to 2013. The reported capacity
3 Staff also contacted *** regarding its *** with Hunan Valin (“Valin”). The representative of *** stated that ***.
4 Petition, pp. 24-25; and petitioners’ postconference brief, pp. 40-41. 5 Counsel indicated that it forwarded the Commission request to the Government of China but
explained that it is not legal counsel to any of the individual Chinese producers of GOES and cannot provide any assurances on their behalf. Counsel also noted that it is not representing the Government of China in the Commission’s final phase injury investigation. Email from ***, June 20, 2014.
6 As discussed in greater detail below, Baosteel exports GOES coils to third countries where they are slit after which they are re-exported to the United States.

VII-4
remained unchanged in January-March 2013 relative to January-March 2014 and the Chinese producer reported that it projects no change in capacity from 2013 to 2015.7 Baosteel’s production in China increased by *** percent from 2011 to 2013, and was *** percent higher in January-March 2014 than in January-March 2013. Production is projected to increase by *** percent from 2013 to 2015. Baosteel’s capacity utilization increased from *** percent in 2011 to *** percent in 2012, before falling to *** percent in 2013. Capacity utilization was higher at *** percent in January-March 2014 compared with *** percent in January-March 2013.8 Baosteel’s capacity utilization is projected to be *** and *** percent in 2014 and 2015, respectively.
Table VII-1
GOES: Data for the responding producer in China (Baosteel), 2011-13, January-March 2013, January-March 2014, and projections 2014-15
* * * * * * *
In 2013, *** percent of total shipments of GOES produced by Baosteel were shipped to the commercial home market in China. The company reported *** internal consumption/ transfers of GOES (only in ***) and *** exports of GOES from China to the United States since January 2011. The firm’s exports to markets other than the United States, primarily ***, accounted for *** percent of its total shipments of GOES in 2013.
Although Baosteel did not export directly to the United States, it exported to processors located in Canada and Mexico that slit the GOES coils to customer specifications, store the slit GOES in facilities for resale to the United States, and re-sell the slit GOES to the United States when customers request just-in-time delivery.9 Since these Canadian and Mexican processors sell GOES to U.S. customers, Baosteel reports that it is not the U.S. importer of record for the slit GOES sold to U.S. customers. However, the GOES that is ultimately imported into the United States retains its Chinese origin because slitting is not a significant manufacturing operation.10 Baosteel sold *** short tons of master width coils to processors at a value of *** in 2011 and sold *** short tons at a value of *** by 2013.11 Baosteel reported that it was unaware of any antidumping and/or countervailing duty findings, remedies, or proceedings in countries other than the United States for the GOES it exports.
The Commission sought information from subject producers in China concerning current and future U.S. Department of Energy (“DOE”) regulations or other U.S. state or federal regulations (e.g., the implementation of the 2007 regulations referred to as TSL-2 and the DOE
7 Baosteel reported that its production capacity ***. 8 Baosteel’s reported production *** its reported capacity by *** short tons during January-March
2014. 9 Baosteel’s posthearing brief, pp. 7. 10 Baosteel’s posthearing brief, pp. 8. 11 Baosteel’s posthearing brief, exhibit 6.
VII-5
2016 efficiency requirements for distribution transformers) and the effect of such regulations on their ability to supply the U.S. market. Baosteel responded ***.
Alternative products
Baosteel reported ***. Data regarding Baosteel’s overall GOES facility capacity and production, by type of GOES, are presented in table VII-2. These data show that, although conventional GOES accounted for *** percent of total GOES production by Baosteel during 2011, *** of total GOES production during 2013 was conventional product. High-permeability, non-domain-refined GOES accounted for *** of GOES produced in China by Baosteel from 2011 to 2013, declining from *** percent of Baosteel’s GOES production during 2011 to *** percent in 2013. High-permeability, non-domain-refined GOES accounted for *** of Baosteel’s GOES production during the first quarter of 2014. High-permeability, domain-refined (laser-scribe/non heat-proof) GOES accounted for *** of Baosteel’s Chinese production during 2011-13. Baosteel reported *** production of high-permeability, domain-refined (mechanically or chemically-scribed/heat-proof) GOES during January 2011-March 2014. Table VII-2
GOES: Overall plant capacity, production, and capacity utilization in China (Baosteel), 2011-13, January-March 2013, and January-March 2014
* * * * * * *
THE INDUSTRY IN THE CZECH REPUBLIC
Overview
ArcelorMittal Frýdek-Místek A.S. (“Frýdek-Místek”), a subsidiary of ArcelorMittal S.A., is the sole producer of GOES in the Czech Republic. The Commission issued a foreign producer questionnaire to Frýdek-Místek and received a completed response. Frýdek-Místek reported that *** percent of its total company sales in the most recent fiscal year were sales of GOES. Although a comparison of Frýdek-Místek’s export data to official Commerce import statistics shows that in 2013 it accounted for *** percent of U.S. imports from the Czech Republic, the producer confirmed that it accounts for all production of GOES in the Czech Republic.12 In response to a question concerning changes in its GOES operations, Frýdek-Místek reported ***.
Operations on GOES
Table VII-3 presents information on the GOES operations of the responding producer in the Czech Republic.
12 As explained in more detail in the following section, Frýdek‐Místek indicated ***.

VII-6
Table VII-3 GOES: Data for the producer in the Czech Republic (Frýdek-Místek), 2011-13, January-March 2013, January-March 2014, and projections 2014-15
* * * * * * *
Frýdek-Místek’s annual capacity to produce GOES has remained unchanged at *** short tons since 2011 and is projected to remain unchanged in 2014 and 2015.13 Reported production in the Czech Republic increased by *** percent from 2011 to 2013, and was *** percent higher in January-March 2014 than in January-March 2013. Production is projected to increase by *** percent from 2013 to 2014, before falling *** in 2015. Frýdek-Místek’s capacity utilization also has increased consistently since 2011.
In 2013, *** percent of total shipments of GOES produced by Frýdek-Místek in the Czech Republic was exported to markets other than the United States, predominantly in ***, and *** percent of total shipments were shipped to the commercial home market. The company reported *** internal consumption/transfers of GOES since January 2011. Frýdek‐Místek reported that it was unaware of any antidumping and/or countervailing duty findings, remedies, or proceedings in countries other than the United States for the GOES it exports.
Frýdek‐Místek reported that, in 2013, *** percent of total shipments of GOES from the Czech Republic was exported to the United States. It indicated, however, ***. U.S. imports from the Czech Republic reported by *** are as follows: ***. *** reported U.S. imports from the Czech Republic of ***. Using Frýdek‐Místek’s suggested methodology of calculating the volume of Czech GOES exported to the United States (i.e., the sum of the Frýdek‐Místek exports as reported in its foreign producer questionnaire response plus the U.S. imports ***), reported Czech GOES exports to the United States are presented in the following tabulation:
* * * * * * *
These data, however, do not include ***’s shipments of Czech GOES to Canada for slitting and subsequent re-export to the United States ***. In an effort to assess the nature of Czech-origin GOES shipments that appear to be entering the United States (either directly or through Canada), the Commission requested additional shipment data from *** for GOES produced by Frýdek‐Místek in the Czech Republic broken out by shipments to: (1) the United States (***), (2) the United States (companies other than ***), (3) Canada (***), and (4) Canada (other than ***). *** did not provide the Commission with the information it requested. Instead, it provided the following response: “***.”14
The Commission sought information from the subject producer in the Czech Republic concerning current and future U.S. Department of Energy (“DOE”) regulations or other U.S.
13 Frýdek-Místek indicated that the capacity data reported are based on ***. 14 Email from ***, July 7, 2014. ***. See email from ***, July 2, 2014.
VII-7
state or federal regulations (e.g., the implementation of the 2007 regulations referred to as TSL-2 and the DOE 2016 efficiency requirements for distribution transformers) and the effect of such regulations on their ability to supply the U.S. market. Frýdek-Místek did not provide a response to the Commission’s questions.
Alternative products
Frýdek-Místek reported ***. Data regarding Frýdek-Místek’s overall plant capacity and production, by type of item produced, are presented in table VII-4. These data show that production of ***. *** accounted for *** percent of total plant production in 2011, *** percent in 2012, and *** percent in 2013. Production of *** was *** in January-March 2014 than reported in January-March 2013. Production of the conventional GOES product, which is the only type of GOES produced in the Czech Republic, accounted for *** of items produced in Frýdek-Místek’s facility since 2011, ranging from *** percent of overall plant production in 2011 to *** percent in January-March 2013. Table VII-4 GOES: Overall plant capacity, production, and capacity utilization in the Czech Republic (Frýdek-Místek), 2011-13, January-March 2013, and January-March 2014
* * * * * * *
THE INDUSTRY IN GERMANY
Overview
ThyssenKrupp Electrical Steel GmbH (“TKES”) is the sole producer of GOES in Germany. TKES is a subsidiary of ThyssenKrupp Steel Europe AG (“TKS-Europe”), which is one of the six business areas of ThyssenKrupp AG (“TKAG”). The ThyssenKrupp group also operates GOES manufacturing facilities in Isbergues, France and Nashik, India. TKES published a press release in April 2013, stating that GOES produced in Germany, France and India will be sold in order to improve competitiveness and profitability.15 ***.
The Commission issued a foreign producer questionnaire to TKES and received a completed response. TKES reported that *** percent of its total company sales in the most recent fiscal year were sales of GOES and that it accounts for all production of GOES in Germany. A comparison of TKES’s export data to official Commerce import statistics shows that in 2013 it accounted for *** percent of U.S. imports from Germany. In response to a question concerning changes in its German GOES operations, TKES reported under the category ***.
15 TKES’s posthearing brief, exhibit E.

VII-8
Operations on GOES
Table VII-5 presents information on the GOES operations of the sole producer in Germany. TKES’ annual capacity to produce GOES fell by *** percent from 2011 to 2013, but is projected to remain at the 2013 level (*** short tons) in 2014 and 2015.16 Reported production in Germany fell by *** percent from 2011 to 2013, but was *** percent higher in January-March 2014 than in January-March 2013. Production by TKES in Germany is projected to increase by *** percent from 2013 to 2015. TKES’s capacity utilization fluctuated between a high of *** percent in 2012 to a low of *** percent in January-March 2013.
In 2013, *** percent of total shipments of GOES produced in Germany was exported to the United States. Exports of GOES from Germany to the United States have generally fallen since 2011, with *** exports of GOES from Germany to the United States reported for the first quarter of 2014 and *** expected for calendar year 2015. In 2013, *** percent of total shipments of GOES produced in Germany were exported to markets other than the United States, predominantly in ***, and *** percent of total German shipments were shipped to the commercial home market. The company reported *** internal consumption/transfers of GOES since January 2011. TKES reported that it was unaware of any antidumping and/or countervailing duty findings, remedies, or proceedings in countries other than the United States for the GOES it exports.
Table VII-5 GOES: Data for the producer in Germany (TKES), 2011-13, January-March 2013, January-March 2014, and projections 2014-15
* * * * * * *
The Commission sought information from the subject producer in Germany concerning current and future U.S. Department of Energy (“DOE”) regulations or other U.S. state or federal regulations (e.g., the implementation of the 2007 regulations referred to as TSL-2 and the DOE 2016 efficiency requirements for distribution transformers) and the effect of such regulations on their ability to supply the U.S. market. TKES responded ***.
Alternative products
Data regarding TKES’s overall plant capacity and production, by type of item produced, are presented in table VII-6. TKES reported ***. However, TKES did report the residual production of *** at its facility (reported as “all other products” in table VII-6). This *** product accounted for *** percent of total facility production during 2013. These data show that *** accounted for between *** and *** percent of total plant production in every period since 2011 and domain-refined (laser-scribed/non heat-proof) and non-domain-refined high-permeability GOES accounted for *** and *** percent of total plant production in 2013, respectively.
16 TKES reported that its production capacity is based upon ***.

VII-9
Table VII-6 GOES: Overall plant capacity, production, and capacity utilization in Germany (TKES), 2011-13, January-March 2013, and January-March 2014
* * * * * * *
THE INDUSTRY IN JAPAN
Overview
There are two producers of GOES in Japan: JFE Steel Corp. (“JFE”) and Nippon Steel & Sumitomo Metal Corp. (“Nippon”). The Commission issued foreign producers’ questionnaires to these two firms in Japan and responses to the Commission’s questionnaire were received from both firms. *** is the larger of the two Japanese GOES producers, accounting for *** percent of total GOES production in Japan during 2013. JFE reported that *** percent of its total company sales in the most recent fiscal year were sales of GOES. Nippon reported that *** percent of its total company sales in the most recent fiscal year were sales of GOES. The two firms indicate that together they account for all production of GOES in Japan. A comparison of questionnaire export data to official Commerce import statistics shows that in 2013, JFE and Nippon together accounted for *** percent of U.S. imports from Japan. In response to a question concerning changes in its Japanese GOES operations since January 2011, Nippon indicated that, on October 1, 2012, Nippon Steel Corp. and Sumitomo Metal Industries, Ltd. merged. Nippon added that, prior to the merger, Sumitomo Metal Industries, Ltd. did not produce GOES. JFE reported ***.
The Commission asked the producers of GOES in Japan whether they anticipate any changes in the character of their operations or organization relating to the production of GOES in the future. Nippon indicated ***, but JFE indicated ***.
Operations on GOES
Table VII-7 presents information on the GOES operations of the two producers in Japan. The annual capacity reported by JFE to produce GOES in Japan *** throughout all periods since 2011 at *** short tons and is projected to *** in 2014 and 2015.17 Nippon’s reported annual capacity to produce GOES *** from *** short tons in 2011 to *** short tons in 2012 and 2013. The firm’s reported capacity was *** in January-March 2014 than in January-March 2013.18 Aggregate Japanese capacity to produce GOES was *** short tons in 2013 but company projections indicate that aggregate capacity will fall to *** short tons in 2014 before rising to *** short tons in 2015. Reported production in Japan fell overall by *** percent from 2011 to 2013, and was *** percent lower in January-March 2014 than in January-March 2013. GOES production in Japan is projected to increase by *** percent from 2013 to 2014 and 2015. Capacity utilization in Japan fell from *** in 2011 to *** in 2013, and was lower at *** percent
17 JFE noted ***. 18 Nippon indicated ***.

VII-10
in January-March 2014 than reported in January-March 2013. Projections indicate that capacity utilization in Japan is expected to increase over 2013 levels to *** percent in 2014 before a slight decline to *** percent in 2015.
Table VII-7 GOES: Data for producers in Japan (JFE and Nippon), 2011-13, January-March 2013, January-March 2014, and projections 2014-15
* * * * * * *
In 2013, *** percent of total shipments of GOES produced in Japan was exported to the United States. Exports of GOES from Japan to the United States increased overall by *** percent from 2011 to 2013. Exports of Japanese GOES to the United States were lower in January-March 2014 than in January-March 2013 and projections indicated that exports to the United States will be lower in 2014 and 2015 than reported in 2013. *** share of total GOES shipments made by Japanese producers is accounted for by exports to markets other than the United States. In 2013, *** percent of total shipments of GOES produced in Japan were exported to markets other than the United States. JFE reported that its export markets other than the United States were primarily *** and Nippon reported that its other export markets were ***. Commercial home market shipments accounted for *** percent of total Japanese shipments in 2013. There were *** internal consumption/transfers of GOES reported by the Japanese producers since January 2011. JFE and Nippon reported that they were unaware of any antidumping and/or countervailing duty findings, remedies, or proceedings in countries other than the United States for the GOES they export.
The Commission sought information from subject producers in Japan concerning current and future U.S. Department of Energy (“DOE”) regulations or other U.S. state or federal regulations (e.g., the implementation of the 2007 regulations referred to as TSL-2 and the DOE 2016 efficiency requirements for distribution transformers) and the effect of such regulations on their ability to supply the U.S. market. The Japanese producers responded that their ability to supply the U.S. market has not changed since 2011 due to changes in such regulations introduced by the U.S. Department of Energy or other U.S. state or federal agencies related to the production of transformers and that their sales of GOES in the U.S. market have *** by the revised U.S. Department of Energy efficiency requirements for distribution transformers, effective 2016.
Alternative products
Neither JFE nor Nippon reported ***. Aggregate data regarding the Japanese producers’ overall plant capacity and production, by type of item produced, are presented in table VII-8. These data show that *** accounted for *** percent of total plant production in 2013, domain-refined (laser-scribed/non heat-proof) and non-domain-refined high-permeability GOES accounted for *** and *** percent of total plant production in 2013, respectively. Both JFE and Nippon reported production of domain-refined (mechanically or chemically-scribed/heat-proof) GOES, which accounted for *** percent of total Japanese plant production in 2013. None of the

VII-11
other subject countries (nor the United States) reported production of domain-refined (mechanically or chemically-scribed/heat-proof) GOES since January 2011. Table VII-8 GOES: Overall plant capacity, production, and capacity utilization in Japan (JFE and Nippon), 2011-13, January-March 2013, January-March 2014
* * * * * * *
The Japanese respondents argue that GOES imports from Japan do not compete with products manufactured in the United States for the U.S. market because most *** of the imported Japanese GOES is “heat-proof” product for the high-end, premium GOES market that uses proprietary, patent-protected domain-refined processes. In addition, Japanese imports of heat-proof GOES have *** as a percentage of its U.S. GOES shipments. This premium heat-proof GOES imported from Japan is used in specialty transformers where small size, high efficiency, and low noise are at a premium. The Japanese respondents argue that the Commission should not cumulate imports from Japan with other subject imports because this premium product is not produced in the United States and is not imported into the United States from any other country.19 Table IV-8 in Part IV of this report presents U.S. shipments of imports from Japan, by type, for data concerning high-permeability, domain-refined, heat-proof GOES, as well as other types of Japanese GOES imported into the United States.
THE INDUSTRY IN KOREA
Overview
POSCO is the sole producer of GOES in Korea and the sole exporter of GOES from Korea to the United States. The Commission issued a foreign producer questionnaire to POSCO and received a completed response. POSCO reported that *** percent of its total sales in the most recent fiscal year were sales of GOES. A comparison of POSCO’s export data to official Commerce import statistics shows that in 2013 it accounted for *** percent of U.S. imports from Korea. POSCO reported that *** percent of its exports to the United States are made through its related U.S importer, POSCO-America. In response to a question concerning changes in its Korean GOES operations since January 1, 2011, POSCO reported ***. The firm also reported that it does not anticipate any changes in the character of its operations or organization relating to the production of GOES in the future.
Operations on GOES
Table VII-9 presents information on the GOES operations of POSCO, the sole producer and exporter in Korea. The annual capacity reported by POSCO to produce GOES in Korea
19 JFE’s prehearing brief, pp.37-39; JFE’s posthearing brief, p. 10; Nippon’s prehearing brief, p. 14.

VII-12
remained constant since 2011 at *** short tons per year and is projected to remain the same in 2014 and 2015.20 POSCO’s production in Korea increased by *** percent from 2011 to 2012, but fell by *** percent in 2013. Production is projected to be *** percent higher in 2014 and 2015 than in 2013. Capacity utilization increased from *** percent in 2011 to *** percent in 2012, but fell to *** percent in 2013. Projections indicate that capacity utilization is expected to increase to *** in 2014 and 2015.
Table VII-9
GOES: Data for the producer in Korea (POSCO), 2011-13, January-March 2013, January-March 2014, and projections 2014-15
* * * * * * *
Commercial home market shipments accounted for *** percent of total Korean shipments in 2013 and POSCO reported *** internal consumption/transfers of GOES since January 2011. In 2013, *** percent of total shipments were exported to other markets, predominantly ***, whereas *** percent of total shipments of GOES from Korea was exported to the United States. Exports of GOES from Korea to the United States increased from *** short tons in 2011 to *** short tons in 2012, before declining to *** short tons in 2013. Exports of GOES to the United States were lower in January-March 2014 than in January-March 2013. Company projections indicate that exports to the United States are expected to be *** percent higher in 2015 than reported in 2013. POSCO reported that it is unaware of any antidumping and/or countervailing duty findings, remedies, or proceedings in countries other than the United States for the GOES it exports.
The Commission sought information from subject producers in Korea concerning current and future U.S. Department of Energy (“DOE”) regulations or other U.S. state or federal regulations (e.g., the implementation of the 2007 regulations referred to as TSL-2 and the DOE 2016 efficiency requirements for distribution transformers) and the effect of such regulations on their ability to supply the U.S. market. The Korean producer responded that its ability to supply the U.S. market has ***.
Alternative products
POSCO reported ***. Data regarding POSCO’s overall plant capacity and production, by type of item
produced, are presented in table VII-10. These data show that *** accounted for *** of POSCO’s total plant production: *** percent of total plant production in 2011, *** percent in 2012, and *** percent in 2013. POSCO’s production of *** fell by *** percent from *** short tons in 2011 to *** short tons in 2013, and was *** percent lower in January-March 2014 than reported in January-March 2013.
20 POSCO indicated ***.

VII-13
Production of the conventional GOES product by POSCO, which accounted for the *** share of GOES production, accounted for *** percent of POSCO’s total plant production in 2013. Domain-refined (laser-scribed/non heat-proof) and non-domain-refined high-permeability GOES accounted for *** and *** percent of POSCO’s total plant production in 2013, respectively. Table VII-10 GOES: Overall plant capacity, production, and capacity utilization in Korea (POSCO), 2011-13, January-March 2013, and January-March 2014
* * * * * * *
THE INDUSTRY IN POLAND
Overview
The petition identified one producer of GOES in Poland: Stalprodukt S.A. (“Stalprodukt”). The Commission issued a foreign producers’ questionnaire to Stalprodukt, but the company did not submit a response to the Commission’s request for information. The petitioner argued that Stalprodukt is “heavily focused on exports, with an increasing share targeted for the U.S. market.”21 According to Global Trade Atlas data presented in table VII-11, total exports of GOES from Poland during 2013 amounted to 107,146 short tons, 51.0 percent of which was exported to the Czech Republic, India, and Germany. Although larger amounts were exported to the United States during 2011 and 2012, only 0.7 percent of total exports of GOES from Poland was exported to the United States during 2013.
In 2010, Stalprodukt completed a capacity expansion of its GOES facility from approximately 66,000 short tons to approximately 110,000 short tons per year. In addition, Stalprodukt noted in its 2011 annual report the production of new steel grades (i.e., HiB sheets or high-permeability GOES) was projected to launch during 2013.22
21 Petition, p. 27. 22 Stalprodukt Annual Report 2011,
http://www.stalprodukt.com.pl/pub/File/RAPORTY_EN/roczne/raport%20roczny%202011.pdf.

VII-14
Table VII-11 GOES: Exports from Poland, by country market, 2011-13
Country
Calendar year
2011 2012 2013
Quantity (short tons)
Czech Republic 343 3,990 30,393
India 27,291 23,046 12,684
Germany 10,029 9,083 11,547
China 6,616 4,666 6,486
Italy 7,173 5,885 6,020
Austria 1,922 3,825 5,886
Brazil 672 1,588 5,009
Ukraine 7,696 6,462 5,008
Croatia 2,572 1,425 4,856
Hungary 3,218 1,796 4,280
United States 4,039 4,700 798
All other 32,973 23,229 14,182
World 104,544 89,699 107,145
Share of quantity (percent)
Czech Republic 0.3 4.4 28.4
India 26.1 25.7 11.8
Germany 9.6 10.1 10.8
China 6.3 5.2 6.1
Italy 6.9 6.6 5.6
Austria 1.8 4.3 5.5
Brazil 0.6 1.8 4.7
Ukraine 7.4 7.2 4.7
Croatia 2.5 1.6 4.5
Hungary 3.1 2.0 4.0
United States 3.9 5.2 0.7
All other 31.5 25.9 13.2
World 100.0 100.0 100.0
Source: Global Trade Atlas, 7225.11 and 7226.11.
Stalprodukt’s home market and export sales of transformer sheets and strips for 2011 and 2012 are presented in the following tabulation (in short tons):
Item 2011 2012
Home market sales 7,934 7,452
Export sales 104,592 84,997
Total sales 112,527 92,449
Source: Annual Consolidated Financial Statement of Stalprodukt S.A. Capital Group for year 2012, pp. 4-6.
These data show that most of Stalprodukt’s total sales in 2012 (91.9 percent) was for export markets. Stalprodukt’s total sales of transformer sheets and strips declined by 17.8 percent from 112,527 short tons in 2011 to 92,449 short tons in 2012. The company noted that

VII-15
a larger decline in sales volume was recorded in exports sales (18.7 percent) than in home market sales (6.1 percent). It explained that “the sales volume decline was partly caused by unfavorable market conditions, resulting from the reduction of demand and presence of excessive production capacity on a global scale.” It added, however, that “the reduction of output and sales was caused, in a greater degree, by the implemented investments program, connected with the start-up of the HiB technology. It caused switch-offs and stoppages of some production lines, reducing the production capacity of the sheets segment, especially in the second half of the previous year.”23
According to Stalprodukt, total sales volumes of electrical sheets continued falling throughout 2013 on the magnitude of 10-18 percent. The firm reported, however, that the sales volumes were the maximum achievable level, “considering the switch-off of approximately 30 percent of the production equipment, related to the modernization works aimed at the launching of the advanced transformer sheets (HiB) technology.” The firm also reported further declines in sales prices of both conventional and high (HiB) grades were caused by excessive global production capacity, especially with respect to China’s “expansionist policy.” It also stated that “all the world-renowned manufacturers of electrical grain-oriented steel sheets, without any exceptions, suffer from the clearly deteriorating conditions in the metallurgical industry.” It noted that the low level of global prices, deteriorating financial results, and global overproduction have led to “price wars.” 24
The quantity and value of Stalprodukt’s domestic sales of electrical steel fell during the first half of 2013 by almost two thirds compared with the same period in 2012 and the quantity and value its export sales fell by nine percent and 27 percent, respectively, in the same period. The firm reported that its exports accounted for 96.4 percent of its total electrical steel sales and that its domestic sales accounted for 3.6 percent during the first half of 2013. Stalprodukt’s exports during January-June 2013 were destined for the following markets (shares of total exports): India (19.6 percent), Germany (14.2 percent), China (12.5 percent), Austria (7.6 percent), Brazil (6.3 percent), Italy (6.2 percent), and Croatia (5.9 percent).25
THE INDUSTRY IN RUSSIA
Overview
The Commission issued foreign producers’ or exporters’ questionnaires to the following two firms believed to produce GOES in Russia: Novolipetsk Steel (“NLMK”) and Public Joint
23 Annual Consolidated Financial Statement of Stalprodukt S.A. Capital Group for year 2012, pp. 4-6. 24 Consolidated Financial Statement of Stalprodukt S.A. Capital Group for first half 2013; Abridged
Interim Consolidated Financial Report of Stalprodukt S.A. Capital Group for 3rd Quarter of 2013, Additional Information; and Interim Consolidated Financial Report of Stalprodukt S.A. Capital Group for 4th Quarter of 2013.
25 Consolidated Financial Statement of Stalprodukt S.A. Capital Group for first half 2013.

VII-16
Stock Company Ashinskiy Metallurgical Works (“Ashinskiy”).26 Useable responses to the Commission’s questionnaire were received from both firms. NLMK is, ***, the larger of the two Russian producers, accounting for *** percent of total GOES production in Russia during 2013. Ashinskiy reported that *** percent of its total company sales in the most recent fiscal year were sales of GOES. NLMK reported that *** percent of its total company sales in the most recent fiscal year were sales of GOES. According to estimates requested of the responding Russian producers, the production of GOES in Russia reported in this part of the report is believed to account for all production of GOES in Russia. A comparison of questionnaire U.S. export data to official Commerce import statistics shows that during January 2011-March 2014, NLMK and Ashinskiy together accounted for *** percent of U.S. imports from Russia. In response to questions concerning changes in GOES operations in Russia, NLMK and Ashinskiy indicated that their firms had experienced no such changes and do not anticipate any changes to their GOES operations in Russia.
Operations on GOES
Table VII-12 presents information on the GOES operations of the responding producers in Russia. Aggregate Russian capacity to produce GOES increased overall by *** percent from *** short tons in 2011 to *** short tons in 2013.27 Reported production in Russia increased by *** percent from 2011 to 2012, but was *** percent lower in 2013 than in 2012. GOES production in Russia is projected to increase by *** percent from 2013 to 2015. Capacity utilization in Russia fell from overall from *** percent in 2011 to *** percent in 2013, but was higher at *** percent in January-June 2014 than in January-June 2013. Projections indicate that capacity utilization in Russia is expected to increase to *** percent in 2015.
Table VII-12 GOES: Data for producers in Russia (Ashinskiy and NLMK), 2011-13, January-March 2013, January-March 2014, and projections 2014-15
* * * * * * *
*** share of total GOES shipments made by Russian producers is accounted for by exports to markets other than the United States. In 2013, *** percent of total shipments of GOES produced in Russia were exported to markets other than the United States. Ashinskiy reported that its export markets other than the United States were primarily *** and NLMK
26 These firms were identified through a review of information submitted in the petition and contained in ***. The Russian respondents also indicated that, in addition to U.S. imports of regular standard GOES produced by NLMK and Ashinskiy in Russia, substandard GOES obtained from dismantled used transformers is exported to the United States by Russian exporter Asero. Postconference brief of the Ministry of Economic Development of the Russian Federation, p. 2. Asero is not identified as a Russian exporter or producer of GOES in ***.
27 The Commission asked producers to describe the methodology used to calculate production capacity. ***.

VII-17
reported that its other export markets were ***. Commercial home market shipments accounted for *** percent of total Russian shipments in 2013. There were *** internal consumption/transfers of GOES reported by the Russian producers since January 2011. Ashinskiy indicated that it was unaware of any antidumping and/or countervailing duty findings, remedies, or proceedings in countries other than the United States for the GOES it exports. NLMK noted that the GOES it exports became subject to a finding in China on October 4, 2010.
The Russian producers also reported that exports of GOES from Russia to the United States increased from *** short tons in 2011 to *** short tons in 2012. In calendar year 2013, *** short tons of GOES produced in Russia was exported to the United States and in the first quarter of 2014, *** short tons were exported to the United States. Projections indicate that exports to the United States are expected to fall to *** in 2015.
NLMK contends that the conventional grades of GOES produced in Russia cannot compete with the higher grades required under the 2007 DOE regulations for transformer production and that these regulations have effectively prevented NLMK’s sales to the United States. The market has shifted to higher efficiency products since distribution transformers must be produced with grades of M2, M3 or higher, which NLMK cannot provide. 28 A continuum of GOES existed before 2007, allowing substitution among grades. DOE regulations eliminate the continuum since lower grades of GOES cannot be used to produce distribution transformers. Prior to the new DOE regulations, GOES were regulated under DOE regulation TSL-1, which could be met by using GOES grades M2 through M6. However, the 2007 DOE regulations can only be met by using GOES grades of M3, M2, or higher. 29
The Commission sought information from subject producers in Russia concerning current and future DOE regulations or other U.S. state or federal regulations (e.g., the implementation of the 2007 regulations referred to as TSL-2 and the DOE 2016 efficiency requirements for distribution transformers) and the effect of such regulations on their ability to supply the U.S. market. Russian producer Ashinskiy responded that its ability to supply the U.S. market ***. NLMK responded that its ability to supply the U.S. market ***.
Alternative products
In response to a Commission request for information concerning the production of products other than GOES, NLMK and Ashinskiy reported ***. NLMK’s overall plant capacity and production data, by type of item produced, indicate that the Russian GOES producer manufactures only *** in its facility. Ashinskiy’s data indicate that the producer manufactures *** in its facility.
Data regarding the Russian producers’ overall plant capacity and production, by type of item produced, are presented in table VII-13. These aggregate data show that *** accounted for *** total plant production in Russia with *** accounting for *** of total production in Russia.
28 NLMK’s posthearing brief, p. 10. 29 NLMK’s prehearing brief, p. 18.

VII-18
Table VII-13
GOES: Overall plant capacity, production, and capacity utilization in Russia (Ashinskiy and NLMK), 2011-13, January-March 2013, and January-March 2014
* * * * * * *
COMBINED SUBJECT COUNTRY DATA
Table VII-14 presents information on GOES operations of the reporting producers and exporters in the subject countries.
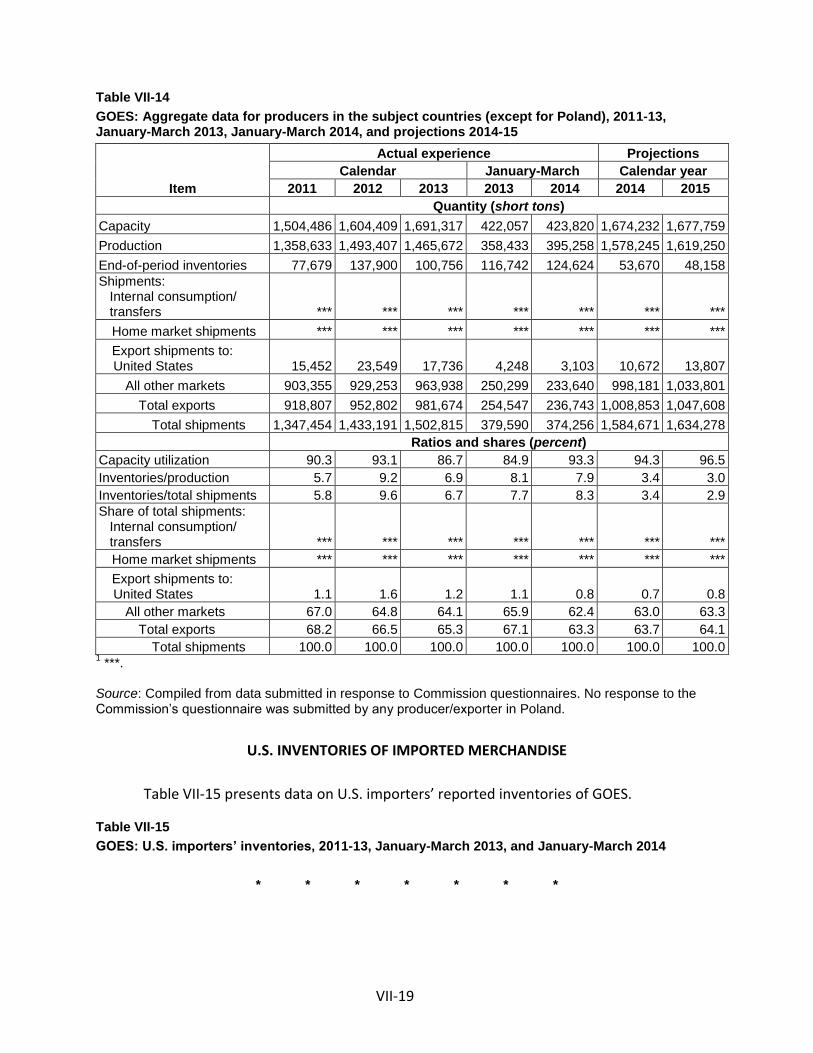
VII-19
Table VII-14
GOES: Aggregate data for producers in the subject countries (except for Poland), 2011-13, January-March 2013, January-March 2014, and projections 2014-15
Item
Actual experience Projections
Calendar January-March Calendar year
2011 2012 2013 2013 2014 2014 2015
Quantity (short tons)
Capacity 1,504,486 1,604,409 1,691,317 422,057 423,820 1,674,232 1,677,759
Production 1,358,633 1,493,407 1,465,672 358,433 395,258 1,578,245 1,619,250
End-of-period inventories 77,679 137,900 100,756 116,742 124,624 53,670 48,158
Shipments: Internal consumption/ transfers *** *** *** *** *** *** ***
Home market shipments *** *** *** *** *** *** ***
Export shipments to: United States 15,452 23,549 17,736 4,248 3,103 10,672 13,807
All other markets 903,355 929,253 963,938 250,299 233,640 998,181 1,033,801
Total exports 918,807 952,802 981,674 254,547 236,743 1,008,853 1,047,608
Total shipments 1,347,454 1,433,191 1,502,815 379,590 374,256 1,584,671 1,634,278
Ratios and shares (percent)
Capacity utilization 90.3 93.1 86.7 84.9 93.3 94.3 96.5
Inventories/production 5.7 9.2 6.9 8.1 7.9 3.4 3.0
Inventories/total shipments 5.8 9.6 6.7 7.7 8.3 3.4 2.9
Share of total shipments: Internal consumption/ transfers *** *** *** *** *** *** ***
Home market shipments *** *** *** *** *** *** ***
Export shipments to: United States 1.1 1.6 1.2 1.1 0.8 0.7 0.8
All other markets 67.0 64.8 64.1 65.9 62.4 63.0 63.3
Total exports 68.2 66.5 65.3 67.1 63.3 63.7 64.1
Total shipments 100.0 100.0 100.0 100.0 100.0 100.0 100.0 1 ***.
Source: Compiled from data submitted in response to Commission questionnaires. No response to the Commission’s questionnaire was submitted by any producer/exporter in Poland.
U.S. INVENTORIES OF IMPORTED MERCHANDISE
Table VII-15 presents data on U.S. importers’ reported inventories of GOES.
Table VII-15
GOES: U.S. importers’ inventories, 2011-13, January-March 2013, and January-March 2014
* * * * * * *

VII-20
U.S. IMPORTERS’ OUTSTANDING ORDERS
The Commission requested importers to indicate whether they imported or arranged for the importation of GOES from any country after March 31, 2014. Table VII‐16 presents U.S. import shipments of GOES arranged for importation after March 31, 2014.
Table VII-16 GOES: U.S. importers’ arranged imports, April-June 2014, July-September 2014, October-December 2014, and January-March 2015
* * * * * * *
ANTIDUMPING OR COUNTERVAILING DUTY ORDERS IN THIRD-COUNTRY MARKETS
India and China are the world’s leading destination markets for imports of GOES (table VII-17). Together, these two leading importers accounted for nearly one-third (32.7 percent) of all imports in the world that were reported by importing entities in 2013.
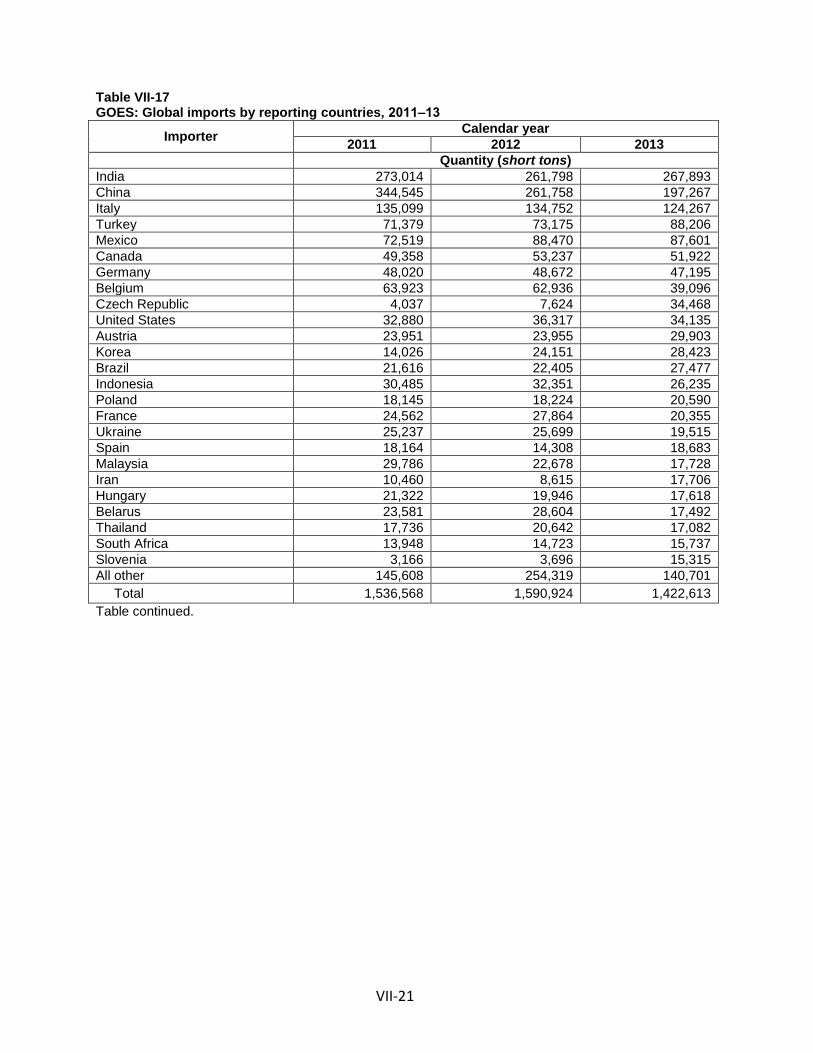
VII-21
Table VII-17 GOES: Global imports by reporting countries, 2011‒13
Importer Calendar year
2011 2012 2013
Quantity (short tons)
India 273,014 261,798 267,893
China 344,545 261,758 197,267
Italy 135,099 134,752 124,267
Turkey 71,379 73,175 88,206
Mexico 72,519 88,470 87,601
Canada 49,358 53,237 51,922
Germany 48,020 48,672 47,195
Belgium 63,923 62,936 39,096
Czech Republic 4,037 7,624 34,468
United States 32,880 36,317 34,135
Austria 23,951 23,955 29,903
Korea 14,026 24,151 28,423
Brazil 21,616 22,405 27,477
Indonesia 30,485 32,351 26,235
Poland 18,145 18,224 20,590
France 24,562 27,864 20,355
Ukraine 25,237 25,699 19,515
Spain 18,164 14,308 18,683
Malaysia 29,786 22,678 17,728
Iran 10,460 8,615 17,706
Hungary 21,322 19,946 17,618
Belarus 23,581 28,604 17,492
Thailand 17,736 20,642 17,082
South Africa 13,948 14,723 15,737
Slovenia 3,166 3,696 15,315
All other 145,608 254,319 140,701
Total 1,536,568 1,590,924 1,422,613
Table continued.
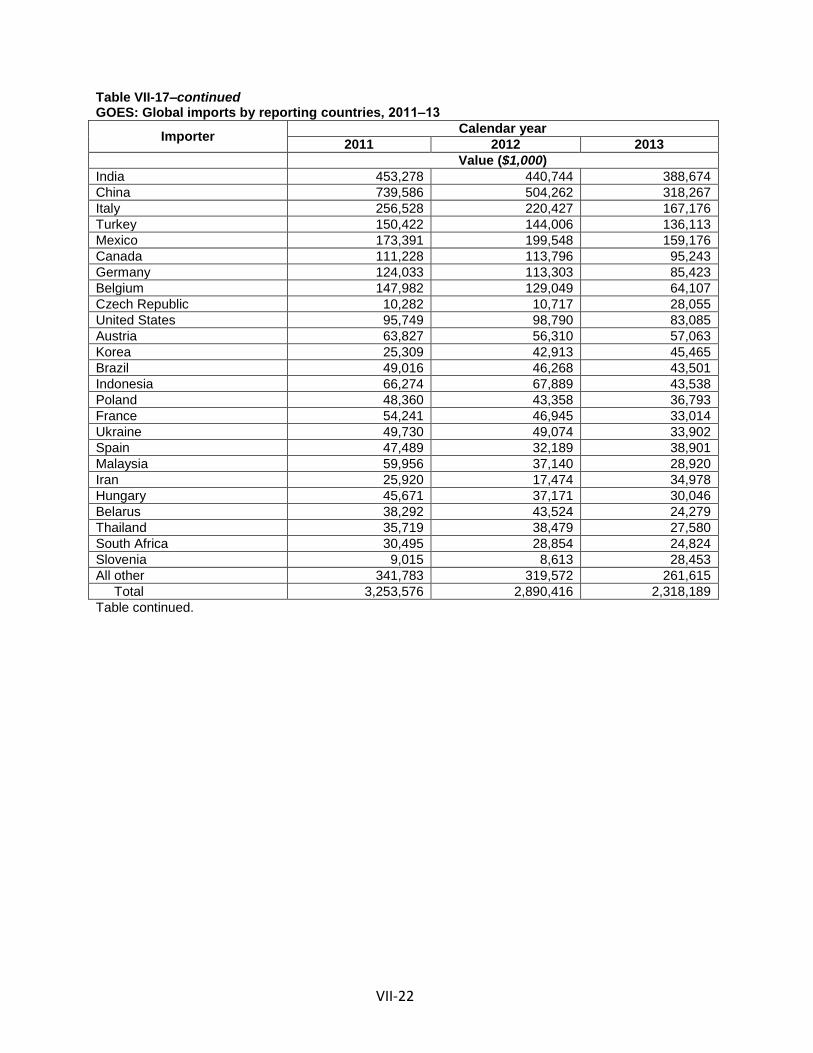
VII-22
Table VII-17‒continued GOES: Global imports by reporting countries, 2011‒13
Importer Calendar year
2011 2012 2013
Value ($1,000)
India 453,278 440,744 388,674
China 739,586 504,262 318,267
Italy 256,528 220,427 167,176
Turkey 150,422 144,006 136,113
Mexico 173,391 199,548 159,176
Canada 111,228 113,796 95,243
Germany 124,033 113,303 85,423
Belgium 147,982 129,049 64,107
Czech Republic 10,282 10,717 28,055
United States 95,749 98,790 83,085
Austria 63,827 56,310 57,063
Korea 25,309 42,913 45,465
Brazil 49,016 46,268 43,501
Indonesia 66,274 67,889 43,538
Poland 48,360 43,358 36,793
France 54,241 46,945 33,014
Ukraine 49,730 49,074 33,902
Spain 47,489 32,189 38,901
Malaysia 59,956 37,140 28,920
Iran 25,920 17,474 34,978
Hungary 45,671 37,171 30,046
Belarus 38,292 43,524 24,279
Thailand 35,719 38,479 27,580
South Africa 30,495 28,854 24,824
Slovenia 9,015 8,613 28,453
All other 341,783 319,572 261,615
Total 3,253,576 2,890,416 2,318,189
Table continued.

VII-23
Table VII-17‒continued GOES: Global imports by reporting countries, 2011‒13
Importer Calendar year
2011 2012 2013
Unit value (dollars per short ton)
India 1,660 1,684 1,451
China 2,147 1,926 1,613
Italy 1,899 1,636 1,345
Turkey 2,107 1,968 1,543
Mexico 2,391 2,256 1,817
Canada 2,253 2,138 1,834
Germany 2,583 2,328 1,810
Belgium 2,315 2,050 1,640
Czech Republic 2,547 1,406 814
United States 2,912 2,720 2,434
Austria 2,665 2,351 1,908
Korea 1,804 1,777 1,600
Brazil 2,268 2,065 1,583
Indonesia 2,174 2,099 1,660
Poland 2,665 2,379 1,787
France 2,208 1,685 1,622
Ukraine 1,971 1,910 1,737
Spain 2,614 2,250 2,082
Malaysia 2,013 1,638 1,631
Iran 2,478 2,028 1,975
Hungary 2,142 1,864 1,705
Belarus 1,624 1,522 1,388
Thailand 2,014 1,864 1,615
South Africa 2,186 1,960 1,577
Slovenia 2,847 2,330 1,858
All other 2,347 1,257 1,859
Total 2,117 1,817 1,630
Source: GTIS, Global Trade Atlas (retrieved July 28, 2014), HS subheadings 7225.11 and 7226.11.
Antidumping and countervailing duty investigations on GOES from the United States were initiated by China on June 1, 2009.30 Preliminary duties were imposed on December 10, 200931 and final duties became effective on April 10, 2010. Final subsidy rates of 11.7 percent for AK Steel and 12 percent for Allegheny Ludlum were imposed and a dumping margin of 7.8
30 TKES postconference brief, p. 11; China Ministry of Commerce (MOC), Notice No. 40/2009, June 1, 2009, summarized in: Government of the Hong Kong Special Administrative Region (Hong Kong), Trade & Industry Department, “The Mainland of China: Anti-dumping Investigation against Imports of Grain Oriented Flat-rolled Electrical Steel from the United States and Russia,” Commercial Information Circular No. 286/2009, June 2, 2009.
31 TKES postconference brief, p. 11; MOC, Notice No. 99/2009, December 10, 2009, summarized in: Hong Kong, Trade & Industry Department, “The Mainland of China: Preliminary Finding of Anti-dumping Investigation Against Imports of Grain Oriented Flat-rolled Electrical Steel from the United States and Russia and Countervailing Investigation Against Imports of Grain Oriented Flat-rolled Electrical Steel from the United States,” Commercial Information Circular No.622/2009, December 11, 2009.

VII-24
percent for AK Steel and 19.9 percent for Allegheny were imposed.32 In response to a WTO dispute settlement proceeding brought by the United States, China recalculated the countervailing duty rates on July 31, 2013. The revised antidumping duty rate is 3.4 percent for both AK Steel and Allegheny.33
Also on June 1, 2009, China initiated antidumping duty investigations on GOES from Russia.34 Preliminary duties were imposed on December 10, 200935 and final duties became effective on April 10, 2010. Final antidumping rates of 6.3 percent were imposed for NLMK and for VIZ-Stal Ltd., and 24 percent for all others.36
Although there are no antidumping and countervailing duties imposed on imports of GOES into India, the Indian Steel Ministry reportedly effectively banned imports of low-grade electrical steel in June 2011 through the issuance of a quality control order that mandates certification for cold-rolled grain-oriented steel sheets by the Bureau of Indian Standards.37 The purpose of this ban was to reduce power breakdowns since low-grade standard electrical sheets caused frequent malfunctions and a shorter lifespan of transformers. These steel sheets were often used since they were less expensive. The ban reportedly would therefore help Indian companies avoid high commercial loss caused by low-grade electrical steel. 38
32 TKES postconference brief, p. 11; MOC, Notice No. 21/2010, April 10, 2010, summarized in: Hong Kong, Trade & Industry Department, “The Mainland of China: Final Ruling on Anti-dumping Investigation Against Imports of Grain Oriented Flat-rolled Electrical Steel from the United States and Russia and Countervailing Investigation Against Imports of Grain Oriented Flat-rolled Electrical Steel from the United States,” Commercial Information Circular No. 162/2010, April 15, 2010.
33 TKES postconference brief, p. 11; MOC, Notice No. 51/2013, July 31, 2013, summarized in: Hong Kong, Trade & Industry Department, “The Mainland of China: Implementation of WTO's Ruling on the Imports of Grain Oriented Flat-rolled Electrical Steel from the United States,” Commercial Information Circular No. 656/2013, August 15, 2013.
34 MOC, Notice No. 40/2009, June 1, 2009, summarized in: Hong Kong, Trade & Industry Department, “The Mainland of China: Anti-dumping Investigation against Imports of Grain Oriented Flat-rolled Electrical Steel from the United States and Russia,” Commercial Information Circular No. 286/2009, June 2, 2009.
35 MOC, Notice No. 99/2009, December 10, 2009, summarized in: Hong Kong, Trade & Industry Department, “The Mainland of China: Preliminary Finding of Anti-dumping Investigation Against Imports of Grain Oriented Flat-rolled Electrical Steel from the United States and Russia and Countervailing Investigation Against Imports of Grain Oriented Flat-rolled Electrical Steel from the United States,” Commercial Information Circular No.622/2009, December 11, 2009.
36 MOC, Notice No. 21/2010, April 10, 2010, summarized in: Hong Kong, Trade & Industry Department, “The Mainland of China: Final Ruling on Anti-dumping Investigation Against Imports of Grain Oriented Flat-rolled Electrical Steel from the United States and Russia and Countervailing Investigation Against Imports of Grain Oriented Flat-rolled Electrical Steel from the United States,” Commercial Information Circular No. 162/2010, April 15, 2010.
37 TKES postconference brief, exh. A. 38 The Economic Times website, found at http://articles.economictimes.indiatimes.com/2011-07-
09/news/29755810_1_steel-sheets-transformers-steel-ministry, retrieved July 29, 2014.
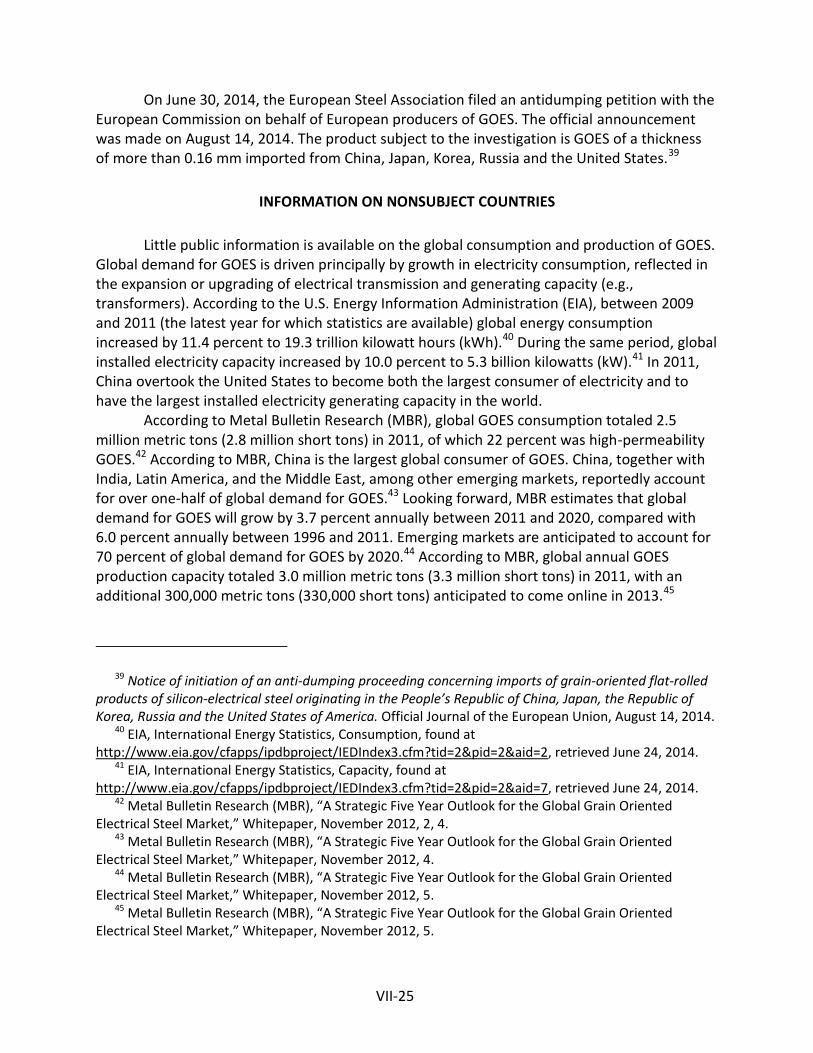
VII-25
On June 30, 2014, the European Steel Association filed an antidumping petition with the European Commission on behalf of European producers of GOES. The official announcement was made on August 14, 2014. The product subject to the investigation is GOES of a thickness of more than 0.16 mm imported from China, Japan, Korea, Russia and the United States.39
INFORMATION ON NONSUBJECT COUNTRIES
Little public information is available on the global consumption and production of GOES. Global demand for GOES is driven principally by growth in electricity consumption, reflected in the expansion or upgrading of electrical transmission and generating capacity (e.g., transformers). According to the U.S. Energy Information Administration (EIA), between 2009 and 2011 (the latest year for which statistics are available) global energy consumption increased by 11.4 percent to 19.3 trillion kilowatt hours (kWh).40 During the same period, global installed electricity capacity increased by 10.0 percent to 5.3 billion kilowatts (kW).41 In 2011, China overtook the United States to become both the largest consumer of electricity and to have the largest installed electricity generating capacity in the world.
According to Metal Bulletin Research (MBR), global GOES consumption totaled 2.5 million metric tons (2.8 million short tons) in 2011, of which 22 percent was high-permeability GOES.42 According to MBR, China is the largest global consumer of GOES. China, together with India, Latin America, and the Middle East, among other emerging markets, reportedly account for over one-half of global demand for GOES.43 Looking forward, MBR estimates that global demand for GOES will grow by 3.7 percent annually between 2011 and 2020, compared with 6.0 percent annually between 1996 and 2011. Emerging markets are anticipated to account for 70 percent of global demand for GOES by 2020.44 According to MBR, global annual GOES production capacity totaled 3.0 million metric tons (3.3 million short tons) in 2011, with an additional 300,000 metric tons (330,000 short tons) anticipated to come online in 2013.45
39 Notice of initiation of an anti-dumping proceeding concerning imports of grain-oriented flat-rolled products of silicon-electrical steel originating in the People’s Republic of China, Japan, the Republic of Korea, Russia and the United States of America. Official Journal of the European Union, August 14, 2014.
40 EIA, International Energy Statistics, Consumption, found at http://www.eia.gov/cfapps/ipdbproject/IEDIndex3.cfm?tid=2&pid=2&aid=2, retrieved June 24, 2014.
41 EIA, International Energy Statistics, Capacity, found at http://www.eia.gov/cfapps/ipdbproject/IEDIndex3.cfm?tid=2&pid=2&aid=7, retrieved June 24, 2014.
42 Metal Bulletin Research (MBR), “A Strategic Five Year Outlook for the Global Grain Oriented Electrical Steel Market,” Whitepaper, November 2012, 2, 4.
43 Metal Bulletin Research (MBR), “A Strategic Five Year Outlook for the Global Grain Oriented Electrical Steel Market,” Whitepaper, November 2012, 4.
44 Metal Bulletin Research (MBR), “A Strategic Five Year Outlook for the Global Grain Oriented Electrical Steel Market,” Whitepaper, November 2012, 5.
45 Metal Bulletin Research (MBR), “A Strategic Five Year Outlook for the Global Grain Oriented Electrical Steel Market,” Whitepaper, November 2012, 5.

VII-26
In Brazil, Aperam South America (formerly ArcelorMittal Inox Brasil), the sole integrated producer of stainless steel, GOES, and NOES in Latin America, completed the $30-million conversion of its No. 2 blast furnace in Timóteo (in the southeastern Brazilian state of Minas Gerais) in September 2011 to operate with charcoal rather than coke. With a pig-iron smelting capacity of 860,000 metric tons (948,000 short tons) per year from its two charcoal-charged blast furnaces, Aperam claims more than 70 percent of the Brazilian market for stainless steel and electrical steels.46 According to some industry observers, Aperam could be a consolidation target for Spanish stainless-steel producer Acerinox, which already operates a stainless-steel mill in the United States.47
In India, parastatal Steel Authority of India (SAIL) initiated a $100 million research and development (R&D) initiative in September 2011 for several technologies, including capability to produce cold-rolled GOES (CRGO), which is manufactured by only a limited number of European and East Asian steelmakers.48 Indian flat-rolled steel producer JSW Steel announced, in March 2012, collaboration with Japan-based JFE Steel Corporation to expand JSW’s product mix into electrical steels. The planned 600,000 metric tons (661,000 short tons) per year electrical-steel facility at its integrated steelworks in VIjayanagar (in the southern Indian state of Karnataka), is anticipated to commence production in the second-half of 2014. Although this facility initially will produce cold-rolled NOES (CRNO), there are also reportedly corporate plans to consider a CRGO facility sometime in the future.49
Table VII-18 shows global reported exports of GOES during 2011–13. Subject countries accounted for 75.2 percent of global exports of GOES in 2013. Leading nonsubject producers and exporters of GOES include the United Kingdom, France, and Belgium, which together accounted for 12.0 percent of global GOES exports in 2013. ThyssenKrupp Electrical Steel, a subsidiary of German industrial conglomerate ThyssenKrupp, produces GOES in Isbergues, France; 50 Gelsenkirchen, Germany; and Nashik, India.51 Orb Electrical Steels, a part of Canada-
46 Metal Bulletin, “Aperam Commissions World’s Largest Charcoal-charged BF in Brazil,” September 16, 2011.
47 Rationales cited for a potential Acerinox-Aperam merger include lack of growth opportunities for Acerinox in Europe due to regional overcapacity, production cut-backs, and job cut-backs; and Aperam’s presence in Brazil as complementary to Acerinox’s presence in the United States. Chapman, Alexandra, “Inoxum-Outokumpu Merger Plan May Spark Further Stainless Steel Consolidation,” Metal Bulletin, February 2, 2012.
48 Metal Bulletin, “Sail Seeks Electrical Steel JV with Posco as Indian Quest for High-quality Production Continues,” September 29, 2010; and Metal Bulletin, “Sail to Develop CRGO Electrical Steels in R&D Drive,” September 14, 2011.
49 Nair, Suresh, “India’s JSW to Produce Electrical-grade Steel with Help from JFE,” Metal Bulletin, March 12, 2012; and Metal Bulletin, “Japan’s JFE Steel to Develop Electrical Steels with India’s JSW,” December 18, 2012.
50 According to a recent industry-trade press article, Ben Ebmcke, President of Statham, GA-based Ehmeke Consulting LLC, was cited as alleging that ThysenKrupp Electrical Steel is “planning on ramping up production” at its electrical steel manufacturing facility in France (a nonsubject country) to avoid the duties imposed by Commerce on the German product. Mashayekhi, “Electrical Steel Industry Cheers Imports Ruling,” American Metal Market, July 18, 2014.

VII-27
based, electrical transformer producer Cogent Power (itself a wholly owned subsidiary of Indian industrial conglomerate TATA Group) produces GOES in Newport, United Kingdom.52 Commission staff is unaware of any producers of GOES in Belgium. Tables VII-19 and VII-20 show global reported exports of GOES from the United Kingdom and France.
Table VII-18 GOES: Global exports by reporting countries, 2011–13
Exporter Calendar year
2011 2012 2013
Quantity (short tons)
Japan 473,220 466,766 455,576
Korea 161,816 171,251 205,976
Russia 149,107 263,583 205,092
Poland 104,546 89,698 107,146
Germany 106,919 102,167 86,711
United States 186,285 140,177 79,725
United Kingdom 81,673 76,282 74,812
France 102,238 96,140 70,172
Czech Republic 56,232 55,096 54,316
Belgium 60,671 62,301 37,939
China 13,766 38,642 32,567
Singapore 7,451 11,007 15,287
Italy 23,744 17,369 13,859
Canada 9,342 11,201 13,409
Mexico 7,481 8,797 10,542
Hungary 13,736 13,561 10,290
Slovenia 251 306 8,235
Austria 1,004 2,136 7,694
Malaysia 12,850 6,975 6,457
Taiwan 5,356 8,038 5,861
India 2,701 3,788 5,427
Netherlands 8,240 39,402 4,842
Brazil 4,543 7,797 4,749
Hong Kong 2,770 2,866 4,199
Sweden 3,767 2,971 1,828
All other 10,707 5,337 3,244
Total 1,610,404 1,703,620 1,525,937
Source: GTIS, Global Trade Atlas (accessed June 20, 2014), HS subheadings 7225.11 and 7226.11.
(…continued)
51 ThyssenKrupp Electrical Steel website, found at http://www.tkes.com/web2010/tkeswebcms.nsf/www/en_Standorte_is.html, retrieved October 21, 2013.
52 Cogent Power website, found at http://www.cogent-power.com/orb/, retrieved October 21, 2013.
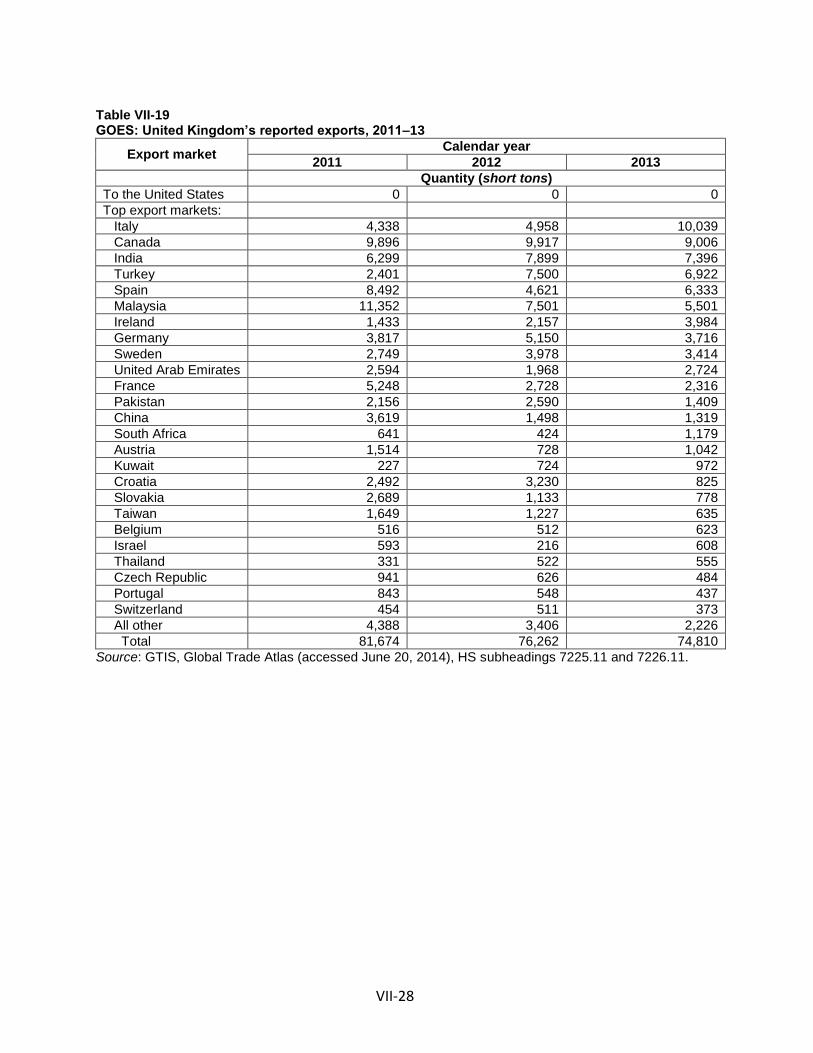
VII-28
Table VII-19 GOES: United Kingdom’s reported exports, 2011–13
Export market Calendar year
2011 2012 2013
Quantity (short tons)
To the United States 0 0 0
Top export markets:
Italy 4,338 4,958 10,039
Canada 9,896 9,917 9,006
India 6,299 7,899 7,396
Turkey 2,401 7,500 6,922
Spain 8,492 4,621 6,333
Malaysia 11,352 7,501 5,501
Ireland 1,433 2,157 3,984
Germany 3,817 5,150 3,716
Sweden 2,749 3,978 3,414
United Arab Emirates 2,594 1,968 2,724
France 5,248 2,728 2,316
Pakistan 2,156 2,590 1,409
China 3,619 1,498 1,319
South Africa 641 424 1,179
Austria 1,514 728 1,042
Kuwait 227 724 972
Croatia 2,492 3,230 825
Slovakia 2,689 1,133 778
Taiwan 1,649 1,227 635
Belgium 516 512 623
Israel 593 216 608
Thailand 331 522 555
Czech Republic 941 626 484
Portugal 843 548 437
Switzerland 454 511 373
All other 4,388 3,406 2,226
Total 81,674 76,262 74,810
Source: GTIS, Global Trade Atlas (accessed June 20, 2014), HS subheadings 7225.11 and 7226.11.

VII-29
Table VII-20 GOES: France’s reported exports, 2011–13
Export market Calendar year
2011 2012 2013
Quantity (short tons)
To the United States 1,608 243 631
Top export markets:
Germany 8,628 9,973 10,293
Portugal 5,795 5,704 5,438
Belgium 11,974 7,179 5,117
Italy 8,671 10,373 6,507
Spain 5,730 6,043 4,648
Thailand 2,585 3,807 2,808
Pakistan 1,735 4,070 2,686
China 12,704 9,384 2,395
Brazil 2,508 2,272 2,331
Saudi Arabia 2,241 2,303 2,314
Netherlands 2,161 3,322 1,947
Colombia 1,125 2,122 1,937
Japan 1 0 3
South Africa 2,883 1,345 1,866
Turkey 2,255 4,413 1,656
Morocco 2,474 2,366 1,626
Lebanon 2,306 1,811 1,573
Algeria 0 1,685 1,549
Ecuador 502 1,226 1,490
Vietnam 881 775 1,259
Greece 153 0 1,153
Poland 2,034 2,260 1,120
Taiwan 796 1,019 765
Chile 1,726 1,039 737
Tunisia 735 471 631
All other 19,640 11,180 6,319
Total 102,237 96,138 70,171
Source: GTIS, Global Trade Atlas (accessed June 20, 2014), HS subheadings 7225.11 and 7226.11.


A-1
APPENDIX A
FEDERAL REGISTER NOTICES


A-3
The Commission makes available notices relevant to its investigations and reviews on its
website, www.usitc.gov. In addition, the following tabulation presents, in chronological order,
Federal Register notices issued by the Commission and Commerce during the current
proceeding.
Citation Title Link
78 FR 59059, September 25, 2013
Grain-Oriented Electrical Steel From China, Czech Republic, Germany, Japan, Korea, Poland, and Russia; Institution of Antidumping and Countervailing Duty Investigations and Scheduling of Preliminary Phase Investigations
http://www.gpo.gov/fdsys/pkg/FR-2013-09-25/pdf/2013-23277.pdf
78 FR 64011, October 25, 2013
Tolling of Activity in Antidumping and Countervailing Duty Proceedings
http://www.gpo.gov/fdsys/pkg/FR-2013-10-25/pdf/2013-25082.pdf
78 FR 65283, October 31, 2013
Grain-Oriented Electrical Steel From the People’s Republic of China, the Czech Republic, Germany, Japan, the Republic of Korea, Poland, and the Russian Federation: Initiation of Antidumping Duty Investigations
http://www.gpo.gov/fdsys/pkg/FR-2013-10-31/pdf/2013-25805.pdf
78 FR 65265, October 31, 2013
Grain-Oriented Electrical Steel from the People’s Republic of China: Initiation of Countervailing Duty Investigation
http://www.gpo.gov/fdsys/pkg/FR-2013-10-31/pdf/2013-26002.pdf
78 FR 70574
November 26, 2103
Grain-Oriented Electrical Steel From China, Czech Republic, Germany, Japan, Korea, Poland, and Russia; Determinations
http://www.gpo.gov/fdsys/pkg/FR-2013-11-26/pdf/2013-28269.pdf
79 FR 26717
May 9, 2014
Grain-Oriented Electrical Steel From the Czech Republic: Preliminary Determination of Sales at Less Than Fair Value, Negative Preliminary Determination of Critical Circumstances, and Postponement of Final Determination
http://www.gpo.gov/fdsys/pkg/FR-2014-05-09/pdf/2014-10700.pdf

A-4
Citation Title Link
79 FR 26936
May 12, 2014
Grain-Oriented Electrical Steel From the People's Republic of China: Preliminary Determination of Sales at Less Than Fair Value and Postponement of Final Determination
http://www.gpo.gov/fdsys/pkg/FR-2014-05-12/pdf/2014-10745.pdf
79 FR 26941
May 12, 2014
Grain-Oriented Electrical Steel From Germany, Japan, Poland, and the Russian Federation: Preliminary Determinations of Sales at Less Than Fair Value, Certain Affirmative Preliminary Determinations of Critical Circumstances, and Postponement of Russian Final Determination
http://www.gpo.gov/fdsys/pkg/FR-2014-05-12/pdf/2014-10747.pdf
79 FR 26939
May 12, 2014
Grain-Oriented Electrical Steel From the Republic of Korea: Preliminary Determination of Sales at Less Than Fair Value and Postponement of Final Determination
http://www.gpo.gov/fdsys/pkg/FR-2014-05-12/pdf/2014-10748.pdf
79 FR 32310
June 4, 2014
Grain-Oriented Electrical Steel (“GOES”) From China, Czech Republic, Germany, Japan, Korea, Poland, and Russia; Scheduling of the Final Phase of Countervailing Duty and Antidumping Investigations.
http://www.gpo.gov/fdsys/pkg/FR-2014-06-04/pdf/2014-12910.pdf
79 FR 42501
July 22, 2014
Grain-Oriented Electrical Steel from Germany, Japan, and Poland: Final Determinations of Sales at Less Than Fair Value and Certain Final Affirmative Determination of Critical Circumstances.
http://www.gpo.gov/fdsys/pkg/FR-2014-07-22/pdf/2014-17226.pdf

B-1
APPENDIX B
CALENDAR OF THE PUBLIC STAFF CONFERENCE


B-3
CALENDAR OF PUBLIC HEARING
Those listed below appeared as witnesses at the United States International Trade Commission’s
hearing:
Subject: Grain-Oriented Electrical Steel from China, Czech Republic,
Germany, Japan, Korea, Poland, and Russia
Inv. Nos.: 701-TA-505 and 731-TA-1231-1237 (Final)
Date and Time: July 24, 2014 - 9:30 a.m.
Sessions were held in connection with these investigations in the Main Hearing Room (Room
101), 500 E Street, S.W., Washington, DC.
EMBASSY APPEARANCE:
The Embassy of Japan
Washington, DC
Yasushi Akahoshi, Minister
OPENING REMARKS:
Petitioners (David A. Hartquist, Kelley Drye & Warren LLP)
Respondents (David Hickerson, Foley & Lardner LLP)
In Support of the Imposition of
Antidumping and Countervailing Duty Orders: Kelley Drye & Warren LLP Washington, DC on behalf of AK Steel Corporation Allegheny Ludlum, LLC The United Steelworkers Raymond Polinski, Vice President and General Manager,
Grain-Oriented Electrical Steel, Allegheny Ludlum, LLC Ronald James, Manager, Sales & Marketing, Grain-Oriented Electrical Steel, Allegheny Ludlum, LLC James Rakowski, Director, Grain-Oriented Electrical Steel Market & Product Development, Allegheny Ludlum, LLC

B-4
In Support of the Imposition of
Antidumping and Countervailing Duty Orders (continued):
Lauren McAndrews, Vice President Labor Relations and Assistant General Counsel, Allegheny Technologies Incorporated
Eric Petersen, Vice President, Sales & Customer Service, AK Steel Corporation
Geoff Pfeiffer, General Manager – Specialty Steel Sales, AK Steel Corporation Jerry Schoen, Principal Engineer, Product Development & Applications Engineering, AK Steel Corporation Steve Konstantinidis, Product/Marketing Manager, AK Steel Corporation Jeffrey Zackerman, Assistant General Counsel, Commercial Affairs, AK Steel Corporation
Tom Conway, International Vice President (Administration), United Steelworkers
Michael Kerwin, Director, Georgetown Economic Services, LLC Brad Hudgens, Economist, Georgetown Economic Services, LLC David A. Hartquist ) John M. Herrmann ) ) – OF COUNSEL Grace W. Kim ) Benjamin B. Caryl )
B-5
In Opposition to the Imposition of
Antidumping and Countervailing Duty Orders: Gibson, Dunn & Crutcher LLP Washington, DC on behalf of Nippon Steel & Sumitomo Metal Corporation (“NSSMC”) Soichi Yonezawa, Senior Manager, Electrical Steel Sheet Division, Flat-Rolled Product Unit, NSSMC
Takahiro Saito, Director/Unit Head, Flat-Rolled Products Business Unit, Sumitomo Corporation of America
Dr. Thomas Prusa, Professor of Economics, Rutgers University
J. Christopher Wood ) – OF COUNSEL
Dentons US LLP Washington, DC on behalf of
Novolipetsk Steel (NLMK) Vladimir Segal, Consulting Engineer, NLMK/VIZ-STAL GROUP Mark P. Lunn ) – OF COUNSEL Cassidy Levy Kent (USA) LLP Washington, DC on behalf of ABB Inc. Elise Woolfort, Vice President, Power Products
Supply Chain, ABB Inc.
Tom Mariner, Commodity Manager, ABB Inc. Jerry Clark, Chief Counsel, ABB Inc. Jennifer A. Hillman ) ) – OF COUNSEL John D. Greenwald )

B-6
In Opposition to the Imposition of
Antidumping and Countervailing Duty Orders (continued): DeKieffer & Horgan, PLLC Washington, DC on behalf of ThyssenKrupp Electrical Steel GmbH (“TKES”) J. Kevin Horgan ) – OF COUNSEL Foley & Lardner LLP Washington, DC on behalf of JFE Steel Corporation Hidenari Suzuki, Staff Deputy General Manager, Electrical
Steel Export Section, JFE Steel Corporation Bruce Becker, Manager, International Steel Unit,
Toyota Tsusho America David Hickerson ) Gregory Husisian ) – OF COUNSEL Robert Huey ) Greenberg Traurig, LLP Bethesda, MD on behalf of Baoshan Iron & Steel Co., Ltd. Baosteel America, Inc. Yi (Steve) Huang, Department Manager, Baosteel
America, Inc. Philippe M. Bruno ) – OF COUNSEL
REBUTTAL/CLOSING REMARKS:
Petitioners (David A. Hartquist, Kelley Drye & Warren LLP)
Respondents (J. Christopher Wood, Gibson, Dunn & Crutcher LLP)
-END-

C-1
APPENDIX C
SUMMARY DATA


Table C-1
GOES: Summary data concerning the U.S. market, 2011-13, January to March 2013, and January to March 2014
Jan-Jun
2011 2012 2013 2013 2014 2011-13 2011-12 2012-13 2013-14
U.S. consumption quantity:
Amount.................................................................. *** *** *** *** *** *** *** *** ***
Producers' share (1).............................................. *** *** *** *** *** *** *** *** ***
Importers' share (1):
China................................................................ *** *** *** *** *** *** *** *** ***
Czech Republic…………………………………………..*** *** *** *** *** *** *** *** ***
Germany………………………………………………….*** *** *** *** *** *** *** *** ***
Japan……………………………………………………*** *** *** *** *** *** *** *** ***
Korea……………………………………………………….*** *** *** *** *** *** *** *** ***
Poland………………………………………………………..*** *** *** *** *** *** *** *** ***
Russia……………………………………………………………*** *** *** *** *** *** *** *** ***
Subtotal, subject………………………………………*** *** *** *** *** *** *** *** ***
All others sources, nonsubject......................... *** *** *** *** *** *** *** *** ***
Total imports......................................... *** *** *** *** *** *** *** *** ***
U.S. consumption value:
Amount.................................................................. *** *** *** *** *** *** *** *** ***
Producers' share (1).............................................. *** *** *** *** *** *** *** *** ***
Importers' share (1):
China................................................................ *** *** *** *** *** *** *** *** ***
Czech Republic…………………………………………..*** *** *** *** *** *** *** *** ***
Germany………………………………………………….*** *** *** *** *** *** *** *** ***
Japan……………………………………………………*** *** *** *** *** *** *** *** ***
Korea……………………………………………………….*** *** *** *** *** *** *** *** ***
Poland………………………………………………………..*** *** *** *** *** *** *** *** ***
Russia……………………………………………………………*** *** *** *** *** *** *** *** ***
Subtotal, subject………………………………………*** *** *** *** *** *** *** *** ***
All others sources, nonsubject......................... *** *** *** *** *** *** *** *** ***
Total imports......................................... *** *** *** *** *** *** *** *** ***
U.S. importers' imports from:
China: C D E F G
Quantity............................................................ 60 411 2,089 555 343 210 3,384.3 585.8 408.0 (38.3)
Value................................................................ 152 1,244 5,436 1,601 763 211 3,472.9 717.6 337.0 (52.3)
Unit value......................................................... $2,538 $3,025 $2,602 $2,883 $2,227 212 2.5 19.2 (14.0) (22.8)
Ending inventory quantity................................. *** *** *** *** *** 225 (2) (2) (2) (2)
Czech Republic:
Quantity............................................................ 4,207 3,196 4,756 1,318 357 13.1 (24.0) 48.8 (72.9)
Value................................................................ 10,716 7,839 9,564 2,731 597 (10.8) (26.9) 22.0 (78.1)
Unit value......................................................... $2,547 $2,453 $2,011 $2,072 $1,671 (21.1) (3.7) (18.0) (19.4)
Ending inventory quantity................................. *** *** *** *** *** *** *** *** ***
Germany:
Quantity............................................................ 3,503 2,165 2,488 462 317 (29.0) (38.2) 14.9 (31.4)
Value................................................................ 8,390 5,285 4,342 996 527 (48.2) (37.0) (17.8) (47.2)
Unit value......................................................... $2,395 $2,441 $1,746 $2,156 $1,660 (27.1) 1.9 (28.5) (23.0)
Ending inventory quantity................................. *** *** *** *** *** (2) (2) (2) (2)
Japan:
Quantity............................................................ 12,858 12,529 15,256 3,949 1,603 18.7 (2.6) 21.8 (59.4)
Value................................................................ 44,061 38,852 41,791 11,527 3,865 (5.2) (11.8) 7.6 (66.5)
Unit value......................................................... $3,427 $3,101 $2,739 $2,919 $2,411 (20.1) (9.5) (11.7) (17.4)
Ending inventory quantity................................. *** *** *** *** *** *** *** *** ***
Korea:
Quantity............................................................ 2,402 4,445 2,196 597 0 (8.6) 85.1 (50.6) (100.0)
Value................................................................ 6,406 11,369 4,808 1,384 0 (24.9) 77.5 (57.7) (100.0)
Unit value......................................................... $2,667 $2,558 $2,190 $2,320 $0 (17.9) (4.1) (14.4) (100.0)
Ending inventory quantity................................. *** *** *** *** *** (2) (2) (2) (2)
Poland:
Quantity............................................................ 2,439 4,517 956 421 226 (60.8) 85.2 (78.8) (46.2)
Value................................................................ 6,277 10,867 1,982 937 436 (68.4) 73.1 (81.8) (53.5)
Unit value......................................................... $2,574 $2,406 $2,072 $2,226 $1,928 (19.5) (6.5) (13.9) (13.4)
Ending inventory quantity................................. *** *** *** *** *** *** *** *** ***
Russia:
Quantity............................................................ 765 3,919 1,420 639 275 85.6 412.0 (63.8) (56.9)
Value................................................................ 2,267 10,306 3,455 1,712 572 52.4 354.6 (66.5) (66.6)
Unit value......................................................... $2,962 $2,630 $2,432 $2,682 $2,076 (17.9) (11.2) (7.5) (22.6)
Ending inventory quantity................................. *** *** *** *** *** (2) (2) *** (2)
Subtotal, subject:
Quantity............................................................ 26,234 31,182 29,161 7,940 3,122 11.2 18.9 (6.5) (60.7)
Value................................................................ 78,270 85,762 71,377 20,888 6,760 (8.8) 9.6 (16.8) (67.6)
Unit value......................................................... $2,984 $2,750 $2,448 $2,631 $2,165 (18.0) (7.8) (11.0) (17.7)
Ending inventory quantity................................. *** *** *** *** *** *** *** *** ***
All other sources:
Quantity............................................................ 4,372 2,885 2,516 533 1,164 350 (42.4) (34.0) (12.8) 118.6
Value................................................................ 13,371 8,682 6,683 1,516 2,662 351 (50.0) (35.1) (23.0) 75.5
Unit value......................................................... $3,058 $3,009 $2,656 $2,847 $2,286 352 (13.2) (1.6) (11.7) (19.7)
Ending inventory quantity................................. *** *** *** *** *** 365 *** *** *** ***
Total imports:
Quantity............................................................ 30,606 34,067 31,678 8,472 4,286 490 3.5 11.3 (7.0) (49.4)
Value................................................................ 91,640 94,445 78,060 22,405 9,421 491 (14.8) 3.1 (17.3) (57.9)
Unit value......................................................... $2,994 $2,772 $2,464 $2,644 $2,198 492 (17.7) (7.4) (11.1) (16.9)
Ending inventory quantity................................. 4,283 3,741 1,874 2,938 1,656 505 (56.2) (12.7) (49.9) (43.6)
Table continued.
C-3
(Quantity=short tons; Value=1,000 dollars; Unit values, unit labor costs, and unit expenses=dollars per short ton; Period changes=percent--exceptions noted)
Report data Period changes
Calendar year January to March Calendar year

Table C-1--Continued
GOES: Summary data concerning the U.S. market, 2011-13, January to March 2013, and January to March 2014
Jan-Jun
2011 2012 2013 2013 2014 2011-2013 2011-12 2012-13 2013-14
U.S. producers':
Average capacity quantity...................................... *** *** *** *** *** 191 *** *** *** ***
Production quantity................................................ *** *** *** *** *** 193 *** *** *** ***
Capacity utilization (fn1)........................................ *** *** *** *** *** 219 *** *** *** ***
U.S. shipments:
Quantity............................................................ *** *** *** *** *** 229 *** *** *** ***
Value................................................................ *** *** *** *** *** 230 *** *** *** ***
Unit value......................................................... *** *** *** *** *** 231 *** *** *** ***
Export shipments:
Quantity............................................................ *** *** *** *** *** 200 *** *** *** ***
Value................................................................ *** *** *** *** *** 201 *** *** *** ***
Unit value......................................................... *** *** *** *** *** 227 *** *** *** ***
Ending inventory quantity...................................... *** *** *** *** *** 244 *** *** *** ***
Inventories/total shipments (fn1)........................... *** *** *** *** *** 247 *** *** *** ***
Production workers................................................ *** *** *** *** *** 205 *** *** *** ***
Hours worked (1,000s)........................................... *** *** *** *** *** 206 *** *** *** ***
Wages paid ($1,000)............................................. *** *** *** *** *** 207 *** *** *** ***
Productivity (short tons per 1,000 hours)............... *** *** *** *** *** 251 *** *** *** ***
Unit labor costs...................................................... *** *** *** *** *** 253 *** *** *** ***
Net Sales:
Quantity............................................................ *** *** *** *** *** 494 *** *** *** ***
Value................................................................ *** *** *** *** *** 498 *** *** *** ***
Unit value......................................................... *** *** *** *** *** 523 *** *** *** ***
Cost of goods sold (COGS)................................... *** *** *** *** *** 502 *** *** *** ***
Gross profit of (loss).............................................. *** *** *** *** *** 503 (2) *** (2) ***
SG&A expenses.................................................... *** *** *** *** *** 506 *** *** *** ***
Operating income or (loss).................................... *** *** *** *** *** 507 (2) *** (2) ***
Capital expenditures.............................................. *** *** *** *** *** 624 *** *** *** ***
Unit COGS............................................................. *** *** *** *** *** 525 *** *** *** ***
Unit SG&A expenses............................................. *** *** *** *** *** 527 *** *** *** ***
Unit operating income or (loss).............................. *** *** *** *** *** 565 (2) *** (2) ***
COGS/sales (fn1).................................................. *** *** *** *** *** 536 *** *** *** ***
Operating income or (loss)/sales (fn1)................... *** *** *** *** *** 565 *** *** *** ***
Notes:
(1).--Report data are in percent and period changes are in percentage points.
(2).--Undefined.
Source: Official statistics of the U.S. Department of Commerce and responses to Commission questionnaires.
C-4
(Quantity=short tons; Value=1,000 dollars; Unit values, unit labor costs, and unit expenses=dollars per short ton; Period changes=percent--exceptions noted)
Report data Period changes
Calendar year January to March Calendar year

D-1
APPENDIX D
PURCHASE PRICES BY DIRECT IMPORTER


D-3
This appendix includes purchase data from U.S. importers that internally consume GOES from *** and purchase GOES from U.S. producers: ***.1 The data represent approximately *** of U.S. producers’ shipments, *** of subject imports from Japan, *** of imports from Poland, and *** percent of imports from Russia. The purchase price for U.S.-produced product are not directly comparable to the price of importing GOES which includes an estimate of delivery and the cost being importer of record for the importer, but does not include any sales markup that would typically be made by an importer selling GOES in the U.S. market.2
Petitioners contend that the purchase price data are directly comparable because the directions provide in the questionnaire are the same for domestic and subject import purchases and ask for the same treatment of prepaid freight. They also claim that these firms are direct importers instead of purchasers to avoid paying a markup to a traditional middleman importer.3 Comparing purchaser specific prices paid for U.S.-produced and imported product, petitioners claim that the direct import data show that ***.4 However, this includes 15 comparisons of the prices of U.S.-produced products 4b and 5b being higher than the prices of the corresponding products 4a and 5a imported from Japan.5 Only including purchaser specific comparisons of prices for the same product, the reported purchase price of U.S.-produced product was higher than the reported import purchase prices in 17 of 30 instances for imports from Japan, 25 of 28 instances for imports from Poland, and 7 of 8 instances for imports from Russia.
Respondents contend that the purchaser price data are not directly comparable because they only include an estimate of delivery or cost being importer of record for the importer and do not include any sales markup that would typically be made for a sale in the U.S. market.6 ABB contends that even if the purchase price data were directly comparable, they do not demonstrate *** to any significant degree. They claim that the base U.S. prices are negotiated before the *** producer prices are set and that variations in quarter U.S. producer prices are a function of change in the surcharge which is set by a formula.7
Nippon contends that with respect to ***, that there is ***, and that pricing levels were at all times ***. They also further contend that ***.8
JFE contends that the purchaser price data should not be used instead of the sales price data gathered for these investigations. JFE characterizes the data as not representative of the
1 ***. 2 The questionnaire requested purchasers to report values that included any delivery costs or costs of
being the importer or record. 3 Petitioners’ posthearing brief, Petitioners’ responses to Commission hearing questions, pp. 20-21. 4 Petitioners’ prehearing brief, p. 30. Petitioners’ posthearing brief, p. 5. 5 Applying this type of comparison to the price data in Table V-8 for products 4a and 4b, prices of
U.S.-produced product 4b are higher than prices for product 4a imported from Japan in 3 of 12 comparisons.
6 ABB’s posthearing brief, p. 11; JFE’s posthearing brief, p. 4; Nippon posthearing brief, pp. 11-13. 7 ABB’s posthearing brief, pp. 11-13. 8 Nippon’s posthearing brief, pp. 9-11.
D-4
U.S. market since they only cover three importers and omit sales by importers that do not directly consume GOES.9
Table D-1
GOES: Purchase prices and quantities of domestic and imported product 1b by direct importers, by quarters, January 2011-March 2014
* * * * * * *
Table D-2
GOES: Purchase prices and quantities of domestic and imported product 2b by direct importers, by quarters, January 2011-March 2014
* * * * * * *
Table D-3
GOES: Purchase prices and quantities of domestic and imported product 3b by direct importers, by quarters, January 2011-March 2014
* * * * * * *
Table D-4
GOES: Purchase prices and quantities of domestic and imported product 4a by direct importers, by quarters, January 2011-March 2014
* * * * * * *
Table D-5
GOES: Purchase prices and quantities of domestic and imported product 4b by direct importers, by quarters, January 2011-March 2014
* * * * * * *
Table D-6
GOES: Purchase prices and quantities of domestic and imported product 5a by direct importers, by quarters, January 2011-March 2014
* * * * * * *
9 JFE’s posthearing brief, JFE Steel’s responses to Commissioner’s questions. p. 25. Staff attempted
repeatedly to obtain ***.
D-5
Table D-7
GOES: Purchase prices and quantities of domestic and imported product 5b by direct importers, by quarters, January 2011-March 2014
* * * * * * *
