grain marketing policy changes and spatial efficiency of...
TRANSCRIPT
MTID DISCUSSION PAPER NO. 66
Markets, Trade and Institutions Division
International Food Policy Research Institute 2033 K Street, N.W.
Washington, D.C. 20006 U.S.A. http://www. ifpri.org
February 2004
Copyright © 2004 International Food Policy Research Institute
MTID Discussion Papers contain preliminary material and research results, and are circulated prior to a full peer review in order to stimulate discussion and critical comment. It is expected that most Discussion Papers will eventually be published in some other form, and that their content may also be revised.
GRAIN MARKETING POLICY CHANGES AND SPATIAL EFFICIENCY OF MAIZE AND WHEAT
MARKETS IN ETHIOPIA
Asfaw Negassa, Robert Myers and Eleni Gabre-Madhin

i
ACKNOWLEDGEMENTS
We are very grateful to Thomas Jayne, John Staatz, John Strauss, John Pender and an
anonymous referee for their very helpful comments and suggestions. We would also like to thank
Ashok Gulati for his very kind support in this work. The financial support of International Food
Policy Research Institute (IFPRI) through the project on �Policies for Sustainable Land
Management in the Ethiopian Highlands� is gratefully acknowledged. However, any errors and
omissions are solely our responsibility.

ii
ABSTRACT
In the context of on-going market reform in developing countries, there is a need for an
improvement in the existing methods of spatial market efficiency analysis in order to better
inform the debate toward designing and implementing new grain marketing policies, institutions,
and infrastructure that facilitate the emergence of a well developed and competitive grain
marketing system. The standard parity bounds model (PBM), while it overcomes many
weaknesses of the conventional methods of spatial market efficiency analysis, it does not allow
for the test of structural changes in spatial market efficiency as a result of policy changes. In this
paper, building on the standard PBM, we develop an extended parity bounds model (EPBM). The
EPBM is a stochastic gradual switching model with three trade regimes. The EPBM is estimated
by maximum likelihood procedure and allows for tracing the time path and structural change in
spatial market efficiency conditions due to the policy changes. We applied the EPBM to analyze
the effect of grain marketing policy changes on spatial efficiency of maize and wheat markets in
Ethiopia. The results show that the effect of policy changes on spatial market efficiency is not
significant statistically in many cases; there is high probability of spatial inefficiency in maize and
wheat markets before and after the policy changes. The implication of these results is that maize
and wheat markets are characterized by periodic gluts and shortages, which can undermine the
welfare of producers, grain traders and consumers. It is also observed that the nature of spatial
inefficiency for maize and wheat markets is different implying that the two commodities might
require different policy responses in order to improve spatial market efficiency. Maize traders
made losses most of the time while wheat traders made excess profits most of the time covered by
the study.

iii
TABLE OF CONTENTS
1. INTRODUCTION .............................................................................................................5 2. EMPIRICAL MODEL.....................................................................................................10
2.1 Conceptual Framework............................................................................................10 2.2 The Extended Parity Bounds Model ........................................................................13 2.3 Estimation Procedures .............................................................................................21
3. DATA ..............................................................................................................................24 4. EMPIRICAL RESULTS AND DISCUSSIONS .............................................................29
4.1 Empirical Results for Maize ....................................................................................30 4.2 Empirical Results for Wheat....................................................................................38 4.3 Summary ..................................................................................................................41
5. CONCLUSIONS AND POLICY IMPLICATIONS .......................................................50 REFERENCES ........................................................................................................................53

iv
List of Tables
Table 4.1 Minimum Observed Months of Trade Flows for Selected Maize and Wheat Market Pairs....................................................................................................43
Table 4.2 Conditional Maximum Likelihood Estimates of EPBM for the Maize Markets (1996:08 to 2002:08)..................................................................................................44
Table 4.3 Conditional Maximum Likelihood Estimates of EPBM for the Wheat Markets (1996:08 to 2002:08)..................................................................................................45
List of Figures
Figure 2.1 Alternative Linear Time Paths of Structural Change in Trade Regime Probabilities (1996:08 to 2002:08) ............................................................................22
Figure 2.2 Time Path of Structural Change in Trade Regime Probability due to the Policy Changes for a Hypothetical Case...............................................................................23
Figure 4.1 Magnitude of Losses and Gains from Inefficient Trade for Maize ...........................46
Figure 4.2 Magnitude of Losses and Gains from Inefficient Trade for Wheat ...........................48

5
GRAIN MARKETING POLICY CHANGES AND SPATIAL EFFICIENCY OF MAIZE AND WHEAT MARKETS IN ETHIOPIA
Asfaw Negassa1, Robert Myers2 and Eleni Gabre-Madhin3
1. INTRODUCTION
During the socialist Derg-regime, the Ethiopian government maintained a heavy
interventionist approach in its grain marketing policies. Through marketing parastatals
and cooperatives, the government controlled grain prices and restricted interregional
grain movements and private traders participation in the grain trade. The effects of these
policies on the development of grain markets, the agricultural sector, and the national
economy have been well studied (e.g. Lirenso, 1987; Franzel et al., 1989; Dadi et al.,
1992). In more recent years, however, the Ethiopian government has embarked on
various market reform measures to address the problem of poor grain market
performance. Many questions remain regarding the speed of adjustment in grain market
performance in response to policy changes, and how these policy changes are affecting
spatial grain marketing efficiency in Ethiopia.
It has been argued that the management of market reform requires an
understanding of the operation of local markets, the strategies and responses of private
traders, and how both relate to changes in the institutional and policy environment of
markets (Kherallah et al., 2002). Such an understanding is crucial to the design,
implementation, and evaluation of marketing policies, institutions, and marketing
1 Ph.D. Candidate, Department of Agricultural Economics, Michigan State University, 202 Agriculture Hall, East Lansing, Michigan 48824-1039: E-mail: [email protected] 2 Professor, Department of Agricultural Economics, Michigan State University, 202 Agriculture Hall, East Lansing, Michigan 48824-1039: E-mail: [email protected] 3 Former Research Fellow, Markets, Trade and Institutions Division, International Food Policy Research Institute, 2033 K Street NW Washington, D.C. 20006: E-mail: [email protected]

6
infrastructure required for the development of grain markets. The key challenge now is to
move beyond market liberalization to the issue of how to design input and output markets
to catalyze smallholder productivity and income growth (Jayne et al., 2002).
In spatial price analysis, the terms �spatial market efficiency� and �spatial market
integration� are very widely used, sometimes interchangeably. However, there has been a
growing recognition that these terms are related but not equivalent, and that there is a
need to distinguish between them (Fackler, 1996; McNew, 1996; McNew and Fackler,
1997; Fackler and Goodwin, 2001; Barrett et al., 2000; Barrett and Li, 2002). Spatial
market efficiency is an equilibrium condition whereby all potential profitable spatial
arbitrage opportunities are exploited. Spatial efficiency is concerned with whether the
optimal amount of trade is occurring. This optimality condition requires that spatial price
differentials be less than or equal to transfer costs, equal with trade. If there is no trade, a
spatial price differential less than transfer cost is also consistent with spatial market
efficiency. However, if the spatial price differential is greater than transfer cost the
market is inefficient either with or without trade.
On the other hand, spatial market integration is defined as the extent to which
demand and supply shocks arising in one location are transmitted to other locations
(Fackler, 1996; McNew, 1996; McNew and Fackler, 1997; Fackler and Goodwin, 2001).
Observing direct trade flows between two spatially distinct markets is a sufficient but not
necessary condition for some degree of spatial market integration (Barrett et al., 2000;
Barrett and Li, 2002). Direct trade linkages between regions are not necessary for spatial
integration because if regions belong to a common trading network then price shocks
may be transmitted indirectly through the network (Fackler and Goodwin, 2001). Markets
that are not well integrated may transmit inaccurate price information that distorts
marketing decisions and contributes to inefficient product movements (Goodwin and
Schroeder, 1991).
Market integration has usually been conceived in terms of the co-movements or
long-run relationship between spatial prices (Fackler, 1996). However, spatial integration

7
is neither necessary nor sufficient for spatial efficiency (and vice versa) so that tests for
integration do not always generate the appropriate inference regarding spatial market
efficiency (Fackler, 1996; McNew, 1997; McNew and Fackler, 1997; Fackler and
Goodwin, 2001; Barrett et al., 2000; Barrett and Li, 2002). It is argued that the
conventional methods assume methods assume stationary spatial marketing margins,
stationary transfer costs, and/or that markets are linked by a constant trade pattern (uni-
directional and continuous). However, these assumptions are often violated and so the
resulting test of market integration may be misleading and have adverse consequences on
policy decisions. The development of the parity bounds model (PBM) represents one
attempt to make the distinction between spatial market integration and spatial market
efficiency more clear, while overcoming most of the weaknesses of the conventional
methods of testing for market integration. When data on prices, transfer costs and trade
flows are simultaneously available, the PBM allows a clear distinction between spatial
market efficiency and spatial market integration (Barrett and Li, 2002).
The effects of policy changes on spatial grain market efficiency can be either
instantaneous or gradual. The standard PBM has been used mostly to analyze spatial
grain market efficiency within a given (constant) marketing policy regime (e.g. Sexton et
al., 1991; Fafchamps and Gavian, 1996; Baulch, 1997; Barrett et al., 2000; Barrett and Li,
2002; Penzhorn and Arndt, 2002). In cases where it has been used to analyze the effects
of marketing policy changes on spatial market efficiency, the effect of policy changes is
assumed to be instantaneous (e.g. Park et al., 2002). This involves simply estimating a
different PBM for different sub-periods, with each sub-period corresponding to a
different policy regime. However, the PBM may be mis-specified and the results and
policy implications might be misleading if the actual effect of marketing policy changes
on spatial market efficiency is gradual and moves through a transition period, as might be
expected in many cases. It may take some time for the traders to learn and understand the
new marketing policy changes, assess its implications for reorganizing their businesses,
make new investment and disinvestment decisions, and to access resources required to
make the necessary adjustments in response to policy changes.

8
In general, the standard PBM does not allow for a test of a structural change in
spatial grain market efficiency due to policy changes. Knowledge of the time path of the
effects of market reform on spatial market efficiency would be very useful for properly
assessing the effects of marketing policy changes on spatial market efficiency, and for
designing marketing policies, institutions and marketing infrastructure. Thus, there is a
need to improve and extend the standard PBM so that it allows for gradual transition
between spatial market efficiency states as a result of changes in the policy environment,
and to develop a test of whether such structural changes in spatial market efficiency are
statistically significant.
Another problem with implementing the PBM empirically is that time series data
on transfer costs are rarely available, particularly in developing countries like Ethiopia.
As a result, most empirical PBM studies have assumed transfer costs are equal to a
constant plus a serially uncorrelated error for a given marketing policy regime (e.g.
Sexton et al., 1991; Fafchamps and Gavian, 1996; Baulch, 1997; Barrett et al., 2000;
Barrett and Li, 2002; Penzhorn and Arndt, 2002). However, this assumption is very
restrictive, particularly when the PBM is used to analyze the effects of policy changes.
This is because if transfer costs are assumed to be equal to a constant plus a serially
uncorrelated error when they actually fluctuate systematically over time, then the PBM
may misinterpret spatial price deviations as evidence of inefficiency when they are
actually just a rational response to changes in transfer costs. Thus, there is a need to go
beyond the conventional constant transfer cost assumptions and find better ways of using
data that are available to construct more appropriate inferences about historical
movements in transfer costs.
In October 1999, in its continued market reform process, the Ethiopian
government amalgamated the Ethiopian Grain Trade Enterprise (EGTE) with the
Ethiopian Oil Seeds and Pulses Export Corporation (EOPEC) and re-established it as a
public enterprise. The amalgamated EGTE is not required to intervene directly to
stabilize grain prices, and its major objective is commercial profitability by focusing on
exportable grains (Bekele, 2002). The effect of the changes in the EGTE�s organizational

9
structure and its reduced role in stabilizing grain prices, on spatial grain market efficiency
has not been studied so far. Such information should be useful to policy makers,
researchers, and donor communities interested in understanding the effects of grain price
stabilization policy changes on grain market development in Ethiopia. It would inform
the debate concerning the design and implementation of new grain marketing policies
that facilitate the emergence of a well developed and competitive grain marketing system
in Ethiopia, and may have implications for other developing countries involved in their
own market reform processes.
There are two major objectives in this study: (1) to provide an improved modeling
approach for analyzing the adjustment path and the extent of structural change in spatial
grain market efficiency in response to policy changes; and (2) to provide empirical
evidence on the dynamic adjustment path of structural changes in spatial market
efficiency for maize and wheat in Ethiopia as a result of grain marketing policy changes
implemented in October 1999.
A stochastic gradual switching model is developed which builds on the standard
parity bounds model and extends it in two ways. First, the extended model traces the
adjustment path of spatial efficiency changes in response to policy changes and tests
whether the effect of a policy change is instantaneous or gradual. If it is gradual, the
model also allows determination of the length of time required for the transition from old
to new spatial efficiency regime. Second, the extended model allows for statistical tests
for structural change in spatial efficiency regimes due to the policy changes. In the
process of implementing the extended PBM model to study spatial market efficiency in
Ethiopian grain markets, it is shown how the standard transfer cost assumptions can be
generalized, even if a full time series of transfer cost data are not available, as long as one
has access to cross-sectional transfer cost data for particular periods that have been
collected via trader surveys and time series data on truck shipment freight rates.
The remaining sections of the paper are organized as follows. The following
section provides a detailed specification of the parity bounds model and extends it to

10
enable analysis of the dynamic effects of marketing policy changes on spatial grain
market efficiency. The data sources and descriptions are given in section three. The
empirical results for maize and wheat are presented in section four. Finally, the summary
and conclusions are provided in section five.
2. EMPIRICAL MODEL
In Ethiopia, there is a great diversity among different regions in terms of their
agricultural production conditions such as soils, climate, and rainfall. As a result, it has
been observed that some regions have excess supply while other regions have excess
demand which gives rise to the possibility of interregional grain trade. This section
discusses the conceptual framework for analyzing the performance of interregional grain
trade in terms of efficiently allocating grain over space. Building on the standard parity
bounds model, an empirical model that allows for an adjustment path and a test of
structural change in spatial market efficiency due to policy changes is developed and
outlined.
2.1 CONCEPTUAL FRAMEWORK
A recent review of models used in spatial price analysis can be found in Fackler
and Goodwin (2001). In general, empirical tests of the performance of spatially separated
markets are conducted within the framework of spatial price equilibrium (SPE) theory
developed by Enke (1951), Samuelson (1964) and Takayama and Judge (1964). The key
prediction of this theory is that price relationships between spatially separated
competitive markets depend on the size of transfer costs. In particular, in spatially
efficient markets the price difference between regions engaged in trade should be less
than or equal to transfer costs.
Consider two markets located in different regions (i and j) that may engage in
trade for a given homogenous commodity. For the two regional markets, the autarky

11
prices (prices which equalize the supply and demand in respective regional markets
without trade) at time t for market i and j can be represented as:
(1) ititA
itP ζα +=
(2) jtjtA
jtP ζα +=
where αit and αjt are time varying mean autarky prices which depend on supply and
demand shifters in the local markets, and itζ and jtζ are stochastic disturbance terms
affecting the autarky prices in the respective regional markets. The transfer costs, TCjit,
for conducting interregional trade between the two regional markets at time t is modeled
as a random variable with time varying mean transfer costs, jitγ and random component
ejit:
(3) jitjitjit eTC += γ
where ejit is normally distributed with mean zero and variance σe2 for all trade
regime probabilities. Given the above formulation of autarky prices and transfer costs,
three mutually exclusive and exhaustive spatial arbitrage conditions or trade regimes
could be identified based on the relative sizes of contemporaneous spatial price
differentials and transfer costs.4
In regime one, trade may or may not be occurring and the spatial price differential
is equal to transfer cost:
(4) jitjtit TCPP =−
18 The assumption of contemporaneous relationship between spatial prices can also be relaxed. Thus, trading regimes that take into account the lag/lead relationships between the spatial market prices can also be formulated.

12
where Pit and Pjt are contemporaneous prices in the ith and jth regional markets,
respectively. This is a condition for a spatially efficient market either with or without
trade. In this regime, due to competitive pressure in the marketing system, the traders are
not making excessive or economic profits from regional trade. With trade between the
two regional markets, the actual prices Pit and Pjt may differ from the autarky prices and
the price movements in different markets are related due to changes in either market�s
supply and demand conditions or the stochastic disturbance terms.
In regime two, the spatial price differential is less than transfer cost and is given
as:
(5) jitjtit TCPP <− .
This regime represents a market condition where no profitable arbitrage
opportunities exist between the two markets. The two markets may be in autarky but
prices are efficient. However, if there is trade it is inefficient because traders are making
losses. This indicates that efficient allocation does not necessarily require physical trade
flows between markets. In this regime the autarky prices and the efficient prices are
identical in the respective regional markets. The prices in the two regions are independent
due to very high transfer costs, and shocks are not transmitted across the markets.
Finally, regime three is given as a condition where trade may or may not be
occurring and the spatial price differential is greater than the transfer cost:
(6) jitjtit TCPP >− .
In this regime, the spatial arbitrage condition is violated and the markets are not
efficient but may be integrated to some extent if some trade is occurring. In this regime,
there are opportunities for profitable spatial arbitrage that are not being exploited. If the

13
markets are efficient, competition is expected to equalize the spatial price differentials
and transfer costs, and the transfer costs are the largest price difference that can exist
between two markets engaged in trade. It is argued that violation of the spatial arbitrage
condition is an indication of the existence of impediments to trade between markets and
should be considered as evidence supporting the lack of perfect market integration
(Baulch, 1997). Among several conditions that may lead to regime three is the existence
of transportation bottlenecks, non-competitive pricing practices, government controls on
product flows between regions, government price support activities, licensing
requirements, and quotas (Tomek and Robinson, 1990; Baulch, 1997). The empirical
model is discussed next.
2.2 THE EXTENDED PARITY BOUNDS MODEL
The empirical model developed here to analyze the effects of the policy changes
on spatial grain market efficiency is a stochastic gradual switching model. Building on
the earlier work of Baulch (1997), Sexton et al. (1991) and Spiller and Wood (1988), this
model extends the standard PBM in two ways. First, it traces the time path of the effects
of the policy changes on the spatial efficiency regime probabilities. This allows
determination of whether the effect of the policy changes is instantaneous or gradual and
if it is gradual the approach also allows the determination of the time period required for
the full effects of the policy changes to be realized. Thus, the extended model provides a
better understanding of the nature of transition from old to new policy regime. Second,
the extended PBM also allows for statistical tests of structural change in the probabilities
of spatial efficiency regimes due to the policy changes.
Let the probability of regimes one, two, and three defined as before be λ1, λ2, and
λ3, respectively. Suppose that transfer costs are unobservable but known to be related to
an (possibly biased) observable transfer cost estimate ojitγ . Then, the unobservable
transfer costs can be modeled as:

14
(7) jitojitjit eTC ++= γββ 10
where ojitγ is the observable transfer cost estimate, β0 and β1 are unknown parameters and
ejit is a random shock.5 The ojitγ is also given as:
(8) )( 121 tjittojit FRPFR αααγ ++=
where α1 is the proportion of transport cost in the interregional grain trade
computed from cross-sectional surveys of grain traders, FRt is the freight rate at time t
and α2 is traders normal profit assumed to be 7% of the sum of grain purchase price (Pjit)
plus tFR1α . Then, assuming that spatial prices and transfer costs are stochastic and the
transfer cost between the two markets is independent of the direction of trade flows, we
can redefine the conditions for regimes one, two and three given in equations (4), (5) and
(6), respectively, as follows:
(9) jitojitjtit ePP =−−− γββ 10
(10) jitjitojitjtit uePP −=−−− γββ 10
(11) jitjitojitjtit vePP +=−−− γββ 10
where ujit and vjit are non-negatively valued random variables that measure the
deviation (if any) between price differentials and transfer costs. The error terms ejit, ujit,
and vjit are assumed to be normal, half-normal, and half-normal independently distributed
random variables with standard deviation equal to σe, σu, and σv, respectively. The ejit is
an error term which applies to the transfer costs. The ujit and vjit are composite error terms 5 The detailed discussion of the procedures used in the construction of grain transfer costs from cross-sectional surveys of grain traders and time series data on truck shipment freight rates is given in section 3.

15
of the disturbance terms in the demand and supply functions for the pair of markets
considered, and their magnitude depends on the relative imbalances between demand and
supply in individual markets.
In regime one, the markets are spatially efficient and the variance of the spatial
price differentials is given by the variance of transfer costs between the two markets, σe2.
In other words, the variability in the spatial price differentials is explained fully by the
variability in the transfer costs between the two markets. Then, the parity bounds (or
confidence interval) for the spatial price differentials can be constructed using the
variance of the disturbance term for regime one and the exogenously given or
endogenously estimated transfer costs. Thus, the parity bounds for spatial price
differentials can be given as ojitγββ 10 + ± Zσe, where Z is a critical value for normal
distribution at a given statistical significance level. On the other hand, the variance of the
spatial price differentials under the autarky condition is given as σe2 + σu
2 while the
variance of spatial price differentials for regime three is given as σe2 + σv
2.
Let the contemporaneous difference between spatial price differentials and
transfer costs be given as a random variable πt= |Pit-Pjt| - ojitγββ 10 − , where πt can be
considered as expected �economic� profit made from regional trade.6 Then, the joint
probability density function for πt over the entire trading regime is given as:
(12) ( ) ( ) ( ) ( )θπλλθπλθπλθπ |)1(||| 3212211 tttttttt ffff −−++=
where λ1, λ2 and λ3 =(1 - λ1 - λ2) are defined as before; the fit�s are mixture normal
distributions which are given for regime one, two, and three, respectively; and θ is a
parameter vector (λ1, λ2, λ3, β0, β1, σe2, σu
2, and σv2) to be estimated. The probability
density function for regime one is the ordinary normal density function while for regime
6 The spatial price differential is also corrected for losses during storage and transporting grain and the procedure used is discussed in chapter 6.

16
two and regime three the density functions are truncated half-normal density functions
and are given as follows:
(13) ⎥⎥⎦
⎤
⎢⎢⎣
⎡ −−−=
e
ojitjtit
et
PPf
σ
γββϕ
σ10
11
(14) ( ) ( )( )
( )⎥⎥⎥⎥
⎦
⎤
⎢⎢⎢⎢
⎣
⎡
⎥⎥⎥⎥
⎦
⎤
⎢⎢⎢⎢
⎣
⎡
+
−−−Φ−
⎥⎥⎦
⎤
⎢⎢⎣
⎡
+
−−−
⎥⎥⎦
⎤
⎢⎢⎣
⎡
+= 2/122
10
2/122
10
2/1222 12
ue
e
uojitjtit
ue
ojitjtit
ue
t
PPPPf
σσ
σσ
γββ
σσ
γββϕ
σσ
(15)
( ) ( )( )
( )⎥⎥⎥⎥
⎦
⎤
⎢⎢⎢⎢
⎣
⎡
⎥⎥⎥⎥
⎦
⎤
⎢⎢⎢⎢
⎣
⎡
+
−−−−Φ−
⎥⎥⎦
⎤
⎢⎢⎣
⎡
+
−−−
⎥⎥⎦
⎤
⎢⎢⎣
⎡
+= 2/122
10
2/122
10
2/1223 12
ve
e
vojitjtit
ve
ojitjtit
ve
t
PPPPf
σσ
σσ
γββ
σσ
γββϕ
σσ
where ϕ (.) and Φ (.) denote the standard normal probability density and
cumulative distribution functions, respectively.
The likelihood function for πt based on the joint probability density functions
defined above for the different trade regimes over the entire study period is given as:
(16) [ ]∏=
−−++=T
tttt fffL
13212211 )1( λλλλ .
The parameters can be obtained by maximizing the logarithm of the above
likelihood function using numerical optimization. However, this is the standard PBM that
does not allow us to see the adjustment paths and the effects of the policy changes on the
probabilities of different trade regimes.

17
Park et al. (2002) were the first to apply the PBM to analyze the effects of market
reform on spatial market efficiency. Park et al. (2002) estimated the relative frequencies
of realized spatial arbitrage opportunities for Chinese grain markets over four sub-periods
under the implicit assumption that the effects of policy changes on the regime
probabilities are instantaneous. Here, however, we allow both for instantaneous and
gradual change in regime probabilities due to the policy changes. In other words, our
model allows us to estimate the length of adjustment period required for the full effects of
policy changes to be realized.
Our proposed PBM extension changes the standard PBM from a stochastic
switching model to a stochastic switching model with gradual probability changes.
Hereafter we call this the extended parity bounds model (EPBM). The model allows the
identification of time paths characterizing the structural changes in regime probabilities
as a result of the policy changes. It is possible that there may be immediate adjustment
from the old to the new policy regime, which implies that the full effects of the policy
changes are instantaneous or abrupt. However, the assumption of instantaneous
adjustment in market conditions in response to policy changes may be unrealistic. It
might take some time for the traders to learn and understand the new policy changes,
assess the implications for reorganizing their business, make investment and
disinvestment decisions, and to obtain resources required to make necessary adjustments.
The EPBM allows determining the path of structural changes in regime probabilities as a
result of the policy changes.7
7 The information on the nature of the adjustment path across several markets is useful to see if there are differential responses to policy changes among different markets and to determine what policy changes are required in order to speed up the response.

18
To accomplish the above objectives we modify the joint probability density
function and likelihood function for standard PBM given in (12) and (13) as follows:
(17)
( ) ( ) ( ) ( ) ( )
( ) ( )θπδδλλ
θπδθπλθπδθπλθπ
|1
|||||
32121
22221111
tttt
tttttttttttt
fDD
fDffDff
−−−−
++++=
(18)
( )[ ]∏=
−−−−++++=T
tttttttttt fDDfDffDfL
13212122221111 1 δδλλδλδλ
where δk measures the structural change in the probability of being in regime k
due to the policy changes and Dt is a transition variable, which characterizes the
alternative time path of structural change in regime probabilities and is constructed
following Ohtani and Katayama (1986) as described below.
Let the end date of the old marketing policy regime and the beginning date for
realization of the full effect of the new policy on regime probabilities be denoted by τ1
and τ2, respectively. Then, Dt takes the value of 0 for τ1 and earlier dates, between 0 and 1
for the period between τ1 and τ2, and 1 for τ2 and later dates. The length of period
between τ1 and τ2 represents the length of transition period required for the adjustment in
the grain marketing system before the full effects of the policy changes on trade regime
probabilities are realized.
The pattern of transition from τ1 to τ2 can be represented using different functional
forms (linear or non-linear). Figure 2.1 shows alternative linear time paths for the
transition from τ1 to τ2 as represented by different Dt�s. For example, if the length of
transition period is 10 months then 1/10 (10%) of the adjustment occurs every month and
by the 5th month half of the adjustment is complete. Thus, the linear functional form for
the transition period assumes constant speed of adjustment over the whole transition

19
period.8 In our model, τ1 is known but τ2 is treated as a parameter to be estimated. The
log likelihood function is maximized for different possible τ2 values and the τ2 value that
has the maximum log likelihood function is selected. The different lengths of transition
period are captured by using N-τ1 different transition variables corresponding to each
time period since the introduction of the new policy regime, where N is the total number
of observations. In our case, N-τ1 is equal to 35 and thus the number of maximized log
likelihood values is 35.
The approach followed here is similar to that of Moschini and Meilke (1989),
which is used in the estimation of the time path of structural change in U.S. meat
demand. However, there is one basic difference between our approach and Moschini and
Meilke (1989). In the case of Moschini and Meilke (1989), both the starting date (τ1) and
the end date (τ2) are to be estimated from the model. But in our case the starting date is
known and only the end date is to be estimated from the model. The optimum length of
transition period is given by the length of time elapsed between τ1 and τ2. The case where
τ2 is equal to τ1+1 (a period immediately after the policy changes) represents abrupt or
instantaneous change in policy regime, which implies no transition period.
On the other hand, τ2 greater than τ1+1 represents a gradual transition from old to
the new policy regime. The length of transition period depends on the flexibility that
grain traders have to make investment or disinvestment decisions as deemed necessary in
response to the new marketing policy changes. It also depends on the extent of awareness
of grain traders about the new marketing policy changes and how they perceive the
effects of policy regime changes on their grain business operation. It can be hypothesized
that different grain traders in different regions have different capacity and ability to
assess and respond to changes in the marketing policy environment.
8 In other studies of structural changes, functional forms which allow for different speed of adjustment during the different times of the transition period are also used (for example, see: Goodwin and Brester, 1995).

20
The case where the effect of the policy changes is instantaneous is a special case
of EPBM, which is equivalent to separately estimating the PBM parameters for different
sub-periods. This corresponds to the Park et al. (2002) specification. The joint test of
structural changes in all regime probabilities is conducted using the likelihood ratio test
based on the restricted (no structural change) and unrestricted EPBM parameter
estimations. The restricted EPBM is estimated by setting all δ�s to zero which means
under the null hypothesis of no structural change the LR test statistic is χ2 distributed
with three degrees of freedom. In addition, where the LR test shows significant structural
change, individual t-tests are used to test significance of EPBM parameters. For example,
statistically significant values for δk indicate that there has been structural change in the
probability of trade regime k as a result of a given policy change.
Thus, the probabilities for the different trade regimes are determined
simultaneously for the three periods: (1) period before the policy changes, (2) during the
transitional period, (3) the period during the full effect of the policy changes. For
example, a time path of structural change in a regime probability where the probability
has increased as a result of policy change is given for a hypothetical case in Figure 2.2.
For the period before the policy changes, the probability estimates for the different trade
regimes are given by λi. On the other hand, the probability estimates for the transition
period and after the full effect of the policy changes is realized are given as:
(19) tii Dδλ + .
Since the parameter estimates are probabilities, the probabilities for a given time
period should add up to one over the entire trade regimes, which requires the impositions
of the following restrictions during the estimation procedure:
(20) 10 ≤≤ iλ
(21) 10 ≤+≤ ii δλ

21
(22) 1=∑ iλ
(23) 0=∑ iδ
In general, the EPBM represents an improvement over the standard PBM in that it
allows tracing of the time path and a statistical test of structural change in spatial market
efficiency due to the policy changes. However, the EPBM also has several weaknesses
similar to that of the standard PBM which are discussed by Fackler (1996). First, the
results are often sensitive to the distributional assumptions made. Second, the difficulty
in accurately estimating the transfer costs might also bias the results. Third, there is also
the identification problem that any estimated effects may be due to other changes that
occurred around the time of the policy change.
2.3 ESTIMATION PROCEDURES
There are four basic stages in EPBM estimation. The first stage is to collect grain
prices and transfer cost data. The second stage is to specify the appropriate log likelihood
function to be maximized using a maximization algorithm. The third stage is to determine
the optimum time length required for the transition from old to new policy regime. The
optimum time length is determined by maximizing the value of log likelihood function
for all possible time lengths of transition period. Finally, the EPBM parameters estimates
are obtained conditional on the optimum length of time required for the transition from
the old to the new policy regime.
The log likelihood function being maximized to obtain EPBM parameters
estimates is highly non-linear. As a result, there are two major problems that might be
encountered in numerical maximization: (1) the existence of multiple local maxima, and
(2) lack of convergence. There are several strategies that can be used to tackle these

22
problems, as discussed in the TSP users guide (Hall and Cummins, 1999). These
strategies include: (1) the choice of appropriate maximum likelihood estimation
algorithm, (2) the choice of appropriate starting values, and (3) grid search on certain
difficult parameters or full grid search on all parameters. In addition, graphical analysis
of the relationship between spatial price differentials and the transfer costs series is also
useful in assessing the EPBM estimates.
There are several algorithms provided in TSP to maximize the log likelihood
function. In our case, we used the Broyden-Fletcher-Goldfarb-Shanno (BFGS) algorithm,
which is found to perform best in our situation as compared to other algorithms available.
The BFGS uses analytic first derivatives and a rank one update approximation to the
Hessian (Hall and Cummins, 1999). During the estimation procedure, the values of
regime probabilities are restricted to the range between 0 and 1 and the standard
deviations are also restricted to be positive using implicit functional forms.
Figure 2.1 Alternative Linear Time Paths of Structural Change in Trade Regime Probabilities (1996:08 to 2002:08)
.00
.10
.20
.30
.40
.50
.60
.70
.80
.90
1.00
1996 1997 1998 1999 2000 2001 2002
Year
D t

23
Figure 2.2 Time Path of Structural Change in Trade Regime Probability due to the Policy Changes for a Hypothetical Case
Regime probability λi + δi Adjustment path λi λi + δiDt τ1 τ2 Time Period

24
3. DATA
There are two cereal crops, white maize and white wheat (from now on, simply
referred to as maize and wheat), which are considered in this study based on
completeness of the dataset available, importance in interregional grain trade, and degree
of homogeneity of consumer preferences. Teff, which is a very important staple crop in
Ethiopia, is not included in this study due to the difficulties involved in examining spatial
price relationships among regional teff markets. This is because teff varieties grown in
different locations are heterogeneous and consumer preferences for these varieties are
variable, but the available teff price data for Addis Ababa and other regional markets are
based only on the color of teff. The more appropriate teff price data needed for spatial
price analysis would be collected by color and origin of teff.
The main data required for estimating the parity bounds model are wholesale
grain prices for different markets, interregional grain transfer costs and the start date for
the new policy regime. For this purpose, weekly wholesale maize and wheat price data
are obtained from the Ethiopian Grain Trade Enterprise (EGTE) for the period from
August 1996 to August 2002. There are ten important markets, which are considered in
this study, which are either from grain surplus areas or grain deficit areas. The markets
selected from the surplus producing regions include Addis Ababa, Bale Robe, Hosanna,
Jimma, Nazareth, Nekempte, and Shashemene, while the markets selected from the
deficit regions include Dessie, Dire Dawa, and Mekele. Most of these markets are
considered in the spatial price analysis of both maize and wheat, while few are
considered only for either maize (e.g., Jimma and Nekempte) or wheat (e.g., Bale Robe
and Hosanna).
Since August of 1996, the EGTE has collected weekly price data for different
varieties of five major cereal crops at different stages of the vertical marketing channels
(producer, wholesale and retail) in 26 markets. The cereal crops consisted of maize
(white and yellow), teff (white, mixed, and red), wheat (white, red, mixed, and food aid

25
wheat), sorghum (white, yellow, and red), and barley (white, black and mixed).9 The
price data are collected by EGTE field staff who transmit weekly price data to the
EGTE�s headquarters in Addis Ababa by telephone. Then, the price data are entered into
computer spreadsheets and compiled for further analysis or for distribution of raw data to
various users.
The weekly price series are converted into monthly series by taking the
unweighted mean of weekly price observations for a given month. The weekly price
series is converted into monthly price series for two main reasons. First, the frequencies
of transfer costs were monthly or annual, so monthly aggregation is needed to have
comparable levels of aggregation for both wholesale prices and transfer costs. Second,
the use of low frequency (monthly or annual) price data is recommended in order to
allow sufficient time for the realization of inter-market arbitrage (Baulch, 1997).
The EGTE has also collected qualitative weekly grain flow data for the same
markets and this data available for the periods from August 1997 to June 1998 and from
January 1999 to August 2002. The grain flow data collection was interrupted for six
months, from July 1998 to December 1998. This period coincides with the last phase of
the Grain Market Research Project. After GMRP was phased out in 1998, the grain price
and flow data collection has continued with the financial support from the European
Union (EU). For the selected commodities, the EGTE grain flow dataset consists of
market level weekly data on total quantity purchased in the market, percentage purchased
outside the market, the first and second most important sources of grain inflows to the
market, total quantity sold in the market, percentage sold outside the market and the first
and second most important destinations of grain outflows from the market.10
9 A well-organized and systematic grain price and flow data collection was started by Grain Market Research Project (GMRP) in August of 1996 having EGTE as an institutional home. The Grain Market Research Project was a collaborative research project among Ministry of Economic Development and Cooperation (MEDaC) of Ethiopia, Michigan State University (MSU) and USAID/Ethiopa. 10 The important sources and destinations markets are determined based on subjective assessment of EGTE�s filed staff and no actual grain flows are recorded by sources and destinations.

26
Interregional grain transfer costs are estimated using cross-sectional surveys on
marketing costs of interregional grain trade and time series truck shipment freight rates
data. The marketing costs of interregional grain trade are calculated based on two cross-
sectional surveys of grain traders in Ethiopia. The first survey was conducted by Gabre-
Madhin in 1996 while the second one was conducted in 2002 by International Food
Policy Research Institute (IFPRI) and International Livestock Research Institute (ILRI).
These surveys document detailed marketing costs on the latest transaction involving
either intraregional or interregional grain trade.
Monthly and annual time series freight rates data are collected from MEDaC and
the Ministry of Transport Authority (MTA) for the period from 1993 to 2002. The
portion of freight rate dataset series which is available only on an annual basis is
converted into a monthly series using a monthly freight rate index constructed from the
monthly freight rate series. Next, the construction of estimate of total grain transfer costs
using these two sources of data are discussed.
A complete time series data on interregional grain transfer cost is rarely available,
particularly in developing countries like Ethiopia. Given this problem, several approaches
have been used in measuring the transfer costs data needed for the implementation of the
PBM. If time series transfer cost data is readily available, it can be considered exogenous
in the PBM analysis (e.g., Barrett et al., 2000; Barrett and Li, 2002). However, if time
series transfer cost data is not available, there are two alternatives. The first alternative is
to estimate the transfer costs using the PBM based on the observed spatial price
differentials (e.g., Park et al., 2002). However, this implicitly assumes a time invariant
transfer cost. The second alternative is to estimate transfer cost data either using the
marketing cost computed from grain trader surveys and adjusting for inflation (e.g.,
Baulch, 1997) or inflating the time series transport cost data by a certain percentage to
account for the unmeasured components of transfer costs (e.g., Penzhorn and Arndt,
2002).

27
In our case, the specific procedures used in calculating interregional grain transfer
costs data for the implementation of the EPBM are as follows. The first step is to
calculate variable marketing costs for recently completed interregional grain trade from
cross-sectional surveys of grain traders. Following Gabre-Madhin (1996), the marketing
cost is classified into eight broad categories: sacking, handling, storage, transport,
roadblocks, broker�s service, travel, and tips and others. The average variable marketing
costs estimated for both 1996 and 2002 are roughly the same, about 26 Birr/100 kg
(Table 3.1). An examination of the structure of variable marketing costs indicates that the
transport cost is one of the most important components of the cost. For example, in 1996
about 61% of variable marketing cost is attributed to transport while in 2002 this
percentage is 72%. The unweighted average percentage of transport cost in the variable
marketing cost for the two sample grain traders� surveys is found to be 68.16%.11
In the second step, the computed unweighted average percentage of transport cost
is applied to time series freight rate data in order to obtain time series data on variable
marketing costs. For example, if transport cost accounts for 50% of the variable
marketing cost then, the time series variable marketing cost data is generated by
multiplying the time series freight rates by two.12
The opportunity cost of the wholesale grain trader as a manager of a grain
business is also included in the computation of the variable marketing cost of regional
grain trade. Thus, the computed value of interregional grain transfer cost is given as the
sum of the variable marketing costs and regional grain traders� �normal� profit margin
(see equation 8). In the context of regional grain trade, the �normal� profit margin could
11 The percentage of transport cost in the variable marketing cost is computed for the aggregate overall surveyed markets instead of computing it for individual markets or specific trade routes. This is because of limited number of observations for individual markets and trade routes in the grain trader surveys. The assumption of constant percentage of transport costs in marketing costs is very strong and implies that the only source of temporal variation in the transfer cost data is the freight rate. However, here the transfer cost computed from the trader�s survey is used only as a starting point in the EPBM estimation. Hence the assumption of constant percentage might not be as restrictive as is it initially appears. 12 The fixed/ operating costs like vehicle maintenance, storage and pest control, taxes and fees, wages, losses and costs of capital are difficult to obtain and are not included in the computation of marketing cost.

28
be the minimum profit the regional wholesale trader would be willing to accept to engage
in interregional grain trade. In other words, the normal profit is what the regional trader
would earn from the second best alternative employment. There is no readily available
estimate of traders� normal profit in Ethiopia. In this study, following Dessalegn et al.
(1998), the regional grain traders� normal profit is assumed to be 7% of the sum of
wholesale grain price in the exporting market and variable grain marketing costs.13
Finally, the computed interregional grain transfer costs is used as a regressor in the
subsequent parametric estimation of interregional grain transfer costs and trade regime
probabilities using the EPBM.
The spatial price differentials are obtained by taking the differences between the
wholesale grain prices in the importing and exporting markets after adjusting the
wholesale prices in the importing markets for grain losses (due to, for example, weight
losses, pests, spillages, etc.,) in the process of exporting grain. In this study, an average of
2.18% grain loss in transporting grain from one regional market to another is assumed
based on the estimate from grain trader survey by Dessalegn et al. (1998). They indicated
that 83% of the surveyed merchants experience weight loss ranging from 0.1% to 16%.
Thus, the importing market wholesale prices are multiplied by 0.9782 (1-0.0218) to
obtain the spatial price differentials used in the EPBM estimation.
13 Conceptually, the opportunity cost of those engaged in grain trade must be included in the computation of grain transfer cost. However, there is difficulty in obtaining accurate opportunity cost for managers of grain trade business and as a result very rough assumptions are made regarding trader�s normal profit. For example, Baulch (1997) adds certain fixed margins to the freight rates in order to derive the transfer costs. In our case, the normal profit is given as 7% of marketing costs and grain purchase price in the export market. The actual normal profit margin could be lower or higher than 7%. However, this assumption may not have a very significant impact on the EPBM results as the transfer costs computed from trader surveys are used only as starting points in the parametric estimation of transfer costs using the EPBM.

29
4. EMPIRICAL RESULTS AND DISCUSSIONS
Without information on the actual grain trade flow data, it is generally not
possible to estimate the exact probabilities of being in spatially efficient and spatially
inefficient regimes. This is because regime one (with or without trade) represents
spatially efficient arbitrage and regime three (with or without trade) represents spatially
inefficient arbitrage, but regime two could be either spatially efficient (without trade) or
spatially inefficient (with trade). In the presence of a significant probability of regime
two, actual trade flow data are required to separate the probability of regime two into
spatially efficient and inefficient outcomes. The EGTE grain flow data is used in the
interpretation of trade regime probabilities estimated by EPBM. Thus, in order to
facilitate the presentation of empirical results we first provide a brief description of
EGTE grain flow data involving the markets included in this study.
The minimum observed frequencies of maize and wheat trade flows for
selected market pairs are given in Table 4.1. The frequency of flow data for a given
market pair is determined based on the weekly observations of first and second most
important sources and destinations markets for a given commodity.14 The flow data is
observed on a weekly basis and aggregated to monthly flow observations and the
frequencies reported here are based on the number of months for which trade flow was
observed out of the possible 26 months before the policy changes and 35 months after the
policy changes.
The minimum frequency of maize flows between selected markets varied
from 15% to 100%. The lowest frequency of maize flow is observed between Dire Dawa
and Nazareth prior to the policy changes. After the policy changes, the frequency of
14 Furthermore, the frequencies are minimum observations because the information on trade flows when the market is less important (e.g., when a commodity ranks third, fourth, fifth, etc.,) as source or destination market is not collected. Thus the actual frequencies of trade flows could be equal or higher than the frequencies reported here.

30
maize flow decreased for 3 of 7 market pairs, increased for 3 of 7 market pairs and
remained the same for one market pair. In the case of wheat, the frequency of trade flow
varied from 39% to 100% for the period before the policy changes, and after the policy
changes the frequency of trade flow increased in two cases, decreased in two cases and
remained the same in three cases. In general, even with limited grain flow data, it is
observed that most of the selected market pairs are linked by continuous trade flows for
most of the time during the study period.
4.1 EMPIRICAL RESULTS FOR MAIZE
Empirical results from the EPBM are given in Table 4.2 for selected maize market
pairs.15 The conditional maximum likelihood estimates of trade regime probabilities
(λ�s), the change in trade regime probabilities (δ�s) due to the policy changes, and the
standard deviations of profit for different trade regimes (σ�s) are shown at the top of
Table 4.2. The estimated lengths of transition periods, the values of the log likelihood for
restricted (no structural change) and unrestricted estimations, the chi-square (χ2) statistics
for likelihood ratio (LR) tests of the joint hypothesis of no structural change in regime
probabilities, and the number of observations used in the analysis are shown at the
bottom of Table 4.2. The plots of the sizes of losses or gains from inefficient trade for
selected maize market pairs are given in Figure 4.1.
For the period before the policy changes, the probability of regime one (λ1),
where the spatial price differential is equal to transfer cost, is less than 1% and
statistically significant at the 1% level for 3 of 7 selected maize market pairs. It varied
from 20% to 34% for the other 4 of 7 selected market pairs. Thus, prior to the policy
changes, the probability of the spatial price differential being equal to transfer cost, which
is consistent with spatial market efficiency whether or not trade is actually occurring, is
very low for most market pairs and, less than 35% for all market pairs.
15 A Monte Carlo experiment is conducted to investigate the performance of EPBM estimation procedure and improve understanding of how the PBM works. The detailed discussion of the design and the results of simulation using the EPBM are given in Asfaw, 2004.

31
On the other hand, the probability of regime two (λ2), where the spatial price
differential is less than transfer cost, is found to be large and statistically significant at the
10% level for all maize market pairs. For example, the probability of being in regime two
prior to the policy changes are greater than 65% and statistically significant at the 1%
level for 6 of 7 selected maize market pairs. Regime two can also be consistent with
spatial market efficiency if no trade is occurring between the markets. If trade does occur
in regime two, then it is presumably conducted at a loss, which would be inconsistent
with spatial market efficiency.
During the same pre-policy change period, the probabilities of regime three (λ3),
where the spatial price differential is greater than transfer cost, is found to be small but
statistically significant in most cases. The only large and statistically significant
probability of regime three is observed between Addis Ababa and Mekele, which has a
68% probability of regime three, which is statistically significant at the 1% level. Of
course, regime three is spatially inefficient whether there is trade or not because there are
arbitrage profits from potential trade.
In general, the period before the policy changes is characterized by large and
statistically significant probabilities of the spatial price differential being less than
transfer cost, while the probability of the spatial price differential being greater than or
equal to transfer cost is generally small. This indicates that the probability of profitable
spatial arbitrage opportunities (probability of regime one plus probability of regime three)
for maize prior to the policy changes is very low for the selected maize market pairs. The
fact that regime two dominates also indicates that there is a high probability that maize
traders made losses during this period, if they engaged in actual trade.
The one exception to the above conclusion is Addis Ababa � Mekele, which was
estimated to have a 68% probability of spatial price differential greater than transfer cost,
indicating spatial inefficiency and potential gains from additional trade. This result is
consistent with the observation of strict and persistent control on grain flows from Addis

32
Ababa to the Tigray region, which might have created maize shortages in Tigray and
increased prices there. The purpose of the grain movement control was to raise tax
revenue. The grain movement control was enforced through a roadblock raised at
Alamata, a small town which is strategically situated on a major grain route connecting
Addis Ababa to Mekele. It is a strategic location because grain traders who want to ship
grain to Mekele from or via Addis Ababa do not have any better alternative route by
which they can avoid this roadblock. Grain can also enter Tigray via Gonder in the North.
However, this route involves longer distance and its costs may have exceeded the
roadblock charge at Alamata. Thus, the ability of regional maize traders to take
advantage of profitable spatial maize trade opportunities between Addis Ababa and the
Tigray region is limited by this regional grain trade block.16
With very large and statistically significant estimated probability of spatial price
differential less than grain transfer costs, one would generally expect very low maize
flow among these markets during this period, because spatial arbitrage would be
unprofitable. In other words, the probability of market segmentation is very high.
However, a close examination of maize flow data between these markets during this
period shows that there have indeed been frequent maize flows between these markets.
This would suggest maize traders were engaged in maize trade but were making losses
which indicate spatial inefficiency.17
For example, based on the EGTE�s grain flow data, maize trade flow between
Jimma and Addis Ababa and Wellega and Addis Ababa occurred at least for 95% of the
months prior to the policy changes (Table 4.1). At the same time the probabilities of
spatial price differential less than transfer cost is at least 75%. These results indicate there
is high probability of spatial maize market inefficiency prior to the policy changes.
Generally, western maize producing regions like Jimma and Wellega have a limited
16 The roadblock charges are included in the computation of grain transfer costs. However, it is difficult to capture the whole magnitude of the roadblock charge from a few cross-section surveys. For example, the time wasted at the roadblock, the spoilage and quality deterioration, missed market opportunities can�t be easily quantified from cross-section surveys. 17 This result might also be due to aggregation error in the prices and transfer costs which masks periods when trade was profitable.

33
export outlet for surplus maize production, and it is commonly observed that, even when
prices are relatively low in Addis Ababa, maize exports to Addis continue from these
regions. Hence, prices continue to fall in Addis Ababa. Grain traders in surplus producing
regions have the option to sell their grain in their local markets when the price in Addis
Ababa or other regional markets is not favorable. However, the surplus absorption
capacities of local markets are limited.
There are several factors which might cause spatial inefficiency of maize markets
in which there is high probability of making losses by maize traders. First, the lack of
well-developed storage facilities in maize supply markets might force the continuous
flow of grain to central or other deficit markets, even if maize prices are not favorable in
these markets. The rationale for this might be to reduce further revenue losses because of
waiting for better price which might lead to spoilage, quality deterioration, and maize
prices in the maize destination markets might also further decrease while waiting.
Second, liquidity constraints and shortage of working capital due to missing or imperfect
credit markets for grain traders can also force maize traders to liquidate grain, even if it
means a loss. It has been observed that grain traders in Ethiopia have poor access to
formal credit and other forms of financial services. The authors� personal observation of
grain markets indicate that proceeds from current grain (e.g., maize) sales are used by
grain traders for refinancing future grain purchases and settling other debts which
indicate that the opportunity costs of capital tied up in grain stock is very high when the
grain traders have limited access to credit.
Third, regional maize wholesale traders might have difficulty matching profitable
purchase and sale decisions due to inadequacy or unavailability of market information
regarding future price movements and changes in supply and demand conditions in the
source and destinations markets. Fourth, there may be too many maize traders but these
traders might lack economies of scale in their operation contributing to higher cost of
marketing. Fifth, maize traders might also be limited by their grain trading skills to adjust
to the very dynamic grain marketing situations.

34
If inefficient (unprofitable) trades are taking place a natural question to ask is:
how do maize grain traders survive in the long-run in the face of high probability of
making losses? It is observed that the wholesale grain trade is not a specialized business
in Ethiopia. Regional grain traders usually keep a diversified portfolio of business
activities (grain and non-grain) and that might help to spread the risks. Regional grain
traders also combine interregional grain trade activities with local grain trade activities. A
lot of grain traders are also observed to operate without a license, while those with a
license complain about the unfair competition from unlicensed grain traders (Dessalegn
et al., 1998). Operating without a license might allow grain traders (experienced or new)
to enter and exit out of the grain trade sporadically, depending on market conditions, and
still avoid government tax payments hence reducing their marketing costs.
The other possible reason why the grain traders might survive could be due to the
offsetting or compensating effects of fewer but larger gains for many but smaller losses.
In order to investigate this issue we have computed the size of losses or gains from trade
and plotted these for selected maize market pairs in Figure 4.1. The sizes of losses or
gains from trade are computed as a proportion of the difference between spatial price
differential and transfer costs to the cost of grain plus the transfer cost. The plots show a
few episodes of unusually very high gains for most maize market pairs and there are also
episodes of very high losses. However, in order to exactly determine the compensating
effects of larger gains we need data on the total volume of grain transacted.
There are also indications that it might still be profitable for large-scale wholesale
grain traders to engage in spatially profitable arbitrage even when smaller wholesale
grain traders find it unprofitable. Osborne (1997) argues that large and small wholesale
grain traders in Ethiopia have different cost structures because of economies of scale.
This means that large wholesale traders can sell at the same price as the smaller traders
and still make a profit because of lower cost.
The standard deviations of �economic� profit from spatial arbitrage estimated for
different trade regimes are statistically significant at the 5% level for 19 of 21 cases. For

35
each market pair, the standard deviation estimated for regime three (σv) is found to be the
largest. As regime three is unambiguously inefficient, this indicates that the variability in
the �economic� profit from spatial arbitrage is higher when the market is inefficient. It is
also observed that the standard deviations of regime two are higher than that of regime
one in 5 of 7 cases. The other important observation regarding variance estimates is that
the standard deviations for market pairs involving Addis Ababa and deficit markets are
larger than the standard deviations involving Addis Ababa and surplus markets. This
indicates that the degree of risk in trading maize is relatively higher between Addis
Ababa and grain deficit markets than Addis Ababa and grain surplus markets.
Likelihood ratio (LR) statistics are used to test the joint hypothesis of no
structural change in trade regime probabilities due to the policy changes for selected
maize market pairs, after having estimated the optimal adjustment path to the policy
changes.18 The chi-square statistics for the LR tests are presented at the bottom of Table
7.2. The results show that there is no statistically significant joint structural change in
trade regime probabilities for 4 of 7 maize market pairs (Jimma and Addis Ababa, Addis
Ababa and Dessie, Nazareth and Dire Dawa, and Shashamane and Dire Dawa) at the 10%
level. On the other hand, the joint structural change in trade regime probabilities is
statistically significant at the 5% level in 3 of 7 maize market-pairs, which include Addis
Ababa and Nekempte, Addis Ababa and Dire Dawa and Addis Ababa and Mekele.
To some extent, the variation in the responses of regional maize markets to the
recent policy changes can be explained by the history of government market
interventions, which have varied from region to region and may have different effects on
the levels of private sector grain development and grain traders� perceptions of risk and
uncertainty. Generally, the markets where the policy change appears to have had little
effect appear to be where the private sector grain trade already had been relatively more
tolerated by the government marketing agencies during socialist regime (e.g., Nazareth
and Shashamane).
18 Optimal adjustment paths were chosen based on a likelihood maximization procedure, as discussed earlier. The optimal adjustment path estimates will be explained in more detail below.

36
During the socialist regime, it was observed that private grain trade in Southern
Ethiopia was much more tolerated by government marketing agencies than in other
regions of Ethiopia (Osborne, 1997). So the degree of risk and uncertainty perceived due
to the presence of EGTE in these markets might have already been low and the recent
policy changes might not bring significant change in the attitude and operations of private
grain traders. On the other hand, the joint structural change in regime probabilities is
statistically significant for trade between Nekempte and Addis Ababa. Nekempte is
located in a maize surplus producing region and has historically been one of the major
focuses of government marketing activities (private grain trade sector was highly
suppressed). So in this case the changes in policy appear to have had an effect. Structural
change is also significant for trade between Addis Ababa and Dire Dawa and Addis
Ababa and Mekele markets. Dire Dawa and Mekele markets are also grain deficit areas
where there had been heavy government intervention.
Of three maize market pairs with statistically significant joint structural change in
trade regime probabilities, Addis Ababa and Nekempte and Addis Ababa and Mekele
adjusted to the new policy changes gradually over a period of less than or equal to six
months while the trade between Addis Ababa and Dire Dawa adjusted instantaneously
(Table 4.2). The variation in the length of transition period among market pairs indicates
that the speed by with which grain traders adjust to new policy regimes may depend on
their location. The market pairs where the speed of adjustment is gradual appear to be
where the marketing infrastructure, like road network and grain storage, is relatively less
developed (e.g., Nekempte) and the destination market is far from surplus producing
areas and drought affected (e.g., Mekele). On the other hand, where the adjustment is
instantaneous (Dire Dawa) infrastructure is more developed with grain traders engaging
in relatively larger purchases having more storage capacity, longer experience in the
grain trade, and better road networks connecting the markets with other regional markets.
For markets where there is statistically significant structural change as a result of
policy changes, individual t-tests on the structural change parameters (δ�s) are evaluated

37
to investigate the effect of the policy changes on trade regimes probabilities. With the
policy changes, there is a large shift to regime three for Addis Ababa and Nekempte and
Addis Ababa and Dire Dawa, which suggests unexploited spatial arbitrage opportunities
have increased and spatial market efficiency has therefore declined. The probability of
spatial price differential less than transfer cost also decreased for both market pairs but
Addis Ababa and Nekempte experienced a large decrease, which is statistically
significant at the 5% level. However, the change in the probability of spatial price
differential equal to transfer cost is not statistically significant at the 5% level for both
market pairs.
For Addis Ababa and Mekele the probability of spatial price differential equal to
transfer cost increased and the change is statistically significant at the 5% level. The
probability of spatial price differential less than transfer cost also increased slightly but is
not statistically significant at the 10% level. The probability of spatial price differential
greater than transfer cost decreased considerably and this is statistically significant at the
5% level. The large decrease in the probability of spatial price differential greater than
transfer cost, and corresponding large increase in the probability of spatial price
differential equal to transfer cost, suggests an increase in spatial market efficiency.
In general, prior to the policy changes all the maize market pairs considered are
spatially inefficient with high probability. It is observed that the probability of spatial
price differential less than transfer cost is greater than 65% for 6 of 7 maize market pairs,
while the frequency of trade flow observed for these market pairs appears to be
significant. Together, these results indicate that grain traders were active but made loses
during this period. In other words, too much trade was taking place relative to that which
we would expect in a spatially efficient market. Policy changes had statistically
significant effect on regime probabilities at the 5% level in 3 of 7 maize market pairs.
However, as a result of the policy changes the spatial maize market efficiency has
improved only for trade between Addis Ababa and Mekele, while for the other market
pairs spatial efficiency either deteriorated (Addis Ababa and Dire Dawa) or was not
affected (the rest of market pairs).

38
4.2 EMPIRICAL RESULTS FOR WHEAT
The empirical results for selected wheat market pairs are given in Table 4.3. The
conditional maximum likelihood estimates of trade regime probabilities (λ�s), the change
in trade regime probabilities (δ�s) due to the policy changes, and the standard deviations
of profit for different trade regimes (σ�s) are shown at the top of Table 4.3. The estimated
lengths of transition period, the values of the log likelihood for restricted (no structural
change) and unrestricted estimations, the chi-square (χ2) statistics for LR tests of the joint
hypothesis of no structural change in regime probabilities, and the number of
observations used are shown at the bottom of Table 4.3. The plots of the sizes of losses or
gains from inefficient trade for selected wheat market pairs are given in Figure 4.2.
For the period before the policy changes, the probability of spatial price
differential equal to transfer cost is less than 1 % and statistically significant at the 1%
level for all wheat market pairs. Thus, the probability of the spatial price differential
being equal to transfer cost, which is consistent with spatial market efficiency whether or
not trade is actually occurring, is almost zero in all wheat market pairs.
The probabilities of spatial price differential less than transfer cost are also found
to be less than 1% and statistically significant at the 1% level for 5 of 7 wheat market
pairs. The probability of spatial price differential less than transfer cost is greater than
80% and statistically significant at the 1% level only for Addis Ababa and Dessie, and the
Dire Dawa and Nazareth market pairs. From EGTE flow data (Table 4.1), it is observed
that the frequencies of wheat flow for the same market pairs are 100% which indicate
strong trade flows even when the price differential does not cover transfer cost. This is
inconsistent with spatial market efficiency.
However, prior to policy changes, the probabilities of spatial price differential
greater than transfer cost are found to be very large and statistically significant at the 5%

39
level in most of the cases. For example, in 5 of 7 selected wheat market pairs (Bale Robe
and Addis Ababa, Hosanna and Addis Ababa, Addis Ababa and Dire Dawa, Addis Ababa
and Mekele and Shashamane and Dire Dawa), the probability of spatial price differential
greater than transfer cost is found to be greater than 99% and statistically significant at
the 1% level. For the period before the policy changes, a small probability of spatial price
differential greater than transfer cost is observed only between the Addis Ababa and
Dessie, and Nazareth and Dire Dawa wheat market pairs.
Thus, in the case of wheat, the period before the policy changes is characterized
by large and statistically significant probability of spatial price differential greater than
transfer cost, while the probability of spatial price differential less than or equal to
transfer cost are, with few exceptions, very small and mostly not statistically significant.
The very large probabilities of spatial price differential greater than transfer cost indicate
that the wheat markets are spatially inefficient. This could be due to the lack of
competition in wheat wholesale trade either in the production areas or consumption areas.
This could also be due to shortages of wheat supply in these markets resulting from
restrictions on grain movement such as through roadblocks at Alamata. The high
probability estimates of regime three are consistent with the observations of high
frequency of wheat flow between pairs of markets considered but the quantities supplied
might not be sufficient to meet the local demand.
Prior to the policy changes, the frequency of wheat trade flow between Addis
Ababa and Bale Robe is 89% while it is 100% between Addis Ababa and Hosanna (Table
4.1). However, given the normal or bumper harvests for most of the time before the
policy changes, observing a high probability of spatial price differential greater than
transfer cost is more consistent with lack of competition or due to restrictions in
wholesale wheat trade than the shortages of wheat to be supplied to these markets. In this
regard, a high concentration ratio of wheat wholesale trade is also observed for some
markets like Shashamane and Nazareth (Dessalegn et al., 1998). A high concentration
ratio is one of the conditions for anti-competitive behavior in the market. Even though
wheat grain traders made profit most of the time during the study period, there are also

40
periods when wheat traders made very high losses (Figure 4.2). For example, for Addis
Ababa and Mekele wheat market pairs a loss which is greater than 20% was observed.
The standard deviations of �economic� profit from spatial arbitrage estimated for
different trade regimes are statistically significant at the 5% level for 16 of 21 cases. For
each wheat market pair, the standard deviation estimated for regime three (σv) is found to
be the largest in 5 of 6 cases. As regime three is unambiguously inefficient, this also
indicates that the variability in the �economic� profit from spatial arbitrage is higher
when the market is spatially inefficient.
Likelihood ratio (LR) statistics are used to test the joint hypothesis of no
structural change in trade regime probabilities due to the policy changes for selected
wheat market pairs. The chi-square statistics for the LR tests are presented at the bottom
of Table 4.3. The results show that there is no statistically significant joint structural
change in trade regime probabilities for 6 of 7 wheat market pairs, at the 10% level. On
the other hand, the joint structural change in trade regime probabilities is statistically
significant at the 5% level for just 1 of 7 wheat market pairs.
Structural change due to the policy effect is significant only for Addis Ababa and
Mekele, which also shows instantaneous adjustment to the policy changes. For this
market pair, with the policy changes there is no change in the probability of spatial price
differential equal to transfer cost. However, the probability of spatial price differential
less than transfer cost increased and is statistically significant at the 5% level. The
probability of spatial price differential greater than transfer cost also decreased and this
decrease is statistically significant at the 5% level. This result is consistent with the
decrease in trade flow between Addis Ababa and Mekele which changed from 92% prior
to the policy changes to 66% after the policy changes (Table 4.1). In general, as result of
policy changes, the trade between Addis Ababa and Mekele changed from a situation of
too little trade (high probability of regime 3) to too much trade (high probability of
regime 2). Under these conditions it seems that traders made losses while the consumers
in Mekele market might have gained from the wheat price decrease. In most of the cases,

41
the Addis Ababa and Mekele market is observed to behave differently from other market
pairs, which might be because of the roadblock charges and control on grain going to
Tigray.
Prior to the policy changes, all the wheat market pairs considered are spatially
inefficient most of the time. In 5 of 7 market pairs, the probability of spatial price
differential greater than transfer cost is statistically significant at the 5% level. This is
inconsistent with spatial market efficiency. On the other hand, the probability of spatial
price differential less than transfer cost is greater than 80% for 2 of 7 wheat market pairs,
where high frequency of wheat trade flow was also observed for these market pairs. This
is also consistent with spatial market inefficiency, as grain traders would have lost money
if they actually traded during this period. The structural change is significant only for
Addis Ababa and Mekele market pair, where the nature of spatial inefficiency changed
from high probability of making excessive profit to high probability of making losses.
Thus, following the policy changes wheat markets are still spatially inefficient.
4.3 SUMMARY
Prior to the policy changes, both maize and wheat markets appear to be spatially
inefficient most of the time. The likelihood ratio test shows that there is statistically
significant joint structural change in trade regime probabilities in 3 of 7 maize market
pairs and in 1 of 7 wheat market pairs as a result of the policy changes. However, the
policy changes did not bring any significant improvement on the spatial efficiency of
maize and wheat markets except in the case of Addis Ababa and Mekele where the
spatial efficiency of the maize market improved after the policy changes, and in the case
of Addis Ababa and Dire Dawa where the spatial market efficiency deteriorated for the
maize market following the policy changes. Thus, maize and wheat markets are also
spatially inefficient for most of the time after the policy changes.

42
However, it is observed that the nature of spatial inefficiency is different for
maize and wheat markets. In the case of maize, spatial inefficiency is mostly due to the
fact that there is high frequency of grain flow while there is high probability of spatial
price differential less than grain transfer cost. In this case, if the grain traders are actually
trading they are making losses. In the case of wheat the spatial market inefficiency is
mostly due to high probability of spatial price differential greater than transfer cost. This
is consistent with spatial market inefficiency whether or not there is trade, but indicates
too little trade is occurring rather than too much.
The fact that the nature of spatial market inefficiency observed for maize and
wheat is different implies that the two commodities probably require a different policy
response in order to improve spatial market efficiency. One of the possible reasons for
the observed differences in the nature of spatial inefficiency between maize and wheat
might be due to the difference in their market structures. The geographic locations of
surplus maize and surplus wheat producing regions are different. Maize is produced
mainly in the western regions of Ethiopia while wheat is grown in central regions of the
country. The marketing infrastructure, particularly the road network, is relatively more
developed in the central regions. Among other things, this might have attracted
investment in storage and other marketing facilities in the wheat areas, which encouraged
the development of relatively larger wholesale grain traders, which can influence wheat
prices. The analysis of the structure and conduct of wholesale grain trade in Ethiopia by
Dessalegn et al. (1998) also indicates that the wheat markets are more concentrated. On
the other hand, the marketing infrastructure in the western region is less developed and
the grain traders are expected to be smaller sized and maybe numerous compared to the
central regions.
Finally, as with empirical studies of spatial market efficiency, it is important to
keep in mind that data and estimation methods have inherent weaknesses. For example,
the results are sensitive to the accuracy of transfer cost estimated from the survey and and
the distributional assumptions made. Therefore it is always important to interpret the

43
empirical results with caution and think critically about the implications of the results for
the design and implementation of public policy.
Table 4.1 Minimum Observed Months of Trade Flows for Selected Maize and Wheat Market Pairs
Note: *The maximum possible number of monthly observations for the period before and after the policy change is 26 and 35, respectively and figures in parenthesis are percentages of months with trade flows.
1996:08 to 1999:09
1999:10 to 2002:08
1996:08 to 2002:08
Market pairs Maize Wheat Maize Wheat Maize Wheat Addis & Bale Robe -- 23(89) -- 34(97) -- 57(93) Addis & Dessie 22(85)* 26(100) 35(100) 31(89) 57(93) 57(93) Addis & Dire Dawa 15(58) 26(100) 13(37) 35(100) 28(46) 61(100) Addis & Hosanna -- 26(100) -- 35(100) -- 61(100) Addis & Jimma 26(100) -- 35(100) -- 61(100) -- Addis & Mekele 18(69) 24(92) 4(11) 23(66) 22(36) 47(77) Addis & Wollega 25(96) -- 35(100) -- 60(98) -- Dire Dawa & Nazareth 4(15) 26(100) 0(0) 35(100) 4(7) 61(100) Dire Dawa & Shashamane 23(89) 10(39) 35(100) 34(97) 58(95) 44(72)
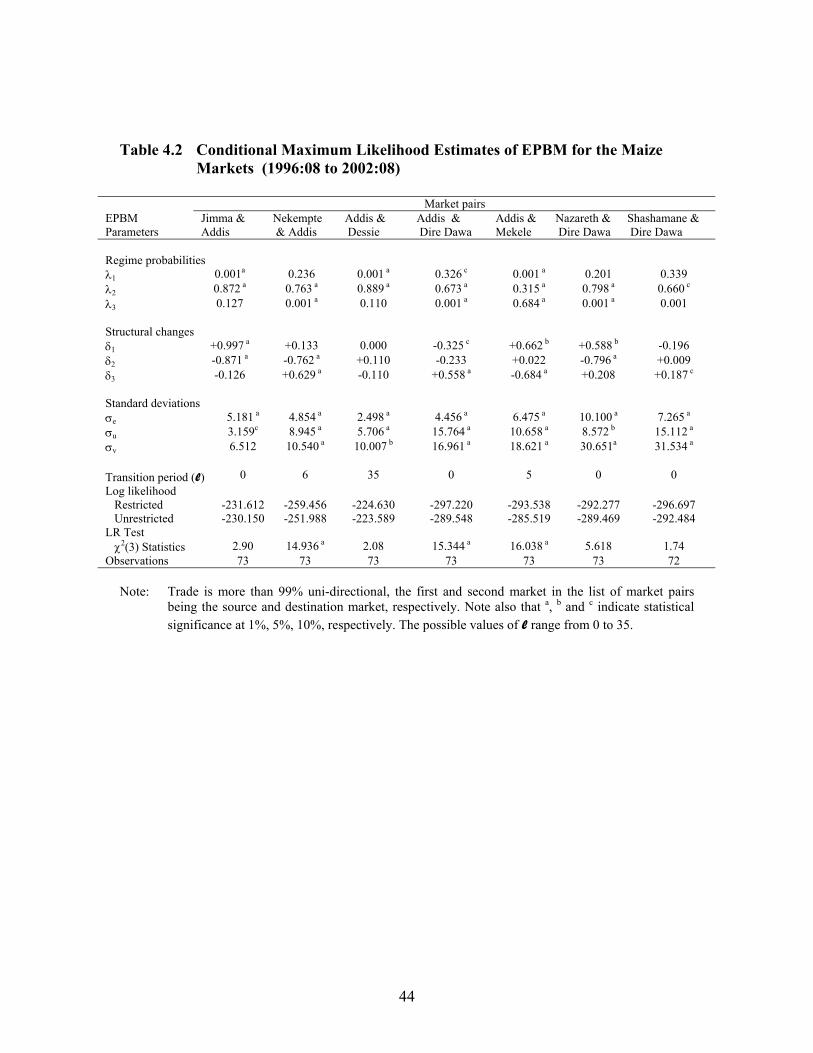
44
Table 4.2 Conditional Maximum Likelihood Estimates of EPBM for the Maize Markets (1996:08 to 2002:08)
Note: Trade is more than 99% uni-directional, the first and second market in the list of market pairs being the source and destination market, respectively. Note also that a, b and c indicate statistical significance at 1%, 5%, 10%, respectively. The possible values of l range from 0 to 35.
Market pairs EPBM Parameters
Jimma & Addis
Nekempte & Addis
Addis & Dessie
Addis & Dire Dawa
Addis & Mekele
Nazareth & Dire Dawa
Shashamane & Dire Dawa
Regime probabilities λ1 0.001a 0.236 0.001 a 0.326 c 0.001 a 0.201 0.339 λ2 0.872 a 0.763 a 0.889 a 0.673 a 0.315 a 0.798 a 0.660 c λ3 0.127 0.001 a 0.110 0.001 a 0.684 a 0.001 a 0.001 Structural changes δ1 +0.997 a +0.133 0.000 -0.325 c +0.662 b +0.588 b -0.196 δ2 -0.871 a -0.762 a +0.110 -0.233 +0.022 -0.796 a +0.009 δ3 -0.126 +0.629 a -0.110 +0.558 a -0.684 a +0.208 +0.187 c Standard deviations σe 5.181 a 4.854 a 2.498 a 4.456 a 6.475 a 10.100 a 7.265 a σu 3.159c 8.945 a 5.706 a 15.764 a 10.658 a 8.572 b 15.112 a σv 6.512 10.540 a 10.007 b 16.961 a 18.621 a 30.651a 31.534 a Transition period (l) 0 6 35 0 5 0 0 Log likelihood Restricted -231.612 -259.456 -224.630 -297.220 -293.538 -292.277 -296.697 Unrestricted -230.150 -251.988 -223.589 -289.548 -285.519 -289.469 -292.484 LR Test χ2(3) Statistics 2.90 14.936 a 2.08 15.344 a 16.038 a 5.618 1.74 Observations 73 73 73 73 73 73 72

45
Table 4.3 Conditional Maximum Likelihood Estimates of EPBM for the Wheat Markets (1996:08 to 2002:08)
Note: Trade is more than 99% uni-directional, the first and second market in the list of market pairs being the source and destination market, respectively. Note also that a, b and c indicate statistical significance at 1%, 5%, 10%, respectively. The possible values of l range from 0 to 35.
Market pairs EPBM Parameters
Bale & Addis
Hosanna & Addis
Addis & Dessie
Addis & Dire Dawa
Addis & Mekele
Nazareth & Dire Dawa
Shashamane & Dire Dawa
Regime probabilities λ1 0.001 a 0.001 a 0.001 a 0.001 a 0.001 a 0.001 a 0.001 a λ2 0.001 a 0.001 a 0.998 a 0.001 a 0.001 a 0.811 a 0.001 a λ3 0.998 a 0.998 a 0.001 a 0.998 a 0.998 a 0.188 0.998 a Structural changes δ1 0.000 0.000 0.000 0.000 0.000 +0.998 a 0.000 δ2 0.000 +0.109 0.000 0.000 +0.711a -0.811 a 0.000 δ3 0.000 -0.109 0.000 0.000 -0.711 a -0.187 0.000 Standard deviations σe 6.234 a 2.583b 9.886 a 16.465 a 11.212 a 15.017 a 17.583 a σu 0.001 a 2.275 0.452 0.001a 12.620 a 11.917 b 0.001 a σv 19.843 a 19.214 a 23.491 2.231 27.393 a 23.096 b 10.321 Transition period (l) 0 0 3 2 0 4 0 Log likelihood Restricted -289.931 -279.268 -71.106 -308.244 -33.041 -315.703 -312.793 Unrestricted -289.931 -278.385 -71.106 -308.244 -20.799 -313.480 -312.753 LR Test χ2 (3) Statistics 0.000 1.766 0.000 0.000 24.484 a 4.446 7.818 Observations 73 73 73 73 73 73 72

46
Figure 4.1 Magnitude of Losses and Gains from Inefficient Trade for Maize
a) Addis Ababa and Dessie
-20-15-10-505101520
1996
1997
1998
1999
2000
2001
2002
Year
Perc
enta
ge lo
ss o
r gai
n
b) Addis Ababa and Dire Dawa
-40-30-20-1001020304050
1996
1997
1998
1999
2000
2001
2002
YearPe
rcen
tage
loss
or g
ain
c) Addis Ababa and Jimma
-20-15-10-505101520
1996
1997
1998
1999
2000
2001
2002
Year
Perc
enta
ge lo
ss o
r gai
n
d) Addis Ababa and Mekele
-30-20-1001020304050
1996
1997
1998
1999
2000
2001
2002
Year
Perc
enta
ge lo
ss o
r gai
n

47
Figure 4.1 (Continued)
e) Addis Ababa and Nekemepte
-30
-20
-10
0
10
20
30
1996
1997
1998
1999
2000
2001
2002
Year
Perc
enta
ge lo
ss o
r gai
n
f) Dire Dawa and Shashamane
-40-30-20-1001020304050
1996
1997
1998
1999
2000
2001
2002
YearPe
rcen
tage
loss
or g
ain
g) Nazareth and Dire Dawa
-30
-20
-10
0
10
20
30
40
50
1996
1997
1998
1999
2000
2001
2002
Year
Perc
enta
ge lo
ss o
r gai
n
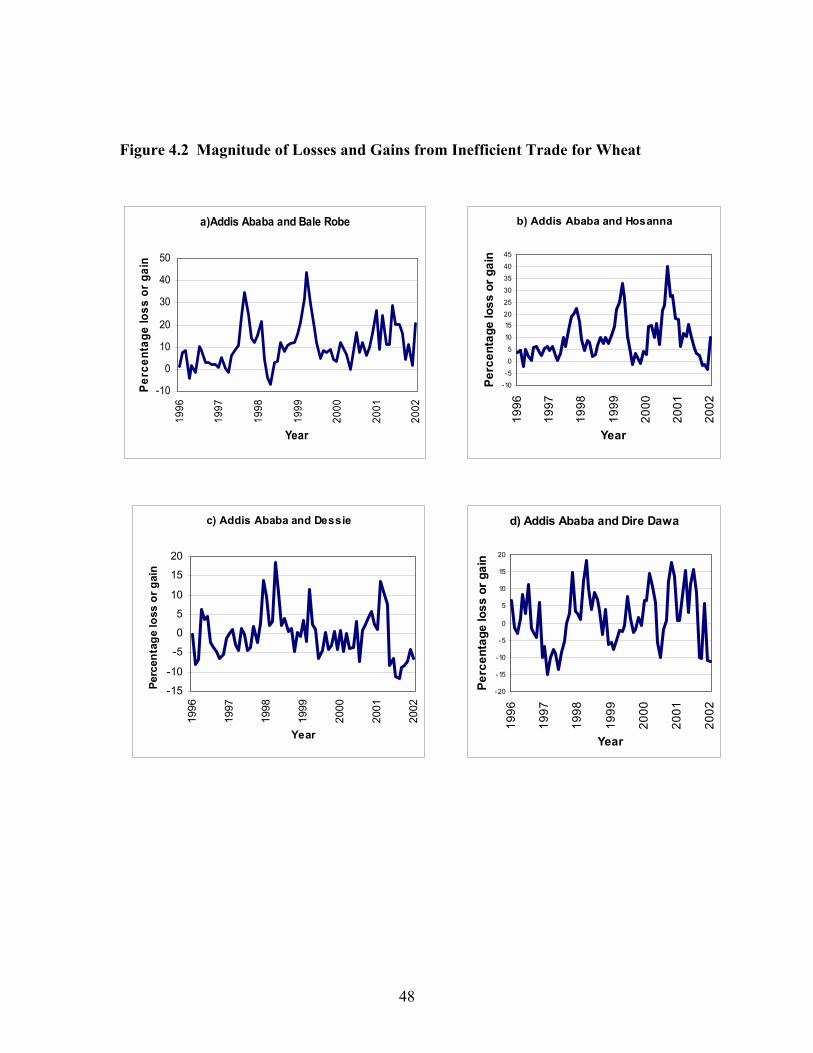
48
Figure 4.2 Magnitude of Losses and Gains from Inefficient Trade for Wheat
a)Addis Ababa and Bale Robe
-10
0
10
20
30
40
50
1996
1997
1998
1999
2000
2001
2002
Year
Perc
enta
ge lo
ss o
r gai
n
b) Addis Ababa and Hosanna
-10
-5
0
5
10
1520
25
30
35
40
45
1996
1997
1998
1999
2000
2001
2002
Year
Perc
enta
ge lo
ss o
r gai
n
c) Addis Ababa and Dessie
-15
-10
-5
0
5
10
15
20
1996
1997
1998
1999
2000
2001
2002
Year
Perc
enta
ge lo
ss o
r gai
n
d) Addis Ababa and Dire Dawa
-20
-15
-10
-5
0
5
10
15
20
1996
1997
1998
1999
2000
2001
2002
Year
Perc
enta
ge lo
ss o
r gai
n

49
Figure 4.2 (Continued)
e) Addis Ababa and Mekele
-30-20-1001020304050
1996
1997
1998
1999
2000
2001
2002
Year
Perc
enta
ge lo
ss o
r gai
n
g) Nazareth and Dire Dawa
-20-15-10-50510152025
1996
1997
1998
1999
2000
2001
2002
YearPe
rcen
tage
loss
or g
ain
g) Shashamane and Dire Dawa
-20
-10
0
10
20
30
40
1996
1997
1998
1999
2000
2001
2002
Year
Perc
enta
ge lo
ss o
r gai
n

50
5. CONCLUSIONS AND POLICY IMPLICATIONS
In recent years, the Ethiopian government has embarked on various market reform
measures aimed at improving grain market performance. Research is needed to improve
understanding of the operation of grain markets, and the effects of policy changes on
grain market development. The conventional methods which have been used to study
spatial market efficiency and/or spatial market integration depend on an assessment of the
co-movement of price series, or the long-run relationship between prices. These methods
assume stationary spatial marketing margins, stationary transfer costs, and/or that markets
are linked by a constant trade pattern (uni-directional and continuous). However, these
assumptions are often violated and so the resulting tests of market integration may be
misleading.
The standard parity bounds model (PBM) represents one of the recent
developments, which attempts to overcome some of the weaknesses of the conventional
methods. The PBM allows for transfer costs and explicitly incorporates spatial arbitrage
conditions in the test of spatial market efficiency. However, in the context of on-going
market reform and policy changes in developing countries, the standard PBM needs
further improvements in order to properly assess the effect of policy changes on spatial
market efficiency. This is because the standard PBM has been used mostly to analyze
spatial market efficiency within a given, constant policy regime. In cases where it has
been used to analyze the effects of policy changes on spatial market efficiency, the effect
of policy changes is assumed to be instantaneous. However, the PBM is mis-specified
and the results and policy implications might be misleading if the actual effect of policy
changes on spatial market efficiency is gradual and moves through a transition period, as
might be expected in many cases.
The EPBM is a stochastic gradual switching regression model with three trade
regimes. The EPBM improves the standard parity bounds model in two ways. First, the
EPBM allows a better understanding of the nature of transition from old to new policy

51
regimes, including whether it is gradual or instant. If it is gradual, the model also allows
estimation of the length of time required for the full effects of policy changes to be
realized. Second, it allows formal statistical tests to be undertaken for structural change in
the probabilities of different trade regimes due to policy changes.
The EPBM is estimated using maximum likelihood and utilizes data on observed
wholesale grain prices for several regional markets in Ethiopia and grain transfer costs.
One of the problems with implementing the PBM empirically is that time series data on
transfer costs are rarely available, particularly in developing countries like Ethiopia. As a
result, most empirical PBM studies have assumed transfer costs are constant over time for
a given policy regime. However, this assumption is very restrictive, particularly when the
PBM is used to analyze the effects of policy changes. This is because if transfer costs are
assumed to be constant when they actually fluctuate considerably over time then the
PBM may misinterpret spatial price deviations as evidence of inefficiency when they are
actually just a rational response to changes in transfer costs. Thus, there is a need to go
beyond the constant transfer cost assumption and find better ways of using data that are
available to construct more appropriate inferences about historical movements in transfer
costs. This paper also discusses a technique for parametric estimation of time variant
grain transfer costs based on an initial computation of grain transfer costs using cross-
sectional surveys of grain traders in Ethiopia and time series truck shipment freight rate
data.
The EPBM is applied to examine the effects of grain price marketing policy
changes implemented in October 1999 on spatial efficiency of maize and wheat markets
in Ethiopia. The results indicate that there is considerable spatial inefficiency in maize
and wheat markets in Ethiopia both before and after the policy changes. In most of the
cases, the effect of policy changes on spatial grain market efficiency is not statistically
significant. However, in cases where significant structural change did occur some
markets adjusted to the policy changes gradually while others adjusted instantaneously.
Thus, an instantaneous response to marketing policy changes cannot be taken for granted
and needs to be tested empirically.

52
The spatial inefficiency of maize and wheat markets indicates that resources are
being misallocated in transferring maize and wheat from surplus producing regions to
grain deficit regions of Ethiopia. There are several possible explanations of these results.
First, maize and wheat markets are characterized by periodic localized gluts and
shortages which can undermine the welfare of producers, grain traders and consumers by
increasing price instability. Second, the marketing system lacks the capacity to provide
timely and accurate price signals needed for efficient allocation of resources. Third, the
marketing system does not provide adequate incentives for producers to adopt new
technologies. Fourth, the high probability of making losses also decreases private sector
participation in grain marketing.
Finally, as with all empirical studies of spatial market efficiency, it is important to
keep in mind that data and estimation methods have inherent weaknesses. For example,
the results are sensitive to the accuracy of transfer costs estimated from the cross-
sectional survey of grain traders and time series truck shipment freight rate data. PBM
results are also well known to be highly sensitive to the distributional assumptions made
for the estimation method. Therefore it is always important to interpret the empirical
results with caution and think critically about the implications of the results for the design
and implementation of public policy. The other limitation of this study is that it only
assesses the degree of spatial efficiency of grain markets and does not address the
questions as to why the markets are not spatially efficient. Therefore, in order to provide
relevant policy recommendations, it is important to identify the exact causes of spatial
inefficiencies using available research results and through conducting new research.

53
REFERENCES
Barrett, C.B., J.T. Li, and D. Bailey. �Factor and Product Market Tradability and
Equilibrium in Pacific Rim Pork Industries.� Journal of Agricultural Resource Economics 25 (July 2000): 68-87.
Barrett, C.B., and J.R. Li. �Distinguishing Between Equilibrium and Integration in
Spatial Price Analysis.� American Journal of Agricultural Economics 84 (May 2002): 292-307.
Baulch, R. �Transfer Costs, Spatial Arbitrage, and Testing for Food Market Integration.�
American Journal of Agricultural Economics 79 (May 1997): 477-487. Bekele, Girma. �The Role of the Ethiopian Grain Trade Enterprise in Price Policy.�
Agriculture Technology Diffusion and Price Policy: Proceedings of a Policy Forum in Addis Ababa. 2020 Vision Network for East Africa Report 1. Tenkir Bonger, Eleni Gabre-Madhin and Suresh Babu, eds., pp.83-91. Washington, D.C. Ethiopian Development Research Institute and International Food Policy Research Institute, 2002.
Dadi, Legesse, A. Negassa, and S. Franzel. �Marketing Maize and Tef in Western
Ethiopia: Implications for Policy Following Market Liberalization.� Food Policy 17(1992): 201-213.
Dessalegn, G., Jayne T.S., and Shaffer J.D. �Market Structure, Conduct, and
Performance: Constraints of performance of Ethiopian Grain Markets.� Working Paper 9, Grain Market Research Project, Ministry of Economic Development and Cooperation, 1998.
Enke, S. �Equilibrium among Spatially Separated Markets: Solution by Electric
Analogue.� Econometrica 19, 1(January 1951): 40-47. Fackler, P. �Spatial Price Analysis: A Methodological Review.� Mimeo., North Carolina
State University, 1996. Fackler, P.L., and B.K. Goodwin. �Spatial Price Analysis.� Handbook of Agricultural
Econopmics. pp: 971-1024. B.L. Gardner and G.C. Rausser, eds. Amsterdam: Elsevier Science, 2001.
Fafchamps, M., and S. Gavian. �The Spatial Integration of Livestock Markets in Niger.�
Journal of African Economies 5 (October 1996): 366-405. Franzel, Steven, Forrest Colburn and Getahun Degu. �Grain marketing regulations:
Impact on peasant production in Ethiopia.� Food Policy 14 (1989): 347-358.

54
Goodwin, Barry K. and Gary W. Brester. �Structural Change in Factor Demand Relationships in the U.S. Food and Kindred Products Industry.� American Journal of Agricultural Economics, 77 (1995): 69-79.
Goodwin, Barry K. and Ted C. Schroeder. �Cointegrtation tests and spatial price
linkages in regional cattle markets.� American Journal of Agricultural Economics, 73 (1991): 452-64.
Hall, H. B., and Clint Cummins. �Time Series Processor Version 4.5 User�s Guide.� TSP
International, Palo Alto, California. June 1999. Jayne, T.S., Chapoto, A., Nyoro, J., Mwanaumo, A., and Govereh, J. �False Promise or
False Premise? The Experience of Food and Input Market Reform in Eastern and Southern Africa.� World Development 30, 11 (2002): 1967-1985.
Kherallah, M., Delgado, C., Gabre-Madhin, E., Minot, N., and Johnson, M. Reforming
Agricultural Markets in Africa. Baltimore and London: The Johns Hopkins University Press for the International Food Policy Research Institute (IFPRI), 2002.
Lirenso, Alemayehu. �Grain Marketing and Pricing in Ethiopia.� Research Report No.
28, Institute of Development Research, Addis Ababa University, 1987. McNew, K. �Spatial Market Integration: Definition, Theory, and Evidence.� Agricultural
Resource Economics Review 25 (April 1996): 1-11. McNew, K., and P.L. Fackler. �Testing Market Equilibrium: Is Cointegration
Informative?� Journal of Agricultural Resource Economics 22 (December 1997): 191-207.
Moschini, G., and K. D. Meilke. �Modeling Pattern of Structural Change in U.S. Meat
Demand.� American Journal of Agricultural Economics, 71 (1989): 255-261. Ohtani, Kazuhiro. and Sei-ichi Katayama. �A gradual Switching Regression Model with
Autocorrelated Errors.� Economic letters, 21 (1986): 169-172. Osborne, Theresa K. �The Efficiency of Grain Markets and Price Variability in Ethiopia
Pre-and Post-Liberalization.� Ph.D. Dissertation, Princeton University, 1997. Park, A., Jin, H., Rozelle, S. and Haung, J. �Market Emergence and Transition:
Arbitrage, Transaction Costs, and Autarky in China�s Grain Markets.� American Journal of Agricultural Economics 84 (February 2002): 67-82.
Penzhorn, Niels and Channing Arndt. �Maize Markets in Mozambique: Testing for
Market Integration.� Agrekon 41, 2 (June 2002): 146-159.

55
Samuelson, P. �Spatial Price Equilibrium and Linear Programming.� The American Economic Review 42, 3(June 1964): 283-303.
Sexton, R., C. Kling, and H. Carman. �Market Integration, Efficiency of Arbitrage and
Imperfect Competition: Methodology and Application to U.S. Celery.� American Journal of Agricultural Economics 73 (May 1991): 568-80.
Spiller, P., and Wood. R. �The Estimation of Transaction Costs in Arbitrage Models.�
Journal of Econometrics 39 (1988): 309-326. Takayama, T. and G.G. Judge. �Equilibrium among Spatially Separated Markets: A
Reformulation.� Eonometrica 32, 4(October 1964): 510-524. Tomek, W.G. and Robinson, K.L. Agricultural Product Prices. Third Edition. Cornell
University Press. Ithaca and London. 1990.

56
MTID DISCUSSION PAPERS 1. Foodgrain Market Integration Under Market Reforms in Egypt, May 1994 by
Francesco Goletti, Ousmane Badiane, and Jayashree Sil.
2. Agricultural Market Reforms in Egypt: Initial Adjustments in Local Output Markets, November 1994 by Ousmane Badiane.
3. Agricultural Market Reforms in Egypt: Initial Adjustments in Local Input
Markets, November 1994 by Francesco Goletti. 4. Agricultural Input Market Reforms: A Review of Selected Literature, June 1995
by Francesco Goletti and Anna Alfano. 5. The Development of Maize Seed Markets in Sub-Saharan Africa, September 1995
by Joseph Rusike. 6. Methods for Agricultural Input Market Reform Research: A Tool Kit of
Techniques, December 1995 by Francesco Goletti and Kumaresan Govindan. 7. Agricultural Transformation: The Key to Broad Based Growth and Poverty
Alleviation in Sub-Saharan Africa, December 1995 by Christopher Delgado. 8. The Impact of the CFA Devaluation on Cereal Markets in Selected CMA/WCA
Member Countries, February 1996 by Ousmane Badiane. 9. Smallholder Dairying Under Transactions Costs in East Africa, December 1996
by Steven Staal, Christopher Delgado, and Charles Nicholson. 10. Reforming and Promoting Local Agricultural Markets: A Research Approach,
February 1997 by Ousmane Badiane and Ernst-August Nuppenau. 11. Market Integration and the Long Run Adjustment of Local Markets to Changes in
Trade and Exchange Rate Regimes: Options For Market Reform and Promotion Policies, February 1997 by Ousmane Badiane.
12. The Response of Local Maize Prices to the 1983 Currency Devaluation in Ghana,
February 1997 by Ousmane Badiane and Gerald E. Shively.

57
MTID DISCUSSION PAPERS
13. The Sequencing of Agricultural Market Reforms in Malawi, February 1997 by Mylène
Kherallah and Kumaresan Govindan. 14. Rice Markets, Agricultural Growth, and Policy Options in Vietnam, April 1997 by
Francesco Goletti and Nicholas Minot. 15. Marketing Constraints on Rice Exports from Vietnam, June 1997 by Francesco
Goletti, Nicholas Minot, and Philippe Berry. 16. A Sluggish Demand Could be as Potent as Technological Progress in Creating
Surplus in Staple Production: The Case of Bangladesh, June 1997 by Raisuddin Ahmed.
17. Liberalisation et Competitivite de la Filiere Arachidiere au Senegal, October
1997 by Ousmane Badiane. 18. Changing Fish Trade and Demand Patterns in Developing Countries and Their
Significance for Policy Research, October 1997 by Christopher Delgado and Claude Courbois.
19. The Impact of Livestock and Fisheries on Food Availability and Demand in 2020,
October 1997 by Christopher Delgado, Pierre Crosson, and Claude Courbois. 20. Rural Economy and Farm Income Diversification in Developing Countries,
October 1997 by Christopher Delgado and Ammar Siamwalla. 21. Global Food Demand and the Contribution of Livestock as We Enter the New
Millenium, February 1998 by Christopher L. Delgado, Claude B. Courbois, and Mark W. Rosegrant.
22. Marketing Policy Reform and Competitiveness: Why Integration and Arbitrage
Costs Matter, March 1998 by Ousmane Badiane. 23. Returns to Social Capital among Traders, July 1998 by Marcel Fafchamps and
Bart Minten. 24. Relationships and Traders in Madagascar, July 1998 by M. Fafchamps and B.
Minten.

58
MTID DISCUSSION PAPERS
25. Generating Disaggregated Poverty Maps: An application to Viet Nam, October
1998 by Nicholas Minot. 26. Infrastructure, Market Access, and Agricultural Prices: Evidence from
Madagascar, March 1999 by Bart Minten. 27. Property Rights in a Flea Market Economy, March 1999 by Marcel Fafchamps
and Bart Minten. 28. The Growing Place of Livestock Products in World Food in the Twenty-First
Century, March 1999 by Christopher L. Delgado, Mark W. Rosegrant, Henning Steinfeld, Simeon Ehui, and Claude Courbois.
29. The Impact of Postharvest Research, April 1999 by Francesco Goletti and
Christiane Wolff. 30. Agricultural Diversification and Rural Industrialization as a Strategy for Rural
Income Growth and Poverty Reduction in Indochina and Myanmar, June 1999 by Francesco Goletti.
31. Transaction Costs and Market Institutions: Grain Brokers in Ethiopia, October
1999 by Eleni Z. Gabre-Madhin. 32. Adjustment of Wheat Production to Market reform in Egypt, October 1999 by
Mylene Kherallah, Nicholas Minot and Peter Gruhn. 33. Rural Growth Linkages in the Eastern Cape Province of South Africa, October
1999 by Simphiwe Ngqangweni. 34. Accelerating Africa�s Structural Transformation: Lessons from East Asia,
October 1999, by Eleni Z. Gabre-Madhin and Bruce F. Johnston. 35. Agroindustrialization Through Institutional Innovation: Transactions Costs,
Cooperatives and Milk-Market Development in the Ethiopian Highlands, November 1999 by Garth Holloway, Charles Nicholson, Christopher Delgado, Steven Staal and Simeon Ehui.
36. Effect of Transaction Costs on Supply Response and Marketed Surplus:
Simulations Using Non-Separable Household Models, October 1999 by Nicholas Minot.

59
MTID DISCUSSION PAPERS
37. An Empirical Investigation of Short and Long-run Agricultural Wage Formation
in Ghana, November 1999 by Awudu Abdulai and Christopher Delgado. 38. Economy-Wide Impacts of Technological Change in the Agro-food Production
and Processing Sectors in Sub-Saharan Africa, November 1999 by Simeon Ehui and Christopher Delgado.
39. Of Markets and Middlemen: The Role of Brokers in Ethiopia, November 1999 by
Eleni Z. Gabre-Madhin. 40. Fertilizer Market Reform and the Determinants of Fertilizer Use in Benin and
Malawi, October 2000 by Nicholas Minot, Mylene Kherallah, Philippe Berry. 41. The New Institutional Economics: Applications for Agricultural Policy Research
in Developing Countries, June 2001 by Mylene Kherallah and Johann Kirsten. 42. The Spatial Distribution of Poverty in Vietnam and the Potential for Targeting,
March 2002 by Nicholas Minot and Bob Baulch. 43. Bumper Crops, Producer Incentives and Persistent Poverty: Implications for
Food Aid Programs in Bangladesh, March 2002 by Paul Dorosh, Quazi Shahabuddin, M. Abdul Aziz and Naser Farid.
44. Dynamics of Agricultural Wage and Rice Price in Bangladesh: A Re-examination,
March 2002 by Shahidur Rashid. 45. Micro Lending for Small Farmers in Bangladesh: Does it Affect Farm
Households� Land Allocation Decision?, September 2002 by Shahidur Rashid, Manohar Sharma, and Manfred Zeller.
46. Rice Price Stabilization in Bangladesh: An Analysis of Policy Options, October
2002 by Paul Dorosh and Quazi Shahabuddin 47. Comparative Advantage in Bangladesh Crop Production, October 2002 by Quazi
Shahabuddin and Paul Dorosh. 48. Impact of Global Cotton Markets on Rural Poverty in Benin, November 2002 by
Nicholas Minot and Lisa Daniels.

60
MTID DISCUSSION PAPERS
49. Poverty Mapping with Aggregate Census Data: What is the Loss in
Precision? November 2002 by Nicholas Minot and Bob Baulch.
50. Globalization and the Smallholders: A Review of Issues, Approaches, and Implications, November 2002 by Sudha Narayanan and Ashok Gulati.
51. Rice Trade Liberalization and Poverty, November 2002 by Ashok Gulati and
Sudha Narayanan.
52. Fish as Food: Projections to 2020 Under Different Scenarios, December 2002 by Christopher Delgado, Mark Rosegrant, Nikolas Wada, Siet Meijer, and Mahfuzuddin Ahmed.
53. Successes in African Agriculture: Results of an Expert Survey. January
2003 by Eleni Z. Gabre-Madhin and Steven Haggblade. 54. Demand Projections for Poultry Products and Poultry Feeds in Bangladesh,
January 2003 by Nabiul Islam. 55. Implications of Quality Deterioration for Public Foodgrain Stock Management
and Consumers in Bangladesh, January 2003 by Paul A. Dorosh and Naser Farid.
56. Transactions Costs and Agricultural Productivity: Implications fo Isolation for Rural Poverty in Madagascar, February 2003 by David Stifel, Bart Minten, and Paul Dorosh.
57. Agriculture Diversification in South Asia: Patterns, Determinants, and Policy
Implications, February 2003 by P.K. Joshi, Ashok Gulati, Pratap S. Birthal, and Laxmi Tewari.
58. Innovations in Irrigation Financing: Tapping Domestic Financial Markets in
India, February 2003 by K.V. Raju, Ashok Gulati and Ruth Meinzen-Dick.

61
MTID DISCUSSION PAPERS
59. Livestock Intensification and Smallholders: A Rapid Reconnaisance of the
Philippines Hog and Poultry Sectors, April 2003 by Agnes Rola, Walfredo Rola, Marites Tiongco, and Christopher Delgado.
60. Increasing Returns and Market Efficiency in Agriculture Trade, April 2003 by
Marcel Fafchamps, Eleni Gabre-Madhin and Bart Minten. 61. Trade Liberalization, Market Reforms and Competitiveness of Indian Dairy
Sector, April 2003 by Vijay Paul Sharma and Ashok Gulati. 62. Technological Change and Price Effects in Agriculture: Conceptual and
Comparative Perspective, April 2003 by Eleni Gabre-Madhin, Christopher B. Barrett, and Paul Dorosh.
63. Analyzing Grain Market Efficiency in Developing Countries: Review of Existing
Methods and Extensions to the Parity Bounds Model, September 2003 by Asfaw Negassa, Robert Myers and Eleni Gabre-Madhin.
64. Effects of Tariffs and Sanitary Barriers on High- and Low-Value Poultry Trade,
February 2004 by Everett B. Peterson and David Orden.
65. Regionalism: Old and New, Theory and Practice, February 2004 by Mary E. Burfisher, Sherman Robinson, and Karen Thierfelder.