impact of controlled changes in grain size and pore space
TRANSCRIPT

HESSD7, 6057–6080, 2010
Impact of controlledchanges in grain size
and pore space
K. Koch et al.
Title Page
Abstract Introduction
Conclusions References
Tables Figures
J I
J I
Back Close
Full Screen / Esc
Printer-friendly Version
Interactive Discussion
Discussion
Paper
|D
iscussionP
aper|
Discussion
Paper
|D
iscussionP
aper|
Hydrol. Earth Syst. Sci. Discuss., 7, 6057–6080, 2010www.hydrol-earth-syst-sci-discuss.net/7/6057/2010/doi:10.5194/hessd-7-6057-2010© Author(s) 2010. CC Attribution 3.0 License.
Hydrology andEarth System
SciencesDiscussions
This discussion paper is/has been under review for the journal Hydrology and EarthSystem Sciences (HESS). Please refer to the corresponding final paper in HESSif available.
Impact of controlled changes in grain sizeand pore space characteristics on thehydraulic conductivity and spectralinduced polarization response of“proxies” of saturated alluvial sedimentsK. Koch1, A. Kemna2, J. Irving1, 3, and K. Holliger1
1Institute of Geophysics, University of Lausanne, 1015 Lausanne, Switzerland2Department of Geodynamics and Geophysics, University of Bonn, 53115 Bonn, Germany3School of Engineering, University of Guelph, Guelph, Ontario, N1G 2W1, Canada
Received: 12 August 2010 – Accepted: 19 August 2010 – Published: 24 August 2010
Correspondence to: K. Koch ([email protected])
Published by Copernicus Publications on behalf of the European Geosciences Union.
6057
HESSD7, 6057–6080, 2010
Impact of controlledchanges in grain size
and pore space
K. Koch et al.
Title Page
Abstract Introduction
Conclusions References
Tables Figures
J I
J I
Back Close
Full Screen / Esc
Printer-friendly Version
Interactive Discussion
Discussion
Paper
|D
iscussionP
aper|
Discussion
Paper
|D
iscussionP
aper|
Abstract
Understanding the influence of pore space characteristics on the hydraulic conduc-tivity and spectral induced polarization (SIP) response is critical for establishing rela-tionships between the electrical and hydrological properties of surficial unconsolidatedsedimentary deposits, which host the bulk of the world’s readily accessible ground-5
water resources. Here, we present the results of laboratory SIP measurements onindustrial-grade, saturated quartz samples with granulometric characteristics rangingfrom fine sand to fine gravel, which can be regarded as proxies for widespread alluvialdeposits. We altered the pore space characteristics by changing (i) the grain size spec-tra, (ii) the degree of compaction, and (iii) the level of sorting. We then examined how10
these changes affect the SIP response, the hydraulic conductivity, and the specific sur-face area of the considered samples. In general, the results indicate a clear connectionbetween the SIP response and the granulometric as well as pore space characteristics.In particular, we observe a systematic correlation between the hydraulic conductivityand the relaxation time of the Cole-Cole model describing the observed SIP effect for15
the entire range of considered grain sizes. The results do, however, also indicate thatthe detailed nature of these relations depends strongly on variations in the pore spacecharacteristics, such as, for example, the degree of compaction. The results of thisstudy underline the complexity of the origin of the SIP signal as well as the difficulty torelate it to a single structural factor of a studied sample, and hence raise some funda-20
mental questions with regard to the practical use of SIP measurements as site- and/orsample-independent predictors of the hydraulic conductivity.
1 Introduction
Knowledge of the distribution of the hydraulic conductivity within an aquifer is a key pre-requisite for reliable predictions of groundwater flow and contaminant transport. This25
information is in turn critical for the effective protection, remediation, and sustainable
6058

HESSD7, 6057–6080, 2010
Impact of controlledchanges in grain size
and pore space
K. Koch et al.
Title Page
Abstract Introduction
Conclusions References
Tables Figures
J I
J I
Back Close
Full Screen / Esc
Printer-friendly Version
Interactive Discussion
Discussion
Paper
|D
iscussionP
aper|
Discussion
Paper
|D
iscussionP
aper|
management of the increasingly scarce and fragile groundwater resources in denselypopulated and/or highly industrialized regions throughout the world. To this end, geo-physical constraints with regard to aquifer structure and the distribution of hydraulicparameters are considered to be particularly valuable. The primary reasons for thisare that geophysical methods are inexpensive and non-invasive in nature and that they5
have the potential to bridge an inherent gap which exists in terms of spatial resolutionand coverage between traditional hydrogeological methods such as core analyses andtracer or pumping tests (e.g., Rubin and Hubbard, 2005; Koch et al., 2009).
Although standard geophysical techniques cannot in general provide any direct in-formation on the hydraulic conductivity in the subsurface, there are a number of more10
specialized approaches that exhibit a more-or-less direct sensitivity to this importantparameter. Together with nuclear magnetic resonance techniques and the interpreta-tion of seismic observations in a poro-elastic context, induced polarization (IP) mea-surements in general and spectral induced polarization (SIP) measurements in partic-ular arguably represent the most promising approaches (e.g., Slater, 2007; Holliger,15
2008). Indeed, one of the major goals of advancing our knowledge about the electri-cal characteristics of porous media is the possibility of linking parameters derived fromthe corresponding IP and/or SIP responses to hydrologically relevant parameters (e.g.,Lesmes and Friedman, 2005).
The IP-type polarization of non-metallic minerals is generally referred to as inter-20
face or membrane polarization (Marshall and Madden, 1959; Vinegar and Waxman,1984) and takes place in the lower frequency range up to the Maxwell-Wagner effect(Maxwell, 1892; Wagner, 1914; Chen and Or, 2006). In the absence of metallic con-ductors, such as ore minerals or graphite, SIP phenomena are commonly associatedwith polarization effects related to a polarized electrical double layer (EDL). The EDL25
schematically describes the organization of ionic charges at the interface between solidand fluid and was first introduced by Helmholtz in the middle of the 19th century. Theinner layer is given by the typically negatively charged mineral surface attracting pos-itively charged ions contained in the pore fluid to form the supposedly firmly attached
6059
HESSD7, 6057–6080, 2010
Impact of controlledchanges in grain size
and pore space
K. Koch et al.
Title Page
Abstract Introduction
Conclusions References
Tables Figures
J I
J I
Back Close
Full Screen / Esc
Printer-friendly Version
Interactive Discussion
Discussion
Paper
|D
iscussionP
aper|
Discussion
Paper
|D
iscussionP
aper|
Stern layer (Stern, 1924). Beyond the Stern layer, positively charged ions continue tobe attracted by the negatively charged mineral surface, but at the same time are re-pelled by each other and the Stern layer. The resulting dynamic equilibrium is referredto as the diffuse layer and represents the transition zone towards the outer limit of theEDL, where ions are in equilibrium with the solution and distributed in a random man-5
ner. The EDL provides the conceptual background for the electrochemical processesconsidered to be responsible for much of the observed SIP response, as documented,for example, by the recent study of Leroy et al. (2008).
Much of today’s conceptual understanding of the origin of the SIP response is basedon the work by Schwarz (1962) and his interpretation of the SIP effect as a result of10
the redistribution of counter-ions surrounding spherical particles in suspension. Theonly geometric factor involved in the model is the size of the sphere. Translating thisgeometrically simple analytical model to texturally complex porous media is not evident.Titov et al. (2004) attempted to provide a visualization of the two basic conceptualviews on the origin of the SIP effect in porous media linking it either to the grain-size15
distribution or to the pore-size distribution. A number of studies have attempted to gainfurther insight into these matters by attributing the polarization to the EDL surroundingindividual grains (e.g., Lesmes and Morgan, 2001) and to excesses and deficiencies inion concentrations along pore throats (e.g., Titov et al., 2002). In virtually all of thesestudies, the relaxation time or relaxation frequency has been theoretically related to20
a certain length scale representing either the grain radius (Schwarz, 1962) or a porelength scale (Kormiltsev, 1963).
A good phenomological description of the observed SIP responses was found tobe provided by Cole-Cole-type models (e.g., Vanhala, 1997) and good correlationsfor different sets of materials, between hydraulic conductivity and the Cole-Cole time25
constant were found (e.g., Binley et al., 2005; Kemna et al., 2005; Zisser et al.,2010). Although a clear link between hydrological properties and IP/SIP parametershas been empirically documented by various studies (e.g., Borner et al., 1996; Slaterand Lesmes, 2002; Kemna et al., 2004; Binley et al., 2005; Hordt et al., 2007; Slater,
6060

HESSD7, 6057–6080, 2010
Impact of controlledchanges in grain size
and pore space
K. Koch et al.
Title Page
Abstract Introduction
Conclusions References
Tables Figures
J I
J I
Back Close
Full Screen / Esc
Printer-friendly Version
Interactive Discussion
Discussion
Paper
|D
iscussionP
aper|
Discussion
Paper
|D
iscussionP
aper|
2007), the detailed nature and origin of such linkages remain enigmatic. For exam-ple, the mineralogical and granulometric range of unconsolidated clastic sediments forwhich SIP effects can be reliably detected and related to the governing hydraulic prop-erties is as of yet largely unexplored. In particular, it is not clear to what extent SIPmethods are applicable to weakly polarizeable, clay-poor alluvial deposits, which char-5
acterize some of the world’s most important surficial aquifers. It is also not yet clearhow basic changes in the pore space and/or grain size characteristics affect the SIPresponse and its relation to the hydraulic conductivity.
In this paper, we address some of these questions through SIP measurements onsaturated industrial-grade granular quartz samples with effective grain sizes ranging10
from fine sand to fine gravel, which in many ways can be regarded as first-order proxiesfor surficial alluvial deposits. The pore space and grain size characteristics of theoriginal samples are modified through compaction and sieving, while the chemistryof the saturating pore fluid is kept constant for comparison of the impact of structuralchanges on the SIP response. In the following, we first describe the experimental15
setup used in this study, the granulometric properties of our samples, and the basicmethodology of the data analysis. We than proceed to explore the relation betweenthe corresponding SIP responses and the hydraulic properities.
2 Experimental procedure and data analysis
We have performed laboratory-based measurements on water-saturated industrial-20
grade granular quartz samples over a very broad range of average grain diametersfrom fine sand to fine gravel (Table 1, Fig. 1). For these measurements, the pore spacecharacteristics of the samples were modified by varying (i) the grain size, (ii) the degreeof compaction, and (iii) the degree of sorting. We then examined how these changesaffected the hydraulic conductivity, specific surface area, and the SIP response of the25
considered samples. Compaction was achieved through handheld multidirectional vi-bration. The shaking was continued until the sample volume stabilized at 90% of
6061
HESSD7, 6057–6080, 2010
Impact of controlledchanges in grain size
and pore space
K. Koch et al.
Title Page
Abstract Introduction
Conclusions References
Tables Figures
J I
J I
Back Close
Full Screen / Esc
Printer-friendly Version
Interactive Discussion
Discussion
Paper
|D
iscussionP
aper|
Discussion
Paper
|D
iscussionP
aper|
its original volume. Sieving the sands F36 and WQ1 provided extremely well sortedsamples of grain sizes: 0.09–0.125 mm, 0.125–0.18 mm, 0.18–0.25 mm, 0.25–0.5 mm,0.5–0.71 mm, and 0.71–1.0 mm.
Measurements of the hydraulic conductivity were made using the constant headmethod. Specific surface area analysis was undertaken through the use of laser diffrac-5
tometry. The SIP measurements were conducted over a frequency range from 1 mHzto 45 kHz and electrical conductivities of ∼60 µS/cm and ∼300 µS/cm were consideredfor the saturating pore fluids. In this context, it is important to note that in general thesignal-to-noise ratio of the observed phase spectra improved significantly with decreas-ing electrical conductivity of the pore fluid. This is due to the fact that the SIP phase10
spectrum essentially corresponds to the ratio of the complex and real parts of the elec-trical conductivity and thus reflects the increasing relative importance of the complexsurface conductivity processes taking place in the EDL at low conductivities of the sat-urating pore fluid. The SIP measurements were carried out using the highly sensitiveimpedance spectrometer for weakly polarizeable media developed by Zimmermann et15
al. (2008). The cylinder holding the sample has a length of 30 cm and a diameter of6 cm. The current electrodes, consisting of porous bronze plates with an effective porediameter of 15 µm, form the upper and lower boundaries of the sample volume. Thepotential electrodes are rings of silver wire fixed in grooves at 1/3 and 2/3 of the sampleholder’s length thus resulting in a constant, Wenner-type spacing of 10 cm between the20
individual electrodes. The sample’s response to the applied current is recorded andprovides information about the real and imaginary parts of the electrical resistivity.
To analyze the measured complex resistivity data, we first fit them using the so-calledCole-Cole model (Cole and Cole, 1941) given by
ρ (ω)=ρ0
[1−m
(1− 1
1+ (iωτ)c
)], (1)25
where ω denotes angular frequency, ρ0 the low-frequency asymptote, or direct-currentvalue, of the electrical resistivity ρ(ω), m the chargeability, c the Cole-Cole exponent,τ the time constant or relaxation time, and i =
√−1. The chargeability m describes the
6062
HESSD7, 6057–6080, 2010
Impact of controlledchanges in grain size
and pore space
K. Koch et al.
Title Page
Abstract Introduction
Conclusions References
Tables Figures
J I
J I
Back Close
Full Screen / Esc
Printer-friendly Version
Interactive Discussion
Discussion
Paper
|D
iscussionP
aper|
Discussion
Paper
|D
iscussionP
aper|
magnitude of the polarization effect, the Cole-Cole exponent c determines the widthof the peak of the phase curve described by Eq. (1), and the time constant τ is re-lated to the location of this peak in the frequency band (e.g., Lesmes and Friedman,2005; Cosenza et al., 2009). The exponent c typically takes values in the range from∼0.2 to ∼0.7, with smaller values being associated with broader resonance peaks. In5
a number of previous laboratory-based SIP studies, relaxation time has been found toexhibit a more-or-less clear correlation with the hydraulic conductivity (e.g., Pape andVogelsang, 1996; Kemna et al., 2005; Binley et al., 2005). In view of the pronouncednon-linearity and small number of parameters of the Cole-Cole model, we decidedto use a Bayesian Markov-chain-Monte-Carlo inversion approach for estimating the10
underlying parameters from the measured SIP data (e.g., Mosegaard and Tarantola,1995; Chen et al., 2008). We considered uniform prior distributions for all parametersexcept for the low-frequency asymptote of the resistivity ρ0, which we set to the resis-tivity value observed at the lowest measurement frequency of 1 mHz. Experimentingwith the width of these prior distributions, we found that it had essentially no influence15
on the final result and only a relatively minor influence on the speed of convergence,which points to the inherent robustness of the inversion procedure.
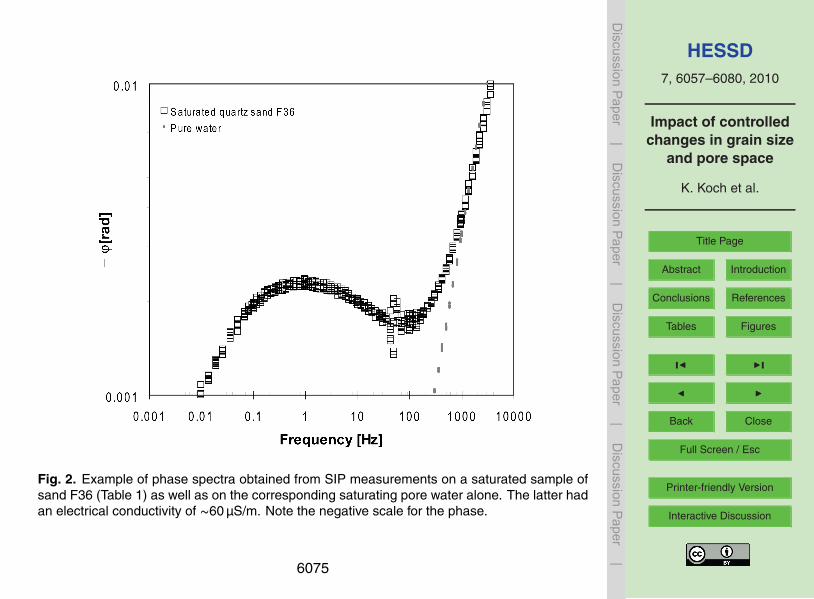
Figure 2 shows a representative log-log plot of the observed phase as a functionof the frequency from one of our SIP measurements. The corresponding saturatedquartz sand sample was measured three times up and down the considered frequency20
range and clearly displays the resonance or relaxation effect described through theCole-Cole model given by Eq. (1). For the considered data set, the resonance peak islocated at ∼1 Hz. At ∼50 Hz the graph shows some erratic noise, which is most likelyrelated to the local power supply. For comparison, we also show the correspondingmeasurements for the saturating pore fluid only, which in this case was water with an25
electrical conductivity of ∼60 µS/cm.Overall, we found that data quality is a significant issue for SIP measurements on
weakly polarizable samples. In particular, we have noticed that our SIP measurementswere adversely affected in the lower frequency range between ∼0.001 and 0.01 Hz.
6063
HESSD7, 6057–6080, 2010
Impact of controlledchanges in grain size
and pore space
K. Koch et al.
Title Page
Abstract Introduction
Conclusions References
Tables Figures
J I
J I
Back Close
Full Screen / Esc
Printer-friendly Version
Interactive Discussion
Discussion
Paper
|D
iscussionP
aper|
Discussion
Paper
|D
iscussionP
aper|
Although similar observations have been made by other researchers (Jougnot, per-sonal communication, 2009; Okay, personal communication, 2009), the causes ofthese noise problems remain enigmatic. As a consequence, SIP measurements onthe more coarse-grained samples, whose relaxation peaks are expected to be locatedat the lower end of the considered frequency range, must probably be regarded as5
representing the limits of current measurement capabilities. In this context, it is, how-ever, important to note that due to the use of multiple repeated measurements overthe entire frequency range and variable electrical conductivities of the saturating porefluid, meaningful quantitative interpretations were, unless explicitly mentioned other-wise, possible for most of our samples.10
3 Results
3.1 Hydraulic characterization
Figure 3 shows a semi-log plot of the saturated hydraulic conductivity versus porosityfor the samples considered in this study. The samples are distinguished in terms ofbeing compacted, non-compacted, sieved, and non-sieved. As expected, we observe15
that the compaction of a sample generally results in a reduced hydraulic conductivityand porosity due to smaller pore diameters. Changing of the grain size distributionsthrough the use of sieved fractions, on the other hand, shows a tendency towardsgreater porosity values for comparable values of the hydraulic conductivities. At similarporosity, well-sorted samples tend to drain less efficiently than their more heteroge-20
neous counterparts, and in other words need more pore space to conduct the sameamount of water. It is assumed that pore size distribution is more homogeneous inwell-sorted samples, and discrepancies between smallest and biggest pore sizes aresmaller than with materials of broad grain size distributions. The above finding is con-sistent with the fact that a squared increase of the pore surface area, which governs25
frictional properties, is opposed by a cubic gain in pore volume, which governs the
6064

HESSD7, 6057–6080, 2010
Impact of controlledchanges in grain size
and pore space
K. Koch et al.
Title Page
Abstract Introduction
Conclusions References
Tables Figures
J I
J I
Back Close
Full Screen / Esc
Printer-friendly Version
Interactive Discussion
Discussion
Paper
|D
iscussionP
aper|
Discussion
Paper
|D
iscussionP
aper|
transport volume. Meaning that one pore with the same volume as two smaller porescombined imposes less friction on the water flux and hence transports more water inthe same time. Although this statement seems to be largely self-evident and a princi-pal factor in the formation of preferential, channelized flow patterns, this effect is rarelyconsidered in current hydrological research (e.g., Hillel, 2004).5
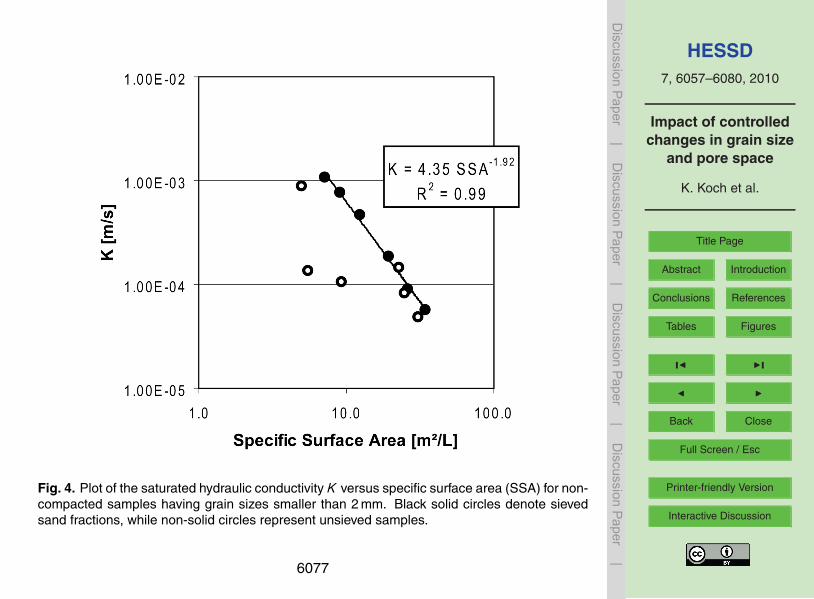
Figure 4 shows a semi-log plot of the saturated hydraulic conductivity versus thespecific surface area. The specific surface area was evaluated with a Beckman Coul-ter LS™ 13320 Laser Diffraction Particle Size Analyzer. The method is applicable fornon-compacted samples with grain diameters smaller than 2 mm and hence the totalamount of measureable samples is somewhat limited. Nevertheless, the correspond-10
ing results demonstrate that well sorted samples show a much stronger and clearercorrelation between hydraulic conductivity and specific surface area compared to theirmore poorly sorted, more heterogeneous counterparts. Overall, we see that for com-parable surface areas, well sorted samples are characterized by higher hydraulic con-ductivity than most of the more poorly sorted samples. Keeping in mind the above15
mentioned basic relationship of surface to volume, this discrepancy between sievedand non-sieved sands should be entirely related to the heterogeneity of the samples’pore structure. As a consequence, the discrepancy between the maximum value ofthe specific surface area for a certain value of the hydraulic conductivity and the actu-ally observed value for a given sample should provide us with a parameter related to20
the actual width of a samples pore size distribution. This parameter is related to thedynamic storage and hydraulic transport behavior of a material and might be of use inhydrological modeling. In the considered case, the maximum values case are given bythe results for the well sorted samples, but could also be inferred through theoreticalconsiderations.25
3.2 SIP measurements
Figure 5 shows a log-log plot of the saturated hydraulic conductivity versus the esti-mated relaxation time τ obtained by inverting the measured SIP data based on the
6065
HESSD7, 6057–6080, 2010
Impact of controlledchanges in grain size
and pore space
K. Koch et al.
Title Page
Abstract Introduction
Conclusions References
Tables Figures
J I
J I
Back Close
Full Screen / Esc
Printer-friendly Version
Interactive Discussion
Discussion
Paper
|D
iscussionP
aper|
Discussion
Paper
|D
iscussionP
aper|
Cole-Cole model given by Eq. (1). Only compacted samples are considered and theresults were separated in terms of being sieved or non-sieved before least-squaresfitting. We see that non-sieved samples exhibit a systematic relation between the hy-draulic conductivity K and the relaxation time τ of the form log K = a+b log τ. Thecorrelation between K and τ is much stronger for the non-sieved samples than for the5
sieved samples, which we attribute to the generally relatively poor quality of the SIPmeasurements for the latter. This finding, which has been corroborated through re-peated measurements, is enigmatic when interpreting the SIP-response based on thesimple sphere model from Schwarz (1962). When considering the grain diameter to beone of the most decisive parameters we would expect to see a trend towards sharper,10
more clear, relaxation peaks, along with increasing granulometric homogeneity of thesamples, which indirectly should result in a more clear K -τ correlation for better sortedsand.
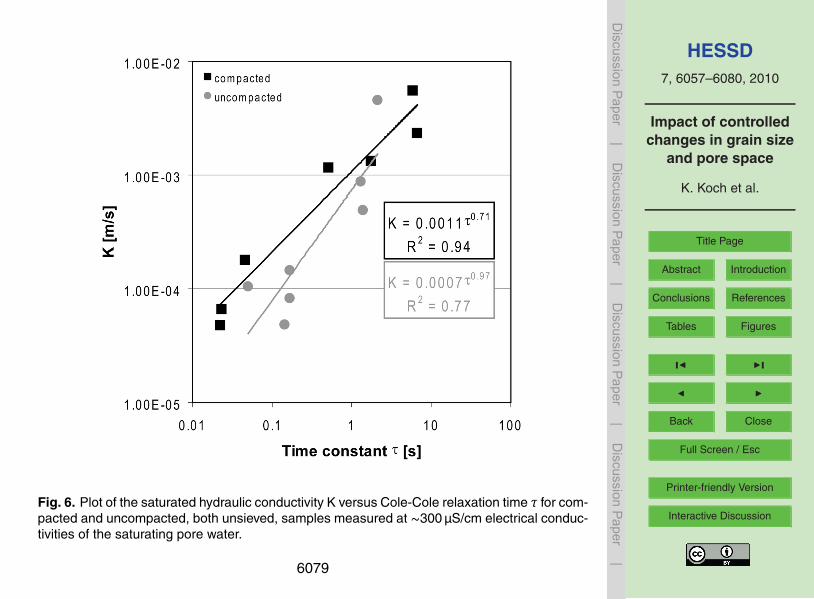
Figure 6 shows a log-log plot of the saturated hydraulic conductivity versus the es-timated Cole-Cole relaxation time, where we have now separated the samples with15
regard to being either compacted or non-compacted. With regard to time constant τ,the overall effect of compaction thus seems to be a shift towards smaller time con-stants, associated with smaller length scales of the underlying polarization process(Schwarz, 1962; Kormiltsev, 1963). The primary effect of compaction is the reductionof the porosity but likewise it results in increasing a sample’s specific surface area: for20
example, decreasing the pore space between uniform spheres by 10% through com-paction results in an increase of the specific surface area of almost 17%. This demon-strates that together with the well known sensitivity of the SIP response to changesin grain size (e.g., Schwartz, 1962; Leroy et al., 2008; Revil and Florsch, 2010), thespecific surface area also seems to be a good indicator of the size of the polarization25
cells sensed by the inferred relaxation processes (e.g., Kormiltsev, 1963; Borner andSchon, 1991)
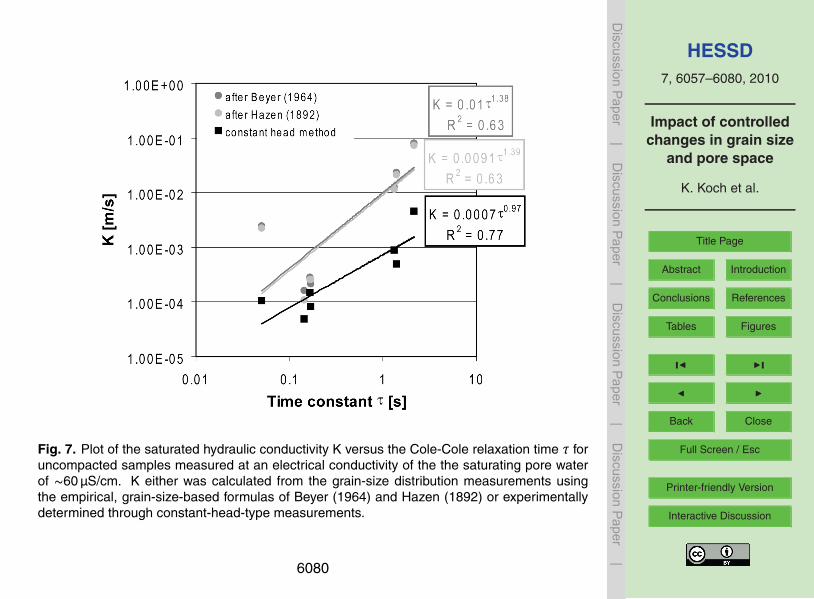
Finally, Fig. 7 compares the observed K values with inferred ones based on com-mon granulometric models (Hazen, 1892; Beyer, 1964) with the τ values of the corre-
6066

HESSD7, 6057–6080, 2010
Impact of controlledchanges in grain size
and pore space
K. Koch et al.
Title Page
Abstract Introduction
Conclusions References
Tables Figures
J I
J I
Back Close
Full Screen / Esc
Printer-friendly Version
Interactive Discussion
Discussion
Paper
|D
iscussionP
aper|
Discussion
Paper
|D
iscussionP
aper|
sponding samples. Interestingly, we find a systematically stronger correlation for themeasured K -values compared to the K -values inferred from empirical relations basedon granulometric criteria. These findings corroborate the above interpretation and areconsistent with the original findings of Kozeny (1927) and Carman (1938, 1956) in thatthe specific surface area of a porous material is in general the determining parameter5
for its permeability.Following Reppert and Morgan (2001), Scott (2006), and Revil and Florsch (2010),
the impact of the pore width on the recorded SIP response can be considered of sec-ondary importance. This is primarily due to the comparatively large sizes of the porethroats of both the non-compacted and the compacted samples considered in this10
study, which in turn points to the generally subordinate contribution of pore throat andmembrane effects to the observed SIP response for unconsolidated sandy sedimentsin the frequency range below the Maxwell-Wagner effect. At the same time, the ob-served impact on a samples’ SIP-signature related to the transformation of pore spacethrough compaction clearly indicates that individual structural aspects like grain size or15
surface roughness (e.g., Leroy et al., 2008) are not the only parameters determiningSIP response. Compaction changes the specific surface area, which in turn is expectedto find its distinct expression in corresponding changes of the formation factor. As aconsequence, the recently proposed theoretical model from Revil and Florsch (2010),in which the formation factor plays an essential role, seems to be indirectly supported20
by our findings. In detail, however, the link between the formation factor and the SIPresponse of granular sandy media is as of yet largely unexplored and, in our view,represents pertinent a topic for future research in this domain.
4 Conclusions
The goal of this study was to improve our understanding of the polarization processes25
through experimental control of different pore space characteristics in laboratory mea-surements. It can safely be stated that our results show a clear relation of the SIP re-
6067
HESSD7, 6057–6080, 2010
Impact of controlledchanges in grain size
and pore space
K. Koch et al.
Title Page
Abstract Introduction
Conclusions References
Tables Figures
J I
J I
Back Close
Full Screen / Esc
Printer-friendly Version
Interactive Discussion
Discussion
Paper
|D
iscussionP
aper|
Discussion
Paper
|D
iscussionP
aper|
sponse with the hydraulic conductivity, demonstrate the variability of this relation in re-sponse to changes in pore size and grain size characteristics, and hence demonstratepotential of SIP-based methods for remote-sensing-type first-order hydraulic charac-terizations of the shallow subsurface. In agreement with previous findings, the resultsof our measurements indicate a power-law-type correlation between the inferred Cole-5
Cole relaxation time and hydraulic conductivity for the considered broad range of sat-urated sand samples. Changes in compaction and sorting of the samples resultedin a certain shift in the SIP response but did not fundamentally alter this overall pic-ture. With regard to an improved understanding of the underlying physical properties,the strong interdependencies between grain size distribution and pore characteristics10
complicate the inference of the origin of the corresponding SIP effect. Yet, increasingthe degree of compaction while leaving the grain size distribution unchanged showeda systematic effect on the SIP response towards smaller relaxation times, which in turnare associated with lower degrees of heterogeneity in the probed material. The phe-nomenological approach of relating values of the relaxation time to a change in the15
size of heterogeneities in the sampled material showed for both changes in grain sizeand pore size of our samples, while the change of pore size through compaction alsoeffects the ratio pore interface versus porosity. Due to this interlink of specific surfacearea with compaction and pore width, multiple explanations are possible and hencefundamental question regarding the interdependencies of the polarization spectra and20
pore width remains as of yet unresolved.
Acknowledgements. This research has been funded by a grant from the Swiss National Sci-ence Foundation. We greatly profited from collaboration with and logistical support from theForschungszentrum Juelich, Germany. We would also like to thank Quarzwerke Frechen forproviding the samples used for this study.25
6068
HESSD7, 6057–6080, 2010
Impact of controlledchanges in grain size
and pore space
K. Koch et al.
Title Page
Abstract Introduction
Conclusions References
Tables Figures
J I
J I
Back Close
Full Screen / Esc
Printer-friendly Version
Interactive Discussion
Discussion
Paper
|D
iscussionP
aper|
Discussion
Paper
|D
iscussionP
aper|
References
Beyer, W.: Zur Bestimmung der Wasserdurchlassigkeit von Kiesen und Sanden aus der Korn-verteilung, Wasserwirtschaft – Wassertechnik (WWT), 165–169, 1964.
Binley, A., Slater L., Fukes M., and Cassiani, G.: The relationship between spectral inducedpolarization and hydraulic properties of saturated and unsaturated sandstone, Water Resour.5
Res., 41(12), W12417, doi:10.1029/2005WR004202, 2005.Borner, F. D. and Schon, J. H.: A relation between the quadrature component of electrical
conductivity and the specific surface area of sedimentary rocks, The Log Analyst, 32, 612–613, 1991.
Borner, F. D., Schopper, J. R., and Weller, A.: Evaluation of transport and storage proper-10
ties in the soil and groundwater zone from induced polarization measurements, Geophys.Prospect., 44, 583–601, 1996.
Chen, Y. and Or, D.: Effects of Maxwell-Wagner polarization on soil complex dielectric permittiv-ity under variable temperature and electrical conductivity, Water Resour. Res., 42, W06424,doi:10.1029/2005WR004590, 2006.15
Chen, J., Kemna, A., and Hubbard, S.: A comparison between Gauss-Newton and Markov-chain Monte Carlo-based methods for inverting spectral induced-polarization data for Cole-Cole parameters, Geophysics, 73, F247–F259, doi:10.1190/1.2976115, 2008.
Cole, K. S. and Cole, R. H.: Dispersion and absorption in dielectrics. I. alternating current field,J. Chem. Phys., 1, 341–351, 1941.20
Cosenza, P., Ghorbani, A., Camerlynck, C., Rejiba, F., Guerin, R., and Tabbagh, A.: Effec-tive medium theories for modelling the relationships between electromagnetic propertiesand hydrological variables in geomaterials: a review, Near Surf. Geophys., 7 , 563–578,doi:10.3997/1873-0604.2009009, 2009.
Carman, P. C.: The determination of the specific surface of powders, J. Soc. Chem. Ind. Trans.,25
57, 225–234, 1938.Carman, P. C.: Flow of gases through porous media, Butterworths Scientific Publications, Lon-
don, 1956.Hazen, A.: Some physical properties of sands and gravels, with special reference to their use
in filtration, 24th Annual Rep., Massachusetts State Board of Health, 34, 539–556, 1892.30
Hillel, D.: Introduction to environmental soil physics, Elsevier, 494 pp., 2004.Holliger, K.: Groundwater geophysics: from structure and porosity to permeability?, in: Over-
6069

HESSD7, 6057–6080, 2010
Impact of controlledchanges in grain size
and pore space
K. Koch et al.
Title Page
Abstract Introduction
Conclusions References
Tables Figures
J I
J I
Back Close
Full Screen / Esc
Printer-friendly Version
Interactive Discussion
Discussion
Paper
|D
iscussionP
aper|
Discussion
Paper
|D
iscussionP
aper|
exploitation and contamination of shared groundwater resources, edited by: Darnault, C.,Springer, 49–65, 2008.
Hordt, A., Blaschek, R., Kemna, A., and Zisser, N.: Hydraulic conductivity estimation frominduced polarisation data at the field scale – the Krauthausen case history, J. Appl. Geophys.,62, 33–46, 2007.5
Kemna, A., Binley, A., and Slater, L.: Crosshole IP imaging for engineering and environmentalapplications, Geophysics, 69, 97–107, 2004.
Kemna, A., Munch, H.-M., Titov, K., Zimmermann, E., and Vereecken, H.: Relation of SIPrelaxation time of sands to salinity, grain size and hydraulic conductivity: Extended Abstracts:Near Surface 2005 – 11th European Meeting of Environmental and Engineering Geophysics,10
4 pp, 2005.Koch, K., Wenninger, J., Uhlenbrook, S., and Bonell, M.: Joint interpretation of hydrological
and geophysical data: electrical resistivity tomography results from a process hydrologicalresearch site in the Black Forest Mountains, Germany, Hydrol. Process., 23(10), 1501–1513,2009.15
Kormiltsev, V. V.: O vozbuzdenii i spade vyzvannoi polarizatsii v kapillarnoi srede (On excitationand decay of Induced Polarization in capillary medium): Izvestia AN SSSR, Seria Geofizich-eskaya (Solid Earth Physics), 11, 1658–1666, (in Russian), 1963.
Kozeny, J.: Ueber kapillare Leitung des Wassers im Boden, Wien, Akad. Wiss., 136(2a), 271,(in German), 1927.20
Leroy, P., Revil, A., Kemna, A., Cosenza, P., and Ghorbani, A.: Complex conductivity of water-saturated packs of glass beads, J. Colloid Interf. Sci., 321, 103–117, 2008.
Lesmes, D. P. and Morgan, F. D.: Dielectric spectroscopy of sedimentary rocks, J. Geophys.Res., 106 , 13329–13346, 2001.
Lesmes, D. P. and Friedman, S.: Relationships between electrical and hydrogeological proper-25
ties of rocks and soils, in: Hydrogeophysics, edited by: Rubin, Y. and Hubbard, S., Springer,Dordrecht, The Netherlands, 129–156, 2005.
Marshall, D. J. and Madden, T. R.: Induced polarization, a study of its causes, Geophysics, 24,790–816, 1959.
Maxwell, J. C.: A Treatise on Electricity and Magnetism, third ed., Oxford University Press,30
London, 1892.Mosegaard, K. and Tarantola, A.: Monte Carlo sampling of solutions to inverse problems, J.
Geophys. Res., 100, 12431–12447, doi:10.1029/94JB03097, 1995.
6070

HESSD7, 6057–6080, 2010
Impact of controlledchanges in grain size
and pore space
K. Koch et al.
Title Page
Abstract Introduction
Conclusions References
Tables Figures
J I
J I
Back Close
Full Screen / Esc
Printer-friendly Version
Interactive Discussion
Discussion
Paper
|D
iscussionP
aper|
Discussion
Paper
|D
iscussionP
aper|
Pape, H. and Vogelsang, D.: Fractal Evaluation of Induced Polarization Logs in the KTB-Oberpfalz HB, Geologisches Jahrbuch, Bundesanst. fur Geowiss. u. Rohstoffe, E 54, 3–27,1996.
Reppert, P. M. and Morgan, F. D.: Streaming potential data collection and data processingtechniques, J. Colloid Interf. Sci., 233, 348–355, 2001.5
Revil, A. and Florsch, N.: Determination of permeability from spectral induced polar-ization in granular media, Geophys. J. Int., 181(3), 1480–1498, doi:10.1111/j.1365-246X.2010.04573.x, 2010.
Rubin, Y. and Hubbard, S.: Hydrogeophysics, Springer, Dordrecht, The Netherlands, 523 pp.,2005.10
Scott, J. B. T.: The origin of the observed low-frequency electrical polarization in sandstones,Geophysics, 71, 235–238, 2006.
Schwarz, G.: A theory of the low-frequency dispersion of colloidal particles in electrolyte solu-tion, J. Phys. Chem., 66, 2636–2642, 1962.
Slater, L. and Lesmes, D. P.: Electrical-hydraulic relationships observed for unconsolidated15
sediments, Water Resour. Res., 38(10), 1213, doi:10.1029/2001WR001075, 2002.Slater, L.: Near Surface Electrical Characterization of Hydraulic Conductivity: From Petrophys-
ical Properties to Aquifer Geometries – A Review, Surv. Geophys., 28, 169–197, 2007.Stern, O.: Zur Theorie der elektrolytischen Doppelschicht, Z. Electrochem, 30, 508, (in Ger-
man), 1924.20
Titov, K., Komarov, V., Tarasov, V., and Levitski, A.: Theoretical and experimental study oftime-domain induced polarization in water saturated sands, J. Appl. Geophys., 50, 417–433,2002.
Titov, K., Kemna, A., Tarasov, A., and Vereecken, H.: Induced Polarization of UnsaturatedSands Determined through Time Domain Measurements, Vadose Zone J., 3, 1160–1168,25
2004.Vanhala, H.: Mapping oil-contaminated sand and till with the spectral induced polarization (SIP)
method, Geophys. Prosp., 45, 303–326, 1997.Vinegar, H. J. and Waxman, M. H.: Induced polarization of shaly sands, Geophysics, 49, 1267–
1287, 1984.30
Wagner, K. W.: Arch. Elektrotechn, 2, 371–387, 1914.Zimmermann, E., Kemna, A., Berwix, J., Glaas, W., Munch, H. M., and Huisman, J. A.: A high-
accuracy impedance spectrometer for measuring sediments with low polarizability, Meas.
6071
HESSD7, 6057–6080, 2010
Impact of controlledchanges in grain size
and pore space
K. Koch et al.
Title Page
Abstract Introduction
Conclusions References
Tables Figures
J I
J I
Back Close
Full Screen / Esc
Printer-friendly Version
Interactive Discussion
Discussion
Paper
|D
iscussionP
aper|
Discussion
Paper
|D
iscussionP
aper|
Sci. Technol., 19, 105603, doi:10.1088/0957-0233/19/10/105603, 2008.Zisser, N., Kemna, A., and Nover, G.: Relationship between low-frequency electrical properties
and hydraulic permeability of low-permeability sandstones, Geophysics, 75, E131–E141,2010.
6072
HESSD7, 6057–6080, 2010
Impact of controlledchanges in grain size
and pore space
K. Koch et al.
Title Page
Abstract Introduction
Conclusions References
Tables Figures
J I
J I
Back Close
Full Screen / Esc
Printer-friendly Version
Interactive Discussion
Discussion
Paper
|D
iscussionP
aper|
Discussion
Paper
|D
iscussionP
aper|
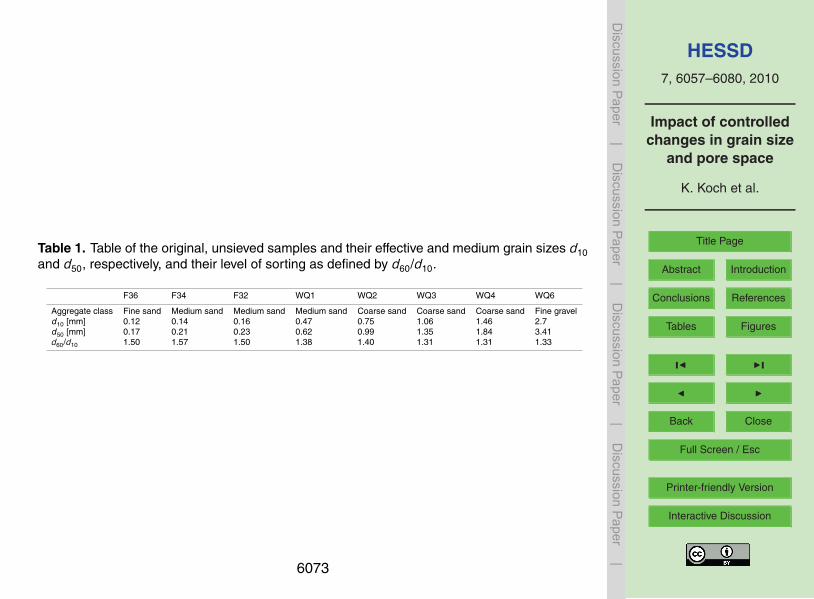
Table 1. Table of the original, unsieved samples and their effective and medium grain sizes d10and d50, respectively, and their level of sorting as defined by d60/d10.
F36 F34 F32 WQ1 WQ2 WQ3 WQ4 WQ6
Aggregate class Fine sand Medium sand Medium sand Medium sand Coarse sand Coarse sand Coarse sand Fine graveld10 [mm] 0.12 0.14 0.16 0.47 0.75 1.06 1.46 2.7d50 [mm] 0.17 0.21 0.23 0.62 0.99 1.35 1.84 3.41d60/d10 1.50 1.57 1.50 1.38 1.40 1.31 1.31 1.33
6073

HESSD7, 6057–6080, 2010
Impact of controlledchanges in grain size
and pore space
K. Koch et al.
Title Page
Abstract Introduction
Conclusions References
Tables Figures
J I
J I
Back Close
Full Screen / Esc
Printer-friendly Version
Interactive Discussion
Discussion
Paper
|D
iscussionP
aper|
Discussion
Paper
|D
iscussionP
aper|
Fig. 1. Grain size distribution curves for the different samples considered in this study. Left:Six sieved fractions originating from sands F36 and WQ1. Right: Grain size distributions ofunsieved industrial granular quartz samples. See also Table 1.
6074
HESSD7, 6057–6080, 2010
Impact of controlledchanges in grain size
and pore space
K. Koch et al.
Title Page
Abstract Introduction
Conclusions References
Tables Figures
J I
J I
Back Close
Full Screen / Esc
Printer-friendly Version
Interactive Discussion
Discussion
Paper
|D
iscussionP
aper|
Discussion
Paper
|D
iscussionP
aper|
Fig. 2. Example of phase spectra obtained from SIP measurements on a saturated sample ofsand F36 (Table 1) as well as on the corresponding saturating pore water alone. The latter hadan electrical conductivity of ∼60 µS/m. Note the negative scale for the phase.
6075

HESSD7, 6057–6080, 2010
Impact of controlledchanges in grain size
and pore space
K. Koch et al.
Title Page
Abstract Introduction
Conclusions References
Tables Figures
J I
J I
Back Close
Full Screen / Esc
Printer-friendly Version
Interactive Discussion
Discussion
Paper
|D
iscussionP
aper|
Discussion
Paper
|D
iscussionP
aper|
Fig. 3. Plot of the saturated hydraulic conductivity K versus porosity φ for all of the samplesconsidered in this study. Black squares represent compacted, grey circles uncompacted sam-ples. White circles therein denote sieved, well sorted samples.
6076
HESSD7, 6057–6080, 2010
Impact of controlledchanges in grain size
and pore space
K. Koch et al.
Title Page
Abstract Introduction
Conclusions References
Tables Figures
J I
J I
Back Close
Full Screen / Esc
Printer-friendly Version
Interactive Discussion
Discussion
Paper
|D
iscussionP
aper|
Discussion
Paper
|D
iscussionP
aper|
Fig. 4. Plot of the saturated hydraulic conductivity K versus specific surface area (SSA) for non-compacted samples having grain sizes smaller than 2 mm. Black solid circles denote sievedsand fractions, while non-solid circles represent unsieved samples.
6077

HESSD7, 6057–6080, 2010
Impact of controlledchanges in grain size
and pore space
K. Koch et al.
Title Page
Abstract Introduction
Conclusions References
Tables Figures
J I
J I
Back Close
Full Screen / Esc
Printer-friendly Version
Interactive Discussion
Discussion
Paper
|D
iscussionP
aper|
Discussion
Paper
|D
iscussionP
aper|
Fig. 5. Plot of the saturated hydraulic conductivity K versus Cole-Cole relaxation time τ forsieved and unsieved samples using a conductivity of ∼300 µS/cm for the saturating pore water.In both cases the samples were compacted.
6078
HESSD7, 6057–6080, 2010
Impact of controlledchanges in grain size
and pore space
K. Koch et al.
Title Page
Abstract Introduction
Conclusions References
Tables Figures
J I
J I
Back Close
Full Screen / Esc
Printer-friendly Version
Interactive Discussion
Discussion
Paper
|D
iscussionP
aper|
Discussion
Paper
|D
iscussionP
aper|
Fig. 6. Plot of the saturated hydraulic conductivity K versus Cole-Cole relaxation time τ for com-pacted and uncompacted, both unsieved, samples measured at ∼300 µS/cm electrical conduc-tivities of the saturating pore water.
6079
HESSD7, 6057–6080, 2010
Impact of controlledchanges in grain size
and pore space
K. Koch et al.
Title Page
Abstract Introduction
Conclusions References
Tables Figures
J I
J I
Back Close
Full Screen / Esc
Printer-friendly Version
Interactive Discussion
Discussion
Paper
|D
iscussionP
aper|
Discussion
Paper
|D
iscussionP
aper|
Fig. 7. Plot of the saturated hydraulic conductivity K versus the Cole-Cole relaxation time τ foruncompacted samples measured at an electrical conductivity of the the saturating pore waterof ∼60 µS/cm. K either was calculated from the grain-size distribution measurements usingthe empirical, grain-size-based formulas of Beyer (1964) and Hazen (1892) or experimentallydetermined through constant-head-type measurements.
6080