grain boundary inhomogeneity and grain boundary heterodiffusion
TRANSCRIPT

This article was downloaded by: [RMIT University]On: 05 September 2014, At: 21:42Publisher: Taylor & FrancisInforma Ltd Registered in England and Wales Registered Number: 1072954 Registeredoffice: Mortimer House, 37-41 Mortimer Street, London W1T 3JH, UK
Philosophical Magazine APublication details, including instructions for authors andsubscription information:http://www.tandfonline.com/loi/tpha20
Grain boundary inhomogeneity andgrain boundary heterodiffusionB. S. Bokstein a , A. S. Ostrovksy a & A. O. Rodin aa Department of Physical Chemistry , Moscow Institute of Steeland Alloys , Leninsky prospekt 4, 117936, Moscow, RussiaPublished online: 27 Sep 2006.
To cite this article: B. S. Bokstein , A. S. Ostrovksy & A. O. Rodin (1995) Grain boundaryinhomogeneity and grain boundary heterodiffusion, Philosophical Magazine A, 72:4, 829-836, DOI:10.1080/01418619508239937
To link to this article: http://dx.doi.org/10.1080/01418619508239937
PLEASE SCROLL DOWN FOR ARTICLE
Taylor & Francis makes every effort to ensure the accuracy of all the information (the“Content”) contained in the publications on our platform. However, Taylor & Francis,our agents, and our licensors make no representations or warranties whatsoever as tothe accuracy, completeness, or suitability for any purpose of the Content. Any opinionsand views expressed in this publication are the opinions and views of the authors,and are not the views of or endorsed by Taylor & Francis. The accuracy of the Contentshould not be relied upon and should be independently verified with primary sourcesof information. Taylor and Francis shall not be liable for any losses, actions, claims,proceedings, demands, costs, expenses, damages, and other liabilities whatsoeveror howsoever caused arising directly or indirectly in connection with, in relation to orarising out of the use of the Content.
This article may be used for research, teaching, and private study purposes. Anysubstantial or systematic reproduction, redistribution, reselling, loan, sub-licensing,systematic supply, or distribution in any form to anyone is expressly forbidden. Terms& Conditions of access and use can be found at http://www.tandfonline.com/page/terms-and-conditions
PHILOSOPHICAL MAGAZINE A, 1995, VOL. 72, No. 4, 829-836
Grain boundary inhomogeneity and grain boundary heterodiffusion
By B. S. BOKSTEIN, A. S. OSTROVKSY and A. 0. RODIN
Department of Physical Chemistry, Moscow Institute of Steel and Alloys, Leninsky prospekt 4, 117936 Moscow, Russia
[Received 10 October 1994; revised version accepted 14 February 19951
ABSTRACT It is shown that the inhomogeneity of the grain boundary (GB) i.e. the effect of
the distribution of different lattice sites on the heats of interaction with species, leads to nonlinear GB penetration plots (in Fisher’s coordinates). The sign of curvature and the values of deviation from a straight concentration profile depend on the interaction parameters (the maximum and minimum values of the interaction heat). The results of numerical calculations are discussed.
0 1. INTRODUCTION The commonly accepted description of grain boundary (GB) diffusion is Fisher’s
model (Fisher 1951). According to this model the diffusion flow is directed from the surface along the GB (y-axis on fig. 1). GB diffusion flow is ahead of the bulk flow so the GB flow part is removed normally to the GB (along the x-axis) into the bulk. Fisher postulated that the GB is a homogeneous slab with thickness 6 (6 4 (Dt)1/2), where D is the bulk diffusion coefficient, t is the annealing time and (Dt)”2 approximates to the bulk diffusion path, and that on dividing the interface between the GB slab and the grain volume, both concentrations of the diffusant (c‘ in the GB and c in the volume) are equal:
C ’ b ) = c( 2 6 /2 , y ) . (1)
According to Fisher’s solution
c’ = co exp ( - y /L) , (2)
where co is the concentration of the diffusant at the initial surface 0, = 0) and L is the Fisher’s depth,
where D’ is the GB diffusion coefficient.
linear form (Henry’s isotherm). Instead of eqn. (1), Gibbs wrote Gibbs (1966) solved Fisher’s problem by taking into account GB segregation in the
c’ = bc. (4)
The enrichment coefficient b depends on temperature T:
b = exp ( - A,/(kT)). ( 5 )
In eqn. (5)As is the free energy of segregation or the work of equilibrium transferring the atom of diffusant from the grain volume to the GB.
0141-861OB5 $10.00 0 1995 Taylor & Francis Ltd
Dow
nloa
ded
by [
RM
IT U
nive
rsity
] at
21:
42 0
5 Se
ptem
ber
2014

830 B. S. Bokstein et al.
Fig. 1
y=o
D I I 7 --r
D __c
4Y
Scheme of GB diffusion by Fisher’s model.
Gibbs (1966) showed that the linear dependence between In (c‘) and y remains true, however, the slope gives not a double (0’6) but a triple product (bD’6). So defined, the effective activation energy of GB diffusion contains the energy of species interaction with the GB or the segregation energy.
Bokstein, Fradkov and Beke ( 1 992) solved Fisher’s problem by taking into account the nonlinear interaction effects (saturation-all the sites within the GB available for the atoms of diffusant are occupied-and interaction of species). The first was taken into consideration by using the Langmuir-McLean type adsorption isotherm (Langmuir 1916, 1918, Mclean 1957) and the second by using the Fowler-Guggenheim isotherm (Fowler and Guggenheim 1960). Bokstein et al. (1992) showed that nonlinear segregation leads to nonlinear GB penetration plots (in Fisher’s coordinates, In (c’) and y ) . However, at large penetration depths, the concentration profiles become linear. The sign of curvature (upward or downward) and the value of deviation from a straight concentration profile depend on segregation parameters (segregation energy and enthalpy of mixing).
In this paper we attempt to analyse the connection between GB structure (i.e. the energetic distribution of GB sites) and the heterodiffusion concentration profiles in a model close to that of Fisher.
Sutton and Vitek (1982) showed by use of computer simulation that the segregation energy for Bi in Cu varies from one GB site to another.
Bernardini (1990) pointed to the significance of this result concerning GB diffusion. Testing the data on Au and Cu heterodiffusion in Ag, Bernardini concluded that there are probably two different types of GB sites that are responsible for GB diffusion. Sites with a large negative energy of interaction (strong attraction, strong segregation) act as traps for the diffusant atoms and decrease the rate of GB diffusion. The second type are sites with a large positive energy of interaction (strong repulsion, desegregation), which increases the rate of GB diffusion.
In this paper the above-mentioned connection has been introduced not in a discrete atomistic but in a continuous thermodynamic manner. Instead of eqn. (4) we have considered the simplest segregation isotherm, taking into account the inhomogeneity
Dow
nloa
ded
by [
RM
IT U
nive
rsity
] at
21:
42 0
5 Se
ptem
ber
2014
Grain boundary inhomogeneity 83 1
of the GB. Such an isotherm is similar to Ternkin’s (1941) adsorption isotherm derived for the free surface.
!j 2. THEORY According to Temkin’s (1941) theory, the relationship between c‘ and c may be
expressed by the m
c’ = I, [bc/( 1 + bc - c)] W(b) db.
In eqn. (6) the terms within the square brackets correspond to the Langmuir- McLean segregation isotherm (with saturation) at the GB sites of i-type (with a constant segregation free energy A$) and the term W(b) db describes the distribution of different sites on the heats of interaction with diffusant:
Here
y = -AF/(kT). (8)
One can see that distribution (7) is linear. Upon integration the solution of eqn.(6) is
where
From eqn. (9) it follows that
exp(Ayc’) - 1 exp (Ayc’) - 1 + bo[ 1 - exp ( - Ay) exp (Ayc’)] ’ c =f(c’) = (1 1)
Here
bo = exp (Ymax). (12)
As was shown by Bokstein et al. (1992) we need to turn to the Cauchy problem:
d2c’ ~- - L - 2f(C’) = F(c’), dY2
and
Introducing the new parameters
Dow
nloa
ded
by [
RM
IT U
nive
rsity
] at
21:
42 0
5 Se
ptem
ber
2014
832 B. S. Bokstein et al.
h = cbAy, (17)
(18) w = [exp (hu) - 1 yh,
boexp( - Ay) - 1 h '= 1-exp(-Ay) b,
and the new coordinate
we have the following Cauchy problem:
u(0) = 1 (22)
and
If Ay + 0, then w -+ u, p + ch( 1 - b; I), z -+ y/(LbAn) and the problem corresponds
It is possible to reduce the Cauchy problem (eqns. (21), (22) and (23)) to the solution to the case of the saturation effect (Bokstein et al. 1992).
of the differential equation
-= du -['('In j h dz p + h p h -p[exp(hu) - 11
with the condition
The system of equations (24) and (25) is reduced to the integral
In the casep = 0 (Y&n = 0) as in the casep = - h (y,,, = 0) the integral (26) cannot
If ymin+O we have be calculated because of uncertainty in the radical.
If ymax -+ 0 we have
- d( - hu) [exp( - hu) - ( - hu) - 1]1'2'
112 u
'= - (k) The results of integration of eqns. (26), (27) and (28) for different values of ymax
In all calculations we set the value of ch equal to unity. and ymin are shown in figs. 3-5.
Dow
nloa
ded
by [
RM
IT U
nive
rsity
] at
21:
42 0
5 Se
ptem
ber
2014
Grain boundary inhomogeneity 833
Fig. 2
( 3 )
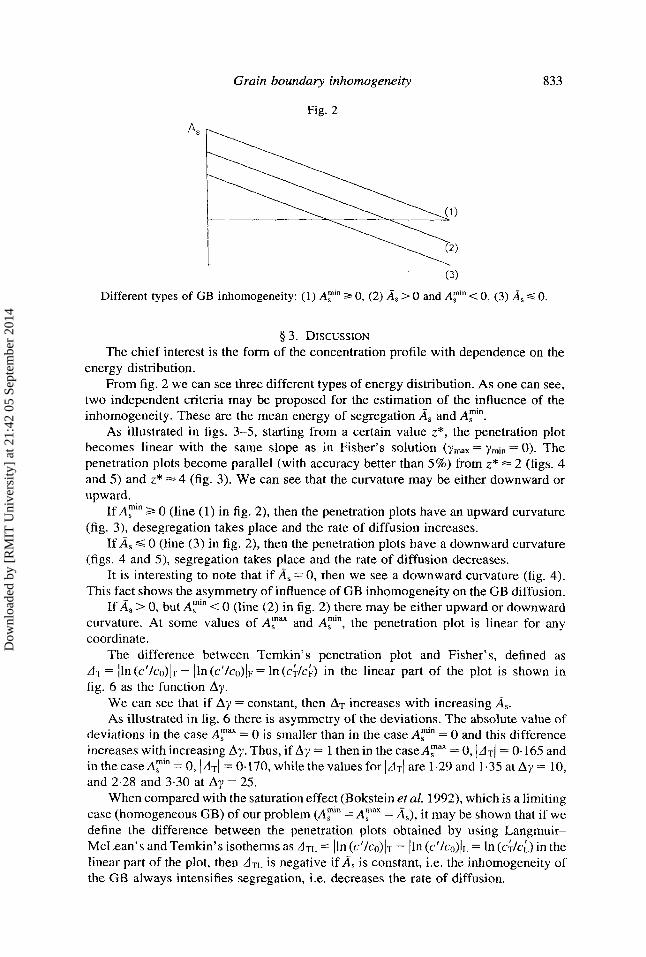
Different types of GB inhomogeneity: (1) A? 3 0, (2) A, > 0 and A;'" < 0, (3) A, S 0.
Q 3. DISCUSSION The chief interest is the form of the concentration profile with dependence on the
energy distribution. From fig. 2 we can see three different types of energy distribution. As one can see,
two independent criteria may be proposed for the estimation of the influence of the inhomogeneity. These are the mean energy of segregation A, and A?".
As illustrated in figs. 3-5, starting from a certain value z*, the penetration plot becomes linear with the same slope as in Fisher's solution (ymm = ymin = 0). The penetration plots become parallel (with accuracy better than 5%) from z* = 2 (figs. 4 and 5) and z* = 4 (fig. 3 ) . We can see that the curvature may be either downward or upward.
If Ay" 2 0 (line (1) in fig. 2), then the penetration plots have an upward curvature (fig. 3 ) , desegregation takes place and the rate of diffusion increases.
If A, S 0 (line ( 3 ) in fig. 2), then the penetration plots have a downward curvature (figs. 4 and S), segregation takes place and the rate of diffusion decreases.
It is interesting to note that if A, = 0, then we see a downward curvature (fig. 4). This fact shows the asymmetry of influence of GB inhomogeneity on the GB diffusion.
If A, > 0, but A? < 0 (line (2) in fig. 2) there may be either upward or downward curvature. At some values of A? and A F , the penetration plot is linear for any coordinate.
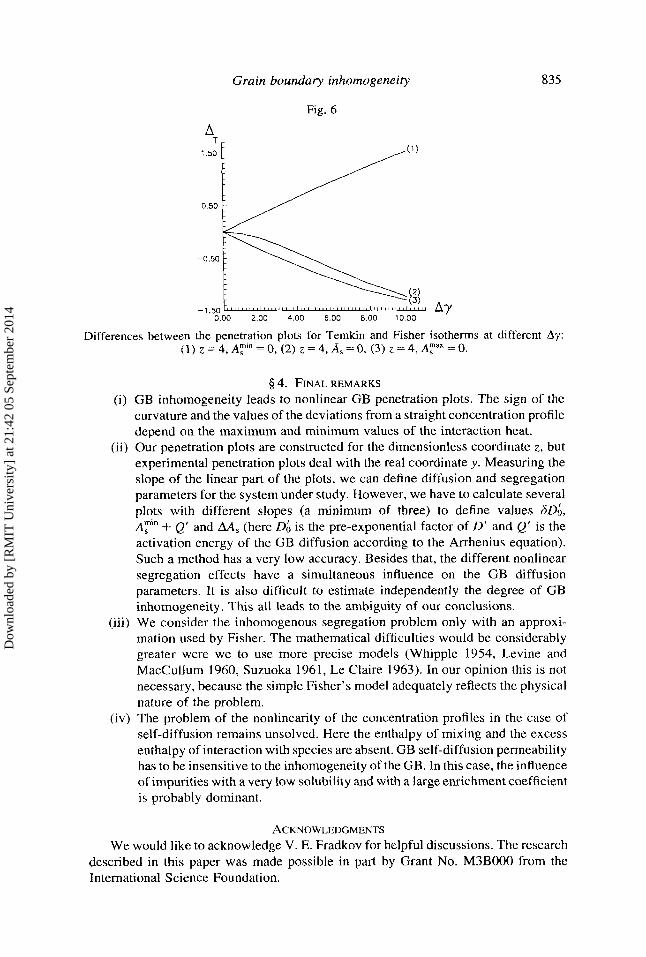
The difference between Temkin's penetration plot and Fisher's, defined as AT = Iln (c'/c")~T - Iln (c'/c& = In (c+/ck) in the linear part of the plot is shown in fig. 6 as the function Ay.
We can see that if Ay = constant, then AT increases with increasing A,. As illustrated in fig. 6 there is asymmetry of the deviations. The absolute value of
deviations in the case A T = 0 is smaller than in the case A?"" = 0 and this difference increases with increasing Ay. Thus, if Ay = 1 then in the c a s e A y = 0, / A T / = 0.165 and in the case A:'" = 0, I&( = 0.170, while the values for \AT/ are 1.29 and 1.35 at Ay = 10, and 2.28 and 3.30 at Ay = 25,
When compared with the saturation effect (Bokstein et al. 1992), which is a limiting case (homogeneous GB) of our problem ( A T = A T = A,), it may be shown that if we define the difference between the penetration plots obtained by using Langmuir- McLean's and Temkin's isotherms as ATL = Iln (c'/c& - Iln (c'/c& = In (&el) in the linear part of the plot, then A T L is negative if A, is constant, i.e. the inhomogeneity of the GB always intensifies segregation, i.e. decreases the rate of diffusion.
Dow
nloa
ded
by [
RM
IT U
nive
rsity
] at
21:
42 0
5 Se
ptem
ber
2014

834 B. S . Bokstein et al.
Fig. 3
10 6 2 0
-5.00
Penetration plots of GB diffusion for A?" = 0.
Fig. 4
-4.00
-6.00
rv= 0 4
I 2 '0
Dow
nloa
ded
by [
RM
IT U
nive
rsity
] at
21:
42 0
5 Se
ptem
ber
2014
Grain boundary inhomogeneity
Fig. 6
4
835
Differences between the penetration plots for Temkin and Fisher isotherms at different A?: (I) z = 4, A? = 0, (2) z = 4, A, = 0, (3) z = 4, A? = 0.
Q 4. FINAL REMARKS
GB inhomogeneity leads to nonlinear GB penetration plots. The sign of the curvature and the values of the deviations from a straight concentration profile depend on the maximum and minimum values of the interaction heat. Our penetration plots are constructed for the dimensionless coordinate z , but experimental penetration plots deal with the real coordinate y . Measuring the slope of the linear part of the plots, we can define diffusion and segregation parameters for the system under study. However, we have to calculate several plots with different slopes (a minimum of three) to define values SO;, A T + Q' and AAs (here 06 is the pre-exponential factor of D' and Q' is the activation energy of the GB diffusion according to the Arrhenius equation). Such a method has a very low accuracy. Besides that, the different nonlinear segregation effects have a simultaneous influence on the GB diffusion parameters. It is also difficult to estimate independently the degree of GB inhomogeneity. This all leads to the ambiguity of our conclusions. We consider the inhomogenous segregation problem only with an approxi- mation used by Fisher. The mathematical difficulties would be considerably greater were we to use more precise models (Whipple 1954, Levine and MacCullum 1960, Suzuoka 1961, Le Claire 1963). In our opinion this is not necessary, because the simple Fisher's model adequately reflects the physical nature of the problem. The problem of the nonlinearity of the concentration profiles in the case of self-diffusion remains unsolved. Here the enthalpy of mixing and the excess enthalpy of interaction with species are absent. GB self-diffusion permeability has to be insensitive to the inhomogeneity of the GB. In this case, the influence of impurities with a very low solubility and with a large enrichment coefficient is probably dominant.
ACKNOWLEDGMENTS We would like to acknowledge V. E. Fradkov for helpful discussions. The research
described in this paper was made possible in part by Grant No. M3B000 from the International Science Foundation.
Dow
nloa
ded
by [
RM
IT U
nive
rsity
] at
21:
42 0
5 Se
ptem
ber
2014
836 Grain boundary inhomogeneity
REFERENCES BERNARDINI, J., 1990, Defect and DifJusion Forum, 66-69, 667. BOKSTEIN, B. S., FRADKOV, V. E., BEKE, D. L., 1992, Phil. Mag. A, 65, 277. FISHER, J . C., 195 1 , J. appl. Phys., 22, 74. FOWLER, R. H., and GUGGENHEIM, E., 1960, Statistical Thermodynamics (Cambridge:
Cambridge University Press). GIBBS, G. B., 1966, Phys. Stat. Sol., 16, K27. LANGMUIR, I., 1916, J. Am. chem. SOC., 38, 2221; 1918, Ibid., 40, 1361. LE CLAIRE, A. D., 1963, Br. J. appl. Phys., 44, 35 1 . LEVINE, H. S., and MACCALLUM, C. J., 1960, J. appl. Phys., 31,595. MCLEAN, D., 1957, Grain-Boundaries in Metals (Oxford: Clarendon Press). SUITON, A., and VITEK, V., 1982, Acta metall., 30, 21 1 . SUZUOKA, T., 1961, Trans. Jap. Inst. Metals, 2, 25. TEMIUN, M. I., 1941, J. phys. Chem., 15, 236 (in Russian). WHIPPLE, R. T. P., 1954, Phil. Mag., 45, 1225.
Dow
nloa
ded
by [
RM
IT U
nive
rsity
] at
21:
42 0
5 Se
ptem
ber
2014