gps q416 epr final - gap inc. · gap$inc.$reports$fourth$quarter$and$fiscal$year$2016$results$!...
TRANSCRIPT

!
!
!
GAP$INC.$REPORTS$FOURTH$QUARTER$AND$FISCAL$YEAR$2016$RESULTS$!
SAN$FRANCISCO$–$February$23,$2017$–!Gap!Inc.!(NYSE:!GPS)!today!reported!fourth!quarter!and!fiscal!year!2016!results!and!provided!guidance!for!fiscal!year!2017.!!
!
“We’re!pleased!to!finish!the!year!strong,!with!positive!comp!and!sales!growth!during!the!critical!holiday!
quarter,”!said!Art!Peck,!chief!executive!officer,!Gap!Inc.!“Going!forward,!we!will!maintain!our!focus!on!
improving!the!quality!and!relevance!of!our!products,!increasing!our!responsiveness!to!trends!and!
demand,!and!creating!more!synergy!across!channels!to!deliver!the!experiences!our!customers!want!and!
expect,!however!they!choose!to!shop.”!!
!
“We!have!many!opportunities!ahead!to!position!the!company!for!longOterm!growth,!while!keeping!our!
attention!focused!on!operating!discipline,”!said!Teri!ListOStoll,!executive!vice!president!and!chief!
financial!officer,!Gap!Inc.!
!
On!a!reported!basis,!the!company’s!diluted!earnings!per!share!were!$0.55!for!the!fourth!quarter!of!fiscal!
year!2016!and!$1.69!for!fiscal!year!2016.!The!company’s!adjusted!diluted!earnings!per!share!were!$0.51!
for!the!fourth!quarter!of!fiscal!year!2016!and!$2.02!for!fiscal!year!2016,!excluding!the!following:!
• Costs!associated!with!the!company’s!previously!announced!store!closure!and!streamlining!
initiatives,!including!the!impact!from!a!higher!tax!rate,!of!about!$0.04!and!$0.41!for!the!fourth!
quarter!and!fiscal!year!2016,!respectively;!!
• A!nonOcash!goodwill!impairment!charge!of!$0.18!related!to!Intermix;!!
• An!$0.11!benefit!from!insurance!proceeds!related!to!the!fire!that!occurred!on!the!company’s!
Fishkill!distribution!center!campus;!and!
• A!nonOrecurring!tax!benefit!of!about!$0.15.!!!
Please!see!the!reconciliations!of!adjusted!diluted!earnings!per!share,!a!nonOGAAP!financial!measure,!in!
the!tables!at!the!end!of!this!press!release.!!
The!company!noted!that!foreign!currency!fluctuations!negatively!impacted!adjusted!earnings!per!share!
for!fiscal!year!2016!by!an!estimated!$0.15,!or!about!6!percentage!points!of!earnings!per!share!growth!on!
an!adjusted!basis.
1
!
$$!!!!!!!!!!!!!!!!!!!!!!!!!!!!!!!!!!!!!!!!!!!!!!!!!!!!!!!!!!!!!
1
!In!calculating!earnings!per!share!excluding!the!impact!of!foreign!exchange,!the!company!estimates!
current!gross!margins!using!the!appropriate!prior!year!rates!(including!the!impact!of!merchandiseO
related!hedges),!translates!current!period!foreign!earnings!at!prior!year!rates,!and!excludes!the!yearO
overOyear!earnings!impact!of!balance!sheet!remeasurement!and!gains!or!losses!from!nonOmerchandiseO
related!foreign!currency!hedges.!This!is!done!in!order!to!enhance!the!visibility!of!adjusted!business!
results!excluding!the!direct!impact!of!foreign!currency!exchange!rate!fluctuations.!

!
!
!
Business$Highlights$$!
• Old!Navy!delivered!its!fifth!consecutive!year!of!net!sales!growth!in!fiscal!year!2016!and!grew!
market!share!in!key!categories!during!the!quarter,!including!dresses,!denim!and!knits.!!
• During!the!quarter,!Gap!brand’s!operating!model!helped!drive!improved!product!acceptance!
across!core!categories!and!divisions.!As!part!of!its!strategy!to!develop!engaging!digital!
experiences,!Gap!piloted!a!new!application!during!the!quarter,!DressingRoom!by!Gap,!to!help!
customers!virtually!“try!on”!clothing!through!a!smartphone!augmented!reality!experience.!
!
• Athleta!grew!its!footprint!to!132!U.S.!store!locations!by!the!end!of!2016,!and!is!scheduled!to!
open!about!15!additional!U.S.!stores!in!fiscal!year!2017.!The!women’s!performance!lifestyle!
brand!continues!to!be!on!the!leading!edge!of!fabric!innovation,!as!demonstrated!by!the!
introduction!of!Sculptek,!which!features!360Odegree!stretch,!and!Powervita,!its!newest!soft!and!
supportive!yoga!fabric,!in!fiscal!year!2016.!
!
• Mobile!point!of!sale!functionality!expanded!to!about!20!percent!of!the!Gap!Inc.!U.S.!fleet!in!
fiscal!year!2016,!enabling!store!associates!to!better!serve!their!customers!throughout!their!
shopping!experience.!!
Comparable$Sales$Results$The!company’s!fourth!quarter!fiscal!year!2016!comparable!sales!were!up!2!percent!compared!with!a!
decline!of!7!percent!last!year.!!
!
For!fiscal!year!2016,!the!company’s!comparable!sales!were!down!2!percent!compared!with!a!decline!of!4!
percent!last!year.!Comparable!sales!by!global!brand!for!fiscal!year!2016!were!as!follows:!
• Old$Navy$Global:!positive!1!percent!versus!flat!last!year$!
• Gap$Global:!negative!3!percent!versus!negative!6!percent!last!year$!
• Banana$Republic$Global:!negative!7!percent!versus!negative!10!percent!last!year$!!
Net$Sales$Results!Fourth!quarter!fiscal!year!2016!net!sales!increased!1!percent!to!$4.43!billion!and!fiscal!year!2016!net!
sales!were!$15.5!billion.!The!translation!of!foreign!currencies!into!U.S.!dollars!negatively!impacted!the!
company’s!reported!net!sales!for!fiscal!year!2016!by!about!$20!million.!Fourth!quarter!and!fiscal!year!
2016!net!sales!details!appear!in!the!tables!at!the!end!of!this!press!release.!!
$Additional$Fiscal$Year$2016$Results$!$
• Operating*Margin:!The!company’s!operating!margin!for!fiscal!year!2016!was!7.7!percent.!
• Operating*Expenses:!Fourth!quarter!fiscal!year!2016!operating!expenses!were!$1.20!billion!compared!with!$1.09!billion!last!year.!Fourth!quarter!fiscal!year!2016!operating!expenses!
include!$26!million!in!restructuring!charges,!a!$71!million!goodwill!impairment!charge!related!to!
Intermix,!and!a!$73!million!gain!from!insurance!proceeds!related!to!the!fire!that!occurred!on!the!
company’s!Fishkill,!New!York!distribution!center!campus.!!

!
!
!
Total!operating!expenses!for!fiscal!year!2016!were!$4.4!billion.!Excluding!full!year!restructuring!
charges!of!$197!million!and!other!fourth!quarter!2016!items!mentioned!above,!total!adjusted!
operating!expenses!for!fiscal!year!2016!were!$4.3!billion,!up!$156!million!compared!with!last!
year.!Please!see!the!reconciliation!of!adjusted!operating!expenses,!a!nonOGAAP!financial!
measure,!in!the!tables!at!the!end!of!this!press!release.!
!
In!line!with!the!company’s!previous!quarter’s!guidance,!marketing!expenses!for!the!fourth!
quarter!of!fiscal!year!2016!were!$195!million,!up!$26!million!compared!with!last!year.!Fiscal!year!
2016!marketing!expenses!were!$601!million!compared!with!$578!million!last!year.!!
$• Effective*Tax*Rate:!The!effective!tax!rate!was!22.8!percent!for!the!fourth!quarter!of!fiscal!year!
2016.!The!fourth!quarter!tax!rate!reflects!a!nonOrecurring!income!tax!benefit!related!to!a!legal!
structure!realignment!and!benefits!associated!with!changes!in!the!company’s!geographical!mix!
of!earnings.!Excluding!the!nonOrecurring!income!tax!benefit!related!to!the!legal!structure!
realignment,!as!well!as!the!tax!impact!related!to!restructuring!costs!and!a!goodwill!impairment!
charge!during!the!quarter,!the!adjusted!effective!tax!rate!for!the!fourth!quarter!of!fiscal!year!
2016!was!about!10!points!higher!than!the!reported!effective!tax!rate.!
!
The!effective!tax!rate!for!fiscal!year!2016!was!39.9!percent.!Excluding!the!benefit!from!the!legal!
structure!realignment,!and!tax!impacts!of!the!restructuring!costs!and!the!goodwill!impairment!
charge,!the!adjusted!fiscal!year!2016!effective!tax!rate!was!about!1!percentage!point!lower.!
• Inventory:!At!the!end!of!the!fourth!quarter!of!fiscal!year!2016,!total!inventory!was!down!2!percent!yearOoverOyear,!in!line!with!the!company’s!previous!guidance.!
• Cash*and*Cash*Equivalents:!The!company!ended!fiscal!year!2016!with!$1.8!billion!in!cash!and!
cash!equivalents.!For!fiscal!year!2016,!free!cash!flow,!defined!as!net!cash!provided!by!operating!
activities!less!purchases!of!property!and!equipment,!was!an!inflow!of!about!$1.2!billion.!Please!
see!the!reconciliation!of!free!cash!flow,!a!nonOGAAP!financial!measure,!from!the!GAAP!financial!
measure!in!the!tables!at!the!end!of!this!press!release.!
• Cash*Distribution:!During!the!fourth!quarter!of!fiscal!year!2016,!the!company!paid!a!dividend!of!
$0.23!per!share!and!repaid!its!$400!million!term!loan.!No!share!repurchases!were!made!in!fiscal!
year!2016.!
• Capital*Expenditures:!Fiscal!year!2016!capital!expenditures!were!$524!million,!in!line!with!the!
company’s!prior!guidance.!!
• Depreciation*and*Amortization:!Fiscal!year!2016!depreciation!and!amortization!expense,!net!of!
amortization!of!lease!incentives,!was!$531!million.!!
• Real*Estate:!The!company!ended!fiscal!year!2016!with!3,659!store!locations!in!50!countries,!of!
which!3,200!were!companyOoperated.!Square!footage!of!companyOoperated!stores!was!down!
about!3!percent!compared!with!the!end!of!fiscal!year!2015,!in!line!with!the!company’s!prior!
guidance.!The!company!noted!that!it!completed!the!closure!of!its!Old!Navy!Japan!business!and!a!
number!of!dilutive!Banana!Republic!stores,!primarily!internationally,!during!fiscal!year!2016.!
Store!count,!openings,!closings,!and!square!footage!of!our!stores!for!the!fourth!quarter!of!fiscal!
year!2016!appear!in!the!tables!at!the!end!of!this!press!release.!

!
!
!
$2017$Outlook!The!company!noted!that!fiscal!year!2017!is!a!53Oweek!year!versus!the!52Oweek!fiscal!year!2016.!
!• Earnings*per*Share:!For!fiscal!year!2017,!the!company!expects!diluted!earnings!per!share!to!be!
in!the!range!of!$1.95!to!$2.05,!which!includes!the!estimated!negative!impact!of!approximately!
$0.09!due!to!foreign!currency!fluctuations!at!current!exchange!rates.!This!impact!equates!to!
approximately!5!percentage!points!of!earnings!per!share!growth!when!compared!with!the!
company’s!adjusted!diluted!earnings!per!share!of!$2.02!for!fiscal!year!2016.!!!
The!company!also!noted!that!comparable!sales!for!fiscal!year!2017!are!expected!to!be!flat!to!up!
slightly.!Net!sales!are!expected!to!be!slightly!below!this!range!driven!by!an!expected!negative!
impact!from!foreign!currency!fluctuations!yearOoverOyear.!!
!
The!company!noted!that!it!expects!its!reported!diluted!earnings!per!share!for!the!first!half!of!
fiscal!year!2017!to!be!down!in!the!high!single!digits!when!compared!with!the!adjusted!diluted!
earnings!per!share!for!the!first!half!of!fiscal!year!2016.!
• Effective*Tax*Rate:!For!fiscal!year!2017,!the!company!expects!the!effective!tax!rate!to!be!about!
39!percent.!
• Inventory:!The!company!expects!total!inventory!to!be!down!in!the!low!single!digits!at!the!end!of!
the!first!half!of!fiscal!year!2017!when!compared!with!the!end!of!the!first!half!of!fiscal!year!2016.!!
• Cash*Distribution:!The!company!announced!today!that!its!board!of!directors!authorized!a!first!
quarter!fiscal!year!2017!dividend!of!$0.23!per!share.!
• Capital*Expenditures:!The!company!expects!capital!spending!to!be!approximately!$625!million!
for!fiscal!year!2017,!excluding!an!estimated!$200!million!related!to!rebuilding!of!the!company’s!
Fishkill,!New!York!distribution!center!campus,!which!the!company!expects!will!be!covered!by!
insurance!proceeds.!The!company!noted!that!it!intends!to!dedicate!about!half!of!its!fiscal!year!
2017!capital!spending!on!store!investments,!with!the!remainder!focused!on!transformative!
infrastructure!investments!to!support!its!omniOchannel!and!digital!strategies,!such!as!
information!technology!and!supply!chain.!!
!
• Real*Estate:!In!fiscal!year!2017,!the!company!expects!to!open!about!40!companyOoperated!
stores,!net!of!closures!and!repositions.!In!line!with!its!strategy,!the!company!expects!store!
openings!to!be!focused!on!Athleta!and!Old!Navy!locations,!with!closures!weighted!toward!Gap!
brand.!
$Webcast$and$Conference$Call$Information$Jennifer!Fall,!senior!vice!president!of!Corporate!Finance!and!Investor!Relations!at!Gap!Inc.,!will!host!a!
summary!of!the!company’s!fourth!quarter!and!fiscal!year!2016!results!during!a!conference!call!and!
webcast!from!approximately!2:00!p.m.!to!3:00!p.m.!Pacific!Time!today.!Ms.!Fall!will!be!joined!by!Art!
Peck,!Gap!Inc.!chief!executive!officer,!and!Teri!ListOStoll,!Gap!Inc.!executive!vice!president!and!chief!
financial!officer.!!
!

!
!
!
The!conference!call!can!be!accessed!by!calling!1O855O5000OGPS!or!1O855O500O0477!(participant!passcode:!
3648818).!International!callers!may!dial!913O643O0954.!The!webcast!can!be!accessed!at!
www.gapinc.com!and!fourth!quarter!earnings!call!highlights!can!be!followed!on!Twitter!at!
http://twitter.com/gapinc;!cashtag!$GPS.!
$ForwardVLooking$Statements!This!press!release!and!related!conference!call!and!webcast!contain!forwardOlooking!statements!within!
the!“safe!harbor”!provisions!of!the!Private!Securities!Litigation!Reform!Act!of!1995.!All!statements!other!
than!those!that!are!purely!historical!are!forwardOlooking!statements.!Words!such!as!“expect,”!
“anticipate,”!“believe,”!“estimate,”!“intend,”!“plan,”!“project,”!and!similar!expressions!also!identify!
forwardOlooking!statements.!ForwardOlooking!statements!include!statements!regarding!the!following:!
• earnings!per!share!for!the!first!half!and!full!fiscal!year!2017;!!
• comparable!sales!for!fiscal!year!2017;!!
• net!sales!for!fiscal!year!2017;!!
• effective!tax!rate!for!fiscal!year!2017;!!
• total!inventory!at!the!end!of!the!first!half!of!fiscal!year!2017;!!
• future!dividends;!!
• capital!expenditures!for!fiscal!year!2017;!
• store!openings!in!fiscal!year!2017,!focused!on!Athleta!and!Old!Navy,!net!of!closures,!weighted!
towards!Gap!brand;!!
• returning!excess!cash!to!shareholders;!
• foreign!exchange!impact!in!fiscal!year!2017;!!
• the!impact!of!the!additional!week!in!fiscal!year!2017;!!
• insurance!recovery!for!costs!related!to!the!fire!at!our!Fishkill!distribution!center;!and!!
• share!repurchases!in!fiscal!year!2017.!!
!
Because!these!forwardOlooking!statements!involve!risks!and!uncertainties,!there!are!important!factors!
that!could!cause!the!company’s!actual!results!to!differ!materially!from!those!in!the!forwardOlooking!
statements.!These!factors!include,!without!limitation,!the!following:!
• the!risk!that!adjustments!to!the!company’s!unaudited!financial!statements!may!be!identified!
through!the!course!of!the!company’s!independent!registered!public!accounting!firm!completing!
its!integrated!audit!of!the!company’s!financial!statements!and!financial!controls;!
• the!risk!that!additional!information!may!arise!during!the!company’s!close!process!or!as!a!result!
of!subsequent!events!that!would!require!the!company!to!make!adjustments!to!the!unaudited!
financial!information;!
• the!risk!that!the!adoption!of!new!accounting!pronouncements!will!impact!future!results;!
• the!risk!that!the!company!or!its!franchisees!will!be!unsuccessful!in!gauging!apparel!trends!and!
changing!consumer!preferences;!
• the!risk!that!changes!in!global!economic!conditions!or!consumer!spending!patterns!could!
adversely!impact!the!company’s!results!of!operations;!
• the!highly!competitive!nature!of!the!company’s!business!in!the!United!States!and!
internationally;!

!
!
!
• the!risk!that!if!the!company!is!unable!to!manage!its!inventory!effectively,!its!gross!margins!will!
be!adversely!affected;!
• the!risk!that!the!failure!to!attract!and!retain!key!personnel,!or!effectively!manage!succession,!
could!have!an!adverse!impact!on!the!company’s!results!of!operations;!
• the!risk!that!the!company!is!subject!to!data!or!other!security!breaches!that!may!result!in!
increased!costs,!violations!of!law,!significant!legal!and!financial!exposure,!and!a!loss!of!
confidence!in!the!company’s!security!measures,!which!could!have!an!adverse!effect!on!the!
company’s!results!of!operations!and!reputation;!
• the!risks!to!the!company’s!efforts!to!expand!internationally,!including!its!ability!to!operate!
under!a!global!brand!structure!and!operating!in!regions!where!it!has!less!experience;!
• the!risk!that!foreign!currency!exchange!rate!fluctuations!could!adversely!impact!the!company’s!
financial!results;!!
• the!risks!to!the!company’s!business,!including!its!costs!and!supply!chain,!associated!with!global!
sourcing!and!manufacturing;!
• the!risks!to!the!company’s!reputation!or!operations!associated!with!importing!merchandise!
from!foreign!countries,!including!failure!of!the!company’s!vendors!to!adhere!to!its!Code!of!
Vendor!Conduct;!
• the!risk!that!trade!matters!could!increase!the!cost!or!reduce!the!supply!of!apparel!available!to!
the!company!and!adversely!affect!its!business,!financial!condition,!and!results!of!operations;!
• the!risk!that!the!company’s!franchisees’!operation!of!franchise!stores!is!not!directly!within!the!
company’s!control!and!could!impair!the!value!of!its!brands;!
• the!risk!that!the!company!or!its!franchisees!will!be!unsuccessful!in!identifying,!negotiating,!and!
securing!new!store!locations!and!renewing,!modifying,!or!terminating!leases!for!existing!store!
locations!effectively;!
• the!risk!that!the!company’s!investments!in!omniOchannel!shopping!initiatives!may!not!deliver!
the!results!the!company!anticipates;!
• the!risk!that!comparable!sales!and!margins!will!experience!fluctuations;!
• the!risk!that!changes!in!the!company’s!credit!profile!or!deterioration!in!market!conditions!may!
limit!the!company’s!access!to!the!capital!markets!and!adversely!impact!its!financial!results!or!
business!initiatives;!
• the!risk!that!updates!or!changes!to!the!company’s!information!technology!systems!may!disrupt!
its!operations;!
• the!risk!that!failure!to!maintain,!enhance!and!protect!the!company’s!brand!image!could!have!an!
adverse!effect!on!its!results!of!operations;!!
• the!risk!that!natural!disasters,!public!health!crises,!political!crises,!or!other!catastrophic!events!
could!adversely!affect!the!company’s!operations!and!financial!results,!or!those!of!its!franchisees!
or!vendors;!
• the!risk!that!changes!in!the!regulatory!or!administrative!landscape!could!adversely!affect!the!
company’s!financial!condition,!strategies,!and!results!of!operations;!
• the!risk!that!the!company!does!not!repurchase!some!or!all!of!the!shares!it!anticipates!
purchasing!pursuant!to!its!repurchase!program;!and!
• the!risk!that!the!company!will!not!be!successful!in!defending!various!proceedings,!lawsuits,!
disputes,!claims,!and!audits.!
!

!
!
!
Additional!information!regarding!factors!that!could!cause!results!to!differ!can!be!found!in!the!company’s!
Annual!Report!on!Form!10OK!for!the!fiscal!year!ended!January!30,!2016,!as!well!as!the!company’s!
subsequent!filings!with!the!Securities!and!Exchange!Commission.!!
!
These!forwardOlooking!statements!are!based!on!information!as!of!February!23,!2017.!The!company!
assumes!no!obligation!to!publicly!update!or!revise!its!forwardOlooking!statements!even!if!experience!or!
future!changes!make!it!clear!that!any!projected!results!expressed!or!implied!therein!will!not!be!realized.!
$About$Gap$Inc.$$Gap!Inc.!is!a!leading!global!retailer!offering!clothing,!accessories,!and!personal!care!products!for!men,!
women,!and!children!under!the!Gap,!Banana!Republic,!Old!Navy,!Athleta,!and!Intermix!brands.!Fiscal!
year!2016!net!sales!were!$15.5!billion.!Gap!Inc.!products!are!available!for!purchase!in!more!than!90!
countries!worldwide!through!about!3,200!companyOoperated!stores,!about!450!franchise!stores,!and!eO
commerce!sites.!For!more!information,!please!visit!www.gapinc.com.!
!
Investor$Relations$Contact:$$Tina!Romani!
(415)!427O5264!
!!
Media$Relations$Contact:$$Jennifer!Poppers!
(415)!427O1729!!
!

The Gap, Inc.CONDENSED CONSOLIDATED BALANCE SHEETSUNAUDITED
($ in millions)January 28,
2017January 30,
2016ASSETSCurrent assets: Cash and cash equivalents 1,783$ 1,370$ Merchandise inventory 1,830 1,873 Other current assets 702 742 Total current assets 4,315 3,985 Property and equipment, net 2,616 2,850 Other long-term assets 679 638 Total assets 7,610$ 7,473$
LIABILITIES AND STOCKHOLDERS' EQUITYCurrent liabilities: Current maturities of debt 65$ 421$ Accounts payable 1,243 1,112 Accrued expenses and other current liabilities 1,113 979 Income taxes payable 32 23 Total current liabilities 2,453 2,535 Long-term liabilities: Long-term debt 1,248 1,310 Lease incentives and other long-term liabilities 1,005 1,083 Total long-term liabilities 2,253 2,393 Total stockholders' equity 2,904 2,545 Total liabilities and stockholders' equity 7,610$ 7,473$

The Gap, Inc.CONDENSED CONSOLIDATED STATEMENTS OF INCOMEUNAUDITED
($ and shares in millions except per share amounts)January 28,
2017January 30,
2016January 28,
2017January 30,
2016Net sales 4,429$ 4,385$ 15,516$ 15,797$ Cost of goods sold and occupancy expenses 2,928 2,945 9,876 10,077 Gross profit 1,501 1,440 5,640 5,720 Operating expenses 1,200 1,085 4,449 4,196 Operating income 301 355 1,191 1,524 Interest, net 16 15 67 53 Income before income taxes 285 340 1,124 1,471 Income taxes 65 126 448 551 Net income 220$ 214$ 676$ 920$
Weighted-average number of shares - basic 399 400 399 411 Weighted-average number of shares - diluted 401 402 400 413
Earnings per share - basic 0.55$ 0.54$ 1.69$ 2.24$ Earnings per share - diluted 0.55$ 0.53$ 1.69$ 2.23$
13 Weeks Ended 52 Weeks Ended

The Gap, Inc.CONDENSED CONSOLIDATED STATEMENTS OF CASH FLOWSUNAUDITED
($ in millions)January 28,
2017January 30,
2016Cash flows from operating activities:Net income 676$ 920$ Depreciation and amortization (a) 531 527 Change in merchandise inventory 46 (6) Other, net 466 153 Net cash provided by operating activities 1,719 1,594
Cash flows from investing activities:Purchases of property and equipment (524) (726) Other (5) (4) Net cash used for investing activities (529) (730)
Cash flows from financing activities: Proceeds from issuance of short-term debt - 400 Payments of short-term debt (400) - Payments of long-term debt (21) (21)
29 65 (19) (69)
Repurchases of common stock - (1,015) Excess tax benefit from exercise of stock options and vesting of stock units 1 28 Cash dividends paid (367) (377) Other - (1) Net cash used for financing activities (777) (990)
Effect of foreign exchange rate fluctuations on cash and cash equivalents - (19) Net increase (decrease) in cash and cash equivalents 413 (145) Cash and cash equivalents at beginning of period 1,370 1,515 Cash and cash equivalents at end of period 1,783$ 1,370$
(a) Depreciation and amortization is net of amortization of lease incentives.
Proceeds from issuances under share-based compensation plans
52 Weeks Ended
Withholding tax payments related to vesting of stock units

The Gap, Inc.NON-GAAP FINANCIAL MEASURESUNAUDITED
($ in millions)January 28,
2017January 30,
2016Net cash provided by operating activities 1,719$ 1,594$ Less: Purchases of property and equipment (524) (726) Free cash flow 1,195$ 868$
FREE CASH FLOW
Free cash flow is a non-GAAP financial measure. We believe free cash flow is an important metric because it represents a measure of how much cash a company has available for discretionary and non-discretionary items after the deduction of capital expenditures, as we require regular capital expenditures to build and maintain stores and purchase new equipment to improve our business. We use this metric internally, as we believe our sustained ability to generate free cash flow is an important driver of value creation. However, this non-GAAP financial measure is not intended to supersede or replace our GAAP results.
52 Weeks Ended

The Gap, Inc.NON-GAAP FINANCIAL MEASURESUNAUDITED
($ in millions)
13 Weeks Ended January 28, 2017 Operating Expenses Operating Expenses as a % of Net
Sales Operating expenses, as reported 1,200$ 27.1%Less: Fiscal year 2016 restructuring costs (a) (26) (0.6)%Less: Goodwill impairment charge (b) (71) (1.6)%Add: Gain from insurance proceeds (c) 73 1.7%Adjusted operating expenses 1,176$ 26.6%
($ in millions)
13 Weeks Ended January 30, 2016 Operating Expenses Operating Expenses as a % of Net
Sales Operating expenses, as reported 1,085$ 24.7%Less: Fiscal year 2015 strategic actions (d) (19) (0.4)%Adjusted operating expenses 1,066$ 24.3%
($ in millions)
52 Weeks Ended January 28, 2017 Operating Expenses Operating Expenses as a % of Net
Sales Operating expenses, as reported 4,449$ 28.7%Less: Fiscal year 2016 restructuring costs (a) (197) (1.3)%Less: Goodwill impairment charge (b) (71) (0.5)%Add: Gain from insurance proceeds (c) 73 0.5%Adjusted operating expenses 4,254$ 27.4%
($ in millions)
52 Weeks Ended January 30, 2016 Operating Expenses Operating Expenses as a % of Net
Sales Operating expenses, as reported 4,196$ 26.6%Less: Fiscal year 2015 strategic actions (d) (98) (0.7)%Adjusted operating expenses 4,098$ 25.9%
______________________________
(b) Represents the goodwill impairment charge related to Intermix.
(c) Represents the gain from insurance proceeds related to the fire that occurred in one of the buildings at a Company-owned distribution center campus in Fishkill, New York.
(d) Represents the costs recorded in operating expenses associated with the fiscal year 2015 strategic actions primarily related to Gap brand and impact on percentage of net sales. The costs primarily include lease termination fees, store asset impairments, and employee related costs.
ADJUSTED OPERATING EXPENSES
The following adjusted operating expenses are non-GAAP financial measures. These measures are provided to enhance visibility into the company's underlying operating expenses for the periods excluding the impact of the following charges for fiscal year 2016: restructuring costs, goodwill impairment charge, and gain from insurance proceeds, and excluding the impact of strategic actions primarily related to Gap brand for fiscal year 2015. Management believes the adjusted metrics are useful for the assessment of ongoing operations as we believe the adjusted items are not indicative of our ongoing operations due to the nature of the charges, and management believes that the presentation of adjusted financial information provides additional information to investors to facilitate the comparison of results against prior years. However, these non-GAAP financial measures are not intended to supersede or replace the GAAP measures.
(a) Represents the restructuring costs recorded in operating expenses related to fiscal year 2016 store closures and streamlining the company's operations and impact on percentage of net sales. The costs primarily include lease termination fees, store asset impairments, and employee related costs.

The Gap, Inc.NON-GAAP FINANCIAL MEASURESUNAUDITED
($ in millions)
January 28, 2017
January 30, 2016
January 28, 2017
January 30, 2016
Net income, as reported 220$ 214$ 676$ 920$ Add: Fiscal year 2016 restructuring costs (a) 18 - 197 - Add: Fiscal year 2015 strategic actions (b) - 25 - 132 Less: Tax benefit related to restructuring costs and strategic actions (c) (6) (9) (76) (50) Add: Incremental tax expenses related to fiscal year 2016 restructuring costs (d) 2 - 41 - Add: Goodwill impairment charge (e) 71 - 71 - Less: Gain from insurance proceeds (f) (73) - (73) - Add: Tax expense related to gain from insurance proceeds (g) 28 - 28 - Add: Tax impact of a legal structure realignment (h) (57) - (57) - Adjusted net income 203$ 230$ 807$ 1,002$
____________________
(h) Represents the favorable income tax impact of a legal structure realignment.
(g) Represents the tax impact of the gain from insurance proceeds, calculated at the adjusted effective tax rate, related to the fire that occurred in one of the buildings at a Company-owned distribution center campus in Fishkill, New York.
52 Weeks Ended
Adjusted net income is a non-GAAP financial measure. Adjusted net income is provided to enhance visibility into the company's underlying results for the periods excluding the impact of the following charges for fiscal year 2016: restructuring costs, goodwill impairment charge, gain from insurance proceeds, and the tax impact of a legal structure realignment, and excluding the impact of strategic actions primarily related to Gap brand for fiscal year 2015. Management believes the adjusted metrics are useful for the assessment of ongoing operations as we believe the adjusted items are not indicative of our ongoing operations due to the nature of the charges, and management believes that the presentation of adjusted financial information provides additional information to investors to facilitate the comparison of results against prior years. Additionally, management uses adjusted net income as a key performance measure for the purposes of evaluating performance internally. However, this non-GAAP financial measure is not intended to supersede or replace the GAAP measure.
ADJUSTED NET INCOME
(e) Represents the goodwill impairment charge related to Intermix, which is not deductible for tax purposes.
(d) Represents the incremental tax expenses related to fiscal year 2016 restructuring costs.
13 Weeks Ended
(a) Represents the restructuring costs incurred related to fiscal year 2016 store closures and streamlining the company's operations, and primarily include lease termination fees, store asset impairments, and employee related costs. $26 million was recorded in operating expenses and $8 million of credit, net, was recorded in cost of goods sold and occupancy expenses during the fourth quarter of fiscal year 2016, and $197 million was recorded in operating expenses and $0 million of credit, net, was recorded in cost of goods sold and occupancy expenses during fiscal year 2016.
(b) Represents the costs associated with the fiscal year 2015 strategic actions primarily related to Gap brand, and primarily include inventory impairment, lease termination fees, store asset impairments, and employee related costs. $19 million was recorded in operating expenses and $6 million was recorded in cost of goods sold and occupancy expenses during the fourth quarter of fiscal year 2015 and $98 million was recorded in operating expenses and $34 million was recorded in cost of goods sold and occupancy expenses during fiscal year 2015.
(c) The amount of tax benefit associated with the fiscal year 2016 restructuring costs is calculated using the adjusted effective tax rate. The amount of tax benefit associated with the fiscal year 2015 strategic actions is calculated using the reported effective tax rate.
(f) Represents the gain from insurance proceeds related to the fire that occurred in one of the buildings at a Company-owned distribution center campus in Fishkill, New York.
The Gap, Inc.NON-GAAP FINANCIAL MEASURESUNAUDITED
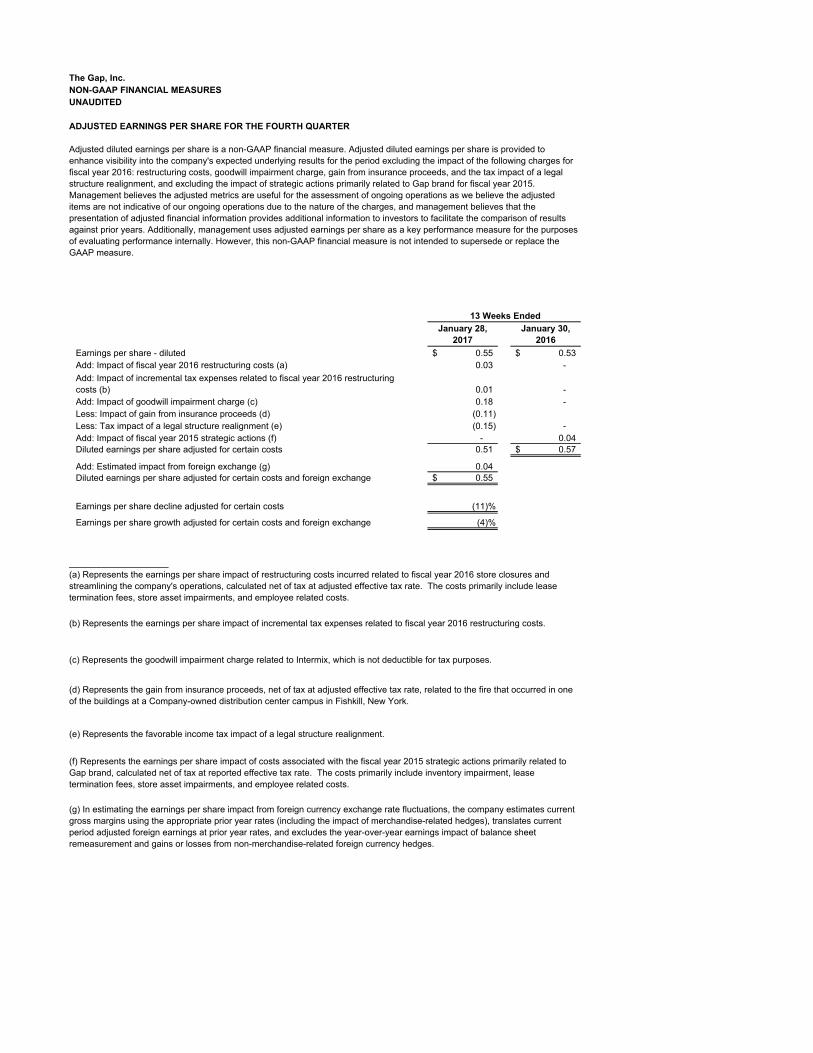
January 28, 2017
January 30, 2016
Earnings per share - diluted 0.55$ 0.53$ Add: Impact of fiscal year 2016 restructuring costs (a) 0.03 - Add: Impact of incremental tax expenses related to fiscal year 2016 restructuring costs (b) 0.01 - Add: Impact of goodwill impairment charge (c) 0.18 - Less: Impact of gain from insurance proceeds (d) (0.11) Less: Tax impact of a legal structure realignment (e) (0.15) - Add: Impact of fiscal year 2015 strategic actions (f) - 0.04 Diluted earnings per share adjusted for certain costs 0.51 0.57$
Add: Estimated impact from foreign exchange (g) 0.04 Diluted earnings per share adjusted for certain costs and foreign exchange 0.55$
Earnings per share decline adjusted for certain costs (11)%
Earnings per share growth adjusted for certain costs and foreign exchange (4)%
____________________
(c) Represents the goodwill impairment charge related to Intermix, which is not deductible for tax purposes.
ADJUSTED EARNINGS PER SHARE FOR THE FOURTH QUARTER
Adjusted diluted earnings per share is a non-GAAP financial measure. Adjusted diluted earnings per share is provided to enhance visibility into the company's expected underlying results for the period excluding the impact of the following charges for fiscal year 2016: restructuring costs, goodwill impairment charge, gain from insurance proceeds, and the tax impact of a legal structure realignment, and excluding the impact of strategic actions primarily related to Gap brand for fiscal year 2015. Management believes the adjusted metrics are useful for the assessment of ongoing operations as we believe the adjusted items are not indicative of our ongoing operations due to the nature of the charges, and management believes that the presentation of adjusted financial information provides additional information to investors to facilitate the comparison of results against prior years. Additionally, management uses adjusted earnings per share as a key performance measure for the purposes of evaluating performance internally. However, this non-GAAP financial measure is not intended to supersede or replace the GAAP measure.
13 Weeks Ended
(a) Represents the earnings per share impact of restructuring costs incurred related to fiscal year 2016 store closures and streamlining the company's operations, calculated net of tax at adjusted effective tax rate. The costs primarily include lease termination fees, store asset impairments, and employee related costs.
(b) Represents the earnings per share impact of incremental tax expenses related to fiscal year 2016 restructuring costs.
(d) Represents the gain from insurance proceeds, net of tax at adjusted effective tax rate, related to the fire that occurred in one of the buildings at a Company-owned distribution center campus in Fishkill, New York.
(e) Represents the favorable income tax impact of a legal structure realignment.
(f) Represents the earnings per share impact of costs associated with the fiscal year 2015 strategic actions primarily related to Gap brand, calculated net of tax at reported effective tax rate. The costs primarily include inventory impairment, lease termination fees, store asset impairments, and employee related costs.
(g) In estimating the earnings per share impact from foreign currency exchange rate fluctuations, the company estimates current gross margins using the appropriate prior year rates (including the impact of merchandise-related hedges), translates current period adjusted foreign earnings at prior year rates, and excludes the year-over-year earnings impact of balance sheet remeasurement and gains or losses from non-merchandise-related foreign currency hedges.
The Gap, Inc.NON-GAAP FINANCIAL MEASURESUNAUDITED
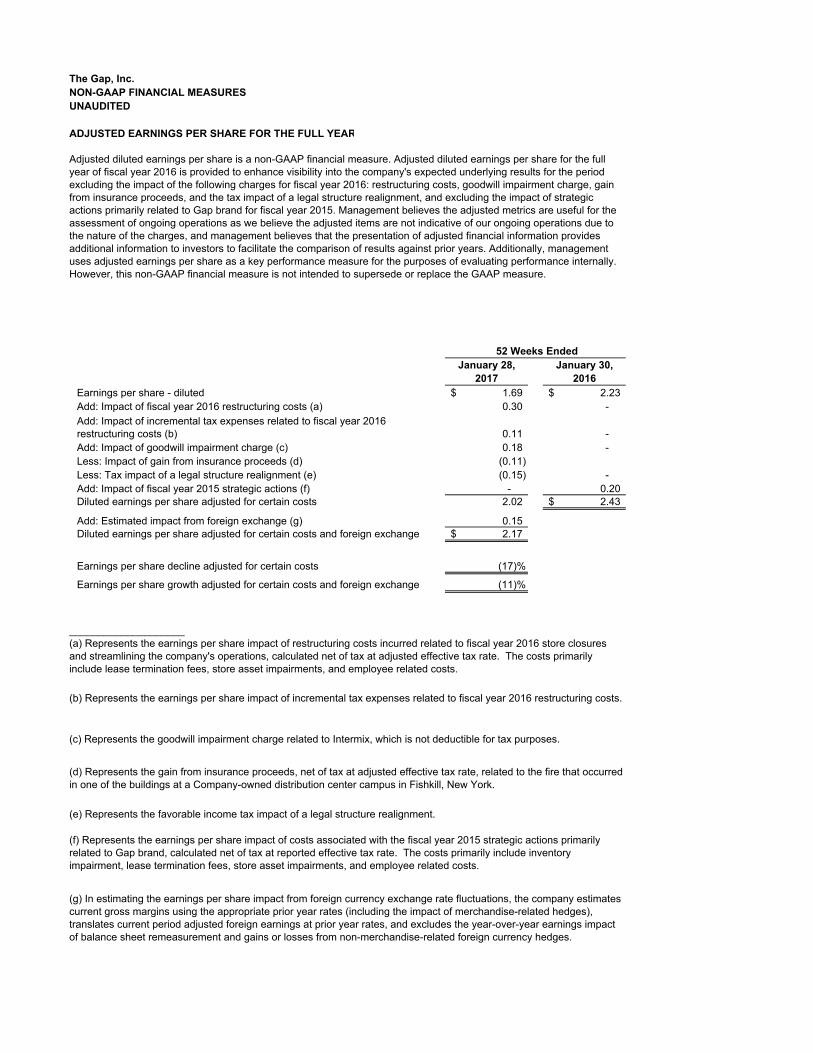
January 28, 2017
January 30, 2016
Earnings per share - diluted 1.69$ 2.23$ Add: Impact of fiscal year 2016 restructuring costs (a) 0.30 - Add: Impact of incremental tax expenses related to fiscal year 2016 restructuring costs (b) 0.11 - Add: Impact of goodwill impairment charge (c) 0.18 - Less: Impact of gain from insurance proceeds (d) (0.11) Less: Tax impact of a legal structure realignment (e) (0.15) - Add: Impact of fiscal year 2015 strategic actions (f) - 0.20 Diluted earnings per share adjusted for certain costs 2.02 2.43$
Add: Estimated impact from foreign exchange (g) 0.15 Diluted earnings per share adjusted for certain costs and foreign exchange 2.17$
Earnings per share decline adjusted for certain costs (17)%
Earnings per share growth adjusted for certain costs and foreign exchange (11)%
____________________
(e) Represents the favorable income tax impact of a legal structure realignment.
(f) Represents the earnings per share impact of costs associated with the fiscal year 2015 strategic actions primarily related to Gap brand, calculated net of tax at reported effective tax rate. The costs primarily include inventory impairment, lease termination fees, store asset impairments, and employee related costs.
(g) In estimating the earnings per share impact from foreign currency exchange rate fluctuations, the company estimates current gross margins using the appropriate prior year rates (including the impact of merchandise-related hedges), translates current period adjusted foreign earnings at prior year rates, and excludes the year-over-year earnings impact of balance sheet remeasurement and gains or losses from non-merchandise-related foreign currency hedges.
(c) Represents the goodwill impairment charge related to Intermix, which is not deductible for tax purposes.
(d) Represents the gain from insurance proceeds, net of tax at adjusted effective tax rate, related to the fire that occurred in one of the buildings at a Company-owned distribution center campus in Fishkill, New York.
ADJUSTED EARNINGS PER SHARE FOR THE FULL YEAR
Adjusted diluted earnings per share is a non-GAAP financial measure. Adjusted diluted earnings per share for the full year of fiscal year 2016 is provided to enhance visibility into the company's expected underlying results for the period excluding the impact of the following charges for fiscal year 2016: restructuring costs, goodwill impairment charge, gain from insurance proceeds, and the tax impact of a legal structure realignment, and excluding the impact of strategic actions primarily related to Gap brand for fiscal year 2015. Management believes the adjusted metrics are useful for the assessment of ongoing operations as we believe the adjusted items are not indicative of our ongoing operations due to the nature of the charges, and management believes that the presentation of adjusted financial information provides additional information to investors to facilitate the comparison of results against prior years. Additionally, management uses adjusted earnings per share as a key performance measure for the purposes of evaluating performance internally. However, this non-GAAP financial measure is not intended to supersede or replace the GAAP measure.
52 Weeks Ended
(a) Represents the earnings per share impact of restructuring costs incurred related to fiscal year 2016 store closures and streamlining the company's operations, calculated net of tax at adjusted effective tax rate. The costs primarily include lease termination fees, store asset impairments, and employee related costs.
(b) Represents the earnings per share impact of incremental tax expenses related to fiscal year 2016 restructuring costs.

The Gap, Inc.NET SALES RESULTSUNAUDITED
The following table details the company’s fourth quarter and fiscal year 2016 net sales (unaudited):
($ in millions)
U.S. (1) 910$ 1,716$ 596$ 223$ 3,445 78%Canada 104 132 64 1 301 7%Europe 177 - 14 - 191 4%Asia 359 49 29 - 437 10%Other regions 29 21 5 - 55 1%Total 1,579$ 1,918$ 708$ 224$ 4,429$ 100%
($ in millions)
U.S. (1) 935$ 1,635$ 613$ 201$ 3,384 77%Canada 97 123 62 1 283 7%Europe 204 - 17 - 221 5%Asia 360 52 32 - 444 10%Other regions 31 15 7 - 53 1%Total 1,627$ 1,825$ 731$ 202$ 4,385$ 100%
($ in millions)
U.S. (1) 3,113$ 6,051$ 2,052$ 773$ 11,989$ 77%Canada 368 490 223 3 1,084 7%Europe 630 - 59 - 689 5%Asia 1,215 220 109 - 1,544 10%Other regions 129 53 28 - 210 1%Total 5,455$ 6,814$ 2,471$ 776$ 15,516$ 100%
($ in millions)
U.S. (1) 3,303$ 5,987$ 2,211$ 712$ 12,213$ 77%Canada 348 467 229 3 1,047 7%Europe 726 - 71 - 797 5%Asia 1,215 194 112 - 1,521 10%Other regions 159 27 33 - 219 1%Total 5,751$ 6,675$ 2,656$ 715$ 15,797$ 100%
(1) U.S. includes the United States, Puerto Rico, and Guam. (2) Includes Athleta and Intermix.(3) Includes Athleta, Intermix, and beginning in the fourth quarter of fiscal 2016, Weddington Way.(4) Includes Athleta, Intermix, and Piperlime, which was discontinued as of the first quarter of fiscal 2015.
TotalPercentage of Net
Sales52 Weeks Ended January 28, 2017
Total
52 Weeks Ended January 30, 2016 Gap GlobalOld Navy
Global
13 Weeks Ended January 30, 2016
Gap GlobalOld Navy
GlobalBanana
Republic Global Other (3)
BananaRepublic Global
TotalPercentage of Net
Sales13 Weeks Ended January 28, 2017
Gap GlobalOld Navy
GlobalBanana
Republic Global Other (2)
Gap GlobalOld Navy
GlobalBanana
Republic Global Other (3)
Other (4) TotalPercentage of Net
Sales
Percentage of Net Sales

The Gap, Inc.REAL ESTATE
Store count, openings, closings, and square footage for our stores are as follows:
Gap North America 858 3 17 844 8.8 Gap Asia 315 9 13 311 3.0 Gap Europe 166 1 3 164 1.4 Old Navy North America 1,039 8 4 1,043 17.4 Old Navy Asia 60 - 47 13 0.2 Banana Republic North America 612 2 13 601 5.0 Banana Republic Asia 49 - 1 48 0.2 Banana Republic Europe 10 - 9 1 - Athleta North America 130 2 - 132 0.6 Intermix North America 42 1 - 43 0.1 Company-operated stores total 3,281 26 107 3,200 36.7 Franchise 461 4 6 459 N/ATotal 3,742 30 113 3,659 36.7
13 Weeks Ended January 28, 2017Store Locations Beginning of Q4
Store Locations Opened
Store Locations Closed
Store Locations End of Q4
Square Feet (millions)