gps-gis based soil fertility maps of chandgad tehsil of
TRANSCRIPT

~ 343 ~
International Journal of Chemical Studies 2020; 8(1): 343-349
P-ISSN: 2349–8528 E-ISSN: 2321–4902
IJCS 2020; 8(1): 343-349
© 2020 IJCS
Received: 04-11-2019
Accepted: 06-12-2019
C Mukesh Kumar
Division of Soil Science and
Agricultural Chemistry,
Mahatma Phule Krishi
Vidyapeeth, College of
Agriculture, Kolhapur,
Maharashtra, India
RV Kulkarni
Division of Soil Science and
Agricultural Chemistry,
Mahatma Phule Krishi
Vidyapeeth, College of
Agriculture, Kolhapur,
Maharashtra, India
RB Pawar
Division of Soil Science and
Agricultural Chemistry,
Mahatma Phule Krishi
Vidyapeeth, College of
Agriculture, Kolhapur,
Maharashtra, India
B Ushasri
Division of Soil Science and
Agricultural Chemistry,
Mahatma Phule Krishi
Vidyapeeth, College of
Agriculture, Kolhapur,
Maharashtra, India
Corresponding Author:
C Mukesh Kumar
Division of Soil Science and
Agricultural Chemistry,
Mahatma Phule Krishi
Vidyapeeth, College of
Agriculture, Kolhapur,
Maharashtra, India
GPS-GIS based soil fertility maps of Chandgad
tehsil of Kolhapur district (M.S.)
C Mukesh Kumar, RV Kulkarni, RB Pawar and B Ushasri
DOI: https://doi.org/10.22271/chemi.2020.v8.i1e.8269 Abstract
The study was carried out to know the fertility status of soils of Chandgad tehsil, of Kolhapur district by
using GPS-GIS technology and to correlate soil properties with the available nutrient status and also to
evaluate the fertility index of Chandgad tehsil during the year 2015-2016.
The pH of soils of Chandgad tehsil varied from 5.01to 7.21, most of the soils were found to be
moderately acidic (57.15%) while EC varied from 0.04 to 0.70 dS m-1, the soilswere found to be normal
(100 %) in salinity. The Calcium Carbonate content of soils of Chandgad tehsil varied from 0.51 to 3.07
per cent, the area was barely calcareous (33.77%), slightly calcareous (50%) and moderately calcareous
(16.23%). Organic Carbon content varied from 0.31 to 1.12 per cent and categorized as low (24.02%),
moderate (24.03%), moderately high (21.42%), high (19.50%) and very high (11.03%).
The soil available Nitrogen, Phosphorus and Potassium in Chandgad tehsil ranged from 143.21 to 420.26,
1.03 to 20.6 and 102.8 to 293.6 Kg ha-1, respectively. The soils were low (35.71%) and moderate
(64.29%) in available Nitrogen. In respect of available Phosphorus very low (40.26%) low (46.75%) and
moderate (12.99%). In case of available Potassium low (24.68%), moderate (9.74%), moderately high
(36.36%) and high (29.22%). The exchangeable Calcium and Magnesium ranged from 10.00 to 25.00
and 2.25 to 12.50 cmol (p+) Kg-1, respectively. The soils were sufficient (25.32%), deficient (74.68%)
and sufficient (13.63%), deficient (86.37%) in exchangeable Calcium and Magnesium, respectively. The
exchangeable sodium ranged from 0.13 to 0.97 cmol (p+) Kg-1.
The available sulphur varied from 5.12 to 35.93 mg Kg-1. The soils were low (26.62%), moderate
(22.73%), moderately high (23.38%) and high (27.27%) in available Sulphur content.
The pH was significantly and positively correlated with exchangeable Calcium and Magnesium. EC was
non-significant and positively correlated with Nitrogen, Phosphorus, Calcium, Magnesium, Sodium and
Manganese. The organic carbon was significantly and positively correlated with Nitrogen, Phosphorus,
Potassium and Sulphur. Calcium carbonate was significantly correlated with calcium, magnesium and
Sulphur.
The fertility index of Chandgad tehsil for Organic Carbon, available Nitrogen, Phosphorus and Potassium
was medium (2.02), low (1.32), low (0.86) and medium (1.85), respectively.
Keywords: Chandgad tehsil, GPS-GIS technology, soil fertility maps
Introduction
The advanced technologies like GIS and global Positioning System (GPS) thus have much
more importance for preparing soil fertility maps. Soil physical and chemical properties vary
within a single field. Spatial tools like Global Positioning System (GPS) and Geographic
Information System (GIS) for analyzing and storing spatial data can help us to make better
decisions in particular land development for agriculture environmental protection and
restoration. In precision agriculture, farmer’s use GPS and GIS as yield monitors and variable
technology to apply appropriate quantities of input in different parts of field. Land use
planners and developers use GPS and GIS to assess soil protection of ground and surface water
and wetlands.
GPS is a based system location on consultation with about 24 satellites orbiting the earth at
every 12 hours. The distance of an orbiting satellite is approximately 11,000 miles from the
earth’s surface. GPS was developed by the United States, Departments of Defense (DOD) for
its tremendous application as a military for locating object.
~ 344 ~
International Journal of Chemical Studies http://www.chemijournal.com
Materials and Methods
Chandgad tehsil of Kolhapur district was selected to assess
the soil macro and micro nutrient status and delineate the
fertility map, 77 villages were selected randomly in such a
way that itCovers the whole area of the tehsil. One hundred
and fifty four representative soil samples were collected from
sixty six villages of Chandgad tehsil along with GPS reading.
Collection and processing of soil samples
Seventy seven villages from Chandgad tehsil were selected
for sampling keeping in mind to avoid overcrowding of
sampling site on GPS based soil fertility map. Geo-referenced
surface (0-22.5) cm soil samples from each selected villages
representing different soils were collected. The latitude and
longitude of sampling sites were recorded with the help of
differential Global Positioning system with detailed
observation on cropping pattern and fertilizer use. The soil
samples were collected with the help of wooden peg. The
samples were air dried and ground using wooden mortar and
pestle and passed through 2.0 and 0.5 mm sieves. The sieved
soil samples were stored in cloth bags with proper labeling for
subsequent analysis. The soils were analyzed for different
parameters.
The pHwas measured by in 1:2.5 soil water suspension using
glass electrode pH meter and EC (dS-1m) was measured in the
supernatant solution of 1:2.5 soil water suspension using
conductivity meter (Jackson, 1973) [3]. Organic carbon by wet
oxidation method (Nelson and Sommers1982) [9]. Available
Nitrogen was estimated by alkaline permanganate method of
Subbiah and Asija (1956) [16] available phosphorus was
extracted with 0.5 M NaHCO3 solution buffered at pH-8.5
Watanabe and Olsen (1965) [18] and Bray I 0.03 N ammonium
fluoride at pH-3.5 (Bray and Kurtz, 1945)[2]. Available
Potassium was estimated by shaking the requisite amount of
soil sample with 1N neutral ammonium Acetate solution at
pH-7.0 (1:5 soil water ratio), (Knudsen and Peterson, 1982) [6]
available and Sulphur was estimated by turbidimetry with
calcium chloride extractable (Williams and Steinbergs, 1959) [19]. The CaCO3 % by Rapid titration method (Piper, 1966) [12]
and Exchangeable CA& Mg by Versenate titration method
(Page et al. 1982) [6].
Results and Discussion
The result of the investigation carried out during the year
2015-2016 with the view to study the GPS-GIS based fertility
status of soils in Chandgad tehsil are presented below-
Nutrient status of soils of chandgad tehsil
The soil samples collected from Chandgad tehsil were
analyzed by adopting standard procedure and the data
pertaining to different parameters was categorized as per the
six tier rating. The data pertaining to pH, Electrical
conductivity, Calcium carbonate, and Organic carbon,
available N, P and K are presented in Table 1 and 2.
Soil reaction (pH)
The pH of the soils in Chandgad tehsil of Kolhapur district
ranged from 5.01 to 7, among the soil samples tested, 24.02
per cent soils were strongly acidic followed by moderately
acidic 57.15 per cent, 14.93 per cent soils were slightly acidic
and 3.90 per cent soils were slightly alkaline in nature with
the mean value 6.02. The lowest soil pH was 5.01 and highest
soil pH was 7.21. The soils were strongly acidic to slightly
alkaline in reaction, the acidic reaction of maximum soils of
the tehsil might be due to sloppy land and undulating
topography, high rainfall leading to leaching losses of bases
from the surface soils and accumulation of iron oxides. The
decomposition of organic residues and application of
nitrogenous fertilizers hasten the soil acidity.Similar nature of
observation for soil pH was also recorded by Kurlapur et al.
(2014) [7] in the soils of Mangroves from western coast of
Maharashtra.
Electrical conductivity (EC)
The EC ranged from 0.04 to 0.70 Ds m-1 with an average
mean value were 0.14 Ds m-1. These observations indicate
that, all the 100 per cent soils were normal, non-saline in
nature and suitable for healthy plant growth. Singh et al.
(2009) [15]. Reported the similar results in Hoshangabad
district of Madhya Pradesh.
The low EC was may be due to low temperature, porous
structure of soil, heavy rainfall, erosion, leaching down
soluble salts
Per cent Calcium Carbonate equivalent content
The per cent calcium carbonate equivalent content in soils of
Chandgad Tehsil of Kolhapur district ranged from 0.51 to
3.07 per cent eqv. Categorized as barely calcareous to
moderately calcareous with the mean value 1.38 per cent. Out
of all the soil samples collected, 33.77 per cent soils were
barely calcareous, 50 per cent soil samples were slightly
calcareous followed by 16.23 per cent soil samples were
moderately calcareous. The low calcium carbonate content
was may be due to low temperature, porous nature of soil,
heavy rainfall, erosion, rapid leaching down of soluble salts
and soils basic cations. The similar results were reported by
Nirwar et al. (2009) [10] in the soils of ahmedpur tehsil of latur
district.
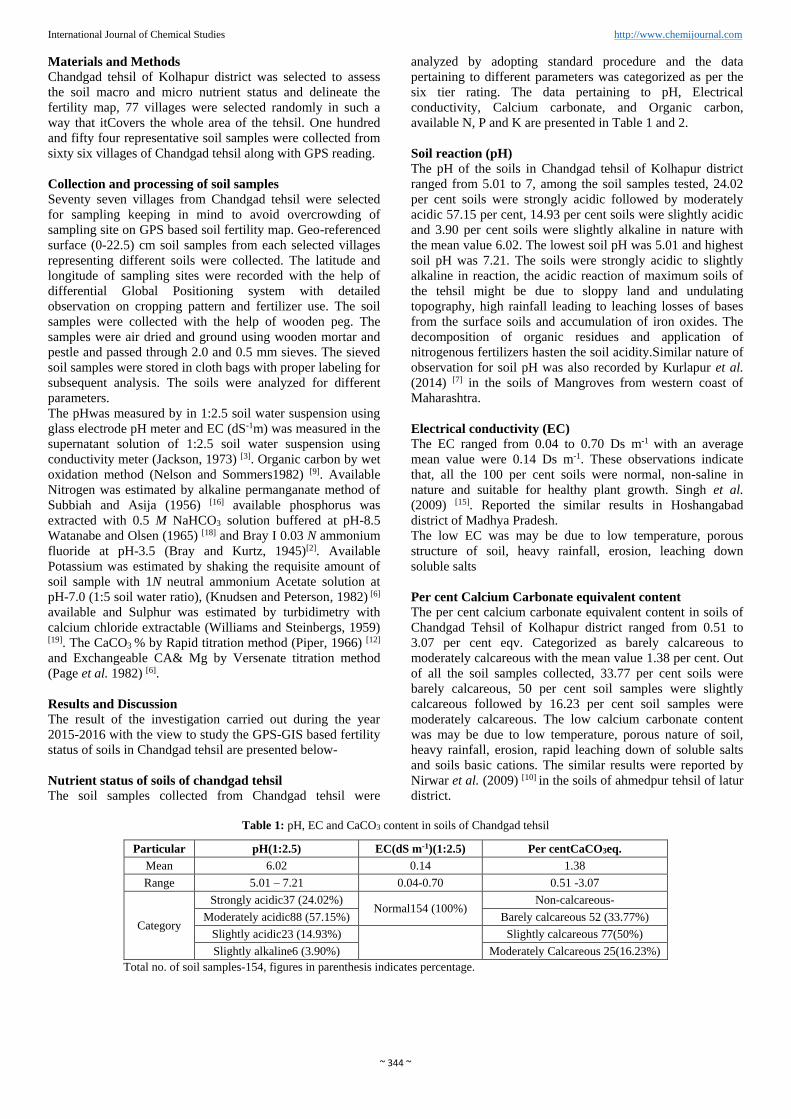
Table 1: pH, EC and CaCO3 content in soils of Chandgad tehsil
Particular pH(1:2.5) EC(dS m-1)(1:2.5) Per centCaCO3eq.
Mean 6.02 0.14 1.38
Range 5.01 – 7.21 0.04-0.70 0.51 -3.07
Category
Strongly acidic37 (24.02%) Normal154 (100%)
Non-calcareous-
Moderately acidic88 (57.15%) Barely calcareous 52 (33.77%)
Slightly acidic23 (14.93%)
Slightly calcareous 77(50%)
Slightly alkaline6 (3.90%) Moderately Calcareous 25(16.23%)
Total no. of soil samples-154, figures in parenthesis indicates percentage.

~ 345 ~
International Journal of Chemical Studies http://www.chemijournal.com
Organic carbon
The organic carbon content of soil ranged from 0.31 to 1.12
per cent, categorized as low to very high with the mean value
0.64per cent (moderately high). Out of all the soil samples
collected from Chandgad tehsil, 24.02% soil samples found
low in organic carbon content, where as 24.03% soils samples
moderate, 21.42% moderately high, 19.50% high and 11.03%
soil samples were very high in organic carbon content. This
might be due to addition of FYM, low temperature, high
rainfall, accumulation and decomposition of leaves, organic
residues and litters. The low organic carbon content in the
soils may be attributed to poor management practices such as
lack of addition of crop residues and organic manures. The
greater organic carbon content in surface soils which was
attributed due to the addition of organic manures and plant
residues to surface soils that resulted in higher organic carbon
content. The similar results were recorded by Jagtap et al.
(2007) [4]. In the soils of chakur and shirur-anantpal tehsil of
later district.
AvailableN
The available nitrogen ranged from 143.21 to 420.26 kg ha-1,
categorized as low to moderate with the mean value 302.44
kg ha-1 (moderate). Medium status of available nitrogen
might be due to liberal crop residue addition to soil. Low
nitrogen status in the soils could be due to low amount of
organic carbon in soils and high rainfall and undulating
topography leads to loss of nitrates by leaching. The similar
results were recorded by Bidariet al. (2008) [8].In soil profiles
of Dharwad, Karnataka.
Available phosphorus
The available phosphorus were ranged from 1.03 to 20.6 kg
ha-1, categorized as very low to moderate with the mean value
8.93 kg ha-1. Low status of available phosphorus in soil might
be due to acidic nature of soil reaction and fixation of
phosphorus in acidic soils with aluminium, iron etc. The
similar results were recorded by Ratnakumari et al. (2006) [13].
Available K
The available potassium in soils of Chandgad tehsil were
ranged from 102.8 to 293.6 kg ha-1. Majority of the soils were
moderately high and high in available potassium. Adequate
available potassium in the soils may be attributed to the
prevalence of potassium rich minerals like illite and feldspar
(Sharma et al.2008) [14]. The similar results were recorded by
Sudharani et al. (2013) [17].
Available sulphur
The available sulphur in the soils ranged from 5.12 to 35.93
mg kg-1 (low to high) with the mean value 16.14 mg kg-1. The
total sulphur in soil was present in organic combination;
therefore soils which are rich in organic matter will have high
level of sulphurand also coarse texture soils havelow amount
of sulphur than fine textured soils due to leaching losses and
adsorption of sulphates on organic matter leads to unavailable
to plants (Kanwar, 1976) [5]. The results indicated that
sufficiency of available sulphur was directly proportional to
organic sulphur content of soil. The similar results were
recorded by Jat and Yadav (2006) in the soils of jaipur district
of Rajasthan.
Table2: Organic carbon and available nitrogen, phosphorus, potassium and sulphur content in soils of Chandgad tehsil
Particular Organic carbon
(%)
Available nutrients (kg ha-1)
N P K S(mg kg-1)
Mean 0.64 302.44 8.93 208.01 16.14
Range 0.31-1.12 143.21 – 420.26 1.03 - 20.6 102.8 - 293.6 5.12– 35.93
Very low - - 62(40.26%) -
Low 37 (24.02%) 55 (35.71%) 72 (46.75%) 38 (24.68%) 41(26.62%)
Moderate 37 (24.03%) 99 (64.29%) 20 (12.99%) 15 (9.74%) 35(22.72%)
Moderately high 33 (21.42%) _ _ 56(36.36%) 36(23.38%)
High 30 (19.50%) _ _ 45 (29.22%) 42(27.28%)
Very high 17 (11.03%) _ _ - _
Total No. of soil samples-154, figures in parenthesis indicates percentage.
Exchangeable calcium
The exchangeable calcium in the soils of Chandgad tehsil
ranged from 10 to 25 [cmol (p+) Kg-1], with the mean value
14.25 [cmol(p+)Kg1]. The deficiency may be due to porous
structure of soil, heavy rainfall, erosion and leaching losses of
basic cations. Mandal et al. (2005) [8] reported similar results
as regards the exchangeable calcium content in soils of
Nagpur district (Maharashtra).

~ 346 ~
International Journal of Chemical Studies http://www.chemijournal.com
Fig 1: Location map of study area
Fig 2: pH of Chandgad tehsil
Fig 3: Avail. K of Chandgad tehsil
Fig 4: Avail. P of Chandgad tehsil

~ 347 ~
International Journal of Chemical Studies http://www.chemijournal.com
Fig 5: OC of Chandgad tehsil
Fig 6: Avail. N of Chandgad tehsil
Fig 7: Mg content in Chandgad tehsil
Fig 8: EC of Chandgad tehsil

~ 348 ~
International Journal of Chemical Studies http://www.chemijournal.com
Fig 9: Ca content of Chandgad tehsil
Fig 10: CaCO3 content of Chandgad tehsil
Fig 11: Avail. S of Chandgad tehsil
The exchangeable magnesium in the soils of tehsil ranged
from 2.25 to 12.5 [cmol (p+) kg-1]. The deficiency may be due
to porous structure of soil, heavy rainfall, erosion, leaching
losses of basic cations and low temperature condition Mandal
et al. (2005) [8] reported similar results as regards
exchangeable magnesium content in soils of Nagpur district
(Maharastra).
From the study, it can be concluded that, the soils of the
Chandgad tehsil were found to be strongly acidic to slightly
alkaline in reaction, normal in salt content indicating that the
soils are free from salinity, low to very high in organic carbon
content and barely calcareous to moderately calcareous in per
cent calcium carbonate equivalent content. Soils of tehsil
were low to moderatein available nitrogen and that indicates
nitrogen is the major limiting nutrient in the soils and also
foundmajority samples were low (46.75%) in available
phosphorus whereaslow (24.68%) to high (29.22%) in
available potassium content. The soils were low (26.62%) to
high (27.28%) in available sulphur and 74.68 and 86.37 per
cent soil samples found deficient in exchangeable calcium and
in exchangeable magnesium content respectively. The maps
generated under the study will be useful for generating
homogenous units and guiding the farmers to decide the
amount and kind of macronutrients to be applied for
optimizing economic returns. The geo-referenced sampling
sites can be revisited with the help of GPS, which helps in
monitoring the changes in the status of nutrients over a period
of time, which otherwise is not possible by traditional
methods of sampling.

~ 349 ~
International Journal of Chemical Studies http://www.chemijournal.com
References
1. Bidari BI, Math KK,Ninganur BT.Physico-chemical
properties and nutrient status of soil profiles producing
varying quality chillies in Dharwad, Karnataka. Asian J
Soil Sci. 2008; 3(2):336-342.
2. Bray RH, Kurtz LT. Determination of total, organic, and
available forms of phosphorus in soils. Soil Science.
1945; 59:39-45.
3. Jackson ML. Soil Chemical Analysis. Prentice Hall of
India Pvt. Ltd., New Delhi. 1973; 256-260.
4. Jagtap VR. Physico-chemical characteristics and status of
NPK and some micronutrients in soils from Chakur and
Shirur-anantpal tehsils of Latur district. M.Sc. (Agri)
Thesis submitted to Marathwada Agriculture University.,
Parbhani. (M.S) India, 2007.
5. Jat, J.R. and Yadav, B.L. 2006. Different forms of
sulphur and their relationship with properties of Entisols
of Jaipur District (Rajasthan) Under Mustard cultivation.
J. Indian Soc. Soil Sci. 54(2): 208-212.
6. Kanwar JS. In soil fertility- Theory and practical. Indian
Council of Agriculture Research, New Delhi, 1976; 202.
7. Knudsen DA, Peterson GA. Lithium, Sodium and
Potassium, In A. L. Page (ed). Method soil analysis
Agronomy monogram No. 9. Am, Soc. AgronIncl, Soil
Sci. Soc. Am. Publ., Madison, Wisconsin, USA. 1982;
225-246.
8. Kurlapkar Shakil D. Shaikh Sediment characteristics of
mangroves from Bhatey and Kalabadevi Estuary,
Maharashtra Int. J Curr. Microbiol. App. Sci. 2014;
3(6):449-453.
9. Mandal AK, Sharma RC. Computerized data base of salt-
affected soils in peninsular India using geographic
information system. J Indian Soc. Soil Sci. 2005;
58(1):05-16.
10. Nelson DW, Sommer LE. Total carbon and organic
matter. In methods of soil analysis, Part – 2, Page,
A.L.(Ed.) Am. Soc. Agron. Inc. Soil Sci. Soc. Am. Inc.
Madison, Wise. USA. 1982; 539-577.
11. Nirwar CV Mali, Wagmare MS. studied physico-
chemical properties from Ahemedpur tehsil of latur
district Asian J Soil Sci. 2009; 4(1):130-134.
12. PageAL. (Ed). Methods of soil analysis Agronomy
Monograph No-9. Pt.2. American Soc. of Agron. Inc.
Soil Sci Soc. of Amer. Inc. Publ. Medison, Wisconsin,
USA, 1982.
13. Piper CS. Soil and plant analysis, Hans publishers
Bombay. 1966; 135-136.
14. Ratna Kumari S, Subbaramamma P,Narisi Reddy A.
Survey on fertility status of cotton growing soils of
Guntur district in Andrapradesh. Indian J Agric. Chem.
2006; (1):17-24.
15. Sharma PK, Sood A, Setia RK, Tur NS, Mehara D, Singh
H.et al. Mapping of micronutrients in soils of Amritsar
district (Punjab) – A GIS approach. J Indian Soc. Soil
Sci. 2008; 56(1):34-41.
16. Singh KN, Abhishek Rathore, Tripathi AK, Subba Rao
A, Salman Khan. 11th ESRI India user conference. 2009;
1-11.
17. Subbiah BV, Asija GL. A rapid procedure for estimation
of available Nitrogen in soil. Current Science. 1956;
25:256-260.
18. Sudharani Y, Jayasree G, SeshaSai MVR. Mapping of
nutrient status of rice soils in Visakhapatnam district
using GIS techniques Asian Journal of Soil Science.
2013; 8:325-329.
19. Watanabe FS, Olsen SR. Test of ascorbic acid methods
for phosphorous in water and sodium bicarbonate extract
of soil.Proc. Soil Sci. Am. 1965; 21:677-678.
20. Williams Steinbergs. Soil Sulphur fractions as chemical
indices of available Sulphur in Australian soils.
Australian Journal of Agriculture Research. 1959;
10:340-35.