gps block iir rubidium atomic frequency ...90th annual precise time and time interual (ptti) meeting...
TRANSCRIPT
90th Annual Precise Time and Time Interual (PTTI) Meeting
GPS BLOCK IIR RUBIDIUM ATOMIC FREQUENCY STANDARD LIFE TEST
R. Beard, J. White, J. Brad, S. Stebbins, J. Smathers, T. Myers U.S. Naval Research Laboratory
F. Danzy, A. Frank, W. h i d SFA, Inc.
J, Buisson Antoine Enterprises
Abstract
The rubidium clocks in the GPS Block ZIR spacecrafl have no prmious flight experience, and will be the only atomic clocks used on the Block IIR satellites. The US. Naval Research Laboratory (NRL),) in cooperation with the Global Positioning System Joint Program OfJice (GPS-JPO), the GPS control Segment, Lockheed Martin, I n , and EGbG, is conducting a three year IiJe-test of two flight qualfied EG&G Rubidium Atomic Frequency Standards (RAFS) selectedfrom the operational spacecraft inventoy. The two RAFS, serial numbers 28 and 30, were selected as representative of the flight conjiguration buildfor Block IIR by ITT and provided by the JPO to NRL for this test. The test is intended to build confidence in these units as operational spacecra3 clocks and establish a database of findamental performance characteristics. The two units are being operated in independent thermal vacuum chambers with high resolution monitoring of the clock's frequency compared to the NRL hydrogen maser references. The units' internal monitors that would normally be sent as telemehy and environmental test conditions are monitored and recorded with high resolution.
Outputfiom one of the two units has been used as input to the NRL Time Keeping System Simulator ( T W . The TKSS was originalb built to evaluate the implementation and algorithms used in the Block IIR on-board Time Keeping System (TKS), which determines the satellite's clock signal to the transmitter. Data @om the TKSS have been used to evaluate TKS on-orbit performance and serve as an analystr reference. RAFS data fiom the beginning of the test on 31 March 1997 to August 1998 and representatfie TKSS data will be presented. Frequency stability results of the RAFS have routinely shown Allan deviation performance in parts in 10 -"'' at one day, much better than initially expected In addition to the data from the two test units, on-orbit data from the Block IIR clock is being added to the database for life data analysis as sutellites are put into service.
INTRODUCTION
The development of the replacement block of satellites for the Global Positioning System (GPS) known as the Block IIR satellites incorporated a different implementation of the on-board frequency standards. Additionally, new frequency standards were introduced that had no actual flight history on which to base performance and lifetime. The Rubidium Atomic Frequency Standards (RAFS) designed and built by the EG&G Optoelectonics Division of Salem, Massachusetts are the frequency standards being used.
The GPS Joint Program Office (PO) initiated a special three-year Life Test to attempt to demonstrate the performance and potential of the RAFS units for GPS. The Naval Research Laboratory (NK) was

Report Documentation Page Form ApprovedOMB No. 0704-0188
Public reporting burden for the collection of information is estimated to average 1 hour per response, including the time for reviewing instructions, searching existing data sources, gathering andmaintaining the data needed, and completing and reviewing the collection of information. Send comments regarding this burden estimate or any other aspect of this collection of information,including suggestions for reducing this burden, to Washington Headquarters Services, Directorate for Information Operations and Reports, 1215 Jefferson Davis Highway, Suite 1204, ArlingtonVA 22202-4302. Respondents should be aware that notwithstanding any other provision of law, no person shall be subject to a penalty for failing to comply with a collection of information if itdoes not display a currently valid OMB control number.
1. REPORT DATE DEC 1998 2. REPORT TYPE
3. DATES COVERED 00-00-1998 to 00-00-1998
4. TITLE AND SUBTITLE GPS Block IIR Rubidium Atomic Frequency Standard Life Test
5a. CONTRACT NUMBER
5b. GRANT NUMBER
5c. PROGRAM ELEMENT NUMBER
6. AUTHOR(S) 5d. PROJECT NUMBER
5e. TASK NUMBER
5f. WORK UNIT NUMBER
7. PERFORMING ORGANIZATION NAME(S) AND ADDRESS(ES) U.S. Naval Research Laboratory,4555 Overlook Ave SW,Washington,DC,20375
8. PERFORMING ORGANIZATIONREPORT NUMBER
9. SPONSORING/MONITORING AGENCY NAME(S) AND ADDRESS(ES) 10. SPONSOR/MONITOR’S ACRONYM(S)
11. SPONSOR/MONITOR’S REPORT NUMBER(S)
12. DISTRIBUTION/AVAILABILITY STATEMENT Approved for public release; distribution unlimited
13. SUPPLEMENTARY NOTES See also ADA415578. 30th Annual Precise Time and Time Interval (PTTI) Systems and ApplicationsMeeting, Reston, VA, 1-3 Dec 1998
14. ABSTRACT see report
15. SUBJECT TERMS
16. SECURITY CLASSIFICATION OF: 17. LIMITATION OF ABSTRACT Same as
Report (SAR)
18. NUMBEROF PAGES
15
19a. NAME OFRESPONSIBLE PERSON
a. REPORT unclassified
b. ABSTRACT unclassified
c. THIS PAGE unclassified
Standard Form 298 (Rev. 8-98) Prescribed by ANSI Std Z39-18

I chosen as the agency to conduct the test. The prime contractor, Lockheed Martin, was placed under contract by the JPO to supply two flightqualified RAFS units from the operational build of the Block IIR satellites. Consequently, subcontracts with ITT and EG&G were let to supply materials and support the Life Test. The system operators at the Second Space Operations Squadron (2SOPS) and Aerospace Corporation are also participating in the conduct and analysis of the Life Test data.
PURPOSE OF TEST A three-year continuous Life Test is to build confidence in the RAFS units for GPS operations and possible follow-on applications [I]. Flight candidate RAFS units from the operational satellites are being evaluated in space-like conditions and environment, designed to be as close to actual operating conditions as possible. Data from this test are to be complemented with on-orbit data from other units launched in the Block IIR satellites to attempt evaluation of the lifetime characteristics of these units as a class of devices. From these data the operating life, probability of failure, and other related mission parameters may be quantified for the RAFS as a class of units[2]. In the development of atomic clocks for GPS, a test of this type had been desired for the different units being used, but launch schedules and availability always precluded the attempts. In this case, the test data and units can also be used as control models for on-orbit performance and possible problem resolution should anything unusual occur in satellites already launched.
TEST CONFIGURATION
RAFS serial numbers 28 and 30 were provided for the test. Two thermal vacuum chambers with independent baseplate temperature controllers are being used to house each of the units. Spacecraft engineers from ITT who are responsible for installation of the RAFS in the satellites installed the test units in the thermal vacuum chambers at NRL using the same procedures and materials as is used in the satellites. Prior to beginning the actual Life Test, a pretest phase for setup and checkout of the equipment and procedures for gathering the data was performed. This pretest period began with the final checkout of the thermal vacuum systems on 26 February 1997 prior to the delivery and installation of the test units on 3 March 1997. A series of tests and analysis of the data collected by the instrumentation was performed to determine the initial operating guidelines and analysis techniques. These initial parameters were used to guide test performance, to verify methods of analyzing and presenting the data and to set the necessary measurement intervals. After the pretest evaluation of the test instrumentation, the Life Test officially began on 3 1 March 1997.
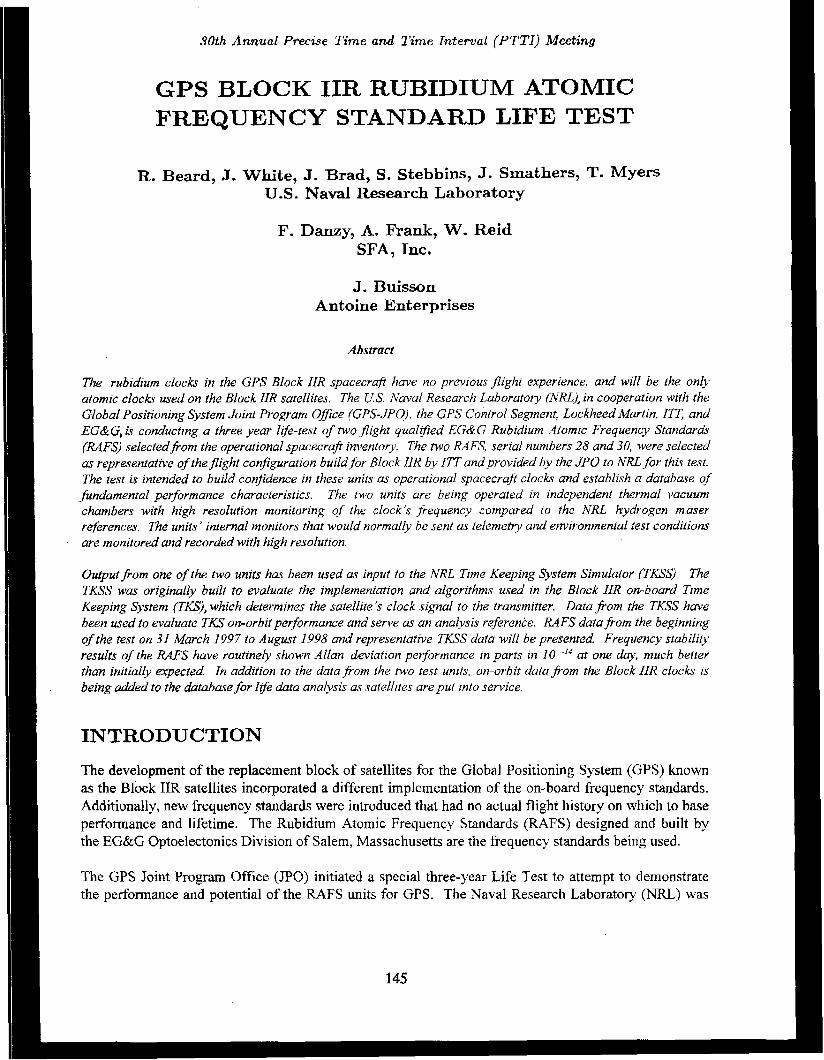
The equipment configuration is shown in Figure 1. A dedicated data collection computer (RAFS Tester on the diagram) is allocated to the collection of the telemetry from the units. Each unit is capable of sixteen telemetry outputs during ground test, including the factory acceptance test outputs. In the operational telemetry nine outputs are used. The Life Test telemetry data outputs are listed on Figure 1 and read with 16-bit data words. The satellite telemetry is output with a resolution of 8-bit words. The 16-bit word resolution was selected as a convenient over-sampling size to observe the finer structure. Satellite telemetry could then be duplicated for comparison by truncation of the collected data words. The RAFS Tester, shown in Figure 1, also collects data on input power, test equipment operating and environmental conditions in the test area. Environmental conditions in the test room and associated areas could be used to correlate thermal effects in the test equipment or cabling if necessary.
The output 13.4 MHz signals from the units is converted to 5 MHz by a Numerically Controlled Oscillator (NCO) so that they may be input into the dual-mixer phase measurement-systems used for clock evaluation. Two systems are used for redundancy, the Short-Term and Long-Term systems. They

are capable of performing high precision phase comparisons between the test units and the NRL reference hydrogen maser. These data are then collected along with the telemetry data on the Test Facility computer, TAGNT. TAGNT is then accessible to the other networked computers for analysis and archiving.
DATA ANALYSIS
The objective of collecting continuous data was interrupted on several occasions by changes required by the experiment or problems with the instrumentation system. These events are listed in Table 1. The events listed created breaks in the continuous data necessitating the stability analysis to be sectioned. The stability analysis sections are shown in Table 2.
Table 1, Life Test Events
MJD /Date Unit No. 28 Unit No. 30 50581 5/13/97 Baseplate Temperature Change 50601 6/2/97 Baseplate Temperature Change 50702 911 1/97 Pressure Change 50862 2/18/98 Lost Power Lost Power 50869 2/25/98 Powered Up Powered Up
SO888 3/16/98 Vacuum Pump Failure 50937 5/4/98 UPS Drop Out UPS Drop Out
50980 6/16/98 UPS Drop Out UPS Drop Out
Table 2, Stability Analysis Segments
Unit No. 28 Unit No. 30 Weeks 1 - 47 Weeks 1 - 47
Weeks 48 - 5 1 I
Weeks 52 - 70 ( Weeks 48 - 70
The first adjustments to the configuration was to change the units operating temperatures due to the determination that the temperature of the units was at such a high value that the internal controllers were not functioning properly. The elevated unit temperature was due to the insulating adapter between the unit and the chamber baseplate. This adapter controls conductive heat flow out of the units to the baseplate and was not conducting as anticipated. The adapter conductance was investigated for the Life Test and the flight units by Lockheed Martin and ITT. Corrective action was taken on the flight units. For the Life Test it was decided to operate at a somewhat lower temperature for one unit and the expected lower flight temperature for the other to enable the internal controllers to function properly. Consequently, RAFS unit 28 was lowered to approximately 17" C and RAFS unit 30 to X0 C. Operation was resumed and no hrther system temperature setting problems occurred.
Instrumentation problems that occurred subsequently were power related. The thermal vacuum and RAFS controller were on the facility's Uninterruptable Power System (UPS) which fed parts of the laboratory which were to operate without dependence on commercial power. Attempting to maintain continuous power and the UPS system failure during the test resulted in the other breaks shown in the

data.
RAFS UNIT 28
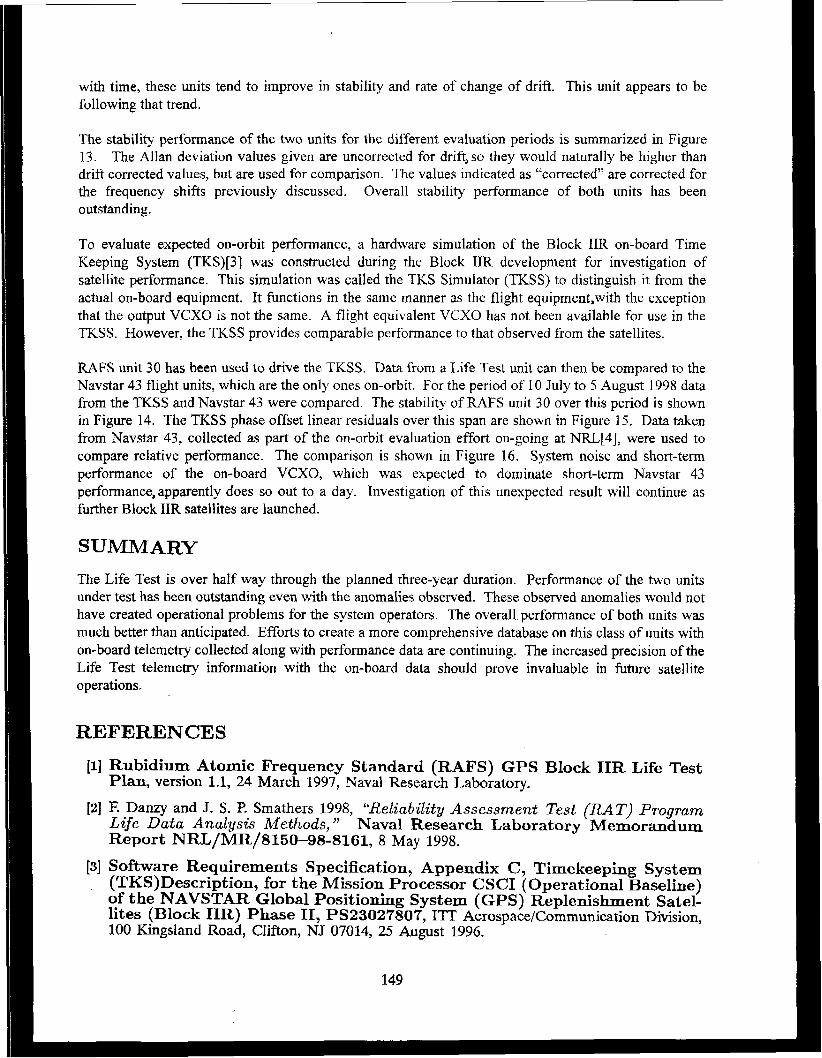
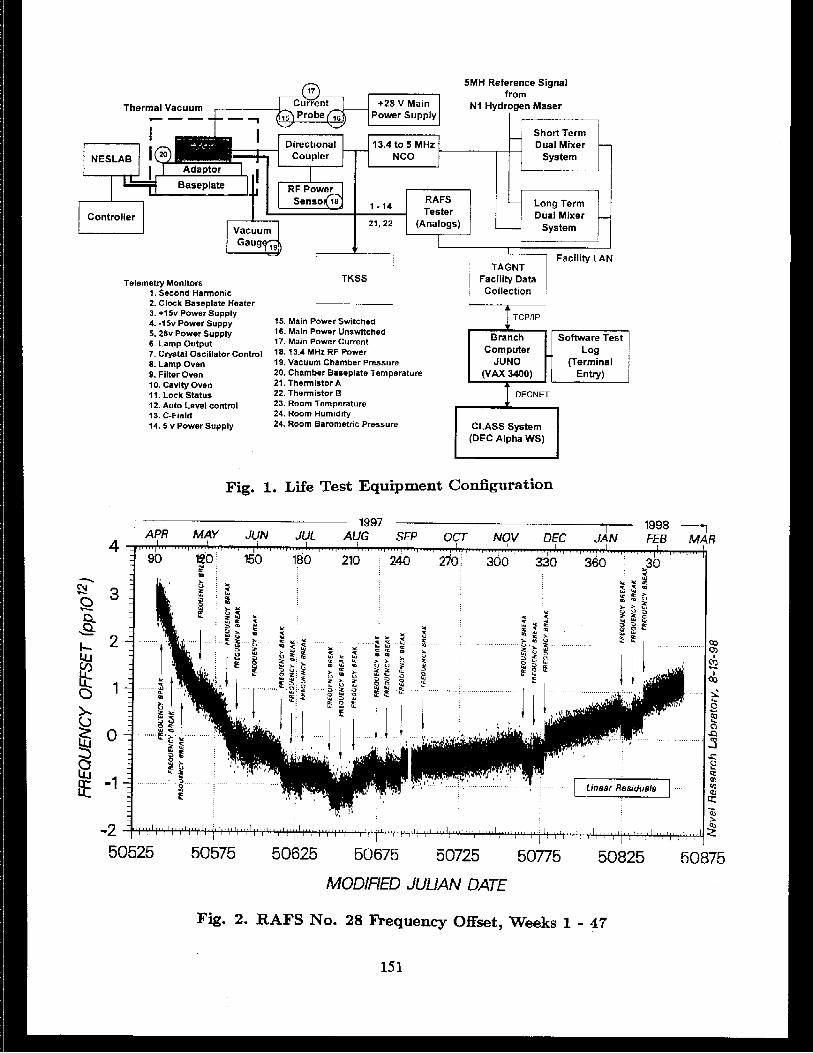
In order to present a brief summary of the findings in the test thus far, the majority of the telemetry data will not be presented. For the most part, these data show little out of the ordinary and will be detailed in a future comprehensive report. The figures that follow will focus on the phase performance and will be shown for RAFS unit 28 first. Figure 2 shows linear residuals to the frequency offset of RAFS unit 28 for the first 47 weeks of operation. A number of frequency breaks or discontinuities can be observed. The time and the amount of the discontinuity is indicated in the figure. These small frequency jumps can be readily seen in a higher order residual. Fifth-order residuals are shown in Figure 3 and the frequency changes are obvious. These changes were observed in only two telemetry channels, the Lamp Output Voltage and the Second Harmonic output, shown in Figures 4 and 5 respectively. The cause of these frequency changes is not fully understood,but is certainly associated with the lamp output. RAFS unit 28 was known to exhibit these types of small jumps before it was chosen for the test.
Another important parameter for these units is the frequency drift. All rubidium standards dri& but it is the change in drift that seriously affects the predictability of operation. For GPS the predictability is very important, since the GPS system is a predicted system and relies upon the ability to accurately predict system parameters for at least a day in advance. Consequently, the daily drift was computed for the RAFS Life Test units to provide an estimate of this parameter and is for RAFS unit 28 in Figure 6 . Thesedata show that the rate of change of drift is relatively stable and slowly decreasing. The desired or specif~ation daily drift value is 5 x 10-I4/day.
Correcting the frequency jumps, the Hadamard deviation was computed for the span of 1 to 47 weeks. The deviation is shown in Figure 7. The Hadamard deviation is used because it adaptively corrects for frequency drift and is the statistic used by the operators at 2SOPS to tune the system Kalman filter. This filter is used for prediction of satellite performance and generation of the navigation message broadcast to the users.
Figure 8 shows the frequency offset for the span of weeks 48 to 70. The frequency jumps can still be observed with another discontinuity around the end of March associated with a vacuum break. Some vacuum was lost at that time, but determination of the exact disruption was not possible due to the limited range of the vacuum gauge. A brief partial loss of vacuum is believed to have occurred, not a complete loss. The regularity of the frequency jumps changed as a result of the vacuum loss. This can be deduced from the cumulative frequency corrections shown in Figure 9. The regularity of the frequency changes occurring between the pressure changes,resulting in a gradual cumulative increase in frequency offset, is curious. Investigations into the causes of these changes are continuing.
Correcting for the jumps, a comparison of the stability for the first and second spans of data is shown in Figure 10. The stability is quite consistent and is approximately 8 x 10-l5 at one day.
RAFS UNIT 30
The phase offset for RAFS unit 30 for weeks 1-47 is shown in Figure 11. Only one of these small frequency shifts was observed over this entire span. This unit has been very well behaved throughout the test. Comparison of stability for the two main periods of continuous data, weeks 1 to 47 and weeks 48 to 80, is shown in Figure 12. These data indicate a possible improvement in the long-term stability between the two periods. Previous tests on the prototypes and engineering models of these units had shown that,
with time, these units tend to improve in stability and rate of change of drift. This unit appears to be following that trend.
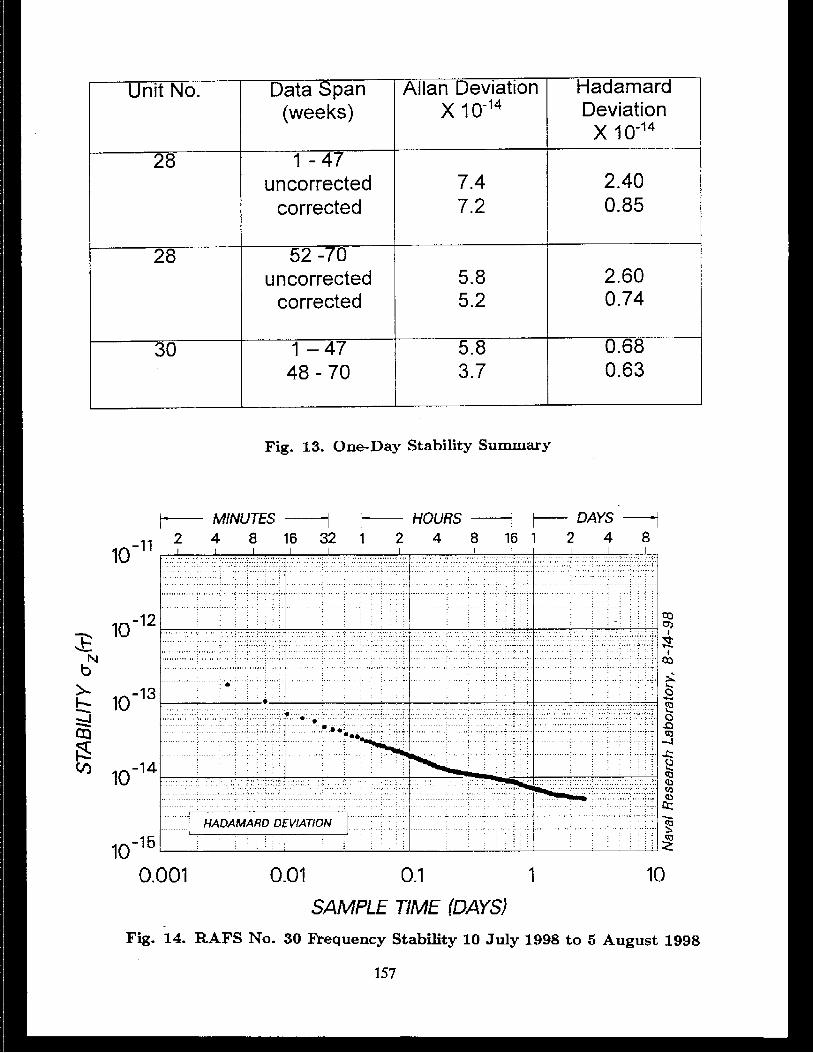
The stability performance of the two units for the different evaluation periods is summarized in Figure 13. The Allan deviation values given are uncorrected for dri%so they would naturally be higher than drift corrected values, but are used for comparison. The values indicated as "corrected" are corrected for the frequency shifts previously discussed. Overall stability performance of both units has been outstanding.
To evaluate expected on-orbit performance, a hardware simulation of the Block IIR on-board Time Keeping System (TKS)[3] was constructed during the Block IIR development for investigation of satellite performance. This simulation was called the TKS Simulator (TKSS) to distinguish it from the actual on-board equipment. It functions in the same manner as the flight equiprnent,with the exception that the output VCXO is not the same. A flight equivalent VCXO has not been available for use in the TKSS. However, the TKSS provides comparable performance to that observed from the satellites.
M F S unit 30 has been used to drive the TKSS. Data from a Life Test unit can then be compared to the Navstar 43 flight units, which are the only ones on-orbit. For the period of 10 July to 5 August 1998 data from the TKSS and Navstar 43 were compared. The stability of RAFS unit 30 over this period is shown in Figure 14. The TKSS phase offset linear residuals over this span are shown in Figure 15. Data taken from Navstar 43, collected as part of the on-orbit evaluation effort on-going at NRL[4], were used to compare relative performance. The comparison is shown in Figure 16. System noise and short-term performance of the on-board VCXO, which was expected to dominate short-term Navstar 43 performance,apparently does so out to a day. Investigation of this unexpected result will continue as further Block IIR satellites are launched.
SUMMARY
The Life Test is over half way through the planned three-year duration. Performance of the two units under test has been outstanding even with the anomalies observed. These observed anomalies would not have created operational problems for the system operators. The overall performance of both units was much better than anticipated. Efforts to create a more comprehensive database on this class of units with on-board telemetry collected along with performance data are continuing. The increased precision of the Life Test telemetry information with the on-board data should prove invaluable in future satellite operations.
REFERENCES
[I] Rubidium Atomic Frequency Standard (RAFS) GPS Block IIR Life Test Plan, version 1.1, 24 March 1997, Naval Research Laboratory.
[2] F. Danzy and J. S. P. Smathers 1998, "Reliability Assessment Test (RAT) Program Life Data Analysis Methods, " Naval Research Laboratory Memorandum Report NRL/MR/8150-98-8161, 8 May 1998.
[3] Software Requirements Specification, Appendix C , Timekeeping System (TKS)Description, for the Mission Processor CSCI (Operational Baseline) of the NAVSTAR Global Positioning System (GPS) Replenishment Satel- lites (Block IIR) Phase XI, PS23027807. ITT Aerosr>ace/Communication Division.

[4] 0. J. Oaks, T. B. McCaskill, M. M. Largay, W. G. Reid, and J. A. Buisson 1999, Per- formance oif GPS On-Orbit Navstar Frequency Standards and Monitor Station Time References, " these Proceedings.
Thermal Vacuum ---
Telemetty Monitors TKSS 1. Second Harmonlc 2. Clock Baseplate Heater - 3. +lSv Power Supply 4. -1% Power Suppy 15. Main Power Switched 5 . 2 8 ~ Power Supply 16. Main Power Unswltched 6 Lamp Output 17. Ma~n Power Current 7. Crystal Oscillator Control 18. '3 * MHz RF Power 8. Lamp Oven 19. Vacuum Chamber Pressure 9. Filter Oven 20. Chamber Baseplate Temperature 10. Cavlty Oven 21. Thermtstor A
11. Lock Status 22. Thermtstor I3
12. Auto Level control 23. Room Temperature 13. C-Field 24. Room Hurntdlty 14.5 v Power Supply 24. Room Barometric Pressure
Fig. 1. Life Test Equipment Configuration
MODIFIED JUUAN DATE
Fig. 2. RAFS No. 28 Requency Offset, Weeks 1 - 47
MODIFIED JUlfAN DATE
I 1997 APR MAY JUN JUL AUG SEP OCT
Fig. 3. RAFS No. 28 Phase Offset Residuals Weeks 1 - 24
~ 1 ~ ~ ~ 1 1 ' ~ 1 ~ ~ 1 ~ ~ z ~ 1 ~ ~ ~ ~ I ' ~ ~ ~ ' ~ 1 ~ ~ ~ ~ 1 ~ ~ ~ ~ I ! ~ ~ ~ ~ ~ ~ ~ ~ 1 ~ ~ ~ ~ l ! ~ ~ ~ 1 ~ ~ ~ ~ i ~ ~ ~ ~ 1 ~ 1 ~ 1 ~ ~ 1 1 T ~ s ~ T T ~ ~ l ~ ! ~ ~ ~ ~ ~ ~ ~ ~ ~ ~ ~ ~ l ~ !
90 120 150 180 210 240 no UI
-
.
.
1997 1998 - 1 MAR APR MAY JUN JUL AUE SEP OCT NOV DEC AN FEB MAR APR MAY JUN JUL AUG
Fa ? 9 m
8 2 F 0
B 4 E v m 0 V1 z &
9
MODIFIED J U U N DATE
m ; ; - m , m , m l i r 7 ~ 7 * ; ; n l n l r m 1 ; ~ ~ ~ l ~ ; ; ~ ~ ~ l ~ ~ ; ~ , ~ i ~ ~ ~ ~ , ~ l ~ ! : ~ , ~ i ~ ~ : ~ , ~ , ~ ~ : ~ , ' l ~ ; : 7 , t i * ; i ~ i ~ , ~ l ~ : ~ l ~ , ~ ; ; ~ i ~ l ~ ! ; ~ l ~ , ~ ! ; ~ i ~ , ~ ! i ~ , ~ , ~ ! ~ ~ , ' , ~ ~
50525 50550 50575 50600 50625 50650 50675 50700 50725
Fig. 4. RAFS No. 28 Lamp Output Voltage

MODIFIED JUUAN DATE
Fig. 5. RAFS No. 28 Second Harmonic Weeks 1 - 70
: 2
gl
2 ? I: $2
ob
One-Day Average -.. 2
50525 50575 50625 50675 50725 50775 50825 50875
MODIFIED JUUAN DATE
Fig. 6. RAFS No. 28 Daily Fkequency Drift Weeks 1 - 47

1- HOURS -i 1- DAYS -j 1 6 3 2 1 2 4 8 1 6 1 2 4 8 1 6 3 2 6 4 lo-" ' I I I I I I
lo-'*. z t?
10- l~ d m s v, 10-14
I , . 1 I
8 >
I t
> ,
, . . / - * .
- ,. < . >
" 4
0.01 0.1 1 10 100
SAMPLE TIME (DAYS)
Fig. 7. RAFS No. 28 Stability Weeks 1 - 47
I - 1998 MAR APR MAY JUN JUL I
I I I > .
. .
, ,
. ?
.
.
:.
, , . . , ,
\ . . -.
, >
, " .
> ; I . ' .
, .
-276
0
.:? 2 m
s 0
U
9 g ' Q , , d
E 2 Q
1 0 Y
g
. .
. +
, . * . , -; *
I - * .*. >
, .
r ~ ~ 4 ~ I . ~ ~ ~ 8 ~ ~ ~ ~ ~ ~ ~ m ~ 1 ~ 9 7 7 ~ ~ 7 ~ 7 ~ ~ ~ ~ ~ , ' ~ ~ ~ 9 ~ m 9 8 m ~ 7 r 7 7 , ~ . ~ . ~ ~ . . ~ , . 7 ~ ~ ~ ! ~ 7 7 , T ~ ~ ~ , . ~ . 9 , ~ 1 ~ , ~ l ~ 7 7
- 2 9
HADAMARD DEVIAL'ON . . CORRECTED . -
AUG - S -278 s 8 -280 4
6 -282 2
-284
k -286 6 2 -288 Lu
-290
-292 50860 50880 50900 50920 50940 50960 50980 51000 51020 51040
MODIFIED JUUAN DATE
Fig. 8. RAFS No. 28 Frequency Offset Weeks 48 - 70
154
60 90 120 150 180 210
r w a
u z 5
4 Y
9 Y
8 $ E
C - ~ i E
. . . ,
~~~.~t~~.~.~..i~l1,~,~ll~l ' l~l~l~.~,1~,1~,1t1,~.,.1,~.-.~l~l~l~,~l~,~l~l~,~,~,~,.~,.~.~.~1,~.~,,~,~,~l~,~,~,~l~,~,~I~l~I~,,~,~,~,,~,~,~,~lxl~l~ll~,1L
m ? 2
- &
. $ - g
. % 4 E
S Q
2 e - 9 5

50500 50550 50600 50650 50700 50750 50800 50850 50900 50950 51000 51050
MODIFIED JULlAN DATE
Fig. 9. RAFS No. 28 Cumulative Frequency Corrections Weeks 1 - 70
1- HOURS -1 i DAYS -j
0.1 1 10
SAMPLE TIME (DAYS)
Fig. 10. RAFS No. 28 Stability 31 March 1997 to 11 August 1998

MODlFlED JUUAN DATE
Fig. 11. RAFS No. 30 Corrected Phase Weeks 1 - 47
I)--- HOURS -----I I-- DAYS I 1 2 4 8 1 8 1 2 4 8 1 6 3 2 6 4
. . . . . . . . . . . . . . . . . . . . . . . . . . C T .................. , ....... ..; ..... :. . . . . . . . . . . . < . . . . . . . . . . . . . . . . . . . . . . . . . . . . . . . . . . . . . . . . . . . . . . . . . . . . . . . . . . . . . . . . . . . . . . . . . , . , . . . .
, , , , , . . . . . . . . >
, . .......................................... . . . . . . . . . . ; . . : : ....; $ .......... . . . . . . . . . . . . . . .
. . . . . . . .
LEGEND
* WEEKS ,*, r 3 WEEKS 62-70
. . . . . . . . . . . . . . . , . , , . , , . . . . . . . . . . . , , . , . ,
. .
. . . . . . . . .
. . . , . . .
, , . , . . . . . " ' . . . . . . . . . . . . . . . . . . . . . . . . . . . . - , ....... .. , , , , ,
. . . . . . . . . . . . . . . . . . . . . . . . . . , . . , . . .
. . . . . . . . . . . . . . . . . . . . . . . . . . . . . . . . . . . . . . . . ................................ . , , . . . . . , , . . . . . . . . . . . . . . . . . . . . . . . . . . . . . . . . . . . . . . . . . . . . . . . . . . . . . . . . . . . . . . . . . . . . . . . . . . . . .
: : . : . : Q) . : : . . . , , . . . . . . . , . . , . . . . , . .
. " ' . . 2
. . . .
. . . Hadamerd ....................................... . , , . . . . . . . , . . , , , , , ,
. . . . . . . . . . . . . . 10-l5
. , , , , , , . : ! : ; ; : ; 3 . . . . . . . : . .
0.01 0.1 I 10 100
SAMPLE TIME (DAYS) Fig. 12. RAFS No. 30 Frequency Stability 31 March 1997 to 11 August 1998
156
, , , , : . : . :
Unit No. Data Span Allan Deviation Hadarnard (weeks) x 1 0-l4 Deviation
x I I
28 1 - 4 7 uncorrected 7.4 2.40
corrected 7.2 0.85
28 52 -70 uncorrected 5,8 2.60
corrected 5.2 0.74
30 1-47 5.8 0.68 48 - 70 3.7 0.63
Fig. 13. One-Day Stability Summary
1- MINUTES 1- HOURS -----A 1- DAYS -1
0.001 0-01 0.1 1 10
SAMPLE TIME (DAYS) Fig. 14. RAFS No. 30 Frequency Stability 10 July 1998 to 5 August 1998
157

I 1998 7 JUL JUL JUL JUL JUL JUL AUG AUG 10 14 18 22 26 30 3 7
- 2
51004 51008 51012 51016 51020 51024 51028 51032
MODlFlED JUUAN DATE
Fig. 15. RAFS No. 30 TKSS Phase Offset
1- MlNUTES - +-- HOURS -1 DAYS - 2 4 8 1 6 3 2 1 2 4 8 1 6 1 2 4 8
. . . , , , , ,
- N A V S M R * 3
0.001 0.01 0.1 1 10
SAMPLE TIME (DAYS)
Fig. 16. Frequency Stability Comparison 10 July 1998 to 5 August 1998

Questions and Answers
JIM CAMPARO (The Aerospace Corporation): I think it was RF-28, the first one you showed - it looked like there was a lamp warm-up effect. Did you remove that from the frequency data before you did the Hadamard Variance?
RONALD BEARD (NRL): No. The lamp warm-up does not necess~ly show itselfin the frequency output. That particular one that I showed was a kind of an anomaly. In the frequency performance, when you look at a longer data span, it does not really make that much si@cance. In the short term it might.
JIM CAMPARO: I thought I saw a 50-day time constant on the lamp. Was I wrong? Would you please put up the lamp data and the fist frequency offset data.
RONALD BEARD: I see. You are talking about this phenomenon here?
JIM CAMF'ARO: Yes.
RONALD B E D : Oh, all right. I was thinking of a later one. Yes, that is a warm-up. We do not necessarily remove that from the stability.
JIM CAMPARO: I think if you did, that would probably make the long-term stability look better. It looked like you had an uncorrected drjft in that.
RONALD BEARD: Yes, that is probably true.
PATRIZIA TAVELLA (EN): You spoke of frequency breaks or frequency jumps. Could you comment a bit, please? I think they are not intentional. frequency jumps, they are natural. What are they due to? Do we have any statistics on how often they happen and maybe why?
RONALD BEARD: We are still investigating the cause. We think it is probably a lamp phenomenon. We are still trylng to determine the frequency of occurrence. It seems to vary in its repeatability, depending on what conditions the unit is involved with. They are very small actual jumps in frequency.