gpg077
DESCRIPTION
Continuous Steel Reheating Furnaces: Operation and MaintenanceTRANSCRIPT

G o o d P r a c t i c e
Continuous Steel Reheating Furnaces: Operation and Maintenance
I I I I
I I I I b I
Solid henr(h
Side view End view
Energy Efficiency Office Dr. ."r"r*r O r 7 " s ~ X " , " O * " ~ " ,

CONTINUOUS STEEL REHEATING FURNACES: OPERATION AND
MAINTENANCE
This booklet is No. 77 in the Good Practice Guide Series and it considers operation and production aspects, maintenance and monitoring with respect to their affect on energy consumption. Case histories demonstrating good practice for continuous reheating furnaces are included for reference. An action plan is provided which summarises energy-related aspects of operation, and reviews the measures which will help reduce energy consumption.
This is one of two guides dealing with continuous steel reheating furnaces. The other guide is No. 76 in the Good Practice Guide Series which provides an introduction to continuous steel reheating furnaces and the basic principles of combustion technology, and considers furnace specification, design and equipment for new and experienced users. An action plan is provided which summarises energy-related aspects of furnace design, and reviews the measures which will help reduce energy consumption.
Prepared for the Energy Efficiency Office by:
The Energy Technology Support Unit (ETSU) Hanvell Oxfordshire OX1 1 ORA
and:
British Steel Technical Swinden Laboratories Moorgate Rotherham S60 3AR
@ Crown copyright 1993 First published 1993 Reprinted 411994
Other titles in the Good Practice Guide Series
1.
2.
3. 13.
14. 17. 18. 30. 31. 36.
37. 38. 42.
43. 44. 41. 48. 49. SO. 5 8 . 59. 60. 63. 64. 65. 66. 67. 68. 69. 70. 76. 78. 83.
84. 85. 86. 87. 88. 91. I26 127 128
GUIDANCE NOTES FOR THE IMPLEMENTATION O F SMALL-SCALE PACKAGED COMBINED HEAT AND POWER GUIDANCE NOTES FOR REDUCING ENERGY CONSUMPTION COSTS O F ELECTRIC MOTOR AND DRIVE SYSTEMS INTRODUCTION T O SMALL-SCALE COMBINED HEAT AND POWER GUIDANCE NOTES FOR THE IMPLEMENTATION OF HEAT RECOVERY FROM HIGH TEMPERATURE WASTE GAS STREAMS RETROFITTING AC VARIABLE SPEED DRIVES GUIDANCE NOTES FOR ACHIEVING HIGH YIELDS IN IRON FOUNDRIES REDUCING ENERGY CONSUMPTION COSTS BY STEAM METERING ENERGY EFFICIENT OPERATION O F INDUSTRIAL BOILER PLANT COMPUTER AIDED MONITORING AND TARGETING FOR INDUSTRY COMMERCIAL REFRIGERATION PLANT: ENERGY EFFICIENT OPERATION AND MAINTENANCE COMMERCIAL REFRIGERATION PLANT: ENERGY EFFICIENT DESIGN COMMERCIAL REFRIGERATION PLANT: ENERGY EFFICIENT INSTALLATION INDUSTRIAL REFRIGERATION PLANT: ENERGY EFFICIENT OPERATION AND MAINTENANCE
INDUSTRIAL REFRIGERATION PLANT: ENERGY EFFICIENT DESIGN RUBBER COMPOUNDING IN THE RUBBER PROCESSING INDUSTRY REDUCING ELECTRICITY USE IN INJECTION MOULDING ENERGY EFFICIENT LADLE PRE-HEATING TECHNIQUES WITHIN THE STEEL INDUSTRY GUIDANCE NOTES FOR THE EFFICIENT OPERATION O F CORELESS INDUCTION FURNACES CUPOLA MELTING OF CAST IRON I N IRON FOUNDRIES ENERGY EFFICIENT DESIGN AND OPERATION O F REFRIGERATION COMPRESSORS THE APPLICATION OF COMBINED HEAT AND POWER IN THE U K HEALTH SERVICE METAL DISTRIBUTION AND HANDLING I N lRON FOUNDRIES REDUCING ENERGY CONSUMPTION AND COSTS IN SMALL BAKERIES ACHIEVING ENERGY EFFICIENCY IN THE MALTINGS INDUSTRY ROTARY DRYING IN THE CHEMICAL INDUSTRY ENERGY CHAMPIONS: A SELECTION O F CASE HISTORIES ELECTRIC HOLDING O F HOT METAL IN IRON FOUNDRIES INVESTMENT APPRAISAL FOR INDUSTRIAL ENERGY EFFICIENCY ENERGY CONSERVATION IN T H E DRY-CLEANING INDUSTRY CONTINUOUS STEEL REHEATING FURNACES: SPECIFICATION, DESIGN AND EQUIPMENT ENERGY CONSERVATION IN LAUNDERING ENERGY EFFICIENT LIQUID RING VACUUM PUMP INSTALLATIONS IN THE PAPER INDUSTRY MANAGING AND MOTIVATING STAFF T O SAVE ENERGY ENERGY MANAGEMENT TRAINING RUBBER MOULDING & C U R I N G IN THE RUBBER PROCESSING INDUSTRY THE PHARMACEUTICAL INDUSTRY ENERGY EFFICIENT USE O F BOILERS USING CHAIN GRATE STOKERS MONITORING AND TARGETING IN LARGE MANUFACTURING COMPANIES COMPRESSING AIR COSTS ENERGY EFFICIENT ENVIRONMENTAL CONTROL I N THE GLASS INDUSTRY MONITORING AND TARGETING I N THE CLAY BRICK INDUSTRY
INTRODUCTION To LARGE-SCALE C O M B I N E D HEAT A N D POWER
Copies of these guides may he obtained from:
Energy Efficiency Enquiries Bureau ETSU Harwell Didcot Oxfordshire 0x1 1 ORA Tel No: 0235 436747.
Overseas customers please remit E3 per copy (minimum of € 6 ) with order to cover cost of packaging and posting. Please make cheques, drafts or money orders payable to ETSU.
Fax No: 0235 432923. Telex No: 83135

FOREWORD
This guide is part of a series produced by the Energy Efficiency Officeunder the Best Practice programme. The aim of the programme is to advance and spread good practice in energy efficiency by providing independent, authoritative advice and information on good energy efficiency practices. Best Practice is a collaborative programme targeted towards energy users and decision makers in industry, the commercial and public sectors, and building sectors including housing. It comprises four inter-related elements identified by colour-coded boxes for easy reference:
- energy consumption guides: (blue) energy consumption data to enable users to establish their relative energy efficiency performance;
good practice guides and case studies: (red) independent information on proven energy saving measures and techniques and what they are achieving;
- new practice projects: (green) independent monitoring of new energy efficiency measures which do not yet enjoy a wide market;
- future practice R&D support: (purple) help to develop tomorrow’s energy efficiency good practice measures.
-
If you would like any further information on this document, or on the Best Practice programme, please get in touch with your Regional Energy Efficiency Office. Their addresses are given below:
ENGLAND
Energy Efficiency Office Energy Efficiency Office Energy Efficiency Office (East Midlands Region) (Eastern Region) (NORTHERN IRELAND) Cranbrook House Heron House Dept of Economic Development Cranbrook Street 49 - 53 Goldington Road Netherleigh Nottingham Bedford Massey Avenue NG1 1EY MK40 3LL Belfast Tel: 0602 352292 Tel: 0234 276194 BT4 ZJP
Energy Efficiency Office (Northern) (South West) Dept of the Environment Room 326 Energy Efficiency Office Wellbar House Dept of the Environment (SCOTLAND) Gallowgate Tollgate House Scottish Office Industry Dept. Newcastle upon Tyne Houlton Street Energy Division R6/47 NE1 4TD Bristol New St. Andrew’s House Tel: 091 201 3343 BS2 9DJ Edinburgh
Tel: 0232 529358 Energy Efficiency Office
Tel: 0272 878665 EH1 3TG
Energy Efficiency Office (North West Region) Dept of the Environment Sunley Tower Piccadilly Plaza Manchester MI 4BE Tel: 061 838 5335
Energy Efficiency Office (South Eastern Region) Charles House Room 565 375 Kensington High St London W14 8QH Tel: 071 605 9160
Energy Efficiency Office (West Midlands Region) Fiveways Tower Frederick Road Birmingham B15 1% Tel: 021 626 2222
Energy Efficiency Office (Yorkshire & Humberside Region) Dept of the Environment City House New Station Street Leeds LSI 4JD Tel: 0532 836376
Tel: 031 244 4665
Energy Efficiency Office (WALES) Industry Department Welsh Office Cathays Park Cardiff CFI 3NQ Tel: 0222 823126

Section
Contents
Page No.
1. INTRODUCTION
PART A: OPERATIONAL ASPECTS OF REHEATING FURNACES
2. OPERATIONAL STRATEGIES 2.1 Throughput Changes 2.2 Production Scheduling 2.3 Temperature Control
2.3.1 Delay Strategies 2.3.2 Light-Up Practice 2.3.3 Furnace Temperature Profiles
3. HOT CHARGING 3.1 Benefits of Hot Charging 3.2 Practical Considerations
3.2.1 Cold Rolling
4. PERFORMANCE MONITORING AND MAINTENANCE 4.1 Heat Recovery Systems
4.1 . I External Recuperators 4.1.2 Regenerative and Self-Recuperative Burners
4.2 Air/Fuel Ratio Settings 4.3 Furnace Pressure 4.4 Environmental Considerations
PART B: ACTION PLAN
5 . OPERATIONAL CONSIDERATIONS
PART C: CASE HISTORIES OF GOOD FURNACE PRACTICE
6. CASE HISTORIES 6.1
6.2
6.3
6.4
6.5 6.6
Regenerative Ceramic Burners on a Walking Beam Type Tube Reheating Furnace Hot Charging Practice and Regenerative Ceramic Burners on a Walking Beam Furnace at UES Aldwarke Works Oxygen Trim Control on a Walking Beam Furnace at LIES Roundwood 11 inch Mill Direct Stock Temperature Measurement on a Pusher Furnace at BS Brinsworth Computer-Controlled Furnace Management at British Steel plc Variable Speed Drives on a Large Continuous Furnace Combustion Air Fan at Cardiff Rod Mill
Appendices
Appendix I Glossary of Terms
Appendix 2 Technical Data
1
4 4 5 5 5 8 9
11 11 11 13
14 14 14 15 16 17 17
19
23 23
24
24
27
28 29
31
33
FIGURES Page No.
Fig 1
Fig 2
Fig 3
Fig 4
Fig 5
Fig 6
Fig I
Fig 8
Fig 9
Fig 10
Fig 1 1
Fig 12
Fig 13
Fig 14
Fig 15
Fig 16
Fig 17
TABLES
Table 1
Table 2
Table 3
Table 4
Table 5
Steel production routes
Rolled products
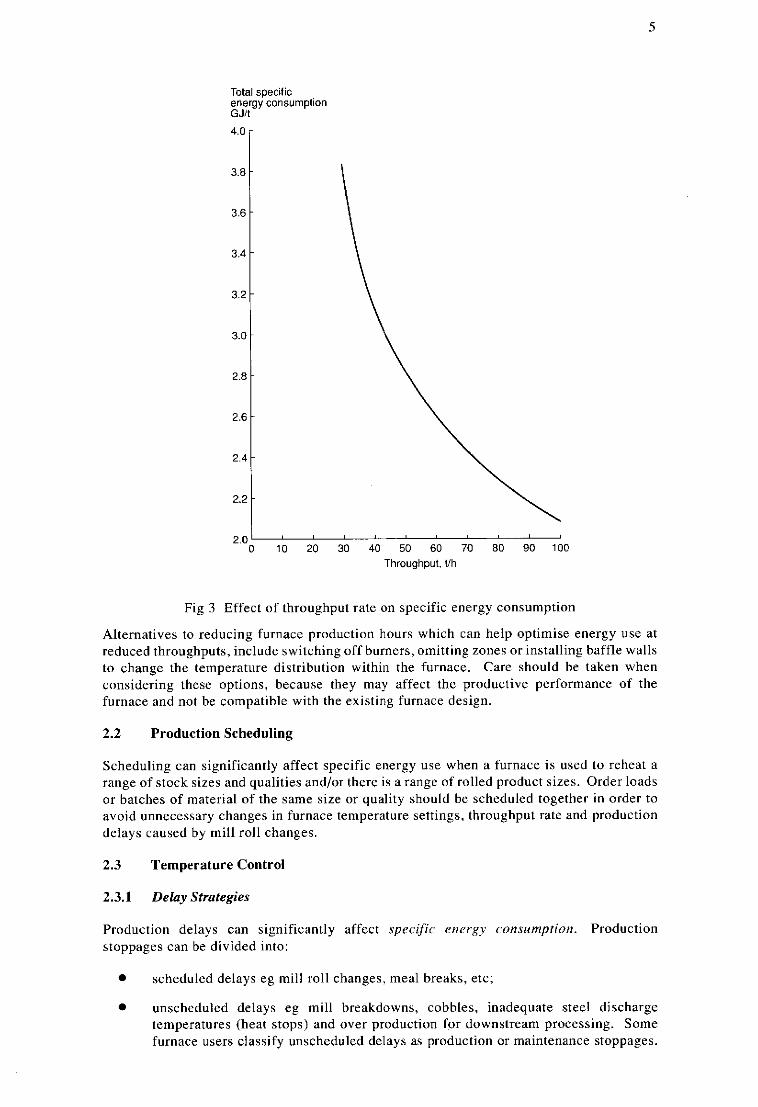
Effect of throughput rate on specific energy consumption
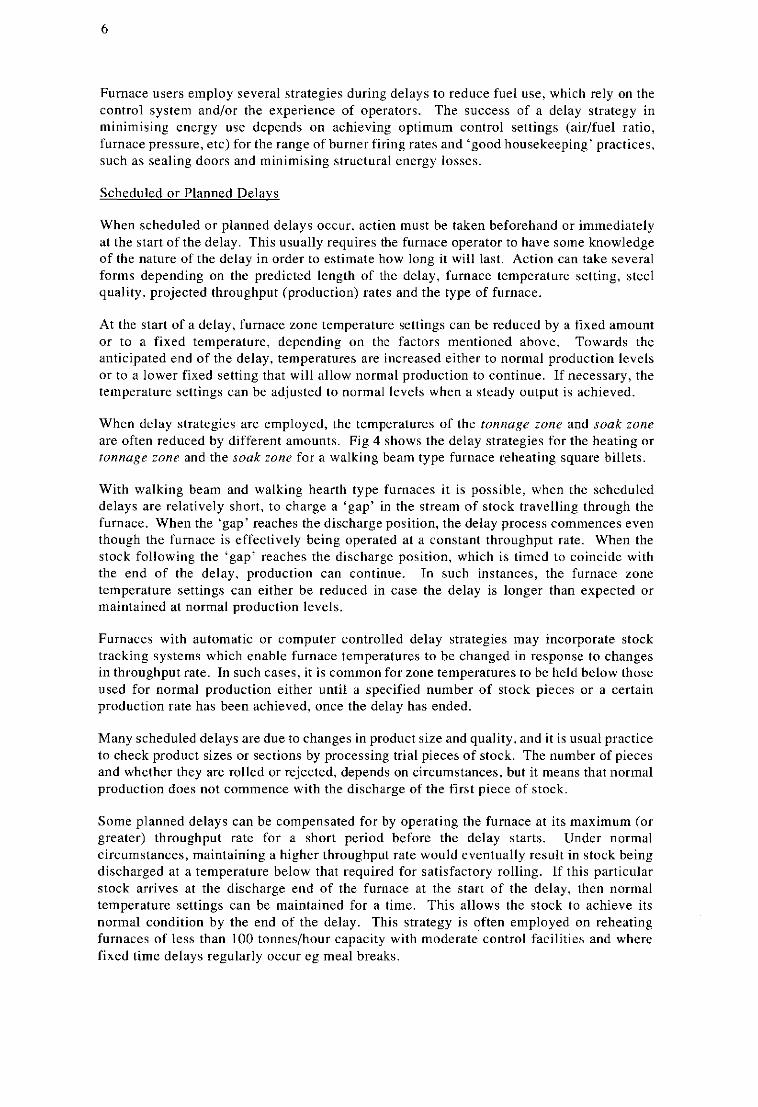
Delay strategy for a walking beam type furnace reheating 140mm square billets
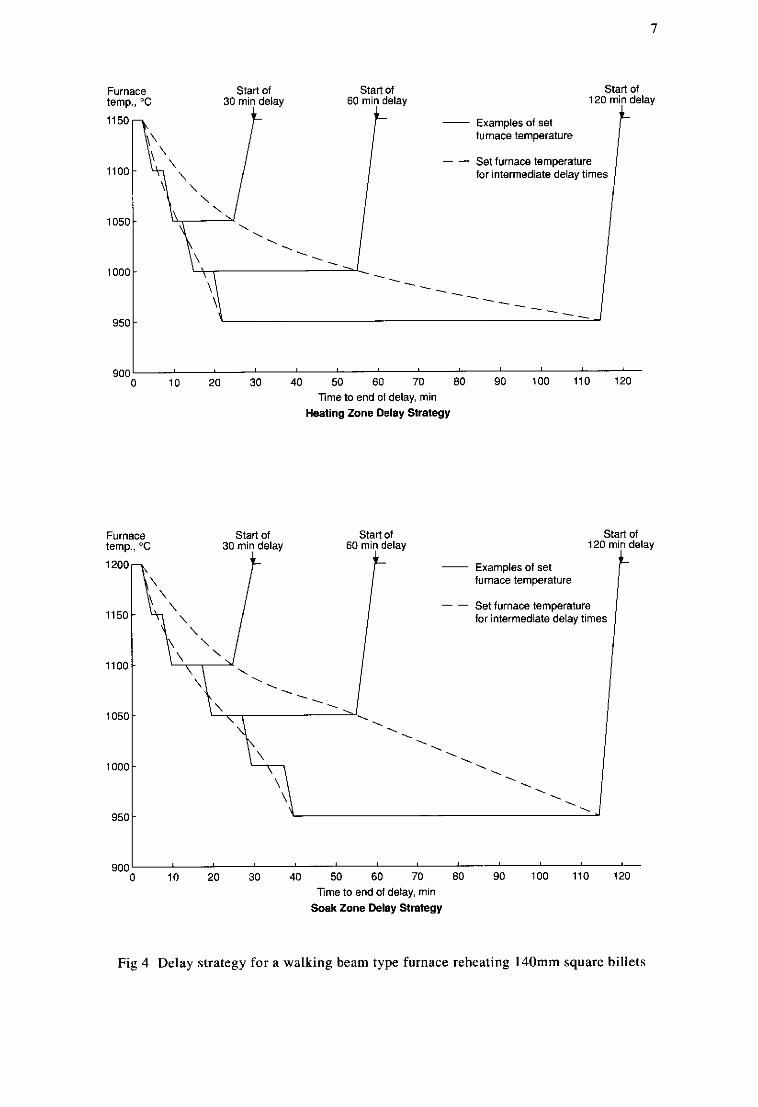
Predicted stock temperature profiles
Effect on fuel consumption of hot charging practice
Effect of hot charging on stock residence time
Relationship between excess combustion air level and composition of combustion products
Tube reheating walking beam furnace
Walking beam furnace at Aldwarke
Specific energy consumption for Aldwarke Furnace
Roundwood 11 inch billet reheating furnace
Effect of oxygen trim control on specific energy consumption
Slab reheating furnace at BS Brinsworth
Effect of temperature control methods on specific energy consumption
Slab reheating furnaces at British Steel’s Teesside works
Enthalpy of steel
1
2
5
7
10
12
13
16
23
24
25
25
26
21
28
29
39
Average condition of furnace atmosphere
Combustion of natural gas
Combustion of fuel oil
Heat content of stoichiometric air
Heat loss from a surface
Page No.
26
33
35
38
40

1
ENERGY EFFICIENT OPERATION OF CONTINUOUS STEEL REHEATING FURNACES
1. INTRODUCTION
The iron and steel industry consumes about 5.4% of the total energy used each year in the UK. Continuous steel reheating furnaces use approximately 36 PJ (340 million therms) of liquid and gaseous fuels (54% natural gas, 36% other gaseous fuels and 10% fuel oils) per year to reheat approximately 17 million tonnes of steel. Fuel costs exceed E80 million/year.
All qualities of steel from stainless grades to alloy and carbon steels may be reheated. Continuous steel reheating furnaces generally serve one of two types of rolling mill:
Primary mills which are mainly used to reheat cast steel ingots, blooms or continuously cast blooms for the production of billets, slabs or semi-finished products. Although these products can be used directly, they are usually the feedstock for secondary rolling mills:
Secondary mills which produce strip, plate, bar, rod, rails and sections. In many steelworks, these are the finished saleable products, although they may undergo further processing by their purchasers to produce engineering components, domestic appliances and other finished steel products. This category includes continuous furnaces serving forges and presses.
Fig 1 shows the steel production routes from molten metal to semi-finished products, and Fig 2 the range of rolled products obtained from these processes.
Steelmaking BOSEAF
Concast SlablBloomlBillet
Primary Rolling Slab/BloomlBillet
t Reheat
Continuous Furnace 1 Secondary Rolling
Semi-Finished Product
Fig I Steel production routes
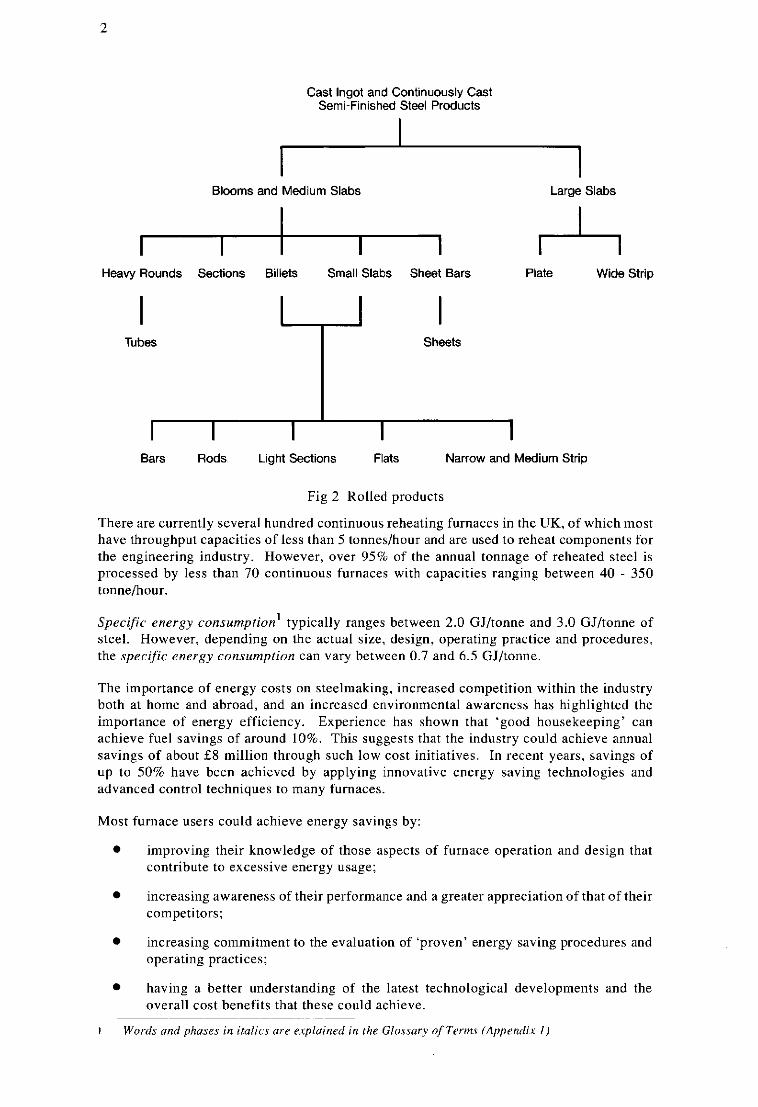
2
Cast Ingot and Continuously Cast Semi-Finished Steel Products
Blooms and Medium Slabs Large Slabs
m A Heavy Rounds Sections Billets Small Slabs Sheet Bars Plate Wide Strip
Bars Rods Light Sections Flats Narrow and Medium Strip
Fig 2 Rolled products
There are currently several hundred continuous reheating furnaces in the UK, of which most have throughput capacities of less than 5 tonnes/hour and are used to reheat components for the engineering industry. However, over 95% of the annual tonnage of reheated steel is processed by less than 70 continuous furnaces with capacities ranging between 40 - 350 tonnelhour.
Specific energy consumption’ typically ranges between 2.0 GJItonne and 3.0 GJItonne of steel. However, depending on the actual size, design, operating practice and procedures, the specific energy consumption can vary between 0.7 and 6.5 GJItoune.
The importance of energy costs on steelmaking, increased competition within the industry both at home and abroad, and an increased environmental awareness has highlighted the importance of energy efficiency. Experience has shown that ‘good housekeeping’ can achieve fuel savings of around 10%. This suggests that the industry could achieve annual savings of about f8 million through such low cost initiatives. In recent years, savings of up to 50% have been achieved by applying innovative energy saving technologies and advanced control techniques to many furnaces.
Most furnace users could achieve energy savings by:
improving their knowledge of those aspects of furnace operation and design that contribute to excessive energy usage:
increasing awareness of their performance and a greater appreciation of that of their competitors:
increasing commitment to the evaluation of ‘proven’ energy saving procedures and operating practices;
having a better understanding of the latest technological developments and the overall cost benefits that these could achieve.
I Words and phases in italics are expluined in the Glossary of Terms (Appendix I J

3
More stringent environmental legislation and changes in fuel pricing policies may encourage furnace users to rationalise operations and actively pursue energy efficiency. This Good Practice Guide is intended to heighten awareness of the potential for energy savings and associated cost savings during reheating by considering where and how energy is wasted and describing energy efficiency measures.
Two complimentary Good Practice Guides have been prepared to help users of continuous steel reheating furnaces to save energy. This Guide describes the importance of operational aspects and gives case histories of good furnace operation. Good Practice Guide 76 describes the specification, design and equipment aspects of continuous reheating furnaces. When using this Guide it will be useful to refer to Good Practice Guide 76 for more detailed information on furnace systems and control.
This Guide is in three parts. Part A considers those productioii aspects that affect energy consumption, and how planning and effective furnace maintenance and monitoring can result in optimised energy use.
Part B presents an action plan which summarises energy-related aspects of furnace design and operation and the measures necessary to reduce energy consumption.
Part C describes examples and case histories of good practice for continuous reheating furnaces.
NB: The general heading of continuous reheating furnaces includes those used to reheat steel for forging. Although continuous forge furnaces are not specifically referred to in this Guide, the general principles of design and operation which i t describes still apply. Continuous heat treatment furnaces are not considered, because their purpose and often their design are different from those of continuous reheating furnaces used for rolling.
4
PART A: OPERATIONAL ASPECTS OF REHEATING FURNACES
For most furnaces, operational aspects have a very significant influence on energy use, and changes in operating practice, within the limitations of furnace design and installed equipment, can often reduce energy consumption. In this section, the operational aspects of furnaces are considered and the effects of poor control or practice on energy consumption are highlighted. Possible improvements are suggested.
Operational strategies depend on the control facilities available. Simple manual adjustment of the furnace conditions can limit operational flexibility, while attaining optimum control is highly dependent on the experience of the operator. Standard procedures and rules provide the operator with the information needed to change parameters for different throughput, stock quality, stock size and delay conditions. These rules, which are empirically derived, may be difficult to apply when complex heating schedules are encountered, or to change when the furnace specification or objectives are altered.
Although computer control of furnaces has been used successfully for many years on large reheating furnaces, it is only recently that computer hardware costs have reached a level where sophisticated control systems can be economically justified for the majority of furnaces. Computer-based control systems remove some of the dependence on the operator’s interpretation of the ‘rules’. Simple systems can provide instructions on desired furnace settings during normal throughput and delay conditions, thus allowing consistent practice to he applied through the use of ‘look-up’ tables or ‘carpet diagrams’. More complex systems are now available that are capable of tracking material through the furnace and ‘on-line’ calculation of the thermal state of each piece of stock, while automatically adjusting the furnace operating parameters.
2. OPERATIONAL STRATEGIES
2.1 Throughput Changes
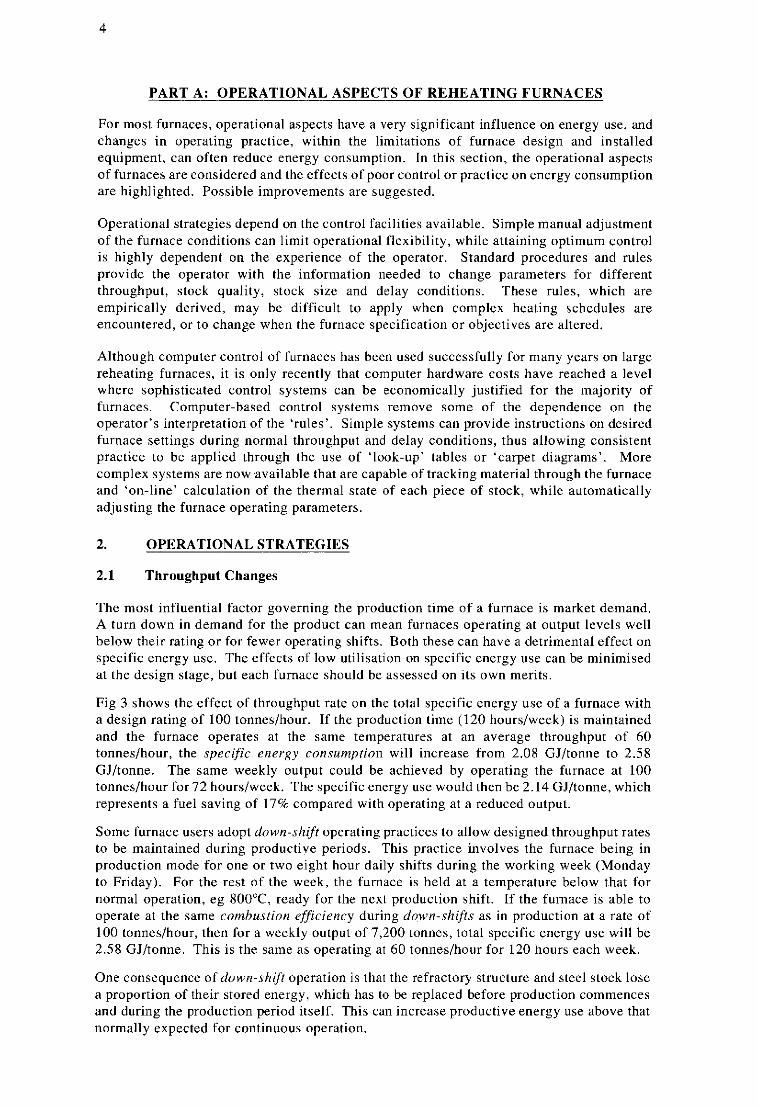
The most influential factor governing the production time of a furnace is market demand. A turn down in demand for the product can mean furnaces operating at output levels well below their rating or for fewer operating shifts. Both these can have a detrimental effect on specific energy use. The effects of low utilisation on specific energy use can he minimised at the design stage, but each furnace should be assessed on its own merits.
Fig 3 shows the effect of throughput rate on the total specific energy use of a furnace with a design rating of 100 tonnes/hour. If the production time (120 hourdweek) is maintained and the furnace operates at the same temperatures at an average throughput of 60 tonnes/hour, the specific energy consumption will increase from 2.08 GJ/tonne to 2.58 GJ/tonne. The same weekly output could be achieved by operating the furnace at 100 tonnedhow for 72 hourdweek. The specific energy use would then he 2.14 GJ/tonne, which represents a fuel saving of 17% compared with operating at a reduced output.
Some furnace users adopt down-shift operating practices to allow designed throughput rates to he maintained during productive periods. This practice involves the furnace being in production mode for one or two eight hour daily shifts during the working week (Monday to Friday). For the rest of the week, the furnace is held at a temperature below that for normal operation, eg 800°C, ready for the next production shift. If the furnace is able to operate at the same combusfion efficiency during down-shifts as in production at a rate of 100 tonnes/hour, then for a weekly output of 7,200 tonnes, total specific energy use will be 2.58 GJ/tonne. This is the same as operating at 60 tonnes/hour for 120 hours each week.
One consequence of down-shift operation is that the refractory structure and steel stock lose a proportion of their stored energy, which has to be replaced before production commences and during the production period itself. This can increase productive energy use above that normally expected for continuous operation.
5
Total specific energy consumption GJif
2.0’ 0 10 20 30 40 50 60 70 80 90 100
Throughput, tih
Fig 3 Effect of throughput rate on specific energy consumption
Alternatives to reducing furnace production hours which can help optimise energy use at reduced throughputs, include switching off burners, omitting zones or installing baffle walls to change the temperature distribution within the furnace. Care should be taken when considering these options, because they may affect the productive performance of the furnace and not he compatible with the existing furnace design.
2.2 Production Scheduling
Scheduling can significantly affect specific energy use when a furnace is used to reheat a range of stock sizes and qualities and/or there is a range of rolled product sizes. Order loads or hatches of material of the same size or quality should he scheduled together in order to avoid unnecessary changes in furnace temperature settings, throughput rate and production delays caused by mill roll changes.
2.3 Temperature Control
2.3.1 Delay Strategies
Production delays can significantly affect specific energy consumption. Production stoppages can be divided into:
unscheduled delays eg mill breakdowns, cobbles, inadequate steel discharge temperatures (heat stops) and over production for downstream processing. Some furnace users classify unscheduled delays as production or maintenance stoppages.
scheduled delays eg mill roll changes, meal breaks, etc;
b
Furnace users employ several strategies during delays to reduce fuel use, which rely on the control system and/or the experience of operators. The success of a delay strategy in minimising energy use depends on achieving optimum control settings (aidfuel ratio, furnace pressure, etc) for the range of burner firing rates and ‘good housekeeping’ practices, such as sealing doors and minimising structural energy losses.
Scheduled or Planned Delays
When scheduled or planned delays occur, acticn must be taken beforehand or immediately at the start of the delay. This usually requires the furnace operator to have some knowledge of the nature of the delay in order to estimate how long it will last. Action can take several forms depending on the predicted length of the delay, furnace temperature setting, steel quality, projected throughput (production) rates and the type of furnace.
At the start of a delay, furnace zone temperature settings can be reduced by a fixed amount or to a fixed temperature, depending on the factors mentioned above. Towards the anticipated end of the delay, temperatures are increased either to normal production levels or to a lower fixed setting that will allow normal production to continue. If necessary, the temperature settings can he adjusted to normal levels when a steady output is achieved.
When delay strategies are employed, the temperatures of the tonnage zone and soak zone are often reduced by different amounts. Fig 4 shows the delay strategies for the heating or tonnuge i o n e and the soak ione for a walking beam type furnace reheating square billets.
With walking beam and walking hearth type furnaces it is possible, when the scheduled delays are relatively short, to charge a ‘gap’ in the stream of stock travelling through the furnace. When the ‘gap’ reaches the discharge position, the delay process commences even though the furnace is effectively being operated at a constant throughput rate. When the stock following the ‘gap’ reaches the discharge position, which is timed to coincide with the end of the delay, production can continue. In such instances, the furnace zone temperature settings can either he reduced in case the delay is longer than expected or maintained at normal production levels.
Furnaces with automatic or computer controlled delay strategies may incorporate stock tracking systems which enable furnace temperatures to be changed in response to changes in throughput rate. In such cases, it is common for zone temperatures to he held below those used for normal production either until a specified number of stock pieces or a certain production rate has been achieved, once the delay has ended.
Many scheduled delays are due to changes in product size and quality, and i t is usual practice to check product sizes or sections by processing trial pieces of stock. The number of pieces and whether they are rolled or rejected, depends on circumstances, but it means that normal production does not commence with the discharge of the first piece of stock.
Some planned delays can be compensated for by operating the furnace at its maximum (or greater) throughput rate for a short period before the delay starts. Under normal circumstances, maintaining a higher throughput rate would eventually result in stock being discharged at a temperature below that required for satisfactory rolling. If this particular stock arrives at the discharge end of the furnace at the start of the delay, then normal temperature settings can be maintained for a time. This allows the stock to achieve its normal condition by the end of the delay. This strategy is often employed on reheating furnaces of less than 100 tonnes/hour capacity with moderate control facilities and where fixed time delays regularly occur eg meal breaks.
900' 0 10 20 30 40 50 60 70 80 90 100 110 120
Time to end 01 delay, min Healing Zone Delay Strategy
Furnace Start of Start of Start of 30 min delay 60 min delay 120 min delay
- Examples of set furnace temperature
Set furnace temperature _ _ 1150 for intermediate delay times
\
1100 -
1050-
1000-
950 -
900' 0 1; ;o 30 do ;o 60 70 80 90 Id0 1;o 1;o Time to end of delay, min
Soak Zone Delay Strategy
Fig 4 Delay strategy for a walking beam type furnace reheating 140mm square billets

8
Unscheduled or Unplanned Delays
Unplanned delays can be caused by stoppages on the rolling mill or the furnace. If mill delays occur because of break downs or cobbles, furnace zone temperature settings can be reduced by a nominal amount (eg 50°C in the tonnage zone and 10°C in the souk zones), without seriously affecting stock temperatures. When the time between pieces being discharged is greater than a set period, computer controlled systems are able to automatically reduce settings by fixed amounts or to fixed levels. In’such cases, operators can revert to scheduled delay strategies once they have assessed the cause of the delay and predicted the approximate delay time.
Some furnace control systems allow zone temperature settings to be reduced to the stock temperatures in that zone during unplanned delays. Control based on direct stock temperature measurement permits individual zones to be reduced to the measured stock temperature, when production stops. When production resumes, the stock is in a suitable condition for rolling and furnace temperatures can be returned to normal. An example of direct stock temperature control using optical pyrometers is described in Section 6.4.
Inadequate stock discharge temperatures can result in more rejects and poor product quality. In this case, discharge is usually stopped to allow stock temperatures to recover to an acceptable level ie a ‘heat stop’. Heat stops can be deliberately planned. If throughput rates are increased, then zone temperature settings must be increased accordingly to maintain stock temperatures or the stock will be below the required temperature; this will eventually result in a heat-stop.
Heat-stops can also occur after a short period of production following a delay. If a high production rate follows a delay, then stock in the soak zone and possibly part of the heating zone should be at a temperature suitable for rolling. However, the stock at the charge end will be relatively cold and will travel through the furnace so fast that it will not be heated to temperature. Control systems exist which use direct stock temperature measurement or stock temperature prediction to change zone temperatures and accommodate this situation.
Some production processes operate in batch mode because of high production demands for short periods. These may he imposed by practical constraints such as limited storage space or cooling bed facilities, or process requirements such as the need to operate controlled cooling or heat treatment facilities. Activities downstream of the furnace can dictate operational requirements and continuous furnaces operating in batch mode may need to adopt heat-stop practices to satisfy the overall process.
2.3.2 Light-Up Practice
Few continuous furnaces operate for all seven days of the week. Most furnaces are shut-down at weekends and are then lit some time before production is scheduled to begin. During the shut-down period, repairs may be carried out and any maintenance work eg scale removal undertaken. Depending on the length of the shut-down, the furnace may have to be force-cooled in order to reduce the temperature to allow access for the work crew. Forced cooling is achieved by opening the furnace doors; air blowers may be used, but more often combustion air to the burners is left on. The heat stored in the furnace refractories and any stock left in the furnace is lost and must be replaced during the light-up shift.
Many furnace users operate with established light-up procedures based on experience or ‘rules of thumb’ which aim to protect refractories, burners and any steel in the furnace from thermal shock or excessive heating rates. The amount of fuel energy used during light-up can account for more than 5% of the total used during a week of operation. Savings are often readily attainable.
Furnaces requiring no internal maintenance or repair at weekends should be sealed. Doors and openings should be closed to minimise the heat loss from the refractory structure and
9
steel stock (provided metallurgical constraints allow). Maintenance and repair programmes should be examined with respect to production schedules. Some types of maintenance may not be necessary every weekend. By reviewing and modifying operating practices, light-up fuel use and light-up times can be reduced.
Excessive fuel use during light-up is often due to longer than necessary light-up times. In many cases, the light-up period is fixed irrespective of the length of shut-down or whether the furnace was cooled for access or sealed to retain heat.
During light-up, up to 40% of the fuel energy input is stored in the furnace refractories (depending on the type design and construction of the furnace). The use of low thermal mass materials for construction or lining can reduce stored energy by up to 80% and give substantial fuel savings. There are restrictions on the use of such materials because of operating temperature limits and their suitability for use with mixed gas and oil burners.
2.3.3 Furnace Temperature Profiles
Furnace temperature profiles can affect energy use. There are two operating temperature philosophies used during production in multi-zone furnaces:
0 operating the heating zone at a temperature less than or equal to the that of the soak zones;
operating the heating zone at a higher temperature than the soak zones 0
Both cases will yield stock at the desired discharge temperature, hut with a different thermal history inside the furnace. The choice of operating practice depends on the steel quality, stock size, metallurgical requirements and throughput rate.
In multi-zone furnaces where the exhaust gases leave at the cold (or charge) end, their temperature is dependent on the furnace temperature profile. If the heating zone is operated at a higher temperature than the soak zone, the exhaust gases will have a higher temperature than if the opposite profile was used. In addition, the combustion products from the soak zone are heated to the heating zone gas temperature before passing to the exhaust flues. Therefore, the thermal capacity of the heating zone burners has to be higher if the soak zone gases are at a lower temperature than those in the heating zone.
Example
Calculations have been made for a two-zone top fired pusher furnace designed to heat 75 mm thick slabs at 70 tonne/hour. This illustrates the effects of operating temperature profiles on furnace fuel requirements and demonstrates their influence on stock temperature profiles.
Fig 5 shows the predicted stock temperatures for the furnace operating with the soak :one at a higher temperature than the tonnage zone (Case A) and with the soak zone at a lower temperature than the tonnage zone (Case B). It should be noted that the stock temperature gradient for Case A is less than that for Case B. This may be an important consideration when reheating some steel qualities. In Case B, the stock is at a higher temperature for a longer period. This factor will affect scaling rates and subsequently product yield and quality, and could be relevant in the choice of zone temperature settings.
At discharge, stock temperature is more uniform at the lower souk zone temperature setting (Case B).
In Case A, the stock enters the soak zone about 80 min after being charged with a mean bulk temperature of 1,135"C. In Case B, it enters at 1,180"C. The soak zone therefore needs a greater thermal input in Case A than in Case E, in order to satisfy the discharge temperature requirements.

10
Ternf
1200
1100
1000
900
800
700
600
500
400
300
200
100
iture, "C
I Heating zone , v: Soak,zone 1
0 0 10 20 30 40 50 60 70 80 90 100
% 01 furnace length travelled by stock
Fig 5 Predicted stock temperature profiles
Since the total thermal input to the furnace is approximately the same for both Case A and Case B (because assumptions about the condition of the exhaust gases gives the same combustion efficiency), the distribution of the total heat input to the zones will be different. This is an important factor at both the design stage and in operation of the furnace. A change in operating temperature philosophy could result in either zone having a thermal rating greater or less than required, leading to a failure to achieve productivity levels, poor product quality and poor furnace control.
11
3. HOT CHARGING
In 1990, approximately 10% of the total steel tonnage processed in the UK was hot charged to continuous reheating furnaces. The trend towards hot charging has followed the increase in production of semi-finished steel products by the continuous casting route (after taking market demand into account). Hot charging is recognised as an efficient technique in terms of energy use and productivity, but its use is limited at some sites because of plant layout and operational logistics.
3.1 Benefits of Hot Charging
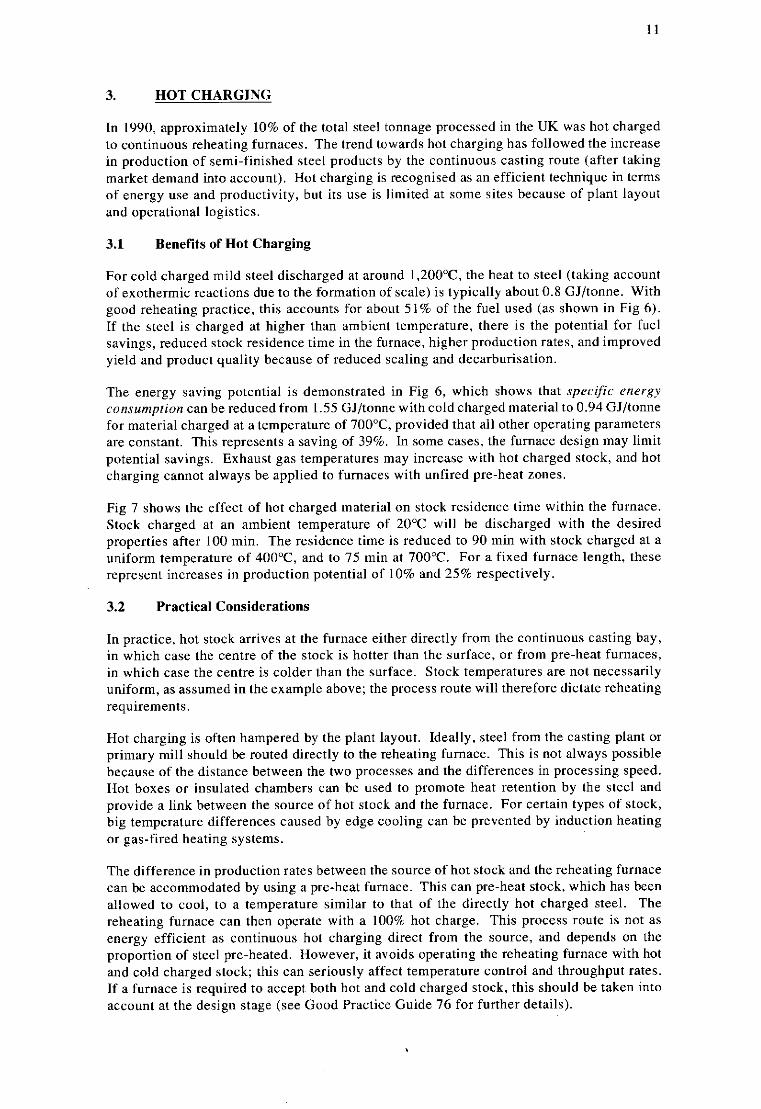
For cold charged mild steel discharged at around 1,200"C, the heat to steel (taking account of exothermic reactions due to the formation of scale) is typically about 0.8 GJ/tonne. With good reheating practice, this accounts for about 51% of the fuel used (as shown in Fig 6 ) . If the steel is charged at higher than ambient temperature, there is the potential for fuel savings, reduced stock residence time in the furnace, higher production rates, and improved yield and product quality because of reduced scaling and decarburisation.
The energy saving potential is demonstrated in Fig 6, which shows that specific energy consumption can be reduced from 1.55 GJ/tonne with cold charged material to 0.94 GJ/tonne for material charged at a temperature of 700"C, provided that all other operating parameters are constant. This represents a saving of 39%. In some cases, the furnace design may limit potential savings. Exhaust gas temperatures may increase with hot charged stock, and hot charging cannot always be applied to furnaces with unfired pre-heat zones.
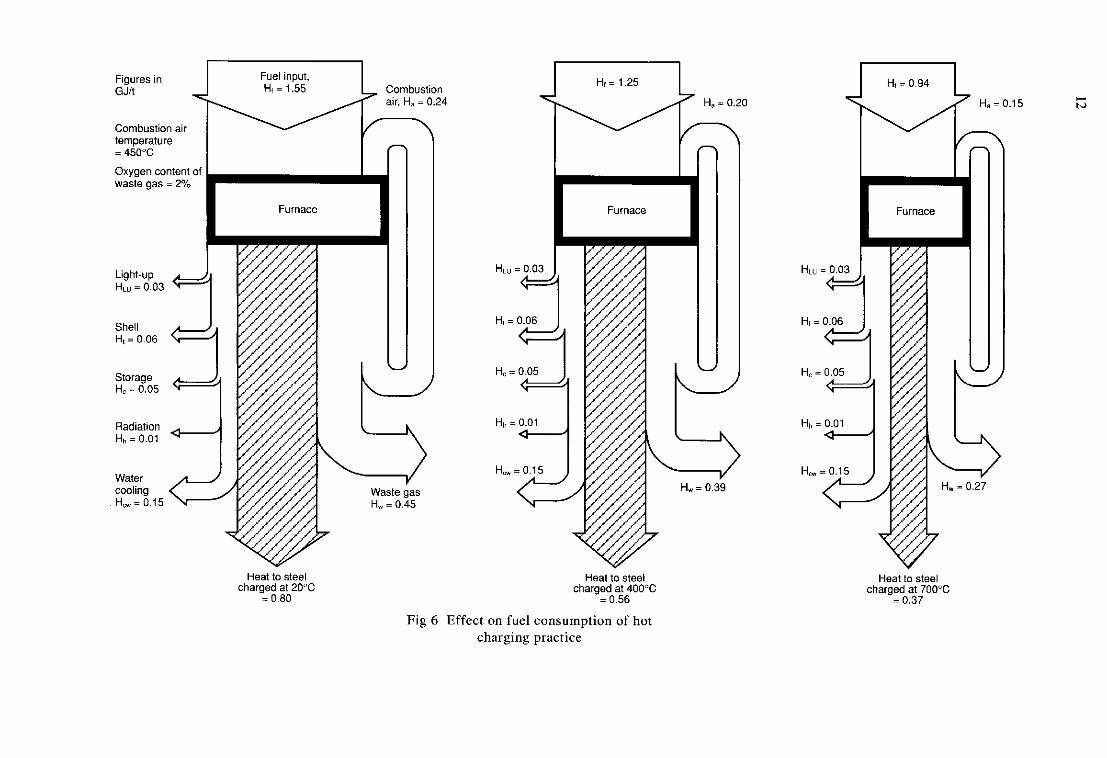
Fig 7 shows the effect of hot charged material on stock residence time within the furnace. Stock charged at an ambient temperature of 20°C will be discharged with the desired properties after 100 min. The residence time is reduced to 90 min with stock charged at a uniform temperature of 400"C, and to 75 min at 700°C. For a fixed furnace length, these represent increases in production potential of 10% and 25% respectively.
3.2 Practical Considerations
In practice, hot stock arrives at the furnace either directly from the continuous casting bay, in which case the centre of the stock is hotter than the surface, or from pre-heat furnaces, in which case the centre is colder than the surface. Stock temperatures are not necessarily uniform, as assumed in the example above; the process route will therefore dictate reheating requirements.
Hot charging is often hampered by the plant layout. Ideally, steel from the casting plant or primary mill should be routed directly to the reheating furnace. This is not always possible because of the distance between the two processes and the differences in processing speed. Hot boxes or insulated chambers can be used to promote heat retention by the steel and provide a link between the source of hot stock and the furnace. For certain types of stock, big temperature differences caused by edge cooling can be prevented by induction heating or gas-fired heating systems.
The difference in production rates between the source of hot stock and the reheating furnace can be accommodated by using a pre-heat furnace. This can pre-heat stock, which has been allowed to cool, to a temperature similar to that of the directly hot charged steel. The reheating furnace can then operate with a 100% hot charge. This process route is not as energy efficient as continuous hot charging direct from the source, and depends on the proportion of steel pre-heated. However, it avoids operating the reheating furnace with hot and cold charged stock; this can seriously affect temperature control and throughput rates. If a furnace is required to accept both hot and cold charged stock, this should be taken into account at the design stage (see Good Practice Guide 76 for further details).
I I
Oxygen content of waste gas = 2%
HI = 1.25
H, = 0.20
Heat to steel charged at 20°C
= 0.80
Heal to steel charged at 400°C
Fig 6 Effect on fuel consumption of hot charging practice
= 0.56
Heat to steel charged at 700°C
= 0.37
1.15
13
Based on:
1. 2. Mild steel 3. Top fired pusher furnace 4. 1250°C furnace temperature 5.
100 m m x 100 m m x 10.0 m billets
Stock discharged with a mean bulk temperature of 1200°C and maximum temperature difference of 25°C
Temperature, ‘C 1300 r
Mean bulk temperature of stock charged at:-
1200
1100
1000
-
-
-
Billet residence time. min
Fig 7 Effect of hot charging on stock residence time
Methods also exist for reducing the furnace operating temperature and preventing heat loss between the furnace and rolling mill. Insulated shields e.g. Encopanels (heat retaining covers) between the furnace discharge and the rolling mill prevent excessive heat losses from the steel. These are particularly beneficial in automated mills where the stock often has to travel long distances between the furnace and mill or on a delay table between stands.
3.2.1 Cold Rolling
In terms of energy use, ‘cold rolling’ can achieve similar benefits to hot charging. Cold rolling involves rolling the stock at a significantly lower mean bulk temperature. This means that lower steel discharge temperatures can be tolerated and furnace fuel consumption reduced. Special rolling mill facilities are required for cold rolling, and the technique is not suitable for all steel qualities and sizes.

14
4. PERFORMANCE MONITORING AND MAINTENANCE
In order to achieve and maintain energy savings, while making the best use of existing equipment, it is important to have effective procedures for energy monitoring and maintenance. This section examines performance monitoring and demonstrates how careful attention to maintenance can help to sustain efficient fuel use. In addition to making measurements and adjusting control settings regularly, it is suggested that a rigorous monitoring exercise should be undertaken every six to twelve months. Such a monitoring programme, plus spasmodic analysis of the specific energy use, should indicate deteriorations or improvements in performance.
When operating a performance programme it is important to understand the principles of combustion systems, furnace design and installed equipment as described in Good Practice Guide 76. Expert agencies and organisations, such as furnace builders, energy consultants and equipment suppliers, are also available for detailed assessments or advice.
4.1 Heat Recovery Systems
The recovery of heat from the furnace exhaust gases and its return to the furnace can have a significant effect on energy use. The efficiency of heat recovery systems is affected by:
leakage;
insufficient furnace extraction;
poor airlfuel ratio control.
the use of dilution air;
inadequate insulation of hot air mains;
cold air infiltration into the furnace;
The last two, which are discussed in Good Practice Guide 76, are detrimental from both a metallurgical and energy viewpoint, although their influence on energy consumption diminishes as the pre-heat temperature increases. However, insufficient furnace extraction has a major influence, whichever type of heat recovery system is used.
4.1.1 External Recuperators
External recuperators, discussed in Good Practice Guide 76, are the most commonly used type of waste heat recovery system. Modern recuperators allow combustion air temperatures in excess of 500°C to be achieved. Exhaust gas temperatures at the inlet to the recuperator are usually limited to l,OOO°C in order to increase the life of the unit. As most continuous furnace designs include an unfired stock pre-heating or stock recuperation zone, exhaust gas temperatures leaving the charge end in excess of 1,OOO"C are unusual. Temperatures grater than 1,OOO"C can occur if the furnace temperature control is inadequate at low or moderate throughput rates, if the stock recuperation zone is too short, or at very high burner firing and tonnage throughput rates. In order to protect the recuperator, cold air is normally added to the exhaust gases to reduce the inlet temperature to an acceptable level. In a properly designed system, the addition of dilution air has no serious effect on the temperature of the pre-heated air, but there are potential problems with over pressurisation of the furnace if gas extraction rates are not adequately accommodated.
Damage to recuperators can result in air leaking into the exhaust gas steam or the blockage of gas or air passages. This will exacerbate any extraction problems, affect the air/fuel ratios at the burners and alter air pre-heat temperatures.

15
Operational faults are potentially the most serious and often avoidable. The most common are:
incorrect operation of dilution air fans;
incorrect siting of measuring or control thermocouples;
poor furnace control resulting in unburnt fuel entering the recuperator.
The optimisation of furnace operating procedures for maximum production can affect recuperator performance. For example, operating the fired pre-heat zone of a multi-zone furnace at a higher fuel rate than i t is designed for, may result in excessive exhaust gas temperatures and accelerated corrosion of the recuperator, depending on the type of fuel used.
Four main forms of corrosion occur in recuperators:
oxidation or scaling due to the presence of oxygen, water vapour and carbon dioxide in the exhaust gases and air being pre-heated.
sulphur attack. This depends on the type of fuel used and the gas temperature. Acid attack occurs if the fuel contains sulphur, excess air conditions prevail and the gas temperature drops below the acid dew point of the exhaust gases. The sulphur reacts with oxygen in the excess air to form sulphur dioxide and sulphur trioxide. If a sulphur-containing fuel is burnt with insufficient air, hydrogen sulphide is formed. This does not seriously attack mild steel, but can cause problems at high temperatures with certain alloys.
accelerated oxidation and wear, caused by the deposit of low melting point compounds in the heating surface of the recuperator. These compounds are formed during combustion of heavy fuel oils which contain small amounts of inorganic matter.
metal erosion caused by exhaust gases containing large amounts of carbon monoxide at temperatures in excess of over 900°C.
Protecting the recuperator from high gas temperatures improves productivity by extending recuperator life. As well as using dilution air, water sprays can also be utilised. When operating such protection systems, care must be taken to avoid 'on-off' control and rapid cooling of the gases. This can result in uneven cooling of the recuperator, causing cracking or removal of the oxide film, thus accelerating wear.
An alternative protection method is to pass more air than required for combustion through the recuperator and bleed or blow-off the excess before the burners.
To maximise the benefits of pre-heated combustion air in terms of energy savings, it is important to achieve as high a temperature as possible at the burner. The drop in air temperature between the recuperator and burner can be significant. For example, if the air temperature at the burner is 500"C, a furnace with exhaust gas at 1,000"C and operating with 15% excess combustion air (assuming no air infiltration) would have a combustion efficiency of 63%. With an air temperature of 400°C at the burner, the combustion efficiency would be 59%, representing a 6% increase in fuel provided that all other conditions were constant. This highlights the importance of adequately insulating air mains. The temperature of the gas entering the burner should be checked using a suction pyrometer.
4.1.2 Regenerative and Se[fRecuperative Burners
Waste heat recovery using regenerative or self-recuperative burners is discussed in Good Practice Guide 76. Such systems require some specialist knowledge to obtain optimum performance. With regenerative burners, about 90% of the combustion products are
16
exhausted through the regenerators, the remainder being used for pressure control of the furnace. Correct setting of extraction rates and aidgas flows is essential to obtain optimum burner efficiency and maximise air pre-heat temperatures.
The high pre-heated combustion air temperatures achieved with regenerative burners means that cold air infiltration and poor aidfuel ratio control are not so detrimental to fuel efficiency as with cold combustion air or systems which operate at lower pre-heat temperatures. These factors can affect furnace control and have metallurgical consequences.
Leaks at the reversing valves of regenerative burners can affect their performance, and the system should be monitored and maintained to avoid long term problems. In addition, the ceramic regenerator bed needs to cleaned regularly to maintain operation efficiency; this can usually be done ‘in-house’.
The factors causing corrosion in external recuperators also apply to regenerative and self-recuperative burners.
4.2 A i r h e 1 Ratio Settings
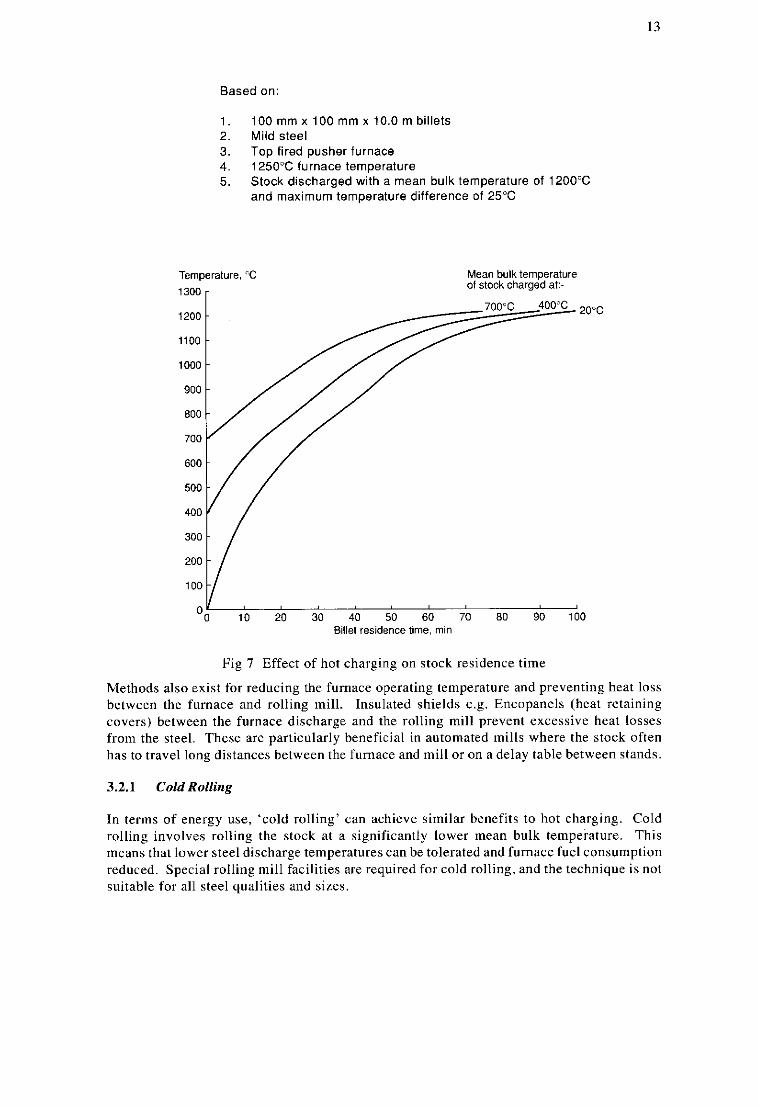
As discussed in Good Practice Guide 76, reheating furnaces have some form of automatic air/fuel ratio control, and independent control of zones or individual burners is common in multi-zone furnaces. Good Practice Guide 76 also explains the importance of air/fuel ratios in achieving efficient combustion conditions. For optimum efficiency, the air/fuel ratio should be adjusted to the minimum tolerable within metallurgical and safety constraints. This may mean operating different zones at different ratios. For example, to satisfy scaling requirements it may be necessary to operate the soak zones at a higher ratio than the heating zone (where scaling is less prominent), or in order to take account of the interaction between zones. The air/fuel ratio should be checked regularly by analysing exhaust gas or furnace gas composition and relating the oxygen and carbon dioxide content to excess air levels. The ratio should be maintained throughout the burner firing range and the controllers should be checked so that any drift in their setting that may occur during an operating campaign can be corrected. Fig 8 shows the relationship between excess combustion air levels and the oxygen and carbon dioxide content of the exhaust gas produced using natural gas and heavy fuel oil. Composition of
combustion products % (W - Natural gas 16 _ - - Heavy fuel oil
\
13
12
11
10
9
8
7
6
5
4
\ \ 13 -
2 / ‘0 20 40 60 80 100 120 140 160
Excess combustion air level. %
Fig 8 Relationship between excess combustion air level and composition of combustion products

17
This theoretical relationship is not completely true in practice, Relating excess combustion air levels to exhaust or waste gas oxygen is a simplistic approach, which is approximately valid for most situations. The scaling of steel depends on time, the temperature and the composition of the furnace atmosphere. Consequently, the theoretical oxygen concentration of the combustion products derived from the aidfuel ratio will be higher than the oxygen concentration of the gases leaving the furnace, because a proportion of the oxygen is used to form the scale. Depending on the steel quality, operating temperatures and throughput rate, the difference in oxygen concentration can be significant, particularly if a certain amount or quality of scale is required. Under some circumstances, measurement of carbon dioxide conc.entration may provide a better estimate of the aidfuel ratio.
It should be noted that, for most steel qualities that are reheated, the scale formed consists of about 90% ferrous oxide (FeO) and 10% ferric oxide (Fe304) by weight. Each tonne of scale formed requires 0.7 tonne of iron (which represents a yield loss from the weight of steel charged) and 0.23 tonne of oxygen (equivalent to 756 m3 of air). The heat released by the formation of scale amounts to 5.16 MJ/tonne of iron, which for a yield loss of 1% is equivalent to 0.05 GJ/tonne charged. Typically the yield loss, due to the formation of scale during reheating, is between 1.0 - 1.5% of the charge weight.
In some furnaces, the installed burners may have a minimum air flow setting at low fire which can result in high ratios when the furnace is working well below its designed throughput or during production delays. If this is a frequent operating condition, it can have a detrimental effect on overall fuel efficiency. In such cases, i t may be advantageous to turn off some of the burners in a zone, thus allowing the remainder to operate at a higher fuel input rate with a better air/fuel ratio control. In extreme cases where the installed burners are over-rated so that they always operate at the lower end of their turn-down range, it may be necessary to consider replacing them.
4.3 Furnace Pressure
Positive pressure levels must he controlled in the interest of fuel efficiency, environmental effects, possible structural damage to the furnace and also to avoid back pressures which could interfere with fuel (especially gaseous) and combustion air flows (see Good Practice Guide 76). The positive pressure maintained at the stock level is normally quite low, a few hundredths of an inch water gauge. Control is usually achieved by manually or automatically adjusting the opening of a damper in the flue stack.
Cold air drawn into a furnace operating under a negative pressure effectively changes the air/fuel ratio. This air is heated to the furnace temperature before being exhausted with the combustion products. It thus has a detrimental effect on combustion efliciency. Excess oxygen in the furnace atmosphere can also affect product quality.
During furnace operation, conditions may change for a variety of reasons. Burner firing rates can change by a factor of 10 to 1, furnace temperatures can fluctuate or cycle, and door seals may deteriorate during a campaign causing the pressure in the furnace to change. It is therefore essential to maintain the flue damper and pressure probe in good working order.
4.4 Environmental Considerations
Prescribed processes in the iron and steel industry will become subject to the provisions of Part I of the Environmental Protection Act 1990 on 1 January 1995. Applications for authorisation will have to be submitted to HM Inspectorate of Pollution (HMIP) for Part A processes subject to Integrated Pollution Control, and to the local authority for Part B processes subject to air pollution control. Furnace users will have to comply with specified emission limits for certain pollutants. The objective of the 1990 Act is to ensure that the ‘best available techniques not entailing excessive cost’ (BATNEEC) are used to prevent or, where that is not practicable, to minimise the release of harmful substances into the environment.

18
The regulation of emissions of particulate matter, sulphur oxides (SO,) and nitrogen oxides (NOx) depend on the thermal rating of the furnace, the type of fuel used and the temperature of the pre-heated combustion air. It is beyond the scope of this Guide to discuss all the relevant details of environmental legislation, and furnace users are advised to consult the appropriate authority for information about the legislation and/or their obligations.
Compliance with specified emission levels may influence the choice of fuel, burners, heat recovery equipment and control systems for new and refurbished furnaces. For both existing and new furnaces, performance monitoring and maintenance will play an important part in ensuring regulatory compliance. The optimisation of aidfuel ratios, waste gas temperature and pre-heated air temperature control settings and operational procedures will not only save energy and improve efficiency, but will also help to control emissions to the environment.
19
PART B: ACTION PLAN
This part of the Guide provides an action plan for the operational aspects of continuous reheating furnaces. Good Practice Guide 76 provides a similar plan when considering specification, design and equipment aspects.
A number of agencies and organisations offer advice on all aspects of furnace design and operation. These include furnace builders, energy consultants, and equipment and materials suppliers. For detailed furnace assessment, performance monitoring and major improve- ments such organisations are probably best placed to offer advice and help.
For most furnace users, there is usually sufficient technical competence ‘in-house’ to allow many inexpensive steps to be taken that achieve significant energy savings. As a first step, an overall energy balance for the furnace should be prepared. This requires wall (structural) temperatures and steel discharge temperatures to be measured, and some knowledge of typical waste gas conditions. The energy balance will highlight areas where energy is being wasted and give some indication of the potential for improvement. Appendix 2 provides useful technical data for calculating the heat content of exhaust gases and the heat content of steel. Help should be sought from appropriate organisations for those measurements which require special equipment or expertise.
The following sections summarise the major considerations in optimising the energy use of existing furnaces.
5. OPERATIONAL CONSIDERATIONS
The following methods are available to indicate levels of furnace performance and efficiency:
constructing energy balances;
comparing performance with the design specification and objectives;
analysing energy and production statistics using statistical process control (SPC) techniques or cumulative error analysis (CUSUM) methods;
comparing performance with similar furnaces and practices . 1
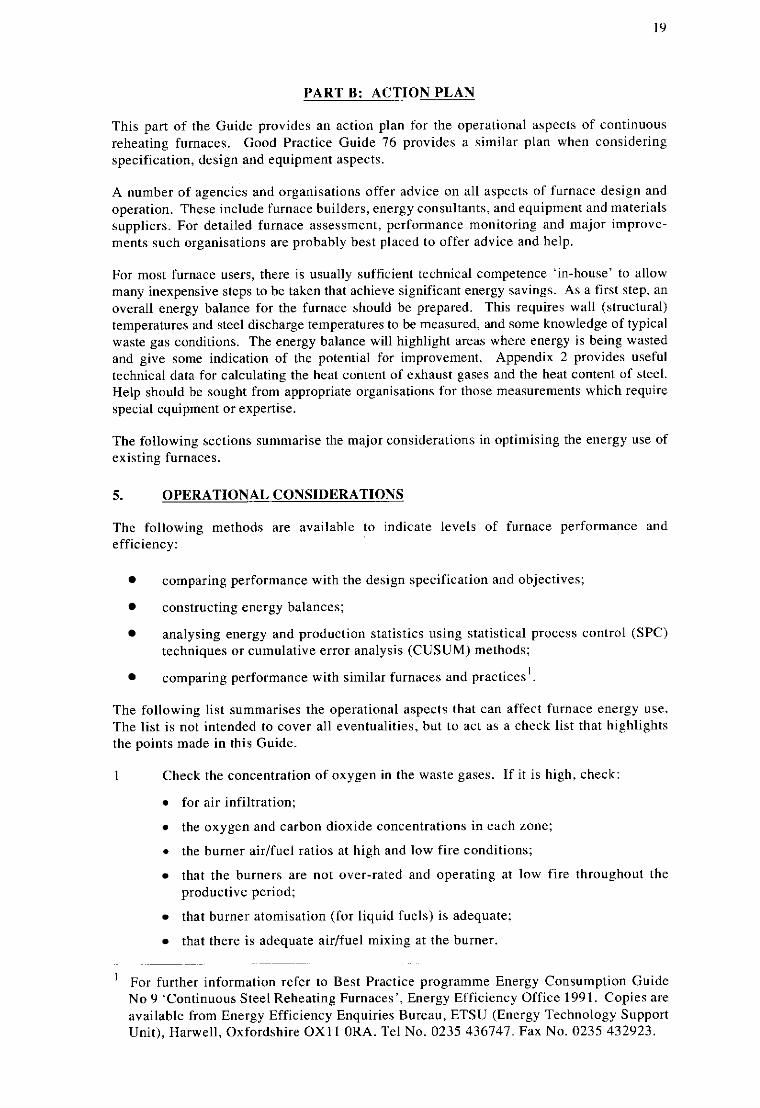
The following list summarises the operational aspects that can affect furnace energy use. The list is not intended to cover all eventualities, but to act as a check list that highlights the points made in this Guide.
1 Check the concentration of oxygen in the waste gases. If it is high, check:
for air infiltration;
the oxygen and carbon dioxide concentrations in each zone; . the burner aidfuel ratios at high and low fire conditions;
that the burners are not over-rated and operating at low fire throughout the productive period:
that burner atomisation (for liquid fuels) is adequate;
that there is adequate air/fuel mixing at the burner. ~~~~~~ ~____ ~ ~~ ~
For further information refer to Best Practice programme Energy Consumption Guide No 9 ‘Continuous Steel Reheating Furnaces’, Energy Efficiency Office 1991. Copies are avaibdble from Energy Efficiency Enquiries Bureau, ETSU (Energy Technology Support Unit), Harwell, Oxfordshire OX1 I ORA. Tel No. 0235 436747. Fax No. 0235 432923.

20
If the oxygen content is zero, check for the presence of carbon monoxide and take appropriate action.
Aim for between 2 - 3% oxygen (on a dry gas basis) in the exhaust or waste gases, provided metallurgical constraints allow.
2 Check the temperature of the pre-heated combustion air using a suction pyrometer. Failure to achieve the designed temperature could be the result of:
excessively high combustion air flow (air/fuel ratio too high);
a blocked or leaking recuperator;
poor recuperator design;
exhaust gas extraction is too low (poor furnace pressure control);
inadequate insulation of air mains.
The pre-heat temperature should he measured at the burners, if possible.
Check for air infiltration through openings (doors and sight holes) in the furnace using a smoke filament. If air ingress is evident check that:
the pressure probe is correctly sited;
the pressure probe is not blocked;
the flue damper is not damaged or stuck;
the damper is being correctly adjusted (if manually controlled);
there is adequate exhaust gas extraction (fan ratings); . the flue is not blocked by scale or refractory bricks;
the flue stack is the correct height;
the discharge chute (for gravity discharged furnaces) is of the optimum design.
In the last case, consideration should be given to installing a metallic mesh curtain and ensuring that doors are closed whenever possible.
If hot gas emissions or flames are observed through openings in the furnace, this could be because:
the furnace pressure control setting is too high;
there is inadequate exhaust gas extraction;
the pressure probe is poorly sited;
the pressure probe i s blocked;
the flue damper is damaged or stuck;
the damper is not being adjusted (manual control);
the flue stack is too short or the wrong size:
there is poor air/fuel ratio control causing fuel to he burnt outside the furnace; . the furnace design is inadequate with insufficient combustion volume; . there is poor mixing of air and fuel at the burner;
the exhaust gas flue is poorly sited.
Furnace pressure should be set at no more than 0.02 inches water gauge at the stock or hearth level.
3
4

21
5 Measure the temperature of the stock at a suitable position after discharge. Failure to achieve the desired discharge condition could indicate that:
the automatic temperature controllers are set incorrectly;
the furnace control thermocouples are badly sited:
the control thermocouples are damaged or badly calibrated;
the furnace throughput is higher than the design rating; . the thermal input is insufficient;
the selection of control zones (furnace design) is poor;
the furnace specification has changed (stock size, quality, etc.).
6 Measure the surface (structural) temperatures of the furnace and estimate structural energy losses. If these are excessive, the cause may he:
damaged refractory brickwork (inadequate maintenance and repair); . wrong choice of refractory materials;
openings in the furnace structure (sight holes, missing bricks): . ceramic fibre (low thermal mass) lining or veneer missing or damaged
If the energy balance indicates high structural energy losses that cannot be attributed to the above, then other aspects that should be examined, including:
. operation of the furnace doors. These should not be left open for excessively long periods: . furnace operating procedures. The furnace should be sealed at weekends if possible;
the condition of the door seals.
I Energy losses through the water cooling systems should be determined. If these are high or have deteriorated during the operating campaign, this may he due to:
inadequate insulation coverage;
incorrect choice of insulation;
high insulation failure rates due to vibration, poor installation, chemical attack, etc;
over design of the system with too many cooled components.
8 Energy use during delay periods should be examined. If energy use is excessive compared with productive periods, the possible cause could he:
furnace temperatures are not reduced;
air/fuel ratio control is poor at low burner firing rates;
doors are left open or are poorly sealed
9 Furnace light-up energy consumption should be examined. Factors which should he considered are:
furnace temperature ramps;
furnace sealing during shut-down;
light-up time (is it too long?);

22
the scheduling strategy (to avoid waiting for stock when production is due to commence):
the condition and operation of furnace doors;
the use of low thermal mass and insulating materials;
the general condition of the furnace structure.
Using the information presented in this Guide, furnace users should be able to achieve immediate energy savings through simple low cost measures. Objectives for energy savings should he set with realistic targets and measurable goals. Energy saving requires continuous effort if it is to be effective, and uo potential saving should he considered too small to he worth the effort. With a commitment from all employees and a greater awareness of energy costs, significant improvements in energy efficiency and cost savings can be made, from which everyone will benefit.
The motive for energy savings is, ultimately, cost savings.
23
+
PART C: CASE HISTORIES OF GOOD FURNACE PRACTICE
Many of the techniques described in this Guide and Good Practice Guide 76 have been successfully applied to UK furnaces, often through projects supported by the Energy Efficiency Office. The following case histories illustrate the technologies available.
Heating zones Soak zones
Stock travel
6. CASE HISTORIES
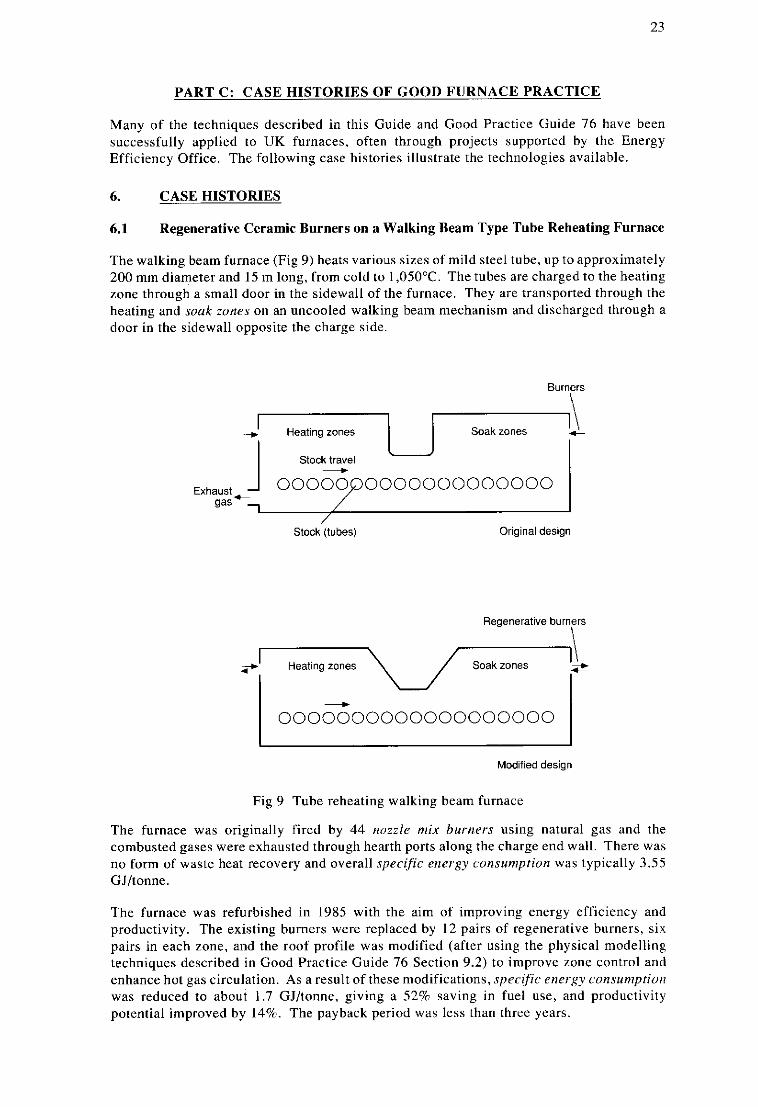
6.1 Regenerative Ceramic Burners on a Walking Beam Type Tube Reheating Furnace
The walking beam furnace (Fig 9) heats various sizes of mild steel tube, up to approximately 200 mm diameter and 15 m long, from cold to 1,050"C. The tubes are charged to the heating zone through a small door in the sidewall of the furnace. They are transported through the heating and soak zones on an uncooled walking beam mechanism and discharged through a door in the sidewall opposite the charge side.
Burners
\
Exhaust, -I 00000 0000000000000 gas -,
/ I
Stock (tubes) Original design
Regenerative burners
0000000000000000000
Modified design
Fig 9 Tube reheating walking beam furnace
The furnace was originally fired by 44 nozzle mix burners using natural gas and the combusted gases were exhausted through hearth ports along the charge end wall. There was no form of waste heat recovery and overall specific energy consumption was typically 3.55 GJItonne.
The furnace was refurbished in 1985 with the aim of improving energy efficiency and productivity. The existing burners were replaced by 12 p a i n of regenerative burners, six pairs in each zone, and the roof profile was modified (after using the physical modelling techniques described in Good Practice Guide 76 Section 9.2) to improve zone control and enhance hot gas circulation. As a result of these modifications, specific energy consumption was reduced to about 1.7 GJ/tonne, giving a 52% saving in fuel use, and productivity potential improved by 14%. The payback period was less than three years.

24
6.2 Hot Charging Practice and Regenerative Ceramic Burners on a Walking Beam Furnace at UES Aldwarke Works
At United Engineering Steels Ltd's Aldwarke Works, there are two identical walking beam furnaces (Fig 10), each with a maximum throughput capability of 175 tonnehour, which serve the primary mill for the production of billets. Each furnace has eight independently Controlled temperature zones, which are physically defined by baffle walls. It is fired by 32 pairs of regenerative ceramic burners using natural gas, with gas oil as the standby fuel. The burners are arranged in the sidewalls to fire across the width of the furnace. The walking beam mechanism, upper zone baffle walls, and charge and discharge door lintels are all water cooled.
Upper preheat Upper heat Upper heat Upper soak zone zone 1 zone 2 zone
Regenerative ' bumers
I
Regenerative 'burners
Fixed beam' I Moving beam
Approximate furnace width 6.4 m Effective furnace length 30.4 m Throughput capacity Maximum thermal input 186 GJlh
175 Vh (hot charged blooms)
Fig 10 Walking beam furnace at Aldwarke
The furnace feedstock is continuously cast blooms with a section size of 0.4 m by 0.56 m, each weighing 10.2 tonnes. The blooms are charged to the furnace at an average temperature of 700°C directly from the continuous casting plant or after being pre-heated from cold in soaking pits. Average discharge temperatures are in the region of 1,260"C.
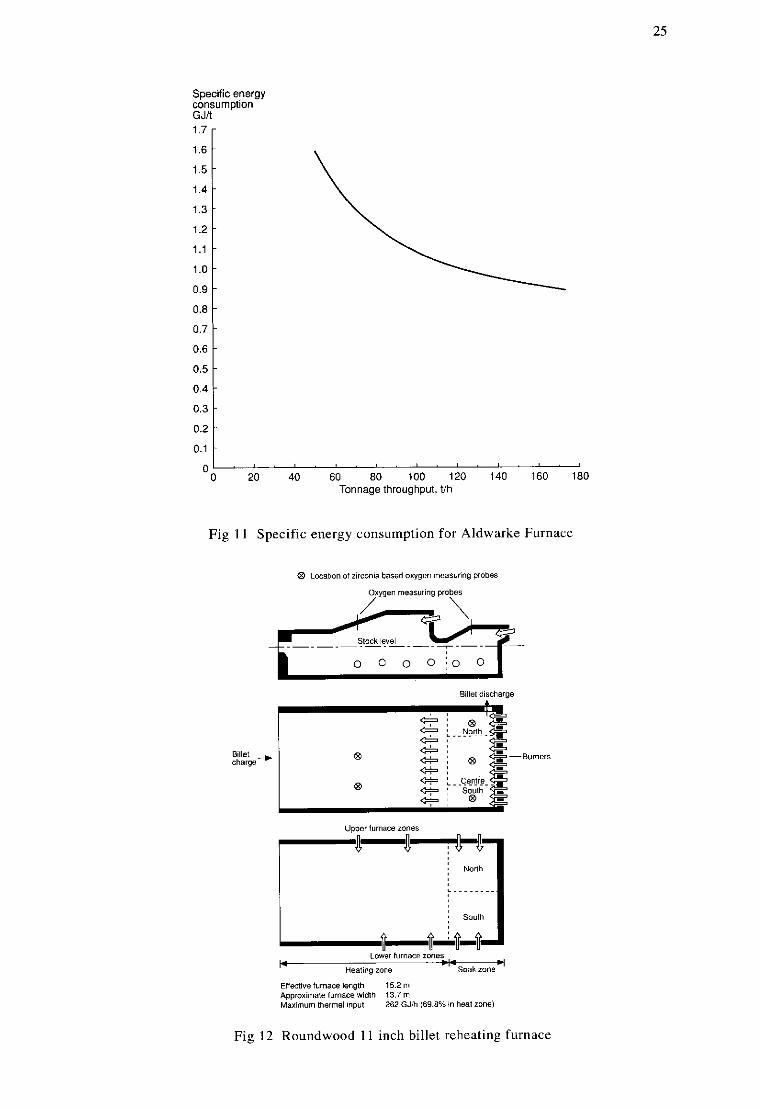
The furnaces were designed for optimum fuel efficiency, having the benefits of waste heat recovery and hot charging practices, and typically operate with combustion efficiencies of about 70%,. Productive specific energy consumption levels depend on the degree of insulation coverage of the water cooled components. At the maximum throughput rate, specific energy consumption was in the region of 0.9 GJ/tonne, as shown in Fig 11, which was compiled towards the end of a campaign. With good reheating furnace practice and using cold charged stock and with pre-heated air temperatures of around 450°C, the specific energy consumption level for furnaces of this type should he about 1.8 GJ/tonne.
6.3 Oxygen Trim Control on a Walking Beam Furnace at UES Roundwood 11 inch Mill
The Roundwood Mill at Rotherham Engineering Steels Ltd produces steel bar by reheating 140 mm square billets from cold to 1.200"C in a walking beam type furnace (Fig 12) with a designed throughput capacity of 110 tonne/hour. The furnace has six independently controlled temperature zones and uses natural gas with heavy fuel oil as an alternative during interruptions to gas supplies.
25
Specific energy consumption GJA 1.7
1 .6
1.5
1.4
1.3
1.2
1.1
1 .o 0.9
0.8
0.7
0.6
0.5
0.4
0.3
0.2
0.1
0 20 40 60 80 100 120 140 160 180
Tonnage throughput. Wh
Fig 1 1 Specific energy consumption for Aldwarke Furnace
Billet charge*
upper furnace zone5
L . . . . . . . .
South
Lower furnace zone5 w - ' - Soakzone' Heating zone
EnBctive furnace length 15.2 m Approximate furnace width 13.7 m Maximum thermal input 262 GJih 169.8% m heal zone)
Fig 12 Roundwood 1 1 inch billet reheating furnace

26
The conventional aidfuel ratio control system for the furnace was based on measurements of the combustion air flow to each zone. These values were supplied to a ratio control regulator that automatically adjusted the gas flow to give the ratio selected by the operator for a particular steel quality. Zonal interactions and the system's response to transient throughput conditions meant that the desired furnace atmosphere was difficult to achieve and maintain, even though manual adjustments were made regularly at the burners and the desired ratio was set at the control regulator. In order to avoid potential problems, it was normal to set individual burner ratios which would give an oxygen concentration at the upper limit of the tolerable range for a particular steel quality.
During 1989, five zirconia based oxygen measuring probes supplied by Laidlaw Drew & C O Ltd were installed in the furnace roof. These probes continuously monitor the oxygen concentration of the combustion products in each of the upper furnace zones. The measured value in the tonnage zone is used to trim the air/fuel ratio of the burners in this zone and thus maintain the set or desired oxygen level. The oxygen levels in the furnace before and after installation of the trim system are compared in Table 1.
Table 1 Average condition of furnace atmosphere
Furnace atmosphere sampling position
(heating zone)
Centre roof South roof Sidewall Flue
Condition of ~ Average oxygen concentration, %
conventionat airlfuet 1 Oxygen trim sample
measurement ration control 1 C 0 " t r O l
4.9 7.0 6.8 6.8
4.0 5.4 5.6 5.6
Specific energy consumption GJR
4.0 r
20 30 40 50 60 70 80 90 100 Tonnage throughput rate, tJh
Fig 13 Effect of oxygen trim control on specific energy consumption
27
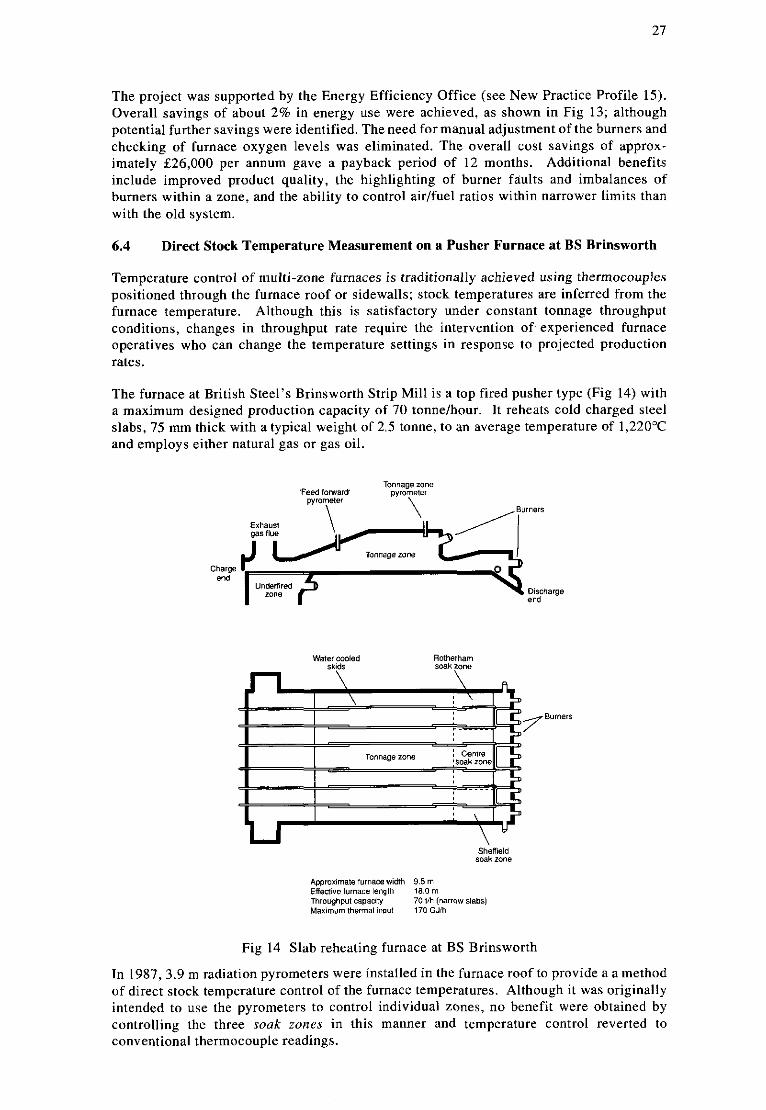
The project was supported by the Energy Efficiency Office (see New Practice Profile 15). Overall savings of about 2% in energy use were achieved, as shown in Fig 13; although potential further savings were identified. The need for manual adjustment of the burners and checking of furnace oxygen levels was eliminated. The overall cost savings of approx- imately S26,OOO per annum gave a payback period of 12 months. Additional benefits include improved product quality, the highlighting of burner faults and imbalances of burners within a zone, and the ability to control aidfuel ratios within narrower limits than with the old system.
6.4
Temperature control of multi-zone furnaces is traditionally achieved using thermocouples positioned through the furnace roof or sidewalls; stock temperatures are inferred from the furnace temperature. Although this is satisfactory under constant tonnage throughput conditions, changes in throughput rate require the intervention of experienced furnace operatives who can change the temperature settings in response to projected production rates.
The furnace at British Steel's Brinsworth Strip Mill is a top fired pusher type (Fig 14) with a maximum designed production capacity of 70 tonnehour. It reheats cold charged steel slabs, 75 mm thick with a typical weight of 2.5 tonne, to an average temperature of 1,220"C and employs either natural gas or gas oil.
Direct Stuck Temperature Measurement on a Pusher Furnace at BS Brimworth
Tonnage zone 'Feed toward pyrometter
\ wrometer \ ,B"mers
Exhaun gas fl"B
TDnnage mne
Discharge ena
Watercwied Rdhelham sklas Soak zone
I. 7 rBY'"e'*
U \ Shenlela
soak zone
Appmximate l ~ r n a ~ e widlh 9.5 m ElleOivetUmace length 18.0 m Throughput capadty Maximum thermal inout 170 GJlh
70 Wh (narrow slabs)
Fig 14 Slab reheating furnace at BS Brinsworth
In 1987, 3.9 m radiation pyrometers were installed in the furnace roof to provide a a method of direct stock temperature control of the furnace temperatures. Although it was originally intended to use the pyrometers to control individual zones, no benefit were obtained by controlling the three soak zones in this manner and temperature control reverted to conventional thermocouple readings.

28
Control of the tonnage zone using the direct stock temperature indicated energy savings of about 4.5% compared with to thermocouple control at the same tonnage throughput rate (see Fig 15). One of the system’s major benefits arose from the development of the ‘feed forward’ mode of control. A pyrometer at the charge end of the furnace is used to measure the temperature of slabs entering the tonnage zone, thus allowing the control system to respond accordingly. This control technique has improved the control response of the zone, improved the uniformity of product temperatures, and allowed higher throughput rates to be achieved. A further feature of the new control system is that less operator interference in adjusting furnace temperature settings in response to changes in throughput conditions is required. This has removed some of the variations in furnace performance arising from differences in operating procedures between the shift crews.
Specific energy consumption GJA
- Direct stock temperature control
--- Thermocouple control
1.0‘ 100 200 300 400 500 600
Tonnage throughput, ffshift
Fig 15 Effect of temperature control methods on specific energy consumption
The project was supported by the Energy Efficiency Office (see Energy Efficiency Demonstration Scheme Profile 271). Total annual savings of approximately f24,000 were achieved giving a simple pay back on installation of about ten months.
6.5
A computer-controlled furnace management system has been installed at two furnaces in the coil plate mill at British Steel’s Teesside Works. The furnaces (Fig 16) are top and bottom fired pusher types and are used to reheat cold charged steel slabs. They were originally controlled by manually adjusting zone temperatures.
The computer system tracks material through the furnace, taking account of slab sizes and desired heating requirements. An ‘on-line’ mathematical model calculates the heat content of each slab in the furnace and this information is used to automatically adjust the furnace controls to give the ideal slab heat content profiles. Optimum steel temperatures and minimum energy use are therefore achieved.
The system has operated for several years with typical energy savings for both furnaces of 15%. This is equivalent to an annual cost saving of about f400,OOO.
Computer-Controlled Furnace Management at British Steel plc

29
Effective Furnace Length 30.5 m Maximum Thermal Input 450 GJIh Throughput Capacity 185 tJh
Burners
Elfective Furnace Length 29.4 m Maximum Thermal Input 600 GJlh Throughput Capacity 220 Wh
Fig 16 Slab reheating furnaces at British Steel’s Teesside works
6.6 Variable Speed Drives on a Large Continuous Furnace Combustion Air Fan a t Cardiff Rod Mill
The furnace at Cardiff Rod Mill is a walking beam type furnace that is used to reheat steel billets. Under the original system the combustion air fan ran at a continuous speed and the combustion air requirements were controlled by a pneumatically operated butterfly valve connected to the combustion air fan inlet. As the air flow fluctuated due to controlled changes in the burner firing rates, the system air pressure varied accordingly. In order to maintain a fixed system pressure, it was necessary to adjust the position of the butterfly valve while the fan continued to run at a fixed speed.
A variable speed drive system was fitted to the 450 kW combustion air fan motor to replace the butterfly valve in controlling the combustion air requirement. This allowed the fan speed to be adjusted in relation to the combustion air demand, and produced savings in electricity use of about 48%. The project was supported by the Energy Efficiency Office (see Good Practice Case Study 115) and gave an annual cost saving of approximately f21,000, giving a 16 month payhack on the initial project costs.

30

31
APPENDIX 1
GLOSSARY OF TERMS
Burner Quads
Calorific Value (CV)
Cobbles
Down-shift
Excess Combustion Air or Excess Air
Flammability Limits
Furnace Combustion Efficiency or Combustion Efficiency
Furnace Efficiency
Heat Release
Ignition Temperature
Latent Heat
-
- refractory components surrounding the burner nozzle
the heat liberated by the complete combustion of a unit quantity of fuel. The gross calorific value is the total heat available after the water formed as a combustion product has condensed. The net calorific value signifies that the water formed is still a vapour.
- occur when steel being rolled in the mill becomes entangled in the mill rolls or misses the gap between the rolls and buckles and/or deforms.
a period, usually more than a manned shift, when there is no production and the furnace is maintained at a lower temperature than normal.
the air, above the stoichiometric requirement, which is supplied to assist the combustion of a fuel.
-
-
- a fuel will not burn if there is too little or too much oxygen in the aidfuel mixture. There is therefore an upper (or fuel lean) limit and a lower (or fuel rich) limit between which combustion can he sustained.
the proportion of the energy in the fuel (based on its calorific value) used to satisfy all the heating requirements and energy losses associated with the furnace excluding the heat content of the exhaust gases. It is usually expressed as a percentage.
the amount of energy transferred to the stock in the furnace (excluding the energy released due to the formation of scale). It is expressed as a percentage of the fuel energy supplied to the furnace.
the proportion of fuel energy supplied to the furnace that does not leave the furnace in the exhaust gases. It ik the sum of all the energies put into the stock, furnace structure, etc and the energy losses that occur within the furnace that are necessary to satisfy process requirements.
the temperature at which the mixture of fuel gas or vapour and air or oxygen will maintain combustion.
the heat required to change the state of a unit mass of a substance from one phase to another without change of temperature. It has units of joules/kg (J/kg). The specific latent heat of fusion is the heat required to convert 1 kg of solid at its melting point into a liquid at the same temperature. The specific latent heat of vaporisation is the heat required to convert 1 kg of liquid at its boiling point into a vapour at the same temperature.
-
-
-
-
-
Light-up - the period when the furnace temperature is being raised in preparation for production e.g. following a period when the burners have been turned off.
a refractory which is formed in place, and is not made of preformed bricks or profiles.
Monolithic Refractories -
32
Nozzle Mix Burners
Oxygen Enrichment
Premix Burners
Sankey Diagram
Sensible Heat
Stoichiometric
Sub-Stoichiometric
Skids
Soak Zone
Specific Energy Consumption -
Stock Recuperation
Thermal Conductivity
Thermal Spalling
Tonnage Zone
Turn-down Ratio
a class of burner in which combustion take place in a refractory tunnel or quad beyond the combustion air and fuel inlets.
the practice of adding oxygen to combustion air to increase its oxygen content. Typically between the normal atmospheric ratio (21%) and 26%.
a class of burner in which the combustion air and fuel are mixed to varying degrees before they leave the burner.
a graphical representation of the energy supplied to and taken out of a system. The inputs and outputs are represented by streams whose widths are proportional to the amount of energy.
the heat absorbed or released by a substance moving between two temperatures without changing its physical state.
the exact proportions in which substances react. For combustion, the theoretical minimum amount of air or oxygen required to completely consume the fuel.
when there is insufficient air or oxygen to allow complete combustion of the fuel.
horizontal longitudinal beams or rails in reheating furnaces that support the stock. Skids can be water cooled and, in top and bottom fired furnaces, supported by an arrangement of vertical and crosswise beams.
the final zone before discharge where the stock reaches its final processing temperature uniformly.
the amount of energy used to reheat a unit weight (usually one tonne) of steel.
a technique whereby the exhaust gases leave the furnace at the charge end, thus enabling their waste energy to pre-heat the stock.
the physical property of a material that describes the rate of flow of heat through a unit surface area of a material. The SI unit is watts per metre Kelvin (W m-' K-I).
the splintering or breaking up of the surface of refractory bricks caused by subjecting the surface to excessive or rapidly changing temperatures.
the main heating zone, where the most rapid rise in stock temperature takes place.
the ratio between the heat output of a burner on its highest and lowest settings.

33
6.0 7.0 8.0
APPENDIX 2
TECHNICAL DATA
A2.1 Combustion of Natural Gas
Table 2 shows the heat content of the combustion products of natural gas for a range of temperatures and compositions. The table relates to the gross energy content of the fuel, which is 40.74 MJ/m3 stp (0°C). The latent heat of the water content of the combustion products is 4.01 MJ/m3 and this is included in the gross energy content of natural gas and the combustion products
9.0
Table 2 Combustion of natural gas
~~ ~~
50 100 150 200 250 300 350 400 450 500 550 600 650 700 750 800 850 900 950 1000 1050 1100 1150 1200 1250 1300 1350
____ ____
0.0 0.8 1.7 2.5 3.4 4.3 5.2 6.1
18.7 18.0 I 17.3 1- 1 6 5 15.7 1 14.9 1 14.1 1 13.3 I 12.5 11.6 ~
Percentage CKBSS combustion air
7.0 8.0
0.0
11.7 13.5 15.4 17.3 19.2 21.1 23.1 25.1 27.1 29.1 31.2 33.2 35.3 37.4 39.6 41.7 43.9 46.1 48.3 50.6 52.8 55.1 57.4 59.7 62.0 64.3 66.6
__
____
i 9.6 9.3 8.9 8.5 8.1 7.7 7.3 6.9
4.5
11.8 13.7 15.6 17.6 19.5 21.6 23.6 25.6 27.7 29.8 32.0 34.1 36.3 38.5 40.7 42.9 45.2 47.5 49.8 52.1 54.4 56.8 59.1 61.5 63.9
____ ____
6.4 6.0
9.5
11.9 13.8 15.8 17.9 19.9 22.0 24. I 26.3 28.4 30.6 32.8 35.1 37.3 39.6 41.9 44.3 46.6 49.0 51.4 53.8 56.2 58.6 61.1 63.6 66.1
15.0 1 21.1
11.9 12.0 14.0 14.2 16.1 18.2 20.4 22.5 24.7 27.0 29.2 31.5 33.8 36.2 38.5 40.9 43.3 45.7 48.2 50.6 53.1 55.6 58.2 60.7 63.3 65.8 68.4
66.3 ~ 68.6 71.0 w. 7.3:’-
16.4 18.6 20.9 23.1 25.4 27.8 30.1 32.5 34.9 37.4 39.8 42.3 44.8 47.4 49.9 52.5 55.1 57.7 60.4 63.0 65.7 68.4 71, l 73,8 76.6 ____ ____
28.1
12.1 14.4 16.7 19.0 21.4 23.8 26.2 28.7 31.1 33.6 36.2 38.7 41.3 43.9 46.6 49.2 51.9 54.6 57.3 60. I 62.R 65.6 68.4 71.2 74.1 76.9 79.8
____ ~ . ~ . ~~
35.9 ~~ ____
12.3 14.7 17.1 19.5 22.0 24.5 27.1 29.7 32.3 34.9 37.6 40.3 43.0 45.7 48.5 51.3 54.1 57.0 59.8 62.7 65.6 68.6 71.5 74.5 77.5 80.5 83.5
44.9
12.4 14.9 17.5 20.1 22.7 25.4 28.1 30.8 33.6 36.4 39.2 42.0 44.9 47.8 50.7 53.7 56.7 59.7 62.1 65.8 68.8 71.9 75.1 78.2 81.3 84.5 87.7
____ ____ 55.3
12.6 15.3 18.0 20.7 23.5 26.4 29.2 32.1 35.1 38.0 41.0 44.1 47. I 50.2 53.3 56.5 59.6 62.8 66.0 69.3 72.5 75.8 79.1 82.5 85.8 89.2 92.5
____
____ .~
67.4 ~ ... ____
12.8 15.6 18.5 21.5 24.5 27.5 30.6 33.7 36.8 40.0 43.2 46.4 49.7 53.0 56.3 59.7 63.1 66.5 69.9 73.4 76.9 80.4 83.9 87.4 91.0 94.6 98.2
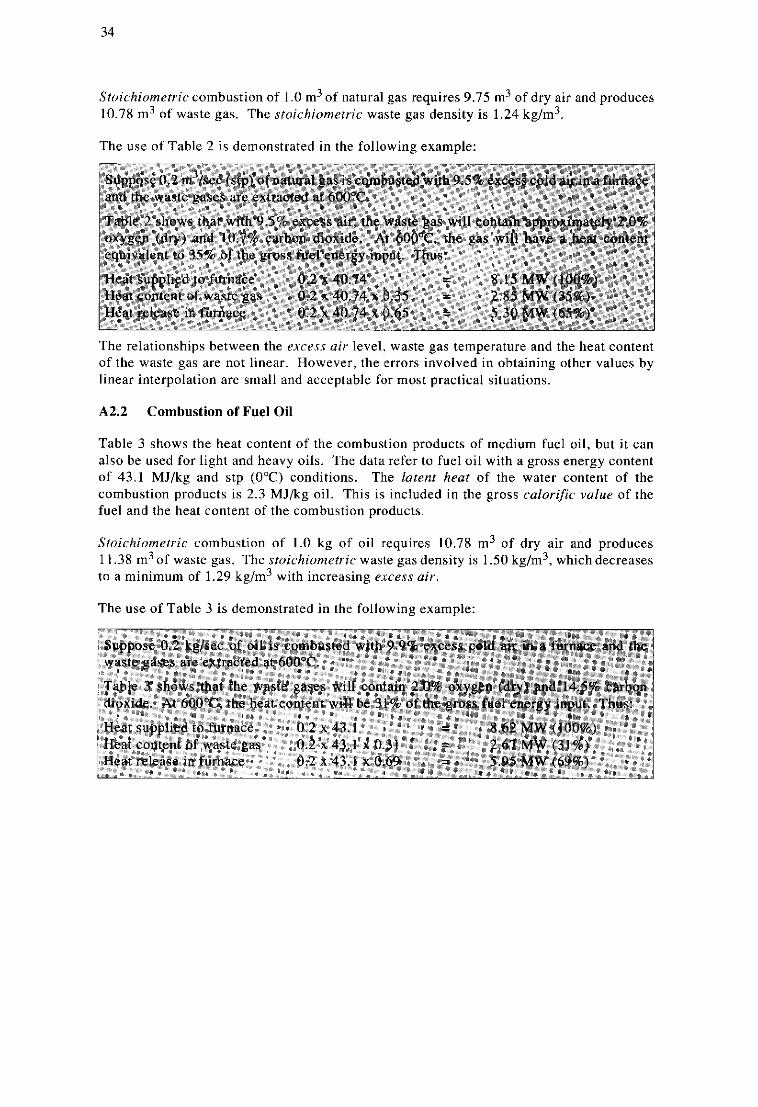
34
Stoichiornetric combustion of 1.0 m3 of natural gas requires 9.75 m3 of dry air and produces 10.78 m3 of waste gas. The sroichiometric waste gas density is 1.24 kg/m3.
The use of Table 2 is demonstrated in the following example:
The relationships between the exce.ss air level. waste gas temperature and the heat content of the waste gas are not linear. However, the errors involved in obtaining other values by linear interpolation are small and acceptable for most practical situations.
A2.2 Combustion of Fuel Oil
Table 3 shows the heat content of the combustion products of medium fuel oil, but it can also be used for light and heavy oils. The data refer to fuel oil with a gross energy content of 43.1 MJ/kg and stp (0°C) conditions. The Iarent heat of the water content of the combustion products is 2.3 MJ/kg oil. This is included in the gross calorific vaIue of the fuel and the heat content of the combustion products.
Sfoichiometric combustion of 1.0 kg of oil requires 10.78 m3 of dry air and produces 1 1.38 m3 of waste gas. The sfoichiornetric waste gas density is 1.50 kg/m3, which decreases to a minimum of 1.29 kg/m3 with increasing excess air.
The use of Table 3 is demonstrated in the following example:
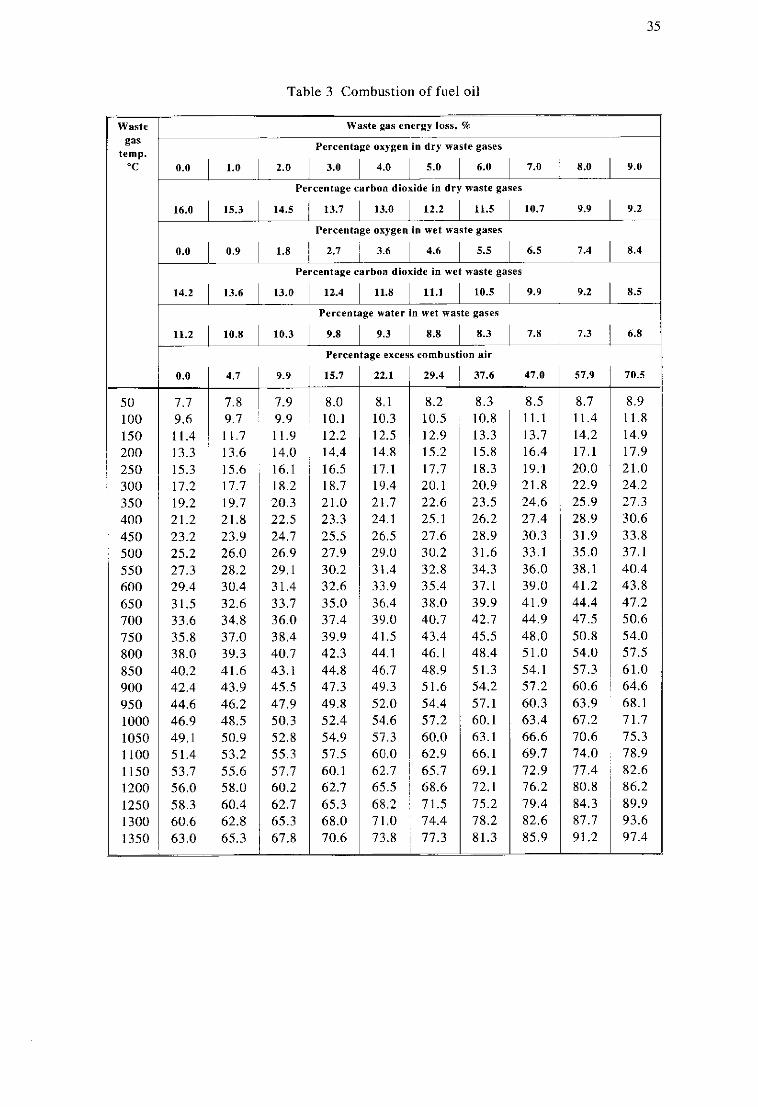
35
5.0 3.0 4.0 __
Table 3 Combustion of fuel oil
6.0 7.0 8.0 1 9.0 -~
50 100 150 200 250 300 350 400 450 500 550 600 650 700 750 800 850 900 950 1000 1050 1100 1150 1200 1250 1300 1350
16.0 15.3 14.5 13.7 13.0 12.2 11.5
waste gas energy loss, w
10.7 9.9 9.2
0.0 0.9 1.8 2.7 ~ 3.6 4.6 1 5.5 L 6.5 7.4
0.0
7.7 9.6 11.4 13.3 15.3 17.2 19.2 21.2 23.2 25.2 27.3 29.4 31.5 33.6 35.8 38.0 40.2 42.4 44.6 46.9 49.1 51.4 53.7 56.0 58.3 60.6 63.0
__
8.4
4.7 1 9.9
14.2 13.6 13.0 12.4 11.8 11.1 10.5 9.9 9.2
7.8 1 7.9 9.7 , 9.9
8.5
11.7 13.6 15.6 17.7 19.7 21.R 23.9 26.0 28.2 30.4 32.6 34.8 37.0 39.3 41.6 43.9 46.2 48.5 50.9 53.2 55.6 58.0 60.4 62.8 65.3
11.2 10.8 10.3 9.8 9.3 8.8
11.9 14.0 16.1 18.2 20.3 22.5 24.7 26.9 29.1 31.4 33.7 36.0 38.4 40.7 43.1 45.5 47.9 50.3 52.8 55.3 57.7 60.2 62.7 65.3 67.8
8.3 7.8 7.3 6.8 ~~
15.7
8.0 10.1 12.2 14.4 16.5 18.7 21.0 23.3 25.5 27.9 30.2 32.6 35.0 37.4 39.9 42.3 44.8 47.3 49.8 52.4 54.9 57.5 60.1 62.7 65.3 68.0 70.6
22.1
8.1 10.3 12.5 14.8 17.1 19.4 21.7 24.1 26.5 29.0 31.4 33.9 36.4 39.0 41.5 44.1 46.7 49.3 52.0 54.6 51.3 60.0 62.7 65.5 68.2
29.4 ~ 37.6 47.0
8.2 10.5 12.9 15.2 17.7 20.1 22.6 25.1 27.6 30.2 32.8 35.4 38.0 40.7 43.4 46.1 48.9 51.6 54.4 57.2 60.0 62.9 65.7 68.6 71.5
71.0 74.4 73.8 77.3
8.3 10.8 13.3 15.8 18.3 20.9 23.5 26.2 28.9 31.6 34.3 37.1 39.9 42.7 45.5 48.4 51.3 54.2 57.1 60.1 63.1 66.1 69.1 72.1 75.2 78.2 81.3 __ ~
8.5 11.1 13.7 16.4 19.1 21.8 24.6 27.4 30.3 33.1 36.0 39.0 41.9 44.9 48.0 51.0 54.1 57.2 60.3 63.4 66.6 69.7 72.9 76.2 79.4 82.6 85.9
57.9
8.7 11.4 14.2 17.1 20.0 22.9 25.9 28.9 31.9 35.0 38.1 41.2 44.4 47.5 50.8 54.0 57.3 60.6 63.9 67.2 70.6 74.0 77.4 80.8 84.3 87.7 91.2
70.5
8.9 11.8 14.9 17.9 21.0 24.2 27.3 30.6 33.8 37.1 40.4 43.8 47.2 50.6 54.0 57.5 61.0 64.6 68.1 71.7 75.3 78.9 82.6 86.2 89.9 93.6 97.4

36
A2.3 Heat Content of Gases
The heat content of a gas mixture, e.g. combustion products, can be calculated from the following equations, given the composition and the total volume or flow. The sensible heat (H) is expressed in MJ/m3 stp (0°C) and the gas temperature (Tj in "C.
(a) Carbon Dioxide
H - - - 0.7533 x IO-'+ T (0.16951 x 10⁻² + T (0.7444 x 10⁻⁶ - T (0.2721 x 10⁻⁹ - T (0.4069 x l0-I'))))
(b) Nitrogen
H - - - 0.6501 x in-6 + T (0.12691 x in-2 + T (0.1478 x iw6 - T (0.183 x io-'O + T (0.6606 ~ n - ' ~ ) j j j
(c) OxEen
H - - 0.335 x 1 0 . ~ + T (0.12713 x + T (0.2963 x i w 6 - T (0.1266 x 1 0 . ~ - T (0.3261 x 10.' - T (0.334 x 10- l~) ) ) ) )
0.9486 x 1 0 . ~ + T (0.14933 x i w 2 + T (0.1316 x 1 0 . ~ + T (0.1713 x 1 0 . ~ - T (0.897 x 1 0 - l ~ - T (0.1424 x io-I6)j)))
(d) Water Vapour
H - -
Latent heat of vaporisation at 0°C = 2.0002 MJ/m3
The use of these equations is demonstrated in the following example:

LE
38
Table 4 Heat content of stoichiometric air
Air temperature "C
~ ~
20 40 60 80 100 120 140 160 180 200 220 240 260 280 300 320 340 360 380 400 420 440 460 480 500 520 540 560 580 600 620 640 660 680 700 720 740 760 780 800 820 840 860 880 900 920 940 960 980 I000
Heat content of air, % gross CV fuel
Natural gas
0.6 1.2 1.8 2.5 3.1 3.7 4.3 5.0 5.6 6.2 6.9 7.5 8.2 8.8 9.5 10.1 10.8 11.5 12.1 12.8 13.4 14.1 14.8 15.5 16.1 16.8 17.5 18.2 18.9 19.6 20.3 21.0 21.7 22.4 23.1 23.8 24.5 25.2 25.9 26.6 27.3 28.0 28.7 29.5 30.2 30.9 31.6 32.4 33.1 33.8
-___
Fuel oil
0.6 1.3 1.9 2.6 3.2 3.9 4.5 5.2 5.8 6.5 7.2 7.8 8.5 9.2 9.9 10.5 11.2 11.9 12.6 13.3 14.0 14.7 15.4 16.1 16.8 17.5 18.2 19.0 19.7 20.4 21.1 21.8 22.6 23.3 24.0 24.7 25 .5 26.2 27.0 27.7 28.4 29.2 29.9 30.7 31.4 32.2 32.9 33.7 34.5 35.2

39
1200
1100
1000
900
A2.5 Enthalpy of Steel
Fig 17 shows the heat content of mild steel and stainless steel. In practice, there can be a significant temperature difference within the steel at discharge and that this may need to be taken into account when calculating the heat content. In most cases, it is approximately correct to calculate the heat content at the mean bulk temperature of the steel. The charge temperature and the heat release due to the formation of scale also need to be taken into account.
-
-
-
Enthalpy MJR
A2.6 Heat Loss from Surfaces
The total heat loss from a surface by radiation and convection is shown in Table 5 . Both are expressed in kW/m2.
Heat loss by radiation is based on the equation:
Heat loss by radiation = 5.67 x 10.'' x E x T4
where E is the emissivity of the surface and T is the absolute temperature. At absolute zero, i.e. -273"C, the heat loss by radiation is zero. The net radiation between the surface and its surroundings is the difference in the calculated heat loss.
Heat loss by convection is based on the equation:
Heat loss by convection - - 1.925 x 10⁻³ x t '.25
where t is the difference in temperature between the surface and ambient air
No convection occurs when the temperature difference is 0°C. This equation is valid for vertical surfaces; a correction factor is needed for upward and downward facing surfaces.
The heat loss values given in Table 5 have been calculated on the basis of on an assumed surface emissivity of 0.8. This is satisfactory for most practical purposes.

40
80 0.70 90 0.56 100 I .02 110 1.20 I20 I .38 130 1.57 140 1.78 I50 2.00 160 2.22 170 , 2.46 180 2.1 1 I90 2.98
~ 200 3.25 210 3.55 220 3.85
Table 5 Heat loss from a surface
Heat loss, kW/m Heat loss, kW/m-
Vertical Horizontal face V e r t i c a l H o r i z i n t a l face
0.59 0.80 0.59 0.49 0.67 0.72 0.98 0.74 0.62 0.84 0.85 1.17 0.90 0.76 1.02 I .oo 1.36 1.07 0.90 1.22 1.16 1.5? I .25 1.06 1.42 1.33 1.79 1.45 , 1.23 1.64 1.50 2.02 I .65 1.40 1.86 1.69 2.26 I .86 1.59 2.10 1.89 2.5 I 2.09 1.78 2.35 2.10 2.78 2.33 1 1.99 2.62 2.32 3.06 2.58 2.21 2.89 2.55 3.35 2.84 2.44 3.18 2.79 3.65 3.12 2.69 I 3.48 3.05 3.97 , 3.40 2.94 3.80 3.32 4.30 3.71 3.21 ' 4.13
face 1 -1 I Downward Upward face
230 4.17 3.61 4.65 , 4.03 240 4.50 3.91 5.01 4.36
3.50 4.48 3.80 4.84
250 4.85 4.22 5.39 4.71 4.11 5.21 260 5.22 4.55 ' 5.78 5.07 , 4.44 5.61 270 ~ 5.60 4.90 6.19 5.45 4.79 280 6.00 5.26 6.62 5.85 5.15 290 ' 6.41 5.65 7.07 6.26 5.53
6.02 6.44 6.89
300 6.04 7.53 , 6.70 7.30 8.02 7.15
320 7.77 8.52 7.62 310
330 8.26 7.35 9.04 8.1 I
5.93 7.35 6.35 7.84 6.78 8.34 7.24 8.86
340 8.78 7.83 350 9.3 1 8.33
9.59 8.62 7.71 9.40 10.16 9.16 8.21 9.97
360 , 9.87 8.85 10.74 10.56 10.45 11.05 I I .68 12.33
~
11.17 9.95 10.54 I 1.52 12.46 11.15 12.17 11.03 13.14
~~ ~ ~ ~ _ _ _ _ _

c
.
Energy Efficiency Office D E C I B T Y E N T O F l l l E E N Y I I O N Y E Y I